fyp report-part2 140411 - utar institutional...
TRANSCRIPT

MULTICHANNEL TEMPERATURE
LOGGER
STEPHEN LEE CHIN WEY
A project report submitted in partial fulfilment of the
requirements for the award of Bachelor of Engineering
(Hons.) Electrical and Electronic Engineering
Faculty of Engineering and Science
Universiti Tunku Abdul Rahman
May 2011

ii
DECLARATION
I hereby declare that this project report is based on my original work except for
citations and quotations which have been duly acknowledged. I also declare that it
has not been previously and concurrently submitted for any other degree or award at
UTAR or other institutions.
Signature : _________________________
Name : __STEPHEN LEE CHIN WEY
ID No. : __08 UEB 07845___________
Date : __06 MAY 2011 _________

iii
APPROVAL FOR SUBMISSION
I certify that this project report entitled “MULTICHANNEL TEMPERATURE
LOGGER” was prepared by STEPHEN LEE CHIN WEY has met the required
standard for submission in partial fulfilment of the requirements for the award of
Bachelor of Engineering (Hons.) Electrical and Electronic Engineering at Universiti
Tunku Abdul Rahman.
Approved by,
Signature : _________________________
Supervisor : Mr. Ng Choon Boon
Date : _________________________

iv
The copyright of this report belongs to the author under the terms of the
copyright Act 1987 as qualified by Intellectual Property Policy of University Tunku
Abdul Rahman. Due acknowledgement shall always be made of the use of any
material contained in, or derived from, this report.
© 2011, Stephen Lee Chin Wey. All right reserved.

v
Specially dedicated to
my beloved family and friends

vi
ACKNOWLEDGEMENTS
I would like to thank everyone who had contributed to the successful progress of this
project. I would like to express my gratitude to my research supervisor, Mr. Ng
Choon Boon for his invaluable advices, guidance and his enormous patience
throughout the progress of the research.
In addition, I would also like to express my gratitude to my loving family for
giving me encouragement and support in the research, my teammate, Lim Chiang
Wei for his help, ideas, and support, and not to forget my friends who had helped and
given me encouragement as well as new ideas throughout the research.

vii
MULTICHANNEL TEMPERATURE
LOGGER
ABSTRACT
Digital data logger is a standalone device that can read electrical signals from
measurement devices and store the data in internal memory for later download to a
computer. A microcontroller-based multichannel temperature logger is developed to
measure and record the temperature from up to four channels, capable of sensing
temperature with a range of 0 °C up to 400 °C, depending on the type of sensor
connected. The microcontroller receives the analogue voltage from temperature
sensor and conversion to digital data is performed. The temperature reading is
displayed on an LCD and stored in a removable memory card so that it can be
retrieved later on a computer. The measured data will be stored at the intervals of 10
seconds, 30 seconds, 1 minute, or 5 minutes, at user’s preference. The logger can
also send out a short message (SMS) using GSM modem to a predefined mobile
phone number whenever the temperature reading rises above the preset value. The
system uses 3 microcontrollers interconnected using serial peripheral interfaces,
LM35DZ and K-type thermocouple as the temperature sensors, 4×4 matrix keypad,
16×2 dot matrix LCD, mobile phone for GSM modem, DS1307 for real time clock
chip, and SD card. Temperature sensors are tested to prove both have the same
properties for the output voltage sensitivity before applied to the system. The
multichannel temperature logger is successfully developed and functions accordingly.
The logger can be further improved to allow the user to customize the file name as
well as the file format selection and add alternative alert system into the device such
as voice call. It has potential to become a low cost temperature logger for laboratory
or factory use if the hardware is further developed.

viii
TABLE OF CONTENTS
DECLARATION ii
APPROVAL FOR SUBMISSION iii
ACKNOWLEDGEMENTS vi
ABSTRACT vii
TABLE OF CONTENTS viii
LIST OF TABLES x
LIST OF FIGURES xi
LIST OF SYMBOLS / ABBREVIATIONS xiv
LIST OF APPENDICES xv
CHAPTER
1 INTRODUCTION 1
1.1 Background 1
1.2 Aims and Objectives 2
1.3 Motivation 3
1.4 Organization of chapters 4
2 LITERATURE REVIEW 5
2.1 Data Logging 5
2.1.1 Chart Recorders 5
2.1.2 Data Logger 6
2.2 Temperature Sensor 9
2.3 Commercial Temperature Logger 12

ix
3 METHODOLOGY 17
3.1 System Overview 17
3.2 Temperature Sensor 19
3.2.1 LM35DZ Temperature Sensor 23
3.2.2 Thermocouple K-Type 24
3.2.3 AD595 Thermocouple Amplifiers 25
3.2.4 Temperature Conversion and Display 27
3.3 GSM Modem 28
3.3.1 Sony Ericsson T610i 30
3.3.2 AT Command 31
3.3.3 Short Messaging Service Modes 32
3.3.4 Implementation of GSM Modem 33
3.4 Real Time Clock DS1307 36
3.4.1 DS1307 Real Time Clock 37
3.4.2 DS1307 Implementation 39
4 RESULTS AND DISCUSSIONS 47
4.1 Temperature Sensor Testing 47
4.2 GSM Modem Testing 53
4.3 Real Time Clock Testing 54
5 CONCLUSION AND RECOMMENDATIONS 57
5.1 Summary 57
5.2 Recommendations 58
REFERENCES 59
APPENDICES 62

x
LIST OF TABLES
TABLE TITLE PAGE
2.1 General Features of Temperature Logger for
Different Target User. 15
4.1 Output Voltage of Temperature Sensors at
Different Temperature Values. 49

xi
LIST OF FIGURES
FIGURE TITLE PAGE
2.1 Strip Chart Recorders. 6
2.2 Circular Chart Recorders. 6
2.3 Thermocouple Measuring Circuit. 10
2.4 Film Type Resistor Temperature Detectors. 11
2.5 Thermistor with Encapsulation and without
Encapsulation. 12
2.6 HW group HWg-Tg11 GSM Temperature
Datalogger. 12
2.7 Lascar EL-USB-TC-LCD Thermocouple Logger. 13
2.8 Extech 3-Channel Temperature Logger. 13
2.9 Omega HH314A. 14
2.10 Madge Tech TC110-2MB. 15
3.1 System Block Diagram. 18
3.2 Microcontroller Connection Schematic Diagram. 21
3.3 Hardware Connection of LM35DZ Temperature
Sensor. 22
3.4 Hardware Connection of AD595 Thermocouple
Amplifier with K-Type Thermocouple. 22
3.5 LM35DZ Temperature Sensor TO-92 Package. 23
3.6 Thermocouple K-Type Welded Tip Glass Fibre. 25

xii
3.7 Programme Flow Diagram for Temperature
Measurement. 26
3.8 Analogue-to-Digital Conversion Code for
Temperature Conversion and Reading Display. 27
3.9 Connection between Mobile Phone and
Microcontroller. 29
3.10 Sony Ericsson T610i Mobile Phone. 30
3.11 DRS-11 Serial Data Cable. 31
3.12 AT Command Using Text Mode. 32
3.13 AT Command Using PDU Mode. 32
3.14 Programme Flow Diagram for Sending Short
Message. 33
3.15 AT Commands Predefined in the Microcontroller. 34
3.16 UART Initialisation Code of Microcontroller. 34
3.17 Temperature Reading Comparison Code. 35
3.18 Schematic Diagram of Real Time Clock DS1307. 36
3.19 DS1307 Real Time Clock. 38
3.20 Wiring Diagram between Microcontroller and Real
Time Clock. 39
3.21 Real Time Clock Flow Chart. 39
3.22 RTC DS1307 Configuration. 41
3.23 RTC DS1307 Time Reading Code. 42
3.24 RTC DS1307 Time Setting Code. 43
3.25 RTC DS1307 Date Reading Code. 44
3.26 RTC DS1307 Date Setting Code. 45
4.1 Setup for Thermocouple and LM35DZ Sensors to
Measure Water Temperature. 48
4.2 Sensors Reading on Oscilloscope at 50 °C. 48
xiii
4.3 LM35DZ Output Voltage, V versus Temperature,
T 49
4.4 Thermocouple K-Type Output Voltage, V versus
Temperature, T 50
4.5 Projected LM35DZ Output Voltage, V versus
Temperature, T 51
4.6 Projected Thermocouple K-Type Output Voltage,
V versus Temperature, T 51
4.7 Temperature Readings from the system and
thermometer at 75 °C. 52
4.8 Temperature Readings from the system and
thermometer at 66 °C. 52
4.9 User Keyed-in Mobile Number on LCD Display. 53
4.10 Short Messages Sent by the System for All
Channels. 54
4.11 Display Resets when Reset Button is Pressed. 55
4.12 “Minute” Column Incremented when Increment
Button is Pressed. 55
4.13 LCD Displays Current Date and Time from
DS1307 Device 56

xiv
LIST OF SYMBOLS / ABBREVIATIONS
LCD liquid crystal display
RTD resistor temperature detector
EEPROM Electrically Erasable Programmable Read-Only Memory
GSM Global System for Mobile Communications
SIM Subscriber Identity Module
USB Universal Serial Bus
GPRS general packet radio service
UMTS Universal Mobile Telecommunications System
HSDPA High-Speed Downlink Packet Access
SMS Short Message Service
MMS Multimedia Messaging Service
ADC analogue-to-digital converter
RTC Real time clock

xv
LIST OF APPENDICES
APPENDIX TITLE PAGE
A Project Planning 62

CHAPTER 1
1 INTRODUCTION
1.1 Background
A digital data logger is a standalone device that can read electrical signals and store
the data in internal memory for later download to a computer. It is placed and left
unattended and does the task of measuring and recording physical or electrical
parameters over a period of time and it can be connected to various types of sensors.
A wide range of devices are available to measure and log data, ranging from basic,
single measurement devices to complex systems with built-in analysis functions and
displays.
One of the primary benefits of using digital data loggers is the ability to
automatically collect data on a 24-hour basis. Upon activation, data loggers are
typically deployed and left unattended to measure and record information for the
duration of the monitoring period. This allows for a comprehensive, accurate picture
of the environmental conditions being monitored. Besides, they can operate
independently of a computer, unlike many other types of data acquisition devices.
Data is normally collected in non-volatile memory for later download to a computer.
The computer does not need to be present during the data collection process. This
makes them ideally suited for applications requiring portability.
Measuring temperature of an environment or an object plays an important
part in determining whether a device or process works in its’ ambient temperature.
This is because devices or process, specifically the temperature sensitive may turn

2
inefficient when the temperature rises or drops. For instance, the temperature of a
cold storage must be consistently low to prevent the food stored from rotting and
subsequently results in food-borne illness and the process of assembling integrated
chip must performed in air-conditioned temperature and a slightly higher temperature
may cause degradation to the chip assembled. Other than that, a device or process in
high temperature may prone to excessive frictions, wear, and losses and regular
maintenance is needed at a period based on the measured temperature. Hence,
temperature data logger is required to continuously measure and records the
temperature of the environment for monitoring purpose. Besides, it also can replace
human force to measure in a high temperature field, where high temperature
environment may pose hazard to the human.
Temperature logger starts to replace the conventional chart or strip chart
recorders because data can be collected and analysed in a more convenient way. The
LCD display on the logger offers the local display of the traditional paper chart
recorder and data is stored in the electronic storage such as random access memory
(RAM). Implementing electronic storage to store the logged data offers more
flexibility and lower cost as unused data or analysed data in the memory can be
erased and replaced with the new data, unlike the conventional recorder as paper
charts can be used only once and constant replacement is needed.
1.2 Aims and Objectives
This project aim is to develop a microcontroller-based multichannel temperature
logger which is able to store data in a Secure Digital (SD) card and sends a SMS to
alert the user upon the temperature exceed the limit set by the user. A built-in keypad
is provided for the user to set the channels used, the temperature limit, the mobile
number, and to confirm the information inserted. An LCD display serves to display
the selected channel, the value keyed-in by the user, and also the temperature
readings from the sensors.

3
The device developed is able to continuously measure the temperature from
up to four channels from 0 °C up to 400 °C and display the reading on a LCD. The
microcontroller receives the analogue voltage from temperature sensor and
conversion to digital data is performed. The measured data will be stored in a
removable memory card at the intervals of 10 seconds, 30 seconds, 1 minute, or 5
minutes, at user’s preference. The data collected is converted to the format which is
readable in Windows based computer. It also sends out a short message using GSM
modem whenever the temperature reading rises above the preset value.
The development of multichannel temperature logger is equally divided
between 2 teammates, where the tasks of developing the system to send short
messages, counts the time using real time clock for data logging, and measuring and
analysing the environment temperature modules are assigned to the author.
Meanwhile, the author’s teammate, Lim Chiang Wei is assigned with the
development of microcontrollers’ communication, keypad and LCD interfacing as
well as the data writing to memory card modules. The author and his teammate then
work together to integrate all the module developed, draw the printed circuit boards,
assembly the hardware, and finally test the whole system for its’ functionality.
1.3 Motivation
Multichannel Temperature Logger is a digital data logger that continuously records
temperature using connected sensors into SD card at the user-selection intervals of
10 seconds, 30 seconds, 1 minute, or 5 minutes. The device has a keypad and LCD
and can be used as a stand-alone device. Besides that, with built-in SMS alert system,
alert message can be sent to user whenever the reading exceeded the pre-set value. At
the user preference, the system can perform logging for a period of time and restarts
the system once the period is reached.
The device can be applied for temperature measurement, monitoring and
recording in various industries such as in food processing, pharmaceutical
manufacturing, and various stages of contract assembly and semiconductor

4
fabrication. The process of heating materials such as silicon requires constant high
temperature environment in order to obtain better results and experiment on new
species plant growth requires also the temperature to be set constant. Therefore, the
temperature logger can continuously monitor and alert them to fine tune it along the
process. Besides, it can also be applied for monitoring temperature in physical
phenomena in automotive and in-vehicle, as well as chambers and test facilities.
1.4 Organization of chapters
Chapter 1 briefly describe the background of the temperature data logger and
temperature measurement significance. Aim and objectives that provides direction
for this project are stated here, as well as the motivation and scope of works.
Chapter 2 involves the literature review. The data logger’s review and its evolution,
types of temperature sensors and commercial temperature loggers’ review are
included here as well.
Chapter 3 discusses the methodology of this project. The hardware used and
implementations are also included in this chapter together with the discussion of
programme flow diagram and programme code.
Chapter 4 covers the testing result of the multichannel temperature logger module
developed and result discussions.
Chapter 5 indicates recommendations on future work can be done to improve the
multichannel temperature logger. Besides, the conclusion of this project is included
as well.

CHAPTER 2
2 LITERATURE REVIEW
2.1 Data Logging
2.1.1 Chart Recorders
Scientific data collection has been a complicated task and time consuming for years
and the data collected somehow may not 100 % accurate. With the invention of
electronic instruments, the data collection task can be done automatically and thus
releasing engineers and scientist, or their assistants for other tasks. Data logging is
commonly used in scientific experiments and in monitoring systems where there is
the need to collect information faster than a human can possibly collect the
information and in cases where accuracy is essential. (Kale, Mehrotra, and Manza,
2007). Many loggers archive information such as temperature using sensors and then
convert the information into electrical signals. The data is archived and once
retrieved can be filtered and properly understood. Earlier data loggers used magnetic
tape, punched paper tape, or directly viewable records such as strip chart recorders.
(Crystal, 2011)
Chart recorder is an electromechanical device that records electrical or
mechanical input trend onto a piece of paper and they are appeared in three different
types, the strip, circular, and roll types. Strip chart recorders, as shown in Figure 2.1
have a long strip of paper ejected out the side of the recorder. Circular chart recorders
have a rotating disc of paper are more compact and amenable but the chart paper
must be replaced frequently, as shown in Figure 2.2. Roll chart recorders meanwhile

6
are similar to strip chart recorders except that the unit is fully enclosed and the
recorded data is stored on a round roll.
Figure 2.1: Strip Chart Recorders. (Wheeler, Ganji, 2010).
Figure 2.2: Circular Chart Recorders. (Moyer Instruments, 2011).
2.1.2 Data Logger
As science and technology have developed, therefore the need for data collection and
analysis has grown. This is fulfilled, at least in part, by dedicated, microprocessor-
based data loggers. Most instrument manufacturers consider a data logger a

7
standalone device that can read various types of electrical signals and store the data
in internal memory for later download to a computer. Generally they are small,
battery powered, portable, and equipped with a microprocessor, internal memory for
data storage, and sensors. Some data loggers interface with a personal computer and
utilize software to activate the data logger and view and analyze the collected data
while others have a local interface device such as keypad, liquid crystal display
(LCD), and can be used as a stand-alone device.
Temperature logger features three functioning modes that focus on different
aspects of the system under test, such as dead time, variation speed, overshoots or
stability. Constant monitoring the temperature at regular intervals is called rate
monotonic logging and bounded, rate monotonic logging meanwhile take records of
the temperature at high speed, but will stop logging once it reaches an upper limit,
preset by the user. Value sensitive logging is the method where logger will log only
in the moments when a significant variation occurs to increase its’ efficiency and to
preserve the memory. However, it is not efficient when the temperature has multiple
and high speed variations.
Beside the three functioning modes, the logger has the possibility to be
synchronized with external events and to trigger external devices. These are insulated
from the rest of the logger’s circuit and the inputs can be programmed so that the
logging starts when one or a combination of the two signals occur.
Initial temperature logger technology introduces small internal memory to
store the data and the logger has to be connected to the computer via RS-232 serial
communication port to retrieve the data. It also has predefined logging interval and
limited selections of logging period. Buzzer is also one of the features of the
temperature logger in early days to alert the users whenever the measured
temperature exceeds the preset limit or there is abnormal trend detected. Buzzer will
turned on until the user switch it off manually. Apart from that, the size of the device
is also big and not handy too.
As the technology improves, the size of the device getting smaller with more
sophisticated features and the design also becomes trendier. Reduction in system size

8
resulting lesser power consumption and hence battery can be attached to power up
the device. This makes the logger portable and user does not have to look for the
nearby power point before using it. Besides that, recent loggers accept various types
of probes and users have can choose type to use, depending on the range and the
sensitivity of the temperature to be measured.
Other than that, the data logged is stored in the removable storage, for
instance memory cards or USB flash drives. This feature subsequently eases the
users as they do not have to move the logger to the computer to retrieve the data. One
has to remove the storage and insert it into the computer to perform data transfer and
another blank storage can be inserted to the logger to continue log data. Logging data
on a removable drives not only makes data transfer easier, but saves cost too because
users can select any size of the storage available to store the data. There are some
loggers not only do logging operation, but also works as a feedback circuit to the
main system for correction. An alert signal is sent to the main controller if there is
abnormality in the environment and correction can be performed.
Improvements are also made on the way to alert the users whenever the
reading gets abnormal or exceeds the limit. There are devices attached with GSM
modem to send short message or call the user’s mobile number, and also some
devices comes with wireless network hardware to report the user via email. Such
improvements offers greater flexibility as they do not have to be around the logger
during its’ operation and they can continue their other tasks anywhere they wanted to.
The advantage of data loggers is that they can operate independently like a
computer, unlike many other types of data acquisition devices. Data loggers are
available in various shapes and sizes. The device range includes simple economical
single channel fixed function loggers to more powerful programmable devices
capable of handling hundreds of inputs. Data loggers are normally more economical
than chart recorders. They offer more flexibility and are available with a greater
variety of input types. Most data loggers collect data which may be directly
transferred to a computer.

9
2.2 Temperature Sensor
Analogue temperature sensor uses a solid-state technique to determine the
temperature. It does not use mercury, which can be found in old thermometers or
bimetallic strips which used in some home thermometers or stoves. Instead, it uses
the fact as temperature increases, the voltage across a diode increases at a known rate
or the voltage drop between the base and emitter, VBE of a transistor. By precisely
amplifying the voltage change, it is easy to generate an analogue signal that is
directly proportional to temperature. As these sensors have no moving parts, they are
precise, never wear out, don't need calibration, work under various environmental
conditions, and are consistent between sensors and readings. Moreover they are very
inexpensive and easy to use. (Ladyada.net, 2011)
There are two categories of temperature sensors, which are contact and non-
contact sensors. Contact temperature sensors measure their own temperature. One
infers the temperature of the object to which the sensor is in contact by assuming or
knowing that the two are in thermal equilibrium, that is, there is no heat flow
between them. Meanwhile noncontact temperature sensors include many different
types, but all share one set of unique features, which is they are often involved with
an optical property of materials called spectral emissivity or spectral emittance.
Thermocouple is a junction between two different metals that produces a
voltage related to a temperature difference and is a widely used type of temperature
sensor for measurement and control and can also be used to convert heat into electric
power. They are interchangeable and inexpensive, are supplied fitted with standard
connectors, and can measure a wide range of temperatures. However, the main
limitation is accuracy where system errors of less than one degree Celsius (C) can be
difficult to achieve. Thermocouple is available in different combinations of metals or
calibrations and the most common calibrations are J, K, T and E. There are high
temperature calibrations R, S, C and GB. Each calibration has a different temperature
range and environment, although the maximum temperature varies with the diameter
of the wire used in the thermocouple. Although the thermocouple calibration dictates
the temperature range, the maximum range is also limited by the diameter of the
thermocouple wire. (Varalakshmi, 2011)

10
Figure 2.3: Thermocouple Measuring Circuit. (Scervini, 2009).
Resistance thermometers, also called resistance temperature detectors or
resistive thermal devices (RTDs), are temperature sensors that exploit the predictable
change in electrical resistance of some materials with changing temperature. Most
RTD elements consist of a length of fine coiled wire wrapped around a ceramic or
glass core. The element is usually quite fragile, so it is often placed inside a sheathed
probe to protect it. The RTD element is made from a pure material whose resistance
at various temperatures has been documented. As they are almost invariably made of
platinum, they are often called platinum resistance thermometers (PRTs).
(Thermometrics, 2011). They are slowly replacing the use of thermocouples in many
industrial applications below 600 °C, due to higher accuracy and repeatability. The
RTD is one of the most accurate temperature sensors as it does not only provides
good accuracy, it also provides excellent stability and repeatability. They are popular
because of their excellent stability, and exhibit the most linear signal with respect to
temperature of any electronic temperature sensor. In the other hand, it also has
disadvantage which is slow response time and low sensitivity. Besides that, they can
be prone to self-heating. Self-heating will actually change the resistance of the RTD,
causing error in the measurement. This problem can be overcome by supplying them
with an excitation current and then read the voltage across their terminals.

11
Figure 2.4: Film Type Resistor Temperature Detectors.
Thermistor is a type of resistor whose resistance varies significantly with
temperature. The word is a portmanteau of thermal and resistor. They are constructed
from sintered metal oxide in a ceramic matrix that changes electrical resistance with
temperature. Thermistors are widely used as inrush current limiters, temperature
sensors, self-resetting overcurrent protectors, and self-regulating heating elements.
Thermistors differ from resistance temperature detectors (RTD) in that the material
used in a thermistor is generally a ceramic or polymer, while RTDs use pure metals.
The temperature response is also different, where RTDs are useful over larger
temperature ranges, while thermistors typically achieve a less precision compared to
RTDs within a limited temperature range, usually −90 °C to 130 °C. It is also able to
detect minute changes in temperature, which could not be observed by RTD or
thermocouple circuit. Unlike the basic RTD device, thermistor can be moulded into a
variety of shapes that can fit and compliment the required application. As a drawback,
there is loss of linearity. Thermistor is a non-linear device which is highly dependent
upon process parameters. In order to overcome this problem, a linearization circuit
should be used. An easy way to do this involves shunting a low temperature
coefficient resistor Rs across thermistor Rt. Besides that, accuracy error might
happen as the thermistors generate their own heat when their excitation current is too
high. Therefore, the excitation current should be kept as low as possible to prevent
this problem occurs. (Temperatures.com, 2003)

12
Figure 2.5: Thermistor with Encapsulation and without Encapsulation.
2.3 Commercial Temperature Logger
Various types of temperature logger are available in the market to cater different
requirements of the user. One example is HW group HWg-Tg11 GSM. It is an
effective solution for reporting temperature alerts and temperature logging in remote
places or in vehicles as the entire log is e-mailed over GPRS every 4 hours and a
warning SMS will be sent when the temperature leaves a defined safe range with the
capability of measuring temperature from 30°C to +125°C.
Figure 2.6: HW group HWg-Tg11 GSM Temperature Datalogger.
Another type of temperature data logger available in the market is Lascar EL-
USB-TC-LCD thermocouple temperature data logger with LCD display. This
standalone data logger is able to measure and store up to 32,000 temperature
readings from K, J or T type thermocouple. The thermocouple is attached via the

13
thermocouple socket at the base of the unit and able to measure from -200 to
+1300°C for K-type thermocouple, -130 to +900°C for J-type thermocouple, and -
200 to 350°C for T-type thermocouple. The user can easily set up the logger and
view downloaded data by plugging the module into a USB port of a computer and
using the supplied software. Data can then be graphed, printed and exported to other
applications.
Figure 2.7: Lascar EL-USB-TC-LCD Thermocouple Logger.
Extech Company comes out with another feature of temperature logger, 3-
Channel Temperature Logger. It uses K-type thermocouple as sensing device and
able to measure temperature ranging from -100°C to 1300°C. It has the feature to
allow user to select various sampling rate from 5 seconds up to 10 minutes and data
is stored in SD card. The display is updated with new reading every second with the
reading resolution of 0.1 °C and accuracy of ±0.5% + 0.5°C.
Figure 2.8: Extech 3-Channel Temperature Logger.

14
Another manufacturer that produces temperature logger is Omega with the
product HH314A. It is a low cost, high performance handheld meter with data
logging ability with triple display to show the temperature from a handheld probe
and able to display the data from separate K-type thermocouples. This device can
measure the temperature from -200 to 1370°C with a resolution of 0.1°C and ±0.5%
+ 1°C. Meanwhile, the logging interval can be adjusted between 1 to 3599 seconds
and able to store 16,000 of data records in its’ internal memory.
Figure 2.9: Omega HH314A.
Another commercial product of temperature logger is the TC110-2MB from
Madge Tech. It is a miniature, battery powered, and stand alone device with
thermocouple based temperature recorder. It also features a real-time clock module
that extends the battery life to more than 2 years and allows for high speed
downloads and able to record up to 262,144 measurements per channel. The device
can measure the temperature of the environment ranging from -210°C to 1300 °C,
with the resolution of 0.1 °C and accurate to ±0.5 at the temperature range of 0
±0.5 °C to 50 °C. The device software can be programmed either to immediate start
measuring or delay up to six months in advance and able to be connected directly to
the computer for monitoring and recording purpose. In standalone mode, the device

15
can takes up to 262,144 reading for each channel, where each reading can be taken
every second or every 12 hours.
Figure 2.10: Madge Tech TC110-2MB.
The commercial temperature loggers therefore can be categorised into three
groups based on their purpose, for educational purpose, industrial purpose, and also
normal usage purpose. The table shows the general features of temperature logger
based on their purposes.
Table 2.1: General Features of Temperature Logger for Different Target User.
Education Consumer Industrial
Data channel 1 to 16 1 to 4 5 to 20
Initial cost Low cost Low cost High cost
Data points stored 5000 2048 4500 to 64000
Sample rate 10sec to 24 hours 1sec to 255min 1sec to 24hours
Displays data Yes Yes Yes
Display type LCD LCD LCD (graphic)
Remote probes Yes Yes Yes
Probe cable length 2meters 2 meters 2 meters above
Probe signal Analogue Analogue Analogue
Battery backup Yes (battery
powered)
Yes (battery
powered)
Yes
Alert relay No Yes (email or text) Yes (email or text)
Temperature
range
-25°C to +110°C 0°C to +150°C -50°C to +800°C
Stand alone Yes Yes Both
Maintenance No No Yes
Power supply No No Both type
Multiples display Yes No Yes

16
Commercial temperature loggers are available to the user, depending on their
needs and purposes. Although the temperature logger available has its’ own
outstanding features, it is hard to find a device that incorporates all of these features.
Moreover, most of the temperature logger unable to measure very high temperature
and therefore their application are limited. Devices that provide data logging do not
provide SMS alert service to the user and storage is not removable. One has to
connect the device to the computer in order to analyse the data. In order to improve
the apparent device, this project propose to increase the device capabilities to
measure high temperature of up to 300° C to widen the applications, and incorporates
the data logging into removable memory storage and SMS alert features into the
same device. RTDs and thermocouples are selected as the temperature sensor they
support high temperature up to 400° C. They also have linear characteristics at high
temperature which is easy for implementation and low cost.

CHAPTER 3
3 METHODOLOGY
3.1 System Overview
Figure 3.1 shows the overall block diagram of the Multichannel Temperature Logger.
The system consists of six peripheral devices connected to a control unit, which is the
microcontroller, which are temperature sensors, liquid crystal display (LCD), keypad,
Secure Digital (SD) memory card, GSM modem, and the Real Time Clock (RTC).
Three microcontrollers are used in the system and interconnected to each other using
serial peripheral interfaces.

18
Figure 3.1: System Block Diagram.
Main
Microcontroller
RTC
Microcontroller
Real Time Clock
(RTC)
Temperature
Sensor
(4 Channels)
Keypad
GSM
Modem
LCD
Display
4
2
16
2
8
2
Memory Card
Microcontroller
Memory Card
(Storage)
4
4
LCD
Display
16

19
The temperature sensors, keypad, LCD, and the GSM modem are connected
to the main microcontroller. Another two microcontrollers are each dedicated to
manage the SD card module and RTC chip. The RTC microcontroller is responsible
to read and send the current date and time to the memory card microcontroller for
logging purpose. As the connected hardware use the same input output pins but
different serial interface modules of the microcontroller such as the SD card and the
RTC chip, this makes three microcontrollers to be used in this system. Besides, the
duration for the microcontroller to write a row of data to the SD card takes longer
time than the temperature measurement and this interferes the performance of the
system. Therefore, one separate microcontroller is responsible for writing the data
into the SD card. System size, weight, as well as design are also taken into account
instead of only system functions and efficiency to make the system portable and
trendy.
The system will detect the temperature by sensor and send the signal to the
main microcontroller then display it on LCD. Besides that, the temperature value will
be stored in a memory card which is storage for the system. Furthermore, it sends out
a short message from the GSM modem if the temperature goes above a preset value.
3.2 Temperature Sensor
Figure 1.3 shows the schematic diagram of the connection between the PIC18F4620
microcontroller and the temperature sensors. The sensor output pins are connected to
the microcontroller through Port AN0, AN1, AN2, and AN4 as to be input to ADC
module in the microcontroller with 0.1nF ceramic capacitor to improve the stability
before it is sent to the microcontroller. The LM35DZ temperature sensor can be
connected directly to the microcontroller while the K-type thermocouple has to
connect to AD595 thermocouple amplifier in order to produce the output voltage
level similar to the LM35DZ temperature sensor. A preset is applied at the reference

20
voltage pin 5 to produce 1V using the voltage divider concept to prevent offset on the
value obtained as the sensor gain of the sensor is 10mV / °C and ADC has 10 bit ( 210
≈1000 ). The analogue signal from the sensor is converted to digital signal in the
microprocessor. The result from the conversion will be separated into single digit and
added with 30h to convert to ASCII code before they are sent to the LCD to display.

21
Figure 3.2: Microcontroller Connection Schematic Diagram.

22
Figure 3.3: Hardware Connection of LM35DZ Temperature Sensor.
Figure 3.4: Hardware Connection of AD595 Thermocouple Amplifier with K-
Type Thermocouple.

23
3.2.1 LM35DZ Temperature Sensor
The sensor used in this project is LM35DZ precision centigrade temperature sensors
in TO-92 package. It is a precision integrated-circuit temperature sensor, whose
output voltage is linearly proportional to the Celsius (Centigrade) temperature. The
LM35DZ has an advantage over linear temperature sensors calibrated in ° Kelvin, as
it is not required to subtract a large constant voltage from its output to obtain
convenient Centigrade scaling. Other than that, it does not require any external
calibration or trimming to provide typical accuracies of ±1⁄4°C at room temperature
and ±3⁄4°C over a full −55 to +150°C temperature range. Its’ low cost is assured by
trimming and calibration at the wafer level. The LM35DZ’s low output impedance,
linear output, and precise inherent calibration make interfacing to readout or control
circuitry especially easy. It can be used with single power supplies, or with plus and
minus supplies. As it draws only 60 µA from its supply, it has very low self-heating,
less than 0.1°C in still air and is rated to operate over a −55° to +150°C temperature
range.
Figure 3.5: LM35DZ Temperature Sensor TO-92 Package.
The LM35DZ can be applied easily in the same way as other integrated-
circuit temperature sensors. It can be glued or cemented to a surface and its
temperature will be within about 0.01°C of the surface temperature. It is presumed
that the ambient air temperature is almost the same as the surface temperature

24
provided if the air temperature were much higher or lower than the surface
temperature, the actual temperature of the LM35 die would be at an intermediate
temperature between the surface temperature and the air temperature. This is
especially true for the TO-92 plastic package, where the copper leads are the
principal thermal path to carry heat into the device, so its temperature might be closer
to the air temperature than to the surface temperature. (National Semiconductor
Corporation, 2000)
3.2.2 Thermocouple K-Type
Another type of temperature sensor attached to the project is the Thermocouple K-
type welded tip glass fiber. It is a combination of chromel and alumel conductors
with two metre long fast response thermocouple wire insulated with varnish
impregnated glass fibre sleeve with the junction is exposed. The tip implements
welding method to prevent oxidisation by the air moisture and the conductor is
insulated using glass fiber. Its’ solid wire section is 0.07 mm2 with the diameter of
0.3 mm. The thermocouple is able to measure the temperature ranging from -50 to
400 °C. Thermocouple K-type sensor is chosen as the second sensors to be
implemented in the system as it works well in various environment, such as
continuous oxidation environment and only fails if it is exposed to sulfur. Oxidation
of chromium in positive leg at certain low oxygen concentrations causes large
negative calibration drifts and is more serious at the temperature of 815 to 1038 °C.
As the thermocouple itself produces non-linear low voltage output signal, an
amplifier is needed before feed into the system. (RS Components, 2006)

25
Figure 3.6: Thermocouple K-Type Welded Tip Glass Fibre.
3.2.3 AD595 Thermocouple Amplifiers
The AD595 thermocouple amplifier is an instrumentation amplifier and
thermocouple cold junction compensator on a monolithic chip. It combines an ice
point reference with a precalibrated amplifier to produce a 10 mV/°C output directly
from a thermocouple signal. Pin-strapping options allow it to be used as a linear
amplifier-compensator or as a switched output set point controller using either fixed
or remote set point control and also to amplify its compensation voltage directly,
thereby converting it to a stand-alone Celsius transducer with a low impedance
voltage output. (Analog Devices, 1999)
AD595 thermocouple amplifier is used in this project as the output voltage
produced by the K-type thermocouple is small and non-linear. Small and non-linear
voltages result in least sensitive to small temperature changes and hence the ADC
module in the microcontroller unable to convert the voltage level into digital value.
The K-type thermocouple is connected to the input of the amplifier and the output of
the amplifier is connected to any of the sensor ports available on the system as the
system accepts input changes of 10 mV / °C.

26
Figure 3.7: Programme Flow Diagram for Temperature M
easurement.
26

27
From the flow diagram, if all sensor channels are activated, the system will
display the channel A with the readings at the first row of the LCD, channel B with
the readings at the second row, and the LCD is cleared to allow channel C and
channel D readings to be displayed. The system will line up the channel reading
according to the channel name in ascending order and shift the display upwards
whenever the previous channel name is not activated. Therefore, if only channel A, C,
and D are activated, the channel C reading will be shifted and display on the second
row below the channel A reading and the channel D reading will be shifted one row
upwards after the LCD is cleared.
3.2.4 Temperature Conversion and Display
Figure 3.8: Analogue-to-Digital Conversion Code for Temperature Conversion
and Reading Display.
//==================Reading Display ========================== unsigned short read_disp(void) { short tem; read_adc(); tem=result; dis_num(tem/10); send_char('.'); dis_num(tem%10); send_char(0b11011111); send_char('C'); return tem; } //==================subroutine ADC========================= void read_adc(void) { unsigned short i; unsigned long result_temp=0; for(i=2000;i>0;i-=1) //looping 2000 times for
//getting average value { ADCON0bits.GO = 1; while(ADCON0bits.GO==1);//ADC start, ADCON0bits.GO=0 //after finish ADC progress result=ADRESH; result=result<<8; //shift to left for 8 bit result=result|ADRESL; //10 bit result from ADC result_temp+=result; } result = result_temp/2000; //getting average value }

28
In the programme, the read_disp subroutine will be called continuously after the
user has entered the temperature limits and the mobile number for the short message
to be sent. In the read_disp subroutine, the read_adc subroutine will be called to
perform the conversion process. The input voltage to the analogue port will be
sampled and the result is stored in ADRESH and ADRESL. Both low byte and high byte
results are then stored in a 16-bit variable and this process is repeated for 2000 times
to obtain the average value. Then, the conversion result is passed into dis_num
subroutine to display the results in one decimal place on the LCD.
3.3 GSM Modem
GSM modem is a specialized type of modem which accepts a SIM card, and operates
over a subscription to a mobile operator, just like a mobile phone. From the mobile
operator perspective, a GSM modem looks just like a mobile phone. A GSM modem
could also be a standard GSM mobile phone with the appropriate cable and software
driver to connect to a serial port or USB port on computer. Any mobile phone that
supports the "extended AT command set" for sending/receiving SMS messages, as
defined in the ETSI GSM 07.05 specification can be supported by the Now
SMS/MMS Gateway.

29
Figure 3.9: Connection between Mobile Phone and Microcontroller.
The mobile phone is connected to the microcontroller using the DRS-11
serial data cable through MAX 232. The MAX232 is an integrated circuit that
converts signals from an RS-232 serial port to signals suitable for use in TTL
compatible digital logic circuits and typically converts the RX and TX signals. The
output of the MAX 232 circuit is then connected to the TX and RX pins of Port C on
the microcontroller respectively. MAX232 is a dual driver receiver that includes a
capacitive voltage generator to supply TIA/EIA-232-F voltage levels from a single 5-
V supply. Each receiver converts TIA/EIA-232-F inputs to 5-V TTL/CMOS levels.
These receivers have a typical threshold of 1.3 V, a typical hysteresis of 0.5 V, and
can accept ±30-V inputs. Each driver converts TTL/CMOS input levels into
TIA/EIA-232-F levels.
30
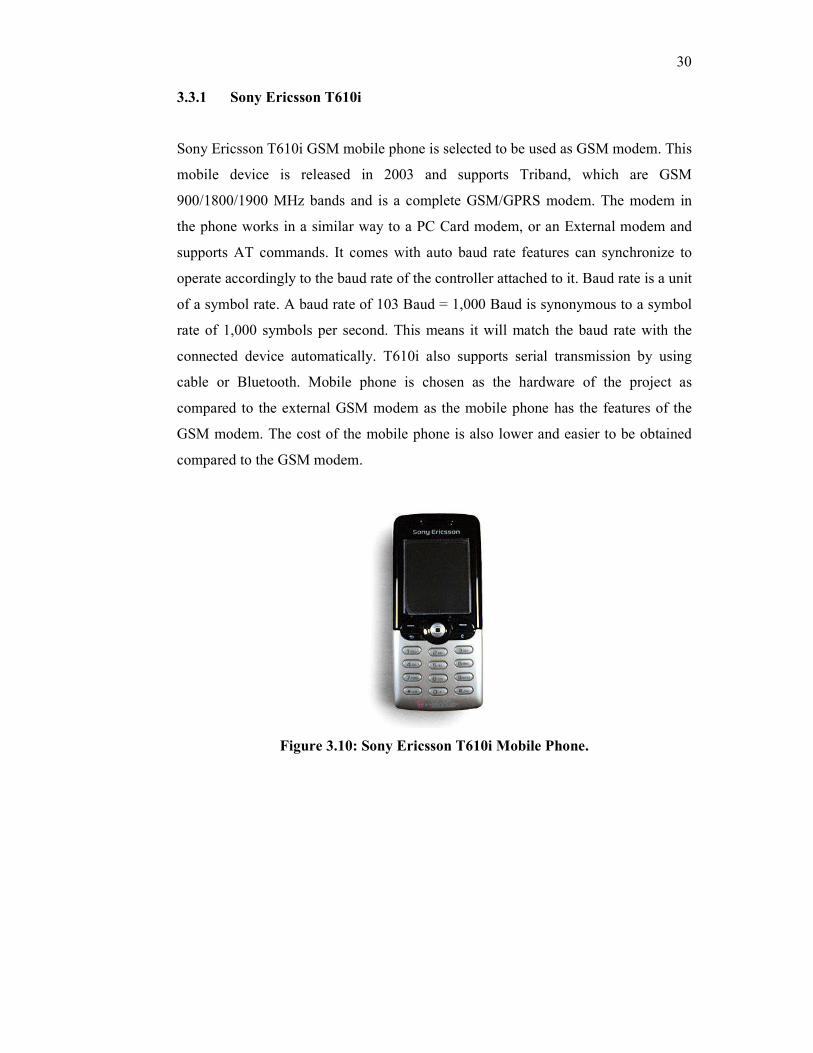
3.3.1 Sony Ericsson T610i
Sony Ericsson T610i GSM mobile phone is selected to be used as GSM modem. This
mobile device is released in 2003 and supports Triband, which are GSM
900/1800/1900 MHz bands and is a complete GSM/GPRS modem. The modem in
the phone works in a similar way to a PC Card modem, or an External modem and
supports AT commands. It comes with auto baud rate features can synchronize to
operate accordingly to the baud rate of the controller attached to it. Baud rate is a unit
of a symbol rate. A baud rate of 103 Baud = 1,000 Baud is synonymous to a symbol
rate of 1,000 symbols per second. This means it will match the baud rate with the
connected device automatically. T610i also supports serial transmission by using
cable or Bluetooth. Mobile phone is chosen as the hardware of the project as
compared to the external GSM modem as the mobile phone has the features of the
GSM modem. The cost of the mobile phone is also lower and easier to be obtained
compared to the GSM modem.
Figure 3.10: Sony Ericsson T610i Mobile Phone.

31
Figure 3.11: DRS-11 Serial Data Cable.
3.3.2 AT Command
AT commands are generally known as instructions used to control a modem. AT is
an abbreviation of Attention. Every command line of AT commands begins with
"AT" or "at". Many of the commands that are used in the wired dial-up modems are
also supported by GSM modems and mobile phones. Those commands include ATD
(dial), ATA (answer), ATH (hook control), and ATO (Return to online data state).
Other than these common AT command set, GSM and mobile phones also support an
AT command set that is specific to the GSM technology, which includes SMS-
related commands like AT+CMGS (send SMS message), AT+CMSS (send SMS
message from storage), AT+CMGL (List SMS messages and AT+CMGR (read SMS
messages). The prefix "AT" informs the modem about the start of a command line
and not part of the AT command name. For example, D is the actual AT command
name in ATD and +CMGS is the actual AT command name in AT+CMGS
Mobile phone manufacturer usually do not implement all the AT commands,
command parameters and parameter values in their mobile phones. In addition, the
behaviour of the implemented AT commands as defined in the standard may differ.
Only AT command set for Sony Ericsson mobile phone is used for the project.

32
3.3.3 Short Messaging Service Modes
GSM modem or mobile phone can operate in two SMS modes. They are called SMS
text mode and PDU mode (Protocol Data Unit). When the GSM/GPRS modem or
mobile phone is operating in different modes, the syntax of certain SMS AT
commands and the responses returned after command execution is different. Sending
message using AT command can be realized using software called HyperTerminal.
SMS using text mode is simpler than PDU mode. A specific syntax of
command line has to be followed if a message is to send in text mode. An example of
a message "SMS in text mode." is to send to the mobile phone number
+85291234567 is illustrated below using HyperTerminal
Figure 3.12: AT Command Using Text Mode.
Sending message using PDU mode is much more complicated, however it is
more commonly supported by GSM modems or mobile phones than text mode.
Similarly, a specific syntax has to be followed for sending message in PDU mode.
The following command line will be typed if a short message "SMS in PDU mode."
is to be sent to the mobile phone number +60165941832 where the message is
represented by ASCII codes.
Figure 3.13: AT Command Using PDU Mode.
AT+CMGS=28
> 0001000A811056498123000410534D5320696E20504455206D6F64652E�
+CMGS: 190
OK
AT+CMGS="+85291234567"
>SMS in text mode.� +CMGS:105
OK

33
3.3.4 Implementation of GSM Modem
Figure 3.14: Programme Flow Diagram for Sending Short Message.
The system UART module is configured to communicate with the GSM modem. The
baud rate generator is set to 9600 bits per second to match with the phone’s transmit
rate, the 9-bit transmission and reception are disabled, and continuous receiving data
is enabled. The system continuously compares the reading obtained from the
analogue-to-digital conversion results with the respective preset limit and send short
message to user-defined mobile number. The system will send short message for
once of the respective channel and only resends the message when the reading falls
below 5 °C and exceeds again the limit.

34
Figure 3.15: AT Commands Predefined in the Microcontroller.
Figure 3.15 shows the AT commands predefined in the microcontroller to
setup the mobile phone and save message template. Before a short message can be
sent to the user, the configuration of the mobile phone is set where the baud rate of
the mobile phone is set to 9600 bps, the GSM modem is set to PDU mode, and the
message length set to 0x64. Whenever the reading exceeds the limit, the system
makes use of the message template stored in uart_msg, uart_msg2, and
uart_msg3 and sends the short message to the user.
Figure 3.16: UART Initialisation Code of Microcontroller.
Figure 3.16 meanwhile shows the UART initialisation code of the
microcontroller, where the microcontroller has to be initialised before it can connect
with the mobile phone. The microcontroller is set to 9600 bps, the 9-bit transmission
and reception are disabled, and continuous reception is enabled.
void init (void){ TRISCbits.TRISC6 = 0; TRISCbits.TRISC7 = 1; SPBRG = 129; TXSTAbits.BRGH = 1; TXSTAbits.TXEN = 1; TXSTAbits.TX9 = 0; RCSTAbits.RX9 = 0; RCSTAbits.SPEN = 1; RCSTAbits.CREN = 1; }
//====================MAIN================================ char uart_data1[]="AT+IPR=9600"; char uart_data2[]="AT+CMGF=0"; char uart_data3[]="AT+CMGS=64"; char uart_init[]="0001000a81"; char uart_msg[]="000434414C455254210D0A52656164696
E67206F6E2043682E20"; char uart_msg2[]="206578636565646564206C696D697420"; char uart_msg3[]="2043656C636975732E";

35
Figure 3.17: Temperature Reading Comparison Code.
On the other hand, Figure 3.17 shows the system comparison code to perform
message sending operation when the temperature reading exceeds the limit. The
system checks the limit every 3 seconds using the timer interrupt feature and sends
//==================Interrupt Service Routine===================== #pragma interrupt interrupt_ISR void interrupt_ISR (void) { INTCONbits.TMR0IF=0; counter++; if (counter>=280) {while(1) { if (temp_A >=temp_A_lim &&send_A==0&&sel_A) { send_sms('4','1',temp_A_lim); send_A=1; break; }else if (temp_A<=(temp_A_lim-50)&&send_A==1&&sel_A) {send_A=0; break;} if (temp_B >=temp_B_lim &&send_B==0&&sel_B) { send_sms('4','2',temp_B_lim); send_B=1; break; }else if (temp_B<=(temp_B_lim-50)&&send_B==1&&sel_B) {send_B=0;break;} if (temp_C >=temp_C_lim &&send_C==0&&sel_C) { send_sms('4','3',temp_C_lim); send_C=1; break; }else if (temp_C<=(temp_C_lim-50)&&send_C==1&&sel_C) {send_C=0;break;} if (temp_D >=temp_D_lim &&send_D==0&&sel_D) { send_sms('4','4',temp_D_lim); send_D=1; break; }else if (temp_D<=(temp_D_lim-50)&&send_D==1&&sel_D) {send_D=0;break;} break; } counter=0; } TMR0L=0; return; }

36
the short message for one time. The particular operation is then flagged to indicate
that the system has send SMS for the particular channel and is flag is removed when
the reading goes below 5 °C of the limit.
3.4 Real Time Clock DS1307
Figure 3.18: Schematic Diagram of Real Time Clock DS1307.

37
A real-time clock (RTC) is a computer clock which is most often in the form of an
integrated circuit that keeps track of the current time. Although the term often refers
to the devices in personal computers, servers and embedded systems, RTCs are
present in almost any electronic device which needs to keep accurate time.
2 pins from PIC16F876A microcontroller are used to interface with the RTC
DS1307 where the data pin SDA from the RTC is connected to pin 15 of the
microcontroller and clock pin SCL is connected to pin 14 of the microcontroller
using I2C module. The current date and time is read from the RTC device and
displayed on the LCD display. 3 active low push buttons are available which
functions to select mode, increase value, and reset the date and time. The amendment
made is sent to the RTC device and register is replaced with new value. The logging
interval is checked from time to time and the current time and date is sent to
PIC18F2620 to be written into SD Card via UART module when the interval is
reached.
3.4.1 DS1307 Real Time Clock
DS1307 is one device that used widely in microcontroller applications. The DS1307
serial real-time clock (RTC) is a low-power, full binary-coded decimal (BCD)
clock/calendar plus 56 bytes of NV SRAM. Address and data are transferred serially
through an I2C, bidirectional bus. The clock/calendar provides seconds, minutes,
hours, day, date, month, and year information. The end of the month date is
automatically adjusted for months with fewer than 31 days, including corrections for
leap year. The clock operates in either the 24-hour or 12-hour format with AM/PM
indicator. The DS1307 has a built-in power-sense circuit that detects power failures
and automatically switches to the backup supply. Time keeping operation continues
while the part operates from the backup supply.

38
Figure 3.19: DS1307 Real Time Clock.
I2C is the abbreviation for Inter-Integrated Circuit Communications. I2C is
implemented in the microcontroller by a hardware module called the Master
Synchronous Serial Port which known as the MSSP module and allows I2C serial
communication between two or more devices at a high speed and communicates with
other microcontroller devices and many peripheral integrated circuits in the market
today. I2C is a synchronous protocol that allows a master device to initiate
communication with a slave device. I2C is also bi-directional to exchange the data
between the devices. This is implemented by an “Acknowledge” system. The
“Acknowledge” system or “ACK” system allows data to be sent in one direction to
one item on the I2C bus, and then, that item will “ACK” to indicate the data was
received. Since a peripheral can acknowledge data, there is little confusion on
whether the data reached the peripheral and whether it was understood. It uses only
the following two signals to serially exchange data with another device which are
SDA and SCL. SDA is known as Serial Data. Any data sent from one device to
another goes on this line while SCL is the Serial Clock signal. It is generated by the
master device and controls when data is sent and when it is read.

39
Figure 3.20: Wiring Diagram between Microcontroller and Real Time Clock.
3.4.2 DS1307 Implementation
Figure 3.21: Real Time Clock Flow Chart.
START
Read value
from RTC
Mode
button is
pressed?
Configure
Mode
Press Set button to
change value
Display on
LCD
NO
YES

40
The microcontroller is initialized with SCL and SDA pins set as input in order to
interface with the RTC DS1307 device. The I2C module as well as the configuration
code for RTC device is then initialized. Seconds, minutes, hours, day, date, month,
and year information are read and written to and from RTC device using sub-routines.
The current RTC data is read and stored into variables before they are displayed on
the LCD display from time to time. The push buttons are checked every time the
display date and time is updated. Whenever the mode button is pressed, reading
process from the RTC device is halted, the cursor starts blink to indicate the system
enters the amendment mode, and the system checks the increment button to increase
the current register value. Every increment performed on each part of the date and
time will be scanned for its’ logic, for instance the register that stores “hour” should
not have the value more than 23. The new values of the time and date will be written
into the RTC register when all the amendments have been made using I2C sub
routines. A reset button is introduced to allow user to reset the date and time to
default value when the user accidentally increment more than the actual date. When
the time elapsed exceeds the logging interval, the microcontroller transfer the current
date and time obtained from the RTC device to PIC18F2620.

41
Figure 3.22: RTC DS1307 Configuration.
The system in PIC16F876A begins with the initialisation of the RTC DS1307
where the current values in the device’s registers are read and clear the CH bit to
enable the oscillator. The system then reads back the current value of in “Hours”
register inside RTC DS1307 and change the timing mode to 24-hour mode.
void i2c_rtc_initialize(void) { unsigned int i; // The current value of the DS1307 RTC register. unsigned char uc_current_register_value; // Read back the current value of register "Seconds". uc_current_register_value = uc_i2c_read(RTC_ADDRESS, 0x00); // If the CH bit is set, clear it to enable the oscillator. if ((uc_current_register_value & 0x80) != 0)
{ uc_i2c_write(RTC_ADDRESS, 0x00, uc_current_register_value & 0x7f);
// We need delay for the oscillator to start up. for (i = 0; i < 500; i++) { __delay_ms(1); } } // Read back the current value of register "Hours". uc_current_register_value = uc_i2c_read(RTC_ADDRESS, 0x02); // If it's in 12-hour mode, change it to 24-hour mode. if ((uc_current_register_value & 0x40) != 0) {
uc_i2c_write(RTC_ADDRESS, 0x02, uc_current_register_value & 0xbf);
} }

42
Figure 3.23: RTC DS1307 Time Reading Code.
The current time in binary-coded decimals stored in the RTC registers is read
by the microcontroller and converted into binary numbers using the formula in the
respective subroutine and the result is returned to the main programme.
unsigned char uc_i2c_rtc_get_seconds(void) { unsigned char uc_i2c_data; // Read the value of register "Seconds". uc_i2c_data = uc_i2c_read(RTC_ADDRESS, 0x00); // Convert the BCD to binary and return the value. return (uc_i2c_data & 0x0f) + (((uc_i2c_data >> 4) & 0x07)
* 10); } unsigned char uc_i2c_rtc_get_minutes(void) { unsigned char uc_i2c_data; // Read the value of register "Minutes". uc_i2c_data = uc_i2c_read(RTC_ADDRESS, 0x01); // Convert the BCD to binary and return the value. return (uc_i2c_data & 0x0f) + ((uc_i2c_data >> 4) * 10); } unsigned char uc_i2c_rtc_get_hours(void) { unsigned char uc_i2c_data; // Read the value of register "Hours". uc_i2c_data = uc_i2c_read(RTC_ADDRESS, 0x02); // Convert the BCD to binary and return the value. return (uc_i2c_data & 0x0f) + (((uc_i2c_data >> 4) & 0x03)
* 10); }

43
Figure 3.24: RTC DS1307 Time Setting Code.
void i2c_rtc_set_seconds(unsigned char uc_value) { // The current value of the DS1307 RTC register. unsigned char uc_current_register_value; // Make sure the value is < 60 seconds. if (uc_value < 60) { // Change the value into BCD. uc_value = ((uc_value / 10) << 4) + (uc_value % 10); // Read back the current value of register "Seconds". uc_current_register_value = uc_i2c_read(RTC_ADDRESS, 0x00); // We only interested in the CH bit, mask out the others. uc_current_register_value &= 0x80; // Write to the I2C RTC. uc_i2c_write(RTC_ADDRESS, 0x00, uc_current_register_value |
uc_value); } } void i2c_rtc_set_minutes(unsigned char uc_value) { // Make sure the value is < 60 minutes. if (uc_value < 60) { // Change the value into BCD. uc_value = ((uc_value / 10) << 4) + (uc_value % 10); // Write to the I2C RTC. uc_i2c_write(RTC_ADDRESS, 0x01, uc_value); } } void i2c_rtc_set_hours(unsigned char uc_value) { // The current value of the DS1307 RTC register. unsigned char uc_current_register_value; // Make sure the value is < 24 hours. if (uc_value < 24) { // Change the value into BCD. uc_value = ((uc_value / 10) << 4) + (uc_value % 10); // Read back the current value of register "Hours". uc_current_register_value = uc_i2c_read(RTC_ADDRESS, 0x02);
// We only interested in the 12-hour/24-hour mode bit, mask out the others.
uc_current_register_value &= 0x40; // Write to the I2C RTC. uc_i2c_write(RTC_ADDRESS, 0x02, uc_current_register_value |
uc_value); } }

44
Figure 3.24 shows the subroutines to set the user-defined time into the RTC
device. The value obtained is compared for its’ logic, as for instance the seconds and
minutes value should not be more than 60 while the hours value should not be more
than 24. The values then is converted into binary-coded decimal form before is
transferred to the RTC to replace the respective registers with the new value.
Figure 3.25: RTC DS1307 Date Reading Code.
Meanwhile for the date reading, the day, date, month, and year values that
stored in the register is read by the microcontroller and the values are converted into
unsigned char uc_i2c_rtc_get_day(void) { // Read and return the value of register "Day". return uc_i2c_read(RTC_ADDRESS, 0x03); } unsigned char uc_i2c_rtc_get_date(void) { unsigned char uc_i2c_data; // Read the value of register "Date". uc_i2c_data = uc_i2c_read(RTC_ADDRESS, 0x04); // Convert the BCD to binary and return the value. return (uc_i2c_data & 0x0f) + ((uc_i2c_data >> 4) * 10); } unsigned char uc_i2c_rtc_get_month(void) { unsigned char uc_i2c_data; // Read the value of register "Month". uc_i2c_data = uc_i2c_read(RTC_ADDRESS, 0x05); // Convert the BCD to binary and return the value. return (uc_i2c_data & 0x0f) + ((uc_i2c_data >> 4) * 10); } unsigned char uc_i2c_rtc_get_year(void) { unsigned char uc_i2c_data; // Read the value of register "Year". uc_i2c_data = uc_i2c_read(RTC_ADDRESS, 0x06); // Convert the BCD to binary and return the value. return (uc_i2c_data & 0x0f) + ((uc_i2c_data >> 4) * 10); }

45
binary form before it is returned to the main programme except for the day value.
This is because the binary-coded decimal values for the day is equals to the binary
values.
Figure 3.26: RTC DS1307 Date Setting Code.
void i2c_rtc_set_day(unsigned char uc_value) { // Make sure the value is within 1 - 7. if (uc_value > 0 && uc_value <= 7) { // Write to the I2C RTC. uc_i2c_write(RTC_ADDRESS, 0x03, uc_value); } } void i2c_rtc_set_date(unsigned char uc_value) { // Make sure the value is within 1 - 31. if (uc_value > 0 && uc_value <= 31) { // Change the value into BCD. uc_value = ((uc_value / 10) << 4) + (uc_value % 10); // Write to the I2C RTC. uc_i2c_write(RTC_ADDRESS, 0x04, uc_value); } } void i2c_rtc_set_month(unsigned char uc_value) { // Make sure the value is within 1 - 12. if (uc_value > 0 && uc_value <= 12) { // Change the value into BCD. uc_value = ((uc_value / 10) << 4) + (uc_value % 10); // Write to the I2C RTC. uc_i2c_write(RTC_ADDRESS, 0x05, uc_value); } } void i2c_rtc_set_year(unsigned char uc_value) { // Make sure the value is < 100. if (uc_value < 100) { // Change the value into BCD. uc_value = ((uc_value / 10) << 4) + (uc_value % 10); // Write to the I2C RTC. uc_i2c_write(RTC_ADDRESS, 0x06, uc_value); } }

46
The Figure 3.26 displays the date setting subroutines to amend the current
date stored in the RTC register. The input data from the user is compared for its’
logic for each part of the date. For instance, the day value must be within 1 and 7, the
day value must be within 1 and 31, the month value must not be greater than 12, and
the year must less than 100. When the values are successfully compared, they are
converted into binary-coded decimal values and then sent to the respective RTC
registers to update them. After the values in the registers are updated, the RTC
continues to count the time starts from the updated date.
CHAPTER 4
4 RESULTS AND DISCUSSIONS
4.1 Temperature Sensor Testing
Tests are conducted on both types of temperature sensors, LM35DZ and K-type
thermocouple to show that both sensors output the same 10 mV/°C as one type of
configuration for the analogue to digital conversion module of the microcontroller is
needed if both sensors input the same signal. The apparatus setup for the testing is
shown in Figure 4.1 where both temperature sensor and the thermocouple are placed
at the tip of the conical flask filled with water and the water is heated up using hot
plate. Both outputs of the sensors are connected to digital oscilloscope and the
voltage levels are captured and recorded. A laboratory thermometer is placed as well
at the same position of the two sensors to compare the actual reading with the
reading from the oscilloscope. The data collected from 25 to 100 °C, which is the
boiling point of water and two graphs are plotted to observe the trend.

48
Figure 4.1: Setup for Thermocouple and LM35DZ Sensors to Measure Water
Temperature.
Figure 4.2: Sensors Reading on Oscilloscope at 50 °C.

49
Table 4.1: Output Voltage of Temperature Sensors at Different Temperature
Values.
Temperature
(°C)
Output Voltage (mV)
LM35DZ Thermocouple
25.0 250 249
30.0 301 301
35.0 355 356
40.0 401 402
45.0 450 448
50.0 500 499
55.0 567 566
60.0 603 599
65.0 681 679
70.0 708 708
75.0 754 751
80.0 802 798
85.0 849 849
90.0 915 910
95.0 956 961
100.0 1050 1060
Figure 4.3: LM35DZ Output Voltage, V versus Temperature, T

50
Figure 4.4: Thermocouple K-Type Output Voltage, V versus Temperature, T
From the graph, it is shown that both sensors has same trend with the gradient
of 10 mV/°C. This proves that both sensors can be input to the microcontroller using
the same configuration for the analogue-to-digital conversion module. Therefore, the
input port for the LM35DZ sensor can be used for the thermocouple K-type, together
with the AD595 amplifier. Both the sensors are then plugged into the system and few
temperature readings from the microcontroller are taken. The observation shows that
temperature displayed on the LCD display match the actual reading from the
thermometer. However, the system could not be tested to measure the environment at
the temperature higher than 100 °C due to inexistence of apparatus in the laboratory.
The LM35DZ sensor and thermocouple graphs are analysed and extended to 150 °C
and 400 °C respectively and the result shows that they have the linear trends with
equal gradient. Therefore, this shows that the sensor still able to produce 10 mV/°C
output at high temperature.

51
Figure 4.5: Projected LM35DZ Output Voltage, V versus Temperature, T
Figure 4.6: Projected Thermocouple K-Type Output Voltage, V versus
Temperature, T

52
Figure 4.7: Temperature Readings from the system and thermometer at 75 °C.
Figure 4.8: Temperature Readings from the system and thermometer at 66 °C.

53
4.2 GSM Modem Testing
GSM modem module is tested for its functionality by keying in the temperature
limits of each channel and the user’s mobile number. The sensors connected are
exposed to high temperature in order to allow the reading exceeds the preset limits.
Figure 4.9: User Keyed-in Mobile Number on LCD Display.
Observation shows that when the readings exceeds the preset limits, the
system sends the AT commands to the GSM modem and short messages is sent out
according to the mobile number defined by the user. The alert message contains the
channel name and the temperature limit preset by the user.
54
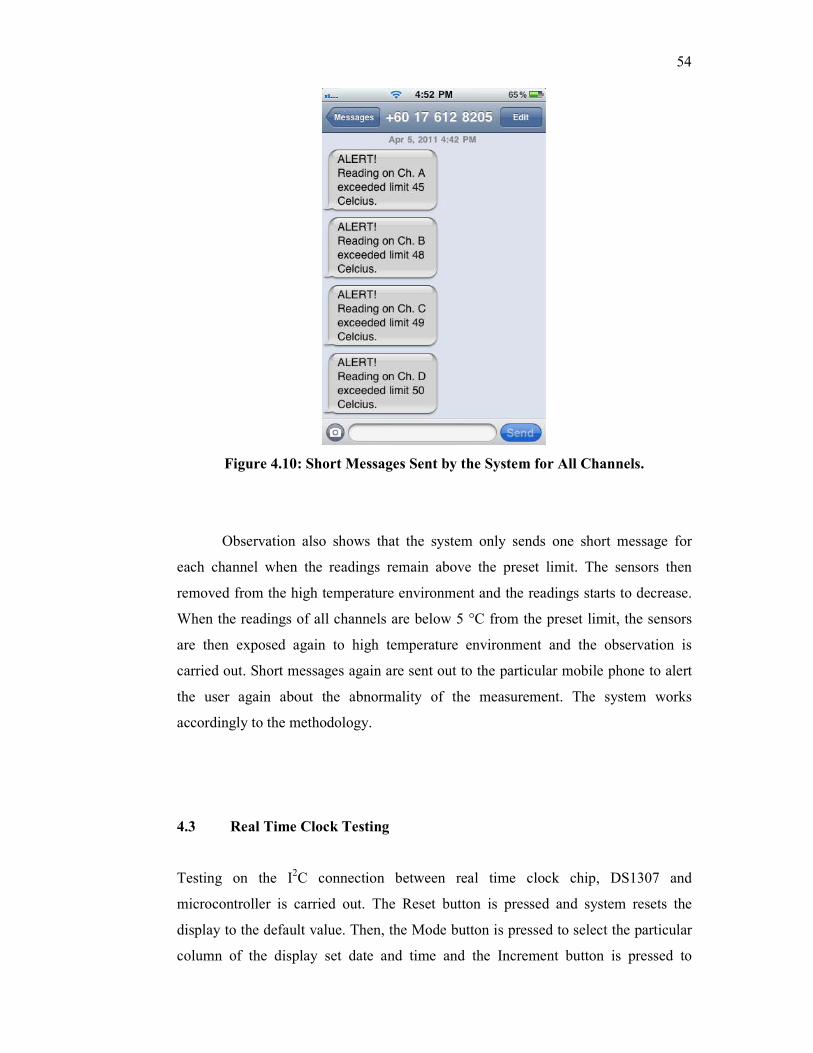
Figure 4.10: Short Messages Sent by the System for All Channels.
Observation also shows that the system only sends one short message for
each channel when the readings remain above the preset limit. The sensors then
removed from the high temperature environment and the readings starts to decrease.
When the readings of all channels are below 5 °C from the preset limit, the sensors
are then exposed again to high temperature environment and the observation is
carried out. Short messages again are sent out to the particular mobile phone to alert
the user again about the abnormality of the measurement. The system works
accordingly to the methodology.
4.3 Real Time Clock Testing
Testing on the I2C connection between real time clock chip, DS1307 and
microcontroller is carried out. The Reset button is pressed and system resets the
display to the default value. Then, the Mode button is pressed to select the particular
column of the display set date and time and the Increment button is pressed to

55
increase the value. Testing also carried out the system check on the logical value of
each column. Observation shows that when the “hour” column is incremented after
value “23”, the system resets the display back to “0”. The system check on other
columns also works accordingly to their logic. When user has finish set the date and
time, the system write the new data to the RTC device and the device starts to count
from the updated values.
Figure 4.11: Display Resets when Reset Button is Pressed.
Figure 4.12: “Minute” Column Incremented when Increment Button is Pressed.

56
Figure 4.13: LCD Displays Current Date and Time from DS1307 Device
When the power supply is removed and connected back, the LCD display
shows the current date and time instead of the default value. This proves that the real
time clock continues to count the time even though the main supply has been
disconnected. Besides, testing also has been carried out to ensure that the data
transfer from the PIC16F876A to PIC18F2620 is not corrupted. Observation on the
file created in the memory shows that the file is successfully created with the correct
date and time.

CHAPTER 5
5 CONCLUSION AND RECOMMENDATIONS
5.1 Summary
Throughout the project period, the research and testing tasks of the project are
carried out according to the project planning. Improvements to the system able to be
carried out as several tasks finished earlier than the time planned and hence the aim
and objectives of the projects are achieved. The multichannel temperature logger is
successfully developed and functions accordingly.
The multichannel temperature logger can measures temperature environment
of the range from 0 to 400 °C using K-type thermocouple and from 0 to 150 °C for
LM35DZ temperature sensor. Temperature limits and mobile number are entered and
saved into SD card via SPI serial communication. Temperature readings converted
by ADC module are displayed on LCD at 0.5 ms intervals and data logging becomes
flexible where user can opt to choose the various logging intervals and periods. Short
message that contains the channel name and temperature limit is sent out via GSM
modem using UART communication when the preset limit exceeds to alert users.
The information and data logged into SD Card are stored in .txt format and can be
opened in Microsoft Office Excel spreadsheet. There are some limitations in the
system constructed, such as the logging intervals and the period are limited to only 4
selections and not user-defined. Besides, the LCD only can displays up to 2 channel
readings and need to be switched consecutively if more than 2 channels are activated.
This device has the potential to become a low cost temperature logger for laboratory
use, a logger that monitors the environment temperature such as in integrated chip

58
assembly factory, as well as for meteorological research if the hardware is further
developed.
5.2 Recommendations
The analogue signal from the temperature sensor can be transmitted to the
microcontroller wirelessly instead of using a long wire to improve the current system.
As long wires have high resistance, this may degrade or interferes the analogue
signal input to the microcontroller. Besides, it is also troublesome to use long wire
probes and remote areas are hard to be measured. Probe connector head can be
designed uniquely to eliminate the possibilities of other types of probes or devices
can be connected to the system and subsequently damage it. In order to make the
system more compact, the LCD display and keypad can be replaced with touch
screen LCD as well as the whole system runs on a single microcontroller. This also
makes the system operates more efficiently. Other than that, the current
implementation does not allow the user to customize the file name created. The
feature that allows the user to customize the file name as well as the file format
selection can be implemented into the system. Moreover, various types of alert
system can be embedded into the device instead of short messaging alert system,
such as voice call or email to the user.

59
REFERENCES
8052.com. (2011). Software-Based Real Time Clock (RTC). Retrieved March 25,
2011, from http://www.8052.com/tutrtc
Analog Devices. (1999). Monolithic Thermocouple Amplifiers with Cold Junction
Compensation. Retrieved February 27, 2011, from http://www.analog.com/
static/imported-files/data_sheets/AD594_595.pdf
Data Logger. (2010). Introduction to Data Loggers. Retrieved July 10, 2010, from
http://www.omega.com/prodinfo/dataloggers.html
Developer's Home. (2010). Introduction to AT Commands. Retrieved July 28, 2010,
from http://www.developershome.com/sms/atCommandsIntro.asp
Ibrahim, D. (2008). Advanced PIC Microcontroller Projects in C: From USB to
RTOS with the PIC18F Series. Burlington: Elsevier Ltd.
Ibrahim, D.(2010). SD Card Projects Using the PIC Microcontroller. Burlington:
Elsevier Ltd.
Crystal, G. (2011). What is Data Logging?. Retrieved March 2, 2011, from
http://www.wisegeek.com/what-is-data-logging.htm
HW group. (2010). HWg-Tg11: GSM temperature datalogger. Retrieved July 15,
2010, from http://www.hw-group.com/products/tg11/index_en.html
Kale, K.V., Mehrotra, S.C., Manza, R.R. (2007). Advances in Computer Vision and
Information Technology. New Delhi: I.K. International.
Ladyada.net. (2011). Temperature. Retrieved March 25, 2011, from
http://www.ladyada.net/learn/sensors/tmp36.html
Maxim Integrated Products. (2010). DS1921G Thermochron iButton. Retrieved July
15, 2010, from http://www.maxim-ic.com/datasheet/index.mvp/id/4023

60
Scervini, M. (2009). Thermoelectric materials for Thermocouples. Retrieved March
2, 2011, from http://www.msm.cam.ac.uk/utc/thermocouple/pages/Thermocouples
OperatingPrinciples.html
Microchip. (2010). HI-TECH C for the PIC10/12/16 MCU Family. Retrieved July 25,
2010, from http://www.microchip.com/stellent/idcplg?IdcService=SS_GET_
PAGE &nodeId=1406&dDocName=en542849
Microchip. (2011). MPLAB C Compiler for PIC18 MCUs. Retrieved January 25,
2011, from http://www.microchip.com/stellent/idcplg?IdcService=SS_GET_
PAGE&nodeId=1406&dDocName=en010014
Microchip. (2010). MPLAB Integrated Development Environment . Retrieved July
25, 2010, from http://www.microchip.com/stellent/idcplg?IdcService=SS_GET
_PAGE&nodeId=1406&dDocName=en019469&part=SW007002
MicroDAQ.com. (2011). 3-Channel Temperature Data Logger. Retrieved March 10,
2011, from http://www.microdaq.com/extech/temperature/3-channel-temperature-
logger.php
Moore, G. (1986). Data Loggers, Modern Recorders. Electronics and Power,
32(2),132-136, February 1986.
Moyer Instruments. (2011). Chessell 392. Retrieved March 2, 2011, from
http://www.moyerinstruments.com/cart/chessell-recorders/chessell-392.html
National Semiconductor Corporation. (2010). LM35 Precision Centigrade
Temperature Sensor. Retrieved July 25, 2010, from http://www.national.com/mpf/
LM/LM35.html#Overview
NowMobile.com Limited. (2010). GSM Modems. Retrieved July 25, 2010, from
http://www.nowsms.com/GSM%20Modems.htm
Omega. (2011). Introduction to Data Logger. Retrieved March 25, 2011, from
http://www.omega.com/prodinfo/dataloggers.html
Petreus, D., Juhos, Z., Pitica, D. (2006). System in Package for Temperature Logging.
Electronics Technology, 2006. ISSE '06. 29th International Spring Seminar on,
vol., no., pp.309-312, 10-14 May 2006.
RS Components. (2006). Thermocouple,industrial,Welded tip glass
fibre,K,2m,RS,E06066. Retrieved February 27, 2011, from http://malaysia.rs-
online.com/web/search/searchBrowseAction.html?method=getProduct&R=62121
70
SearchCIO-Midmarket.com (2011). Real-Time Clock (RTC). Retrieved March 25,
2011 from http://searchcio-midmarket.techtarget.com/definition/real-time-clock

61
Sony Ericsson Mobile Communications. (2010). T610 Specifications. Retrieved July
28, 2010, from http://www.sonyericsson.com/cws/products/mobilephones
/specifications/t610?cc=us&lc=en
Temperatures.com (2003). Thermistors. Retrieved March 25, 2011 from
http://www.temperatures.com/thermistors.html
Texas Instruments. (2011). MAX232,MAX232I dual EIA-232 drivers/receivers.
Retrieved March 2, 2011, from http://focus.ti.com/lit/ds/symlink/max232.pdf
Thermometrics. (2011). Platinum Resistance Thermometer. Retrieved March 2, 2011,
from http://www.thermometricscorp.com/platresther.html
Two Dimensional Instruments. (2011). Therma Viewer. The best solution for
monitoring temperature. Retrieved March 25, 2011, from
http://e2di.com/PDFs/White-paper-on-paperless-chart-recorders.htm
United Electronic Industries, Inc. (2010). Data Logger [definition and description].
Retrieved July 10, 2010, from http://www.ueidaq.com/data-logger.html
Unnikrishnan, S., Surve, S., Bhoir, D. (2011). Advances in Computing,
Communication and Control. Mumbai: Springer-Verlag Berlin Heidelberg
Varalakshmi. (2011). Thermocouples. Retrieved March 2, 2011, from
http://www.articlesnatch.com/Article/Thermocouples/1724971
Wheeler, A.J., Ganji, A.R. (2010). Introduction to Engineering Experimentation (3rd
ed). New Jersey: Pearson Higher Education.

62
APPENDICES
APPENDIX A: Project Planning

63