g11.92{0.61 mm1: a keplerian disc around a massive young ... · 2 j. d. ilee et al. circumstellar...
TRANSCRIPT
MNRAS 000, 1–18 (2016) Preprint June 14, 2016 Compiled using MNRAS LATEX style file v3.0
G11.92–0.61 MM1: A Keplerian disc around a massiveyoung proto-O star
J. D. Ilee1?, C. J. Cyganowski2, P. Nazari2, T. R. Hunter3, C. L. Brogan3,
D. H. Forgan2 and Q. Zhang4
1Institute of Astronomy, Madingley Road, Cambridge CB3 0HA, UK2SUPA, School of Physics & Astronomy, University of St Andrews, North Haugh, St Andrews, Scotland, KY16 9SS, UK3NRAO, 520 Edgemont Rd, Charlottesville, VA 22903, USA,4Harvard-Smithsonian Center for Astrophysics, Cambridge, MA 02138, USA
Accepted XXX. Received YYY; in original form ZZZ
ABSTRACTThe formation process of massive stars is not well understood, and ad-vancement in our understanding benefits from high resolution observa-tions and modelling of the gas and dust surrounding individual high-mass(proto)stars. Here we report sub-arcsecond (.1550 au) resolution obser-vations of the young massive star G11.92–0.61 MM1 with the SMA andVLA. Our 1.3 mm SMA observations reveal consistent velocity gradientsin compact molecular line emission from species such as CH3CN, CH3OH,OCS, HNCO, H2CO, DCN and CH3CH2CN, oriented perpendicular to thepreviously-reported bipolar molecular outflow from MM1. Modelling of thecompact gas kinematics suggests a structure undergoing rotation aroundthe peak of the dust continuum emission. The rotational profile can bewell fit by a model of a Keplerian disc, including infall, surrounding anenclosed mass of ∼30–60 M�, of which 2–3 M� is attributed to the disc.From modelling the CH3CN emission, we determine that two temperaturecomponents, of ∼ 150 K and 230 K, are required to adequately reproducethe spectra. Our 0.9 cm and 3.0 cm VLA continuum data exhibit an excessabove the level expected from dust emission, and are well reproduced bya model of an unresolved hyper-compact H ii region. In combination, ourresults suggest that MM1 is an example of a massive proto-O star formingvia disc accretion, in a similar way to that of lower mass stars.
Key words: stars: massive – stars: pre-main-sequence – stars: protostars – submil-limetre: stars – radio continuum: stars – stars: individual: G11.92-0.61
1 INTRODUCTION
Massive stars (M? > 8 M�) have a very short pre-main-sequence phase (∼104 – a few × 105 years, e.g. Davies et al.2011; Mottram et al. 2011), meaning that they spend theentirety of their formation stages deeply embedded in theirparent molecular clouds. Such short formation timescalesalso mean that there are far fewer examples of young, mas-sive stars when compared with their lower mass counter-parts. This inherent scarcity means that young massive starsare, on average, located in much more distant star formingregions (> 1 kpc). All of these factors contribute to the ex-
? Contact e-mail: [email protected]
treme difficulty of observing young massive stars directly. Asa result, their formation mechanisms are poorly understood.
In particular, the process by which young massive starsaccrete their high masses is not known. There is little timeto accumulate such large masses during their short forma-tion timescales, and accretion onto the central object maybe halted or substantially reduced by energetic feedback pro-cesses (such as high radiation pressures, strong stellar windsand ionising radiation). Models have suggested that chan-nelling material through a circumstellar accretion disc canovercome these feedback mechanisms (e.g. Yorke & Sonnhal-ter 2002; Krumholz et al. 2009; Kuiper et al. 2010, 2011;Harries et al. 2014; Klassen et al. 2016).
Observationally, however, it is not yet clear whether
© 2016 The Authors

2 J. D. Ilee et al.
circumstellar accretion discs surround massive young stel-lar objects (MYSOs) of all masses and evolutionary stages.In particular, convincing candidates for Keplerian discsaround embedded O-type (proto)stars are proving to beparticularly elusive (e.g. Cesaroni et al. 2007; Wang et al.2012; Beltran & de Wit 2016, and references therein). In-frared (IR) interferometry (Kraus et al. 2010; Boley et al.2013) and high-resolution near-infrared spectroscopy (Bik& Thi 2004; Davies et al. 2010; Wheelwright et al. 2010;Ilee et al. 2013, 2014) have revealed discs on scales ofless than 1000 au around MYSOs, but these techniquesare limited to relatively evolved, IR-bright objects. Longer-wavelength interferometric observations allow access to thecircum(proto)stellar environments of less evolved, moreembedded MYSOs, but often probe larger spatial scales.In many cases, velocity gradients detected in millime-tre and centimetre-wavelength molecular line observationstrace ‘toroids’ – large-scale (1000s to &10,000 au), massive(Mtoroid ≥ M?), non-equilibrium rotating structures (e.g. Ce-saroni 2005; Cesaroni et al. 2006, 2007; Beuther & Walsh2008; Beltran et al. 2011; Cesaroni et al. 2011; Johnstonet al. 2014, and references therein). The clustered natureof massive star formation also complicates the search foraccretion disc candidates, as multiplicity and rotation canboth produce velocity gradients (c.f. Patel et al. 2005; Bro-gan et al. 2007; Comito et al. 2007), and very high angularresolution observations are required to distinguish betweenthese scenarios.
Searching for small-scale Keplerian accretion discsaround embedded distant MYSOs requires sub-arcsecond-resolution observations with (sub)millimetre interferome-ters. Recent studies of this type have yielded a handfulof candidate Keplerian discs around O-type (proto)stars(Jimenez-Serra et al. 2012; Qiu et al. 2012; Wang et al. 2012;Hunter et al. 2014; Johnston et al. 2015; Zapata et al. 2015),as well as adding to the sample of good candidates for Kep-lerian discs around B-type (proto)stars (e.g. Sanchez-Mongeet al. 2013; Beltran et al. 2014; Cesaroni et al. 2014).
In this paper, we report sub-arcsecond resolution Sub-millimeter Array (SMA) observations of a candidate discaround a high-mass (proto)star, G11.92–0.61 MM1 (here-after MM1), identified in the course of our studies ofGLIMPSE Extended Green Objects (EGOS; Cyganowskiet al. 2008). MM1 is one of three compact millimetre con-tinuum cores detected in thermal dust emission in our ini-tial SMA 1.3 mm observations of the EGO G11.92–0.61(Cyganowski et al. 2011a, resolution ∼2.4′′), which is lo-cated in an infrared dark cloud (IRDC) ∼1′ SE of themore evolved massive star-forming region IRAS 18110–1854.The three members of the G11.92–0.61 (proto)cluster areonly resolved at (sub)millimetre and longer wavelengths(Cyganowski et al. 2011a, 2014); the total luminosity ofthe region is ∼104L�(Cyganowski et al. 2011a; Moscadelliet al. 2016). MM1 exhibits copious molecular line emissionfrom hot-core molecules (Cyganowski et al. 2011a, 2014)and is coincident with a 6.7 GHz Class II CH3OH maser(Cyganowski et al. 2009) and strong H2O masers (Hofner &Churchwell 1996; Breen & Ellingsen 2011; Sato et al. 2014;Moscadelli et al. 2016), all indicative of the presence of amassive (proto)star. MM1 also has a weak (.1 mJy) cm-wavelength counterpart, CM1, first detected at 1.3 cm by
Cyganowski et al. (2011b, 2014) and recently also at 4.8 and2.3 cm by Moscadelli et al. (2016) as part of a Very LargeArray (VLA) survey of BeSSeL H2O maser sources.
Cyganowski et al. (2011a) detected a single dominantbipolar molecular outflow towards the G11.92–0.61 mil-limetre (proto)cluster, driven by MM1 and traced by well-collimated, high-velocity 12CO(2–1) and HCO+(1–0) emis-sion. Near-infrared H2 emission (Lee et al. 2012, 2013) and44 GHz Class I CH3OH masers (Cyganowski et al. 2009)also trace shocked outflow gas. On small (< 1000 au) scales,the H2O maser proper motions indicate a collimated NE-SWflow, consistent with the orientation of the large-scale molec-ular outflow (Cyganowski et al. 2011a, 2014; Moscadelli et al.2016). In our ∼2.4′′-resolution SMA data, the compact, hot-core molecular line emission associated with MM1 displaysa velocity gradient oriented roughly perpendicular to theoutflow axis, leading Cyganowski et al. (2011a) to suggestan unresolved disc as a possible explanation, but requiringhigher angular resolution data for confirmation.
In this paper, we present sub-arcsecond-resolution lineand continuum observations of G11.92-0.61 obtained withthe highest angular resolution possible with the SMA at1.3 mm. Together with new VLA subarcsecond-resolutioncentimetre continuum observations, we use the SMA datato study the molecular gas kinematics of MM1 and toconstrain the nature of the central source. Our observa-tions are summarised in Section 2, and our results in Sec-tion 3. Section 4 presents our modelling of the kinematicsand physical properties of the candidate disc and of thecentimetre-(sub)millimetre wavelength emission from thecentral source, and discusses our results. Our conclusionsare summarised in Section 5. We adopt the maser parallaxdistance to G11.92–0.61 of 3.37+0.39
−0.32 kpc throughout (Satoet al. 2014)
2 OBSERVATIONS
2.1 Submillimeter Array (SMA)
The SMA 1.3 mm Very Extended configuration (VEX)dataset is described in Cyganowski et al. (2014), which usesthese data to study G11.92–0.61 MM2, a candidate mas-sive prestellar core located ∼7.′′2 from MM1 in the G11.92–0.61 millimetre (proto)cluster. The SMA 1.3 mm observa-tions were taken in good weather, with τ225GHz ∼0.05 andsystem temperatures at source transit Tsys ∼90 K; eight an-tennas were available for the observations. Key observa-tional parameters are listed in Table 1. The 1.3 mm linedata were resampled to a common velocity resolution of1.12 km s−1, then Hanning-smoothed. The projected base-lines ranged from ∼20–394 kλ, corresponding to a largestangular scale (for sensitivity to smooth emission) of ∼9′′
(see also Cyganowski et al. 2014). We carefully identifiedthe line-free portions of the spectrum in order to performcontinuum subtraction and to generate a continuum imagewith minimal line contamination. The effective bandwidth ofthe continuum image is approximately two thirds of the to-tal observed bandwidth. All measurements were made fromimages corrected for the primary beam response.
To measure the position angle of the bipolar molecu-lar outflow driven by MM1, we make use of the 12CO(3–
MNRAS 000, 1–18 (2016)
G11.92–0.61 MM1: A Keplerian disc around a massive young proto-O star 3
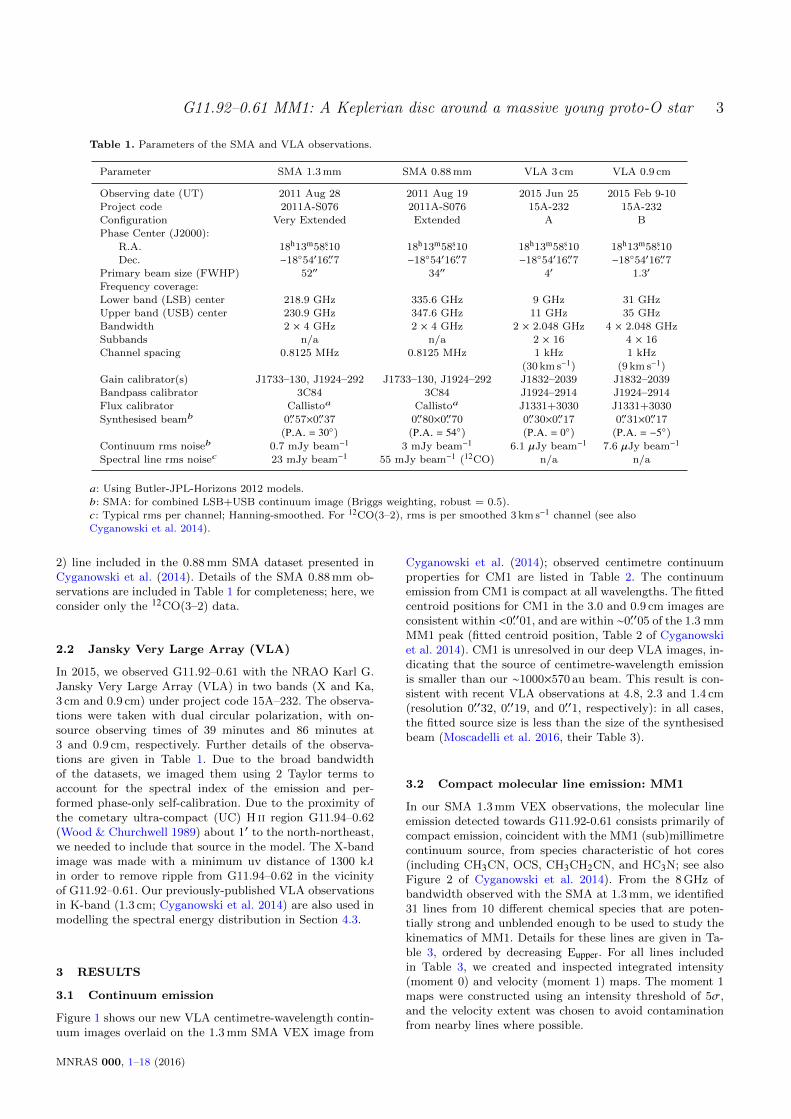
Table 1. Parameters of the SMA and VLA observations.
Parameter SMA 1.3 mm SMA 0.88 mm VLA 3 cm VLA 0.9 cm
Observing date (UT) 2011 Aug 28 2011 Aug 19 2015 Jun 25 2015 Feb 9-10
Project code 2011A-S076 2011A-S076 15A-232 15A-232
Configuration Very Extended Extended A BPhase Center (J2000):
R.A. 18h13m58.s10 18h13m58.s10 18h13m58.s10 18h13m58.s10Dec. −18◦54′16.′′7 −18◦54′16.′′7 −18◦54′16.′′7 −18◦54′16.′′7
Primary beam size (FWHP) 52′′ 34′′ 4′ 1.3′
Frequency coverage:
Lower band (LSB) center 218.9 GHz 335.6 GHz 9 GHz 31 GHz
Upper band (USB) center 230.9 GHz 347.6 GHz 11 GHz 35 GHzBandwidth 2 × 4 GHz 2 × 4 GHz 2 × 2.048 GHz 4 × 2.048 GHz
Subbands n/a n/a 2 × 16 4 × 16
Channel spacing 0.8125 MHz 0.8125 MHz 1 kHz 1 kHz
(30 km s−1) (9 km s−1)
Gain calibrator(s) J1733–130, J1924–292 J1733–130, J1924–292 J1832–2039 J1832–2039Bandpass calibrator 3C84 3C84 J1924–2914 J1924–2914
Flux calibrator Callistoa Callistoa J1331+3030 J1331+3030
Synthesised beamb 0.′′57×0.′′37 0.′′80×0.′′70 0.′′30×0.′′17 0.′′31×0.′′17(P.A. = 30◦) (P.A. = 54◦) (P.A. = 0◦) (P.A. = −5◦)
Continuum rms noiseb 0.7 mJy beam−1 3 mJy beam−1 6.1 µJy beam−1 7.6 µJy beam−1
Spectral line rms noisec 23 mJy beam−1 55 mJy beam−1 (12CO) n/a n/a
a: Using Butler-JPL-Horizons 2012 models.b: SMA: for combined LSB+USB continuum image (Briggs weighting, robust = 0.5).
c: Typical rms per channel; Hanning-smoothed. For 12CO(3–2), rms is per smoothed 3 km s−1 channel (see also
Cyganowski et al. 2014).
2) line included in the 0.88 mm SMA dataset presented inCyganowski et al. (2014). Details of the SMA 0.88 mm ob-servations are included in Table 1 for completeness; here, weconsider only the 12CO(3–2) data.
2.2 Jansky Very Large Array (VLA)
In 2015, we observed G11.92–0.61 with the NRAO Karl G.Jansky Very Large Array (VLA) in two bands (X and Ka,3 cm and 0.9 cm) under project code 15A–232. The observa-tions were taken with dual circular polarization, with on-source observing times of 39 minutes and 86 minutes at3 and 0.9 cm, respectively. Further details of the observa-tions are given in Table 1. Due to the broad bandwidthof the datasets, we imaged them using 2 Taylor terms toaccount for the spectral index of the emission and per-formed phase-only self-calibration. Due to the proximity ofthe cometary ultra-compact (UC) H ii region G11.94–0.62(Wood & Churchwell 1989) about 1′ to the north-northeast,we needed to include that source in the model. The X-bandimage was made with a minimum uv distance of 1300 kλin order to remove ripple from G11.94–0.62 in the vicinityof G11.92–0.61. Our previously-published VLA observationsin K-band (1.3 cm; Cyganowski et al. 2014) are also used inmodelling the spectral energy distribution in Section 4.3.
3 RESULTS
3.1 Continuum emission
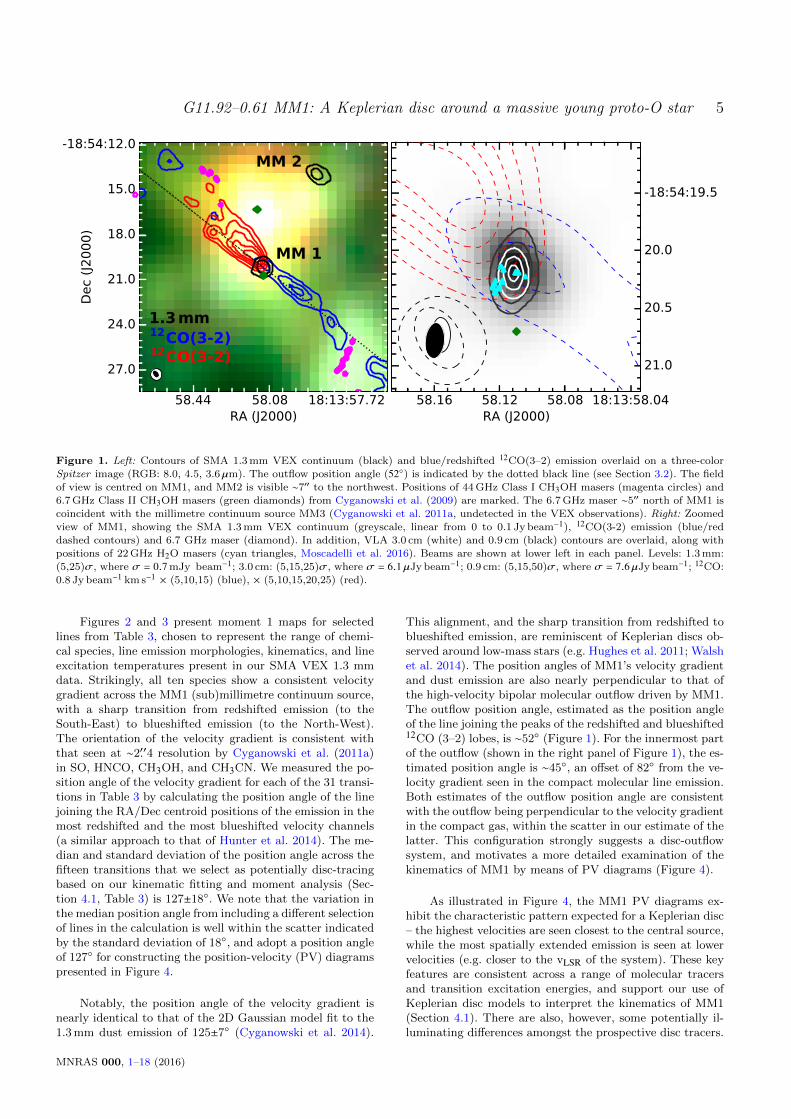
Figure 1 shows our new VLA centimetre-wavelength contin-uum images overlaid on the 1.3 mm SMA VEX image from
Cyganowski et al. (2014); observed centimetre continuumproperties for CM1 are listed in Table 2. The continuumemission from CM1 is compact at all wavelengths. The fittedcentroid positions for CM1 in the 3.0 and 0.9 cm images areconsistent within <0.′′01, and are within ∼0.′′05 of the 1.3 mmMM1 peak (fitted centroid position, Table 2 of Cyganowskiet al. 2014). CM1 is unresolved in our deep VLA images, in-dicating that the source of centimetre-wavelength emissionis smaller than our ∼1000×570 au beam. This result is con-sistent with recent VLA observations at 4.8, 2.3 and 1.4 cm(resolution 0.′′32, 0.′′19, and 0.′′1, respectively): in all cases,the fitted source size is less than the size of the synthesisedbeam (Moscadelli et al. 2016, their Table 3).
3.2 Compact molecular line emission: MM1
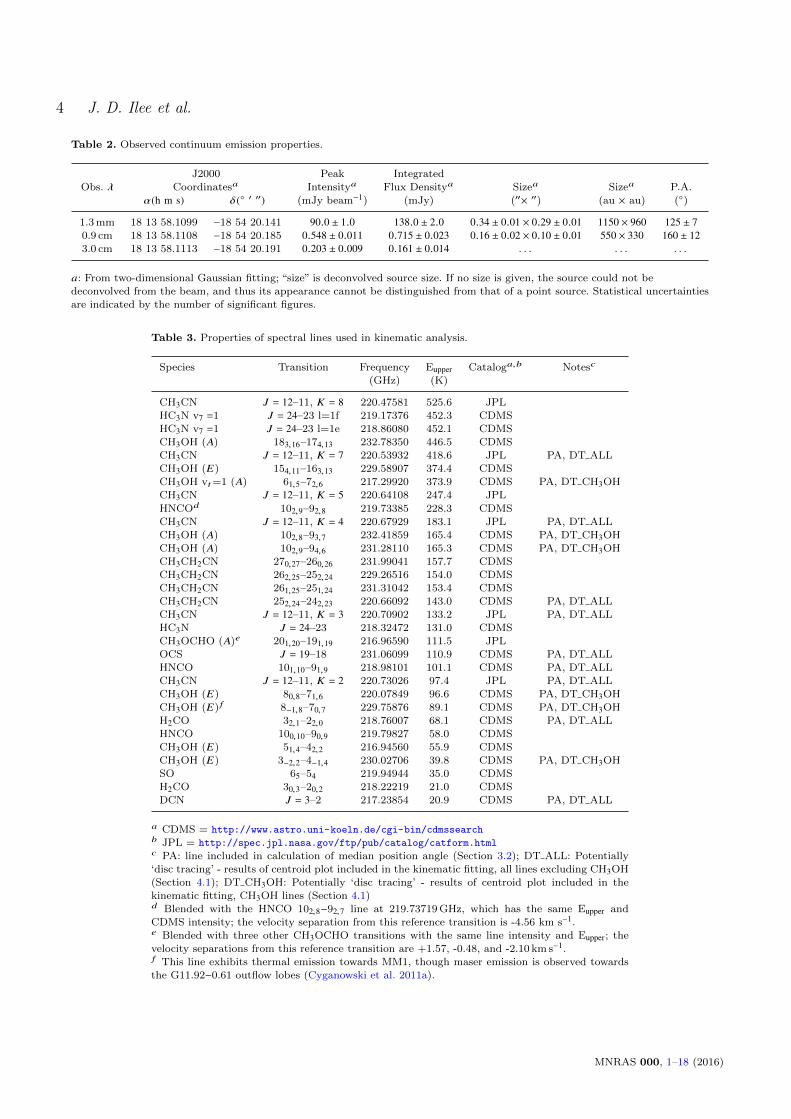
In our SMA 1.3 mm VEX observations, the molecular lineemission detected towards G11.92-0.61 consists primarily ofcompact emission, coincident with the MM1 (sub)millimetrecontinuum source, from species characteristic of hot cores(including CH3CN, OCS, CH3CH2CN, and HC3N; see alsoFigure 2 of Cyganowski et al. 2014). From the 8 GHz ofbandwidth observed with the SMA at 1.3 mm, we identified31 lines from 10 different chemical species that are poten-tially strong and unblended enough to be used to study thekinematics of MM1. Details for these lines are given in Ta-ble 3, ordered by decreasing Eupper. For all lines includedin Table 3, we created and inspected integrated intensity(moment 0) and velocity (moment 1) maps. The moment 1maps were constructed using an intensity threshold of 5σ,and the velocity extent was chosen to avoid contaminationfrom nearby lines where possible.
MNRAS 000, 1–18 (2016)
4 J. D. Ilee et al.
Table 2. Observed continuum emission properties.
J2000 Peak Integrated
Obs. λ Coordinatesa Intensitya Flux Densitya Sizea Sizea P.A.
α(h m s) δ(◦ ′ ′′) (mJy beam−1) (mJy) (′′× ′′) (au × au) (◦)
1.3 mm 18 13 58.1099 −18 54 20.141 90.0 ± 1.0 138.0 ± 2.0 0.34 ± 0.01 × 0.29 ± 0.01 1150 × 960 125 ± 70.9 cm 18 13 58.1108 −18 54 20.185 0.548 ± 0.011 0.715 ± 0.023 0.16 ± 0.02 × 0.10 ± 0.01 550 × 330 160 ± 123.0 cm 18 13 58.1113 −18 54 20.191 0.203 ± 0.009 0.161 ± 0.014 . . . . . . . . .
a: From two-dimensional Gaussian fitting; “size” is deconvolved source size. If no size is given, the source could not be
deconvolved from the beam, and thus its appearance cannot be distinguished from that of a point source. Statistical uncertainties
are indicated by the number of significant figures.
Table 3. Properties of spectral lines used in kinematic analysis.
Species Transition Frequency Eupper Cataloga,b Notesc
(GHz) (K)
CH3CN J = 12–11, K = 8 220.47581 525.6 JPL
HC3N v7 =1 J = 24–23 l=1f 219.17376 452.3 CDMSHC3N v7 =1 J = 24–23 l=1e 218.86080 452.1 CDMS
CH3OH (A) 183,16–174,13 232.78350 446.5 CDMS
CH3CN J = 12–11, K = 7 220.53932 418.6 JPL PA, DT ALL
CH3OH (E) 154,11–163,13 229.58907 374.4 CDMS
CH3OH vt=1 (A) 61,5–72,6 217.29920 373.9 CDMS PA, DT CH3OHCH3CN J = 12–11, K = 5 220.64108 247.4 JPL
HNCOd 102,9–92,8 219.73385 228.3 CDMS
CH3CN J = 12–11, K = 4 220.67929 183.1 JPL PA, DT ALLCH3OH (A) 102,8–93,7 232.41859 165.4 CDMS PA, DT CH3OH
CH3OH (A) 102,9–94,6 231.28110 165.3 CDMS PA, DT CH3OH
CH3CH2CN 270,27–260,26 231.99041 157.7 CDMSCH3CH2CN 262,25–252,24 229.26516 154.0 CDMS
CH3CH2CN 261,25–251,24 231.31042 153.4 CDMSCH3CH2CN 252,24–242,23 220.66092 143.0 CDMS PA, DT ALL
CH3CN J = 12–11, K = 3 220.70902 133.2 JPL PA, DT ALL
HC3N J = 24–23 218.32472 131.0 CDMSCH3OCHO (A)e 201,20–191,19 216.96590 111.5 JPL
OCS J = 19–18 231.06099 110.9 CDMS PA, DT ALL
HNCO 101,10–91,9 218.98101 101.1 CDMS PA, DT ALLCH3CN J = 12–11, K = 2 220.73026 97.4 JPL PA, DT ALL
CH3OH (E) 80,8–71,6 220.07849 96.6 CDMS PA, DT CH3OH
CH3OH (E) f 8−1,8–70,7 229.75876 89.1 CDMS PA, DT CH3OH
H2CO 32,1–22,0 218.76007 68.1 CDMS PA, DT ALL
HNCO 100,10–90,9 219.79827 58.0 CDMSCH3OH (E) 51,4–42,2 216.94560 55.9 CDMS
CH3OH (E) 3−2,2–4−1,4 230.02706 39.8 CDMS PA, DT CH3OH
SO 65–54 219.94944 35.0 CDMSH2CO 30,3–20,2 218.22219 21.0 CDMS
DCN J = 3–2 217.23854 20.9 CDMS PA, DT ALL
a CDMS = http://www.astro.uni-koeln.de/cgi-bin/cdmssearchb JPL = http://spec.jpl.nasa.gov/ftp/pub/catalog/catform.htmlc PA: line included in calculation of median position angle (Section 3.2); DT ALL: Potentially
‘disc tracing’ - results of centroid plot included in the kinematic fitting, all lines excluding CH3OH(Section 4.1); DT CH3OH: Potentially ‘disc tracing’ - results of centroid plot included in the
kinematic fitting, CH3OH lines (Section 4.1)d Blended with the HNCO 102,8−92,7 line at 219.73719 GHz, which has the same Eupper and
CDMS intensity; the velocity separation from this reference transition is -4.56 km s−1.e Blended with three other CH3OCHO transitions with the same line intensity and Eupper; thevelocity separations from this reference transition are +1.57, -0.48, and -2.10 km s−1.f This line exhibits thermal emission towards MM1, though maser emission is observed towards
the G11.92−0.61 outflow lobes (Cyganowski et al. 2011a).
MNRAS 000, 1–18 (2016)
G11.92–0.61 MM1: A Keplerian disc around a massive young proto-O star 5
18:13:57.7258.0858.44RA (J2000)
27.0
24.0
21.0
18.0
15.0
-18:54:12.0
Dec
(J2000)
1.3mm12CO(3-2)12CO(3-2)
MM 1
MM 2
21.0
20.5
20.0
-18:54:19.5
18:13:58.0458.0858.1258.16RA (J2000)
Figure 1. Left: Contours of SMA 1.3 mm VEX continuum (black) and blue/redshifted 12CO(3–2) emission overlaid on a three-color
Spitzer image (RGB: 8.0, 4.5, 3.6 µm). The outflow position angle (52◦) is indicated by the dotted black line (see Section 3.2). The fieldof view is centred on MM1, and MM2 is visible ∼7′′ to the northwest. Positions of 44 GHz Class I CH3OH masers (magenta circles) and
6.7 GHz Class II CH3OH masers (green diamonds) from Cyganowski et al. (2009) are marked. The 6.7 GHz maser ∼5′′ north of MM1 is
coincident with the millimetre continuum source MM3 (Cyganowski et al. 2011a, undetected in the VEX observations). Right: Zoomedview of MM1, showing the SMA 1.3 mm VEX continuum (greyscale, linear from 0 to 0.1 Jy beam−1), 12CO(3-2) emission (blue/red
dashed contours) and 6.7 GHz maser (diamond). In addition, VLA 3.0 cm (white) and 0.9 cm (black) contours are overlaid, along with
positions of 22 GHz H2O masers (cyan triangles, Moscadelli et al. 2016). Beams are shown at lower left in each panel. Levels: 1.3 mm:(5,25)σ, where σ = 0.7 mJy beam−1; 3.0 cm: (5,15,25)σ, where σ = 6.1 µJy beam−1; 0.9 cm: (5,15,50)σ, where σ = 7.6 µJy beam−1; 12CO:
0.8 Jy beam−1 km s−1 × (5,10,15) (blue), × (5,10,15,20,25) (red).
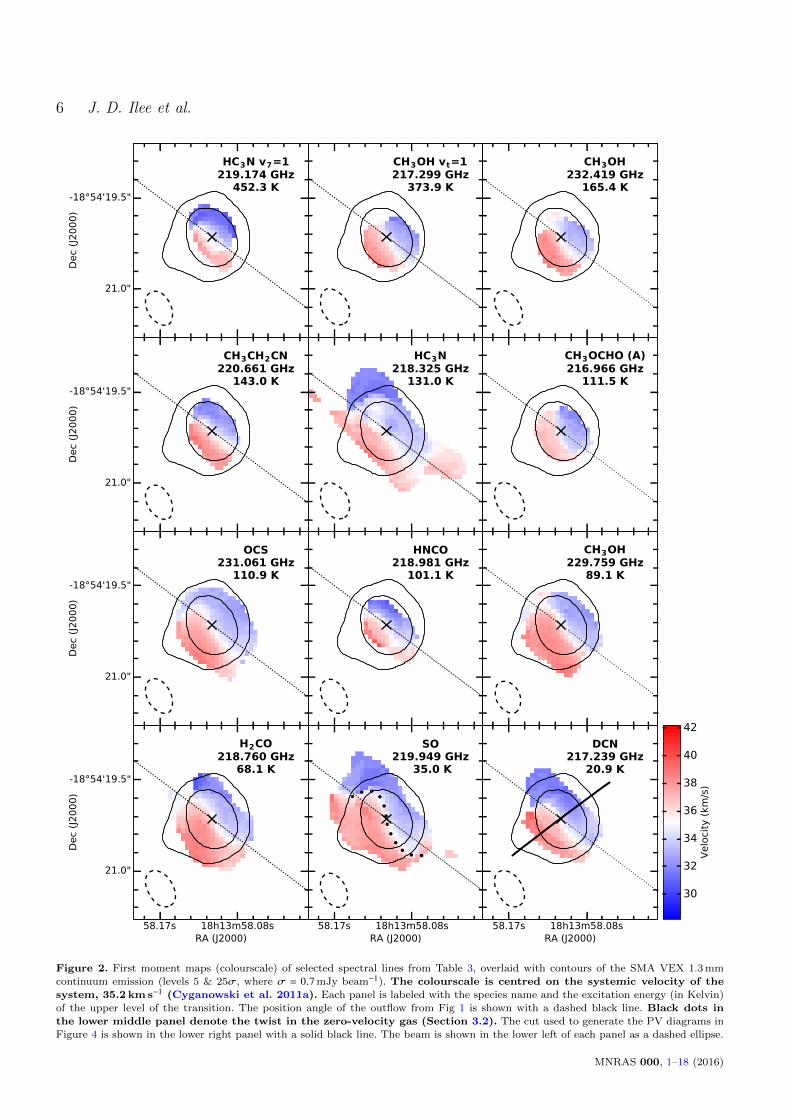
Figures 2 and 3 present moment 1 maps for selectedlines from Table 3, chosen to represent the range of chemi-cal species, line emission morphologies, kinematics, and lineexcitation temperatures present in our SMA VEX 1.3 mmdata. Strikingly, all ten species show a consistent velocitygradient across the MM1 (sub)millimetre continuum source,with a sharp transition from redshifted emission (to theSouth-East) to blueshifted emission (to the North-West).The orientation of the velocity gradient is consistent withthat seen at ∼2.′′4 resolution by Cyganowski et al. (2011a)in SO, HNCO, CH3OH, and CH3CN. We measured the po-sition angle of the velocity gradient for each of the 31 transi-tions in Table 3 by calculating the position angle of the linejoining the RA/Dec centroid positions of the emission in themost redshifted and the most blueshifted velocity channels(a similar approach to that of Hunter et al. 2014). The me-dian and standard deviation of the position angle across thefifteen transitions that we select as potentially disc-tracingbased on our kinematic fitting and moment analysis (Sec-tion 4.1, Table 3) is 127±18◦. We note that the variation inthe median position angle from including a different selectionof lines in the calculation is well within the scatter indicatedby the standard deviation of 18◦, and adopt a position angleof 127◦ for constructing the position-velocity (PV) diagramspresented in Figure 4.
Notably, the position angle of the velocity gradient isnearly identical to that of the 2D Gaussian model fit to the1.3 mm dust emission of 125±7◦ (Cyganowski et al. 2014).
This alignment, and the sharp transition from redshifted toblueshifted emission, are reminiscent of Keplerian discs ob-served around low-mass stars (e.g. Hughes et al. 2011; Walshet al. 2014). The position angles of MM1’s velocity gradientand dust emission are also nearly perpendicular to that ofthe high-velocity bipolar molecular outflow driven by MM1.The outflow position angle, estimated as the position angleof the line joining the peaks of the redshifted and blueshifted12CO (3–2) lobes, is ∼52◦ (Figure 1). For the innermost partof the outflow (shown in the right panel of Figure 1), the es-timated position angle is ∼45◦, an offset of 82◦ from the ve-locity gradient seen in the compact molecular line emission.Both estimates of the outflow position angle are consistentwith the outflow being perpendicular to the velocity gradientin the compact gas, within the scatter in our estimate of thelatter. This configuration strongly suggests a disc-outflowsystem, and motivates a more detailed examination of thekinematics of MM1 by means of PV diagrams (Figure 4).
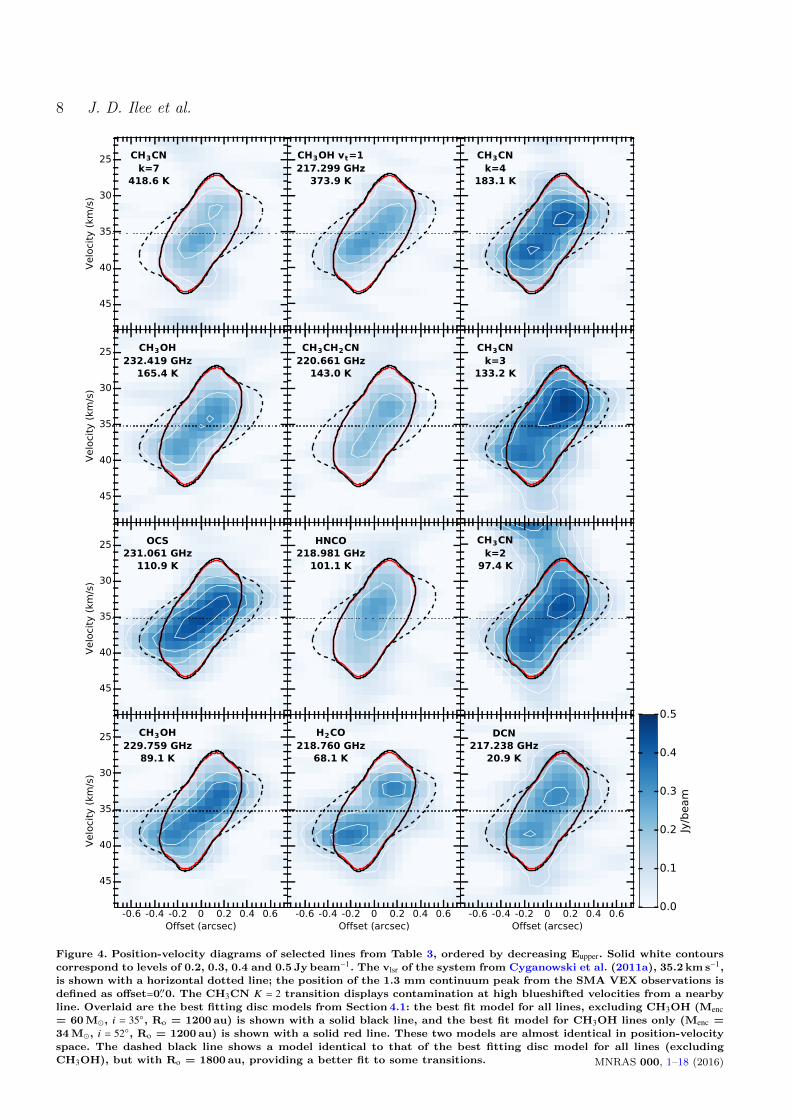
As illustrated in Figure 4, the MM1 PV diagrams ex-hibit the characteristic pattern expected for a Keplerian disc– the highest velocities are seen closest to the central source,while the most spatially extended emission is seen at lowervelocities (e.g. closer to the vLSR of the system). These keyfeatures are consistent across a range of molecular tracersand transition excitation energies, and support our use ofKeplerian disc models to interpret the kinematics of MM1(Section 4.1). There are also, however, some potentially il-luminating differences amongst the prospective disc tracers.
MNRAS 000, 1–18 (2016)
6 J. D. Ilee et al.
Figure 2. First moment maps (colourscale) of selected spectral lines from Table 3, overlaid with contours of the SMA VEX 1.3 mm
continuum emission (levels 5 & 25σ, where σ = 0.7 mJy beam−1). The colourscale is centred on the systemic velocity of thesystem, 35.2 km s−1 (Cyganowski et al. 2011a). Each panel is labeled with the species name and the excitation energy (in Kelvin)
of the upper level of the transition. The position angle of the outflow from Fig 1 is shown with a dashed black line. Black dots inthe lower middle panel denote the twist in the zero-velocity gas (Section 3.2). The cut used to generate the PV diagrams in
Figure 4 is shown in the lower right panel with a solid black line. The beam is shown in the lower left of each panel as a dashed ellipse.
MNRAS 000, 1–18 (2016)
G11.92–0.61 MM1: A Keplerian disc around a massive young proto-O star 7
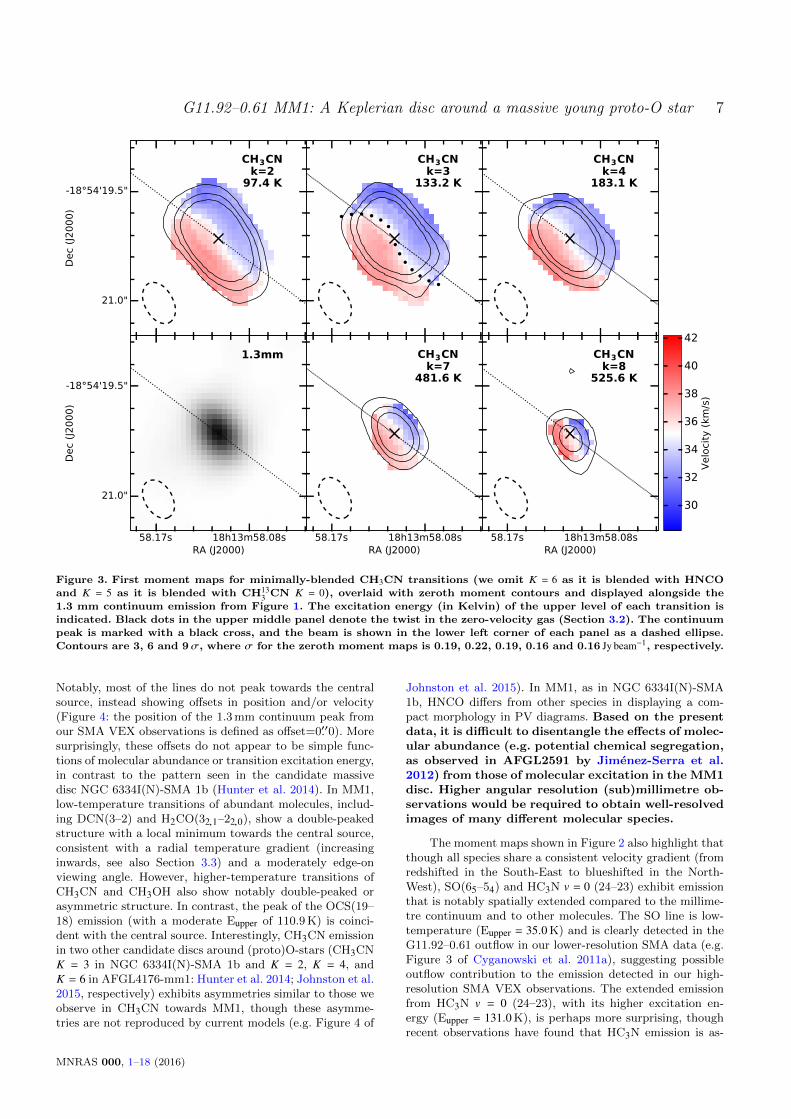
Figure 3. First moment maps for minimally-blended CH3CN transitions (we omit K = 6 as it is blended with HNCO
and K = 5 as it is blended with CH133 CN K = 0), overlaid with zeroth moment contours and displayed alongside the
1.3 mm continuum emission from Figure 1. The excitation energy (in Kelvin) of the upper level of each transition isindicated. Black dots in the upper middle panel denote the twist in the zero-velocity gas (Section 3.2). The continuum
peak is marked with a black cross, and the beam is shown in the lower left corner of each panel as a dashed ellipse.
Contours are 3, 6 and 9σ, where σ for the zeroth moment maps is 0.19, 0.22, 0.19, 0.16 and 0.16 Jy beam−1, respectively.
Notably, most of the lines do not peak towards the centralsource, instead showing offsets in position and/or velocity(Figure 4: the position of the 1.3 mm continuum peak fromour SMA VEX observations is defined as offset=0.′′0). Moresurprisingly, these offsets do not appear to be simple func-tions of molecular abundance or transition excitation energy,in contrast to the pattern seen in the candidate massivedisc NGC 6334I(N)-SMA 1b (Hunter et al. 2014). In MM1,low-temperature transitions of abundant molecules, includ-ing DCN(3–2) and H2CO(32,1–22,0), show a double-peakedstructure with a local minimum towards the central source,consistent with a radial temperature gradient (increasinginwards, see also Section 3.3) and a moderately edge-onviewing angle. However, higher-temperature transitions ofCH3CN and CH3OH also show notably double-peaked orasymmetric structure. In contrast, the peak of the OCS(19–18) emission (with a moderate Eupper of 110.9 K) is coinci-dent with the central source. Interestingly, CH3CN emissionin two other candidate discs around (proto)O-stars (CH3CNK = 3 in NGC 6334I(N)-SMA 1b and K = 2, K = 4, andK = 6 in AFGL4176-mm1: Hunter et al. 2014; Johnston et al.2015, respectively) exhibits asymmetries similar to those weobserve in CH3CN towards MM1, though these asymme-tries are not reproduced by current models (e.g. Figure 4 of
Johnston et al. 2015). In MM1, as in NGC 6334I(N)-SMA1b, HNCO differs from other species in displaying a com-pact morphology in PV diagrams. Based on the presentdata, it is difficult to disentangle the effects of molec-ular abundance (e.g. potential chemical segregation,as observed in AFGL2591 by Jimenez-Serra et al.2012) from those of molecular excitation in the MM1disc. Higher angular resolution (sub)millimetre ob-servations would be required to obtain well-resolvedimages of many different molecular species.
The moment maps shown in Figure 2 also highlight thatthough all species share a consistent velocity gradient (fromredshifted in the South-East to blueshifted in the North-West), SO(65–54) and HC3N v = 0 (24–23) exhibit emissionthat is notably spatially extended compared to the millime-tre continuum and to other molecules. The SO line is low-temperature (Eupper = 35.0 K) and is clearly detected in theG11.92–0.61 outflow in our lower-resolution SMA data (e.g.Figure 3 of Cyganowski et al. 2011a), suggesting possibleoutflow contribution to the emission detected in our high-resolution SMA VEX observations. The extended emissionfrom HC3N v = 0 (24–23), with its higher excitation en-ergy (Eupper = 131.0 K), is perhaps more surprising, thoughrecent observations have found that HC3N emission is as-
MNRAS 000, 1–18 (2016)
8 J. D. Ilee et al.
-0.6 -0.4 -0.2 0 0.2 0.4 0.6Offset (arcsec)
25
30
35
40
45
Velo
city
(km
/s)
CH3OH229.759 GHz
89.1 K
-0.6 -0.4 -0.2 0 0.2 0.4 0.6Offset (arcsec)
H2CO218.760 GHz
68.1 K
-0.6 -0.4 -0.2 0 0.2 0.4 0.6Offset (arcsec)
DCN217.238 GHz
20.9 K
25
30
35
40
45
Velo
city
(km
/s)
OCS231.061 GHz
110.9 K
HNCO218.981 GHz
101.1 K
CH3CNk=2
97.4 K
25
30
35
40
45
Velo
city
(km
/s)
CH3OH232.419 GHz
165.4 K
CH3CH2CN220.661 GHz
143.0 K
CH3CNk=3
133.2 K
25
30
35
40
45
Velo
city
(km
/s)
CH3CNk=7
418.6 K
CH3OH vt=1217.299 GHz
373.9 K
CH3CNk=4
183.1 K
0.0
0.1
0.2
0.3
0.4
0.5
Jy/b
eam
Figure 4. Position-velocity diagrams of selected lines from Table 3, ordered by decreasing Eupper. Solid white contourscorrespond to levels of 0.2, 0.3, 0.4 and 0.5 Jy beam−1. The vlsr of the system from Cyganowski et al. (2011a), 35.2 km s−1,is shown with a horizontal dotted line; the position of the 1.3 mm continuum peak from the SMA VEX observations isdefined as offset=0.′′0. The CH3CN K = 2 transition displays contamination at high blueshifted velocities from a nearby
line. Overlaid are the best fitting disc models from Section 4.1: the best fit model for all lines, excluding CH3OH (Menc= 60 M�, i = 35◦, Ro = 1200 au) is shown with a solid black line, and the best fit model for CH3OH lines only (Menc =34 M�, i = 52◦, Ro = 1200 au) is shown with a solid red line. These two models are almost identical in position-velocity
space. The dashed black line shows a model identical to that of the best fitting disc model for all lines (excludingCH3OH), but with Ro = 1800 au, providing a better fit to some transitions. MNRAS 000, 1–18 (2016)
G11.92–0.61 MM1: A Keplerian disc around a massive young proto-O star 9
sociated with gas shocked by outflows driven by low-mass(proto)stars (e.g. Shimajiri et al. 2015; Benedettini et al.2013). Within ∼10 km s−1 of the systemic velocity (e.g., therange shown in Figure 2), the kinematics of outflow-tracingmolecules such as 12CO and HCO+ are very confused, withboth redshifted and blueshifted emission detected to boththe NE and SW of MM1 (e.g. Figures 7 and 8 of Cyganowskiet al. 2011a). It is thus plausible that (the base of) the MM1outflow contributes to the SO and HC3N emission detectedin our SMA VEX observations. In addition, given theapparent elongation along the outflow axis in mo-ment 0 maps of many of the lines examined, it is alsopossible that the base of the outflow contributes tomore lines, though we note that as the beam is elon-gated in a similar direction, this effect is difficult toquantify with our current observations.
Several of the moment 1 maps (e.g. CH3CNK = 2, 3, 4, OCS(19–18), H2CO(32,1–22,0), SO(65 –54), OCS(19–18) and DCN(3–2)) also exhibit an in-terestingly asymmetric feature: a twisted structurethat is mostly clearly seen by examining the gasmoving at the systemic velocity (white in Figures2 & 3, marked with black dots). Based on the orien-tation of the blue- and red-shifted emission (i.e. inopposition to the movement of the outflowing ma-terial), we suggest that this twisting is likely due tothe effect of infalling material. Such an interpreta-tion is also strengthened by the requirement of aninfall component to be used in our modelling of thePV diagrams (see Figure 4 and Section 4.1)
3.3 Extent of gas and dust emission in the disc
The thermal dust emission from MM1 is unresolved in ourSMA 1.3 mm VEX observations, with a fitted deconvolvedsource size of 1150×960 au (Cyganowski et al. 2014). In con-trast, the molecular line emission from the disc is marginallyresolved in some lower-excitation transitions. For example,for the blended K = 0 and K = 1 components of CH3CN(12–11), the deconvolved size of the 2D Gaussian fit to the mo-ment 0 map is 0.′′80±0.′′06× 0.′′53±0.′′04 (P.A. = 47 ± 8), or∼ 2700×1800 au. The CH3CN ladder is of particular interest,as the relative spatial extents of the different k-componentsare expected to depend primarily on gas temperature. Fig-ure 3 presents contours of integrated intensity for the K = 2,K = 3, K = 4, K = 7, and K = 8 transitions of CH3CN(12–11), which range in excitation energy from Eupper = 97.4 –525.6 K, overlaid on the moment 1 maps of these transitions(we omit K = 0 and K = 1 because they are blended witheach other, K = 6 because it is blended with HNCO(101,9-91,8 at 220.585 GHz, and K = 5 because it is blended
with CH133 CN K=0). As illustrated by Figure 3, all tran-
sitions display a similar velocity gradient, but the low-k,low-excitation transitions of CH3CN are significantly moreextended than the high-k, high-excitation transitions. Thispattern of decreasing spatial extent with increasing excita-tion energy is suggestive of an increasing temperature gra-dient towards a central source. The temperature structureof the gas around MM1, as determined from modelling theCH3CN emission, is discussed further in Section 4.2.
To investigate the differing extents of the dust and gas
0.0 0.2 0.4 0.6 0.8 1.0Radius (arcsec)
0.0
0.2
0.4
0.6
0.8
1.0
Norm
alis
ed Inte
nsi
ty
CH3CN K=3
1. 3 mm
0 500 1000 1500 2000 2500 3000Radius (au)
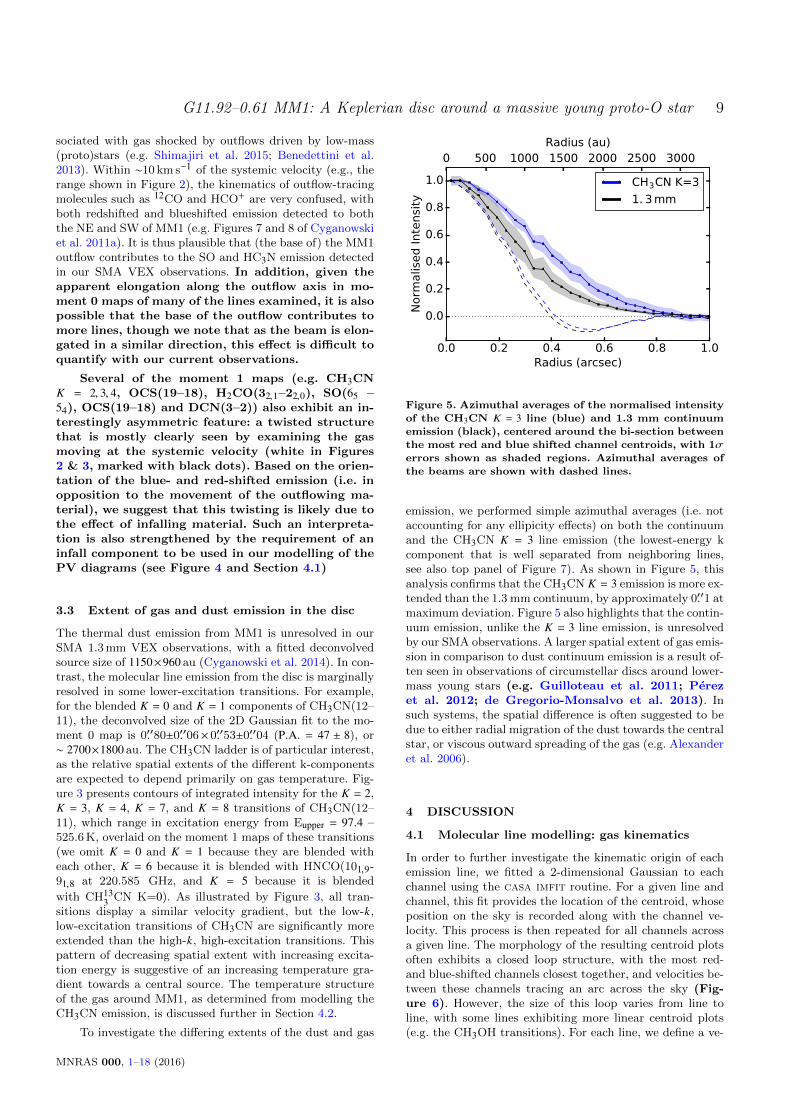
Figure 5. Azimuthal averages of the normalised intensityof the CH3CN K = 3 line (blue) and 1.3 mm continuum
emission (black), centered around the bi-section between
the most red and blue shifted channel centroids, with 1σerrors shown as shaded regions. Azimuthal averages of
the beams are shown with dashed lines.
emission, we performed simple azimuthal averages (i.e. notaccounting for any ellipicity effects) on both the continuumand the CH3CN K = 3 line emission (the lowest-energy kcomponent that is well separated from neighboring lines,see also top panel of Figure 7). As shown in Figure 5, thisanalysis confirms that the CH3CN K = 3 emission is more ex-tended than the 1.3 mm continuum, by approximately 0.′′1 atmaximum deviation. Figure 5 also highlights that the contin-uum emission, unlike the K = 3 line emission, is unresolvedby our SMA observations. A larger spatial extent of gas emis-sion in comparison to dust continuum emission is a result of-ten seen in observations of circumstellar discs around lower-mass young stars (e.g. Guilloteau et al. 2011; Perezet al. 2012; de Gregorio-Monsalvo et al. 2013). Insuch systems, the spatial difference is often suggested to bedue to either radial migration of the dust towards the centralstar, or viscous outward spreading of the gas (e.g. Alexanderet al. 2006).
4 DISCUSSION
4.1 Molecular line modelling: gas kinematics
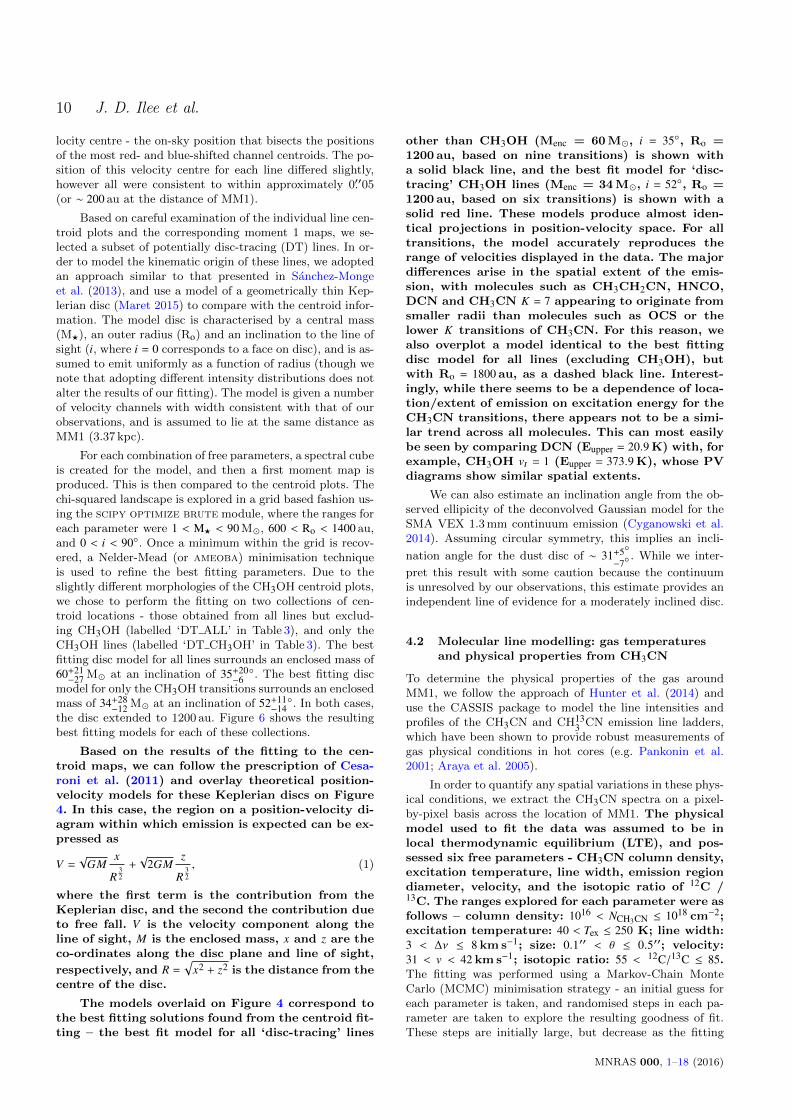
In order to further investigate the kinematic origin of eachemission line, we fitted a 2-dimensional Gaussian to eachchannel using the casa imfit routine. For a given line andchannel, this fit provides the location of the centroid, whoseposition on the sky is recorded along with the channel ve-locity. This process is then repeated for all channels acrossa given line. The morphology of the resulting centroid plotsoften exhibits a closed loop structure, with the most red-and blue-shifted channels closest together, and velocities be-tween these channels tracing an arc across the sky (Fig-ure 6). However, the size of this loop varies from line toline, with some lines exhibiting more linear centroid plots(e.g. the CH3OH transitions). For each line, we define a ve-
MNRAS 000, 1–18 (2016)
10 J. D. Ilee et al.
locity centre - the on-sky position that bisects the positionsof the most red- and blue-shifted channel centroids. The po-sition of this velocity centre for each line differed slightly,however all were consistent to within approximately 0.′′05(or ∼ 200 au at the distance of MM1).
Based on careful examination of the individual line cen-troid plots and the corresponding moment 1 maps, we se-lected a subset of potentially disc-tracing (DT) lines. In or-der to model the kinematic origin of these lines, we adoptedan approach similar to that presented in Sanchez-Mongeet al. (2013), and use a model of a geometrically thin Kep-lerian disc (Maret 2015) to compare with the centroid infor-mation. The model disc is characterised by a central mass(M?), an outer radius (Ro) and an inclination to the line ofsight (i, where i = 0 corresponds to a face on disc), and is as-sumed to emit uniformly as a function of radius (though wenote that adopting different intensity distributions does notalter the results of our fitting). The model is given a numberof velocity channels with width consistent with that of ourobservations, and is assumed to lie at the same distance asMM1 (3.37 kpc).
For each combination of free parameters, a spectral cubeis created for the model, and then a first moment map isproduced. This is then compared to the centroid plots. Thechi-squared landscape is explored in a grid based fashion us-ing the scipy optimize brute module, where the ranges foreach parameter were 1 < M? < 90 M�, 600 < Ro < 1400 au,and 0 < i < 90◦. Once a minimum within the grid is recov-ered, a Nelder-Mead (or ameoba) minimisation techniqueis used to refine the best fitting parameters. Due to theslightly different morphologies of the CH3OH centroid plots,we chose to perform the fitting on two collections of cen-troid locations - those obtained from all lines but exclud-ing CH3OH (labelled ‘DT ALL’ in Table 3), and only theCH3OH lines (labelled ‘DT CH3OH’ in Table 3). The bestfitting disc model for all lines surrounds an enclosed mass of60+21−27 M� at an inclination of 35+20
−6◦. The best fitting disc
model for only the CH3OH transitions surrounds an enclosedmass of 34+28
−12 M� at an inclination of 52+11−14◦. In both cases,
the disc extended to 1200 au. Figure 6 shows the resultingbest fitting models for each of these collections.
Based on the results of the fitting to the cen-troid maps, we can follow the prescription of Cesa-roni et al. (2011) and overlay theoretical position-velocity models for these Keplerian discs on Figure4. In this case, the region on a position-velocity di-agram within which emission is expected can be ex-pressed as
V =√
GMx
R32+√
2GMz
R32, (1)
where the first term is the contribution from theKeplerian disc, and the second the contribution dueto free fall. V is the velocity component along theline of sight, M is the enclosed mass, x and z are theco-ordinates along the disc plane and line of sight,
respectively, and R =√
x2 + z2 is the distance from thecentre of the disc.
The models overlaid on Figure 4 correspond tothe best fitting solutions found from the centroid fit-ting – the best fit model for all ‘disc-tracing’ lines
other than CH3OH (Menc = 60 M�, i = 35◦, Ro =1200 au, based on nine transitions) is shown witha solid black line, and the best fit model for ‘disc-tracing’ CH3OH lines (Menc = 34 M�, i = 52◦, Ro =1200 au, based on six transitions) is shown with asolid red line. These models produce almost iden-tical projections in position-velocity space. For alltransitions, the model accurately reproduces therange of velocities displayed in the data. The majordifferences arise in the spatial extent of the emis-sion, with molecules such as CH3CH2CN, HNCO,DCN and CH3CN K = 7 appearing to originate fromsmaller radii than molecules such as OCS or thelower K transitions of CH3CN. For this reason, wealso overplot a model identical to the best fittingdisc model for all lines (excluding CH3OH), butwith Ro = 1800 au, as a dashed black line. Interest-ingly, while there seems to be a dependence of loca-tion/extent of emission on excitation energy for theCH3CN transitions, there appears not to be a simi-lar trend across all molecules. This can most easilybe seen by comparing DCN (Eupper = 20.9 K) with, forexample, CH3OH vt = 1 (Eupper = 373.9 K), whose PVdiagrams show similar spatial extents.
We can also estimate an inclination angle from the ob-served ellipicity of the deconvolved Gaussian model for theSMA VEX 1.3 mm continuum emission (Cyganowski et al.2014). Assuming circular symmetry, this implies an incli-
nation angle for the dust disc of ∼ 31+5◦−7◦
. While we inter-
pret this result with some caution because the continuumis unresolved by our observations, this estimate provides anindependent line of evidence for a moderately inclined disc.
4.2 Molecular line modelling: gas temperaturesand physical properties from CH3CN
To determine the physical properties of the gas aroundMM1, we follow the approach of Hunter et al. (2014) anduse the CASSIS package to model the line intensities andprofiles of the CH3CN and CH13
3 CN emission line ladders,which have been shown to provide robust measurements ofgas physical conditions in hot cores (e.g. Pankonin et al.2001; Araya et al. 2005).
In order to quantify any spatial variations in these phys-ical conditions, we extract the CH3CN spectra on a pixel-by-pixel basis across the location of MM1. The physicalmodel used to fit the data was assumed to be inlocal thermodynamic equilibrium (LTE), and pos-sessed six free parameters - CH3CN column density,excitation temperature, line width, emission regiondiameter, velocity, and the isotopic ratio of 12C /13C. The ranges explored for each parameter were asfollows – column density: 1016 < NCH3CN ≤ 1018 cm−2;excitation temperature: 40 < Tex ≤ 250 K; line width:3 < ∆ν ≤ 8 km s−1; size: 0.1′′ < θ ≤ 0.5′′; velocity:31 < v < 42 km s−1; isotopic ratio: 55 < 12C/13C ≤ 85.The fitting was performed using a Markov-Chain MonteCarlo (MCMC) minimisation strategy - an initial guess foreach parameter is taken, and randomised steps in each pa-rameter are taken to explore the resulting goodness of fit.These steps are initially large, but decrease as the fitting
MNRAS 000, 1–18 (2016)
G11.92–0.61 MM1: A Keplerian disc around a massive young proto-O star 11
-0.28
0.0
0.28
Off
set
(arc
sec)
CH3CNk=3
-0.28
0.0
0.28
CH3OH229.75 GHz
-0.28 0.0 0.28Offset (arcsec)
-0.28
0.0
0.28
Off
set
(arc
sec)
ALL(excl. CH3OH)
-0.28 0.0 0.28Offset (arcsec)
-0.28
0.0
0.28
Velo
city
(km
/s)
CH3OH
30
32
34
36
38
40
42
Figure 6. Top: centroid plots for the CH3CN K=3 (left) and the CH3OH 229.75 GHz (right) transitions, displaying
the differing morphology characteristic of CH3OH. Bottom: Results of the kinematic fitting procedure described inSection 4.1 for the two collections of centroid points - all ’disc-tracing’ lines other than CH3OH (left) and ’disc-tracing’
CH3OH transitions only (right). The best fitting disc model for all lines (except CH3OH) surrounded an enclosed
mass of 60+21−27 M� at an inclination of 35+20
−6◦, with an outer radius Ro = 1200+100
−100 au. The best fitting disc model for
only the CH3OH transitions surrounded an enclosed mass of 34+28−12 M� at an inclination of 52+11
−14◦, with an outer radius
Ro = 1200+100−100 au. In both cases, the position angle of the disc was fixed to 127◦. Axes are in offsets with respect to the
velocity centre as defined in Section 4.1.
procedure progresses in order to refine the best fitting pa-rameters. The number of iterations was set to 5000, and thecutoff parameter to determine when the step size becomesfixed was set to 2500. The best fitting values for each pixelare taken from the execution that achieved an acceptancerate of 0.5. To ensure only data with a reliable signal-to-noise ratio were used in the fitting procedure, only pixelswith spectra where the K = 3 transition was detected above5σ were included in the modelling, which ensured the fittingroutine was always given at least the K = 0/1 (blended witheach other), K = 2 and K = 3 transitions to fit. The sub-sequent best fitting model spectra were then examined byeye, and any inadequate fits were discarded from the finalresults.
In all cases, we found that models with a single com-ponent of emitting material could not adequately reproducethe line ratios observed in the CH3CN and CH13
3 CN spectra.Instead, two components of emitting material were requiredto adequately reproduce the emission (similar to observa-tions of hot cores, e.g. Cyganowski et al. 2011a; Hernandez-Hernandez et al. 2014). In these two component fits, eachcomponent was given a set of independent parameters aslisted above.
Figure 7 shows the results of the fitting procedure. Thetop panel shows the results of a fit to an individual pixel,with the respective transitions of CH3CN and CH13
3 CN la-
belled, along with the transition of 13CO that appears within
MNRAS 000, 1–18 (2016)

12 J. D. Ilee et al.
N1
18h13m58.15s 58.10s 58.05s
-18°54'19.5"
20.0"
20.5"
21.0"
N2
18h13m58.15s 58.10s 58.05s
-18°54'19.5"
20.0"
20.5"
21.0"
16.75
17.00
17.25
17.50
17.75
18.00
18.25
log
cm-2
T1
18h13m58.15s 58.10s 58.05s
-18°54'19.5"
20.0"
20.5"
21.0"
T2
18h13m58.15s 58.10s 58.05s
-18°54'19.5"
20.0"
20.5"
21.0"
140
160
180
200
220
240
K
∆v1
18h13m58.15s 58.10s 58.05s
-18°54'19.5"
20.0"
20.5"
21.0"
RA (J2000)
Dec
(J2000)
∆v2
18h13m58.15s 58.10s 58.05s
-18°54'19.5"
20.0"
20.5"
21.0"
5.0
5.5
6.0
6.5
7.0
7.5
8.0
kms-1
220.3 220.4 220.5 220.6 220.7 220.8Frequency (GHz)
01020304050
TB
(K)
CH3CNCH13
3 CN
13CO
Figure 7. Results from CASSIS fitting to the CH3CN spectra across the region of MM1. Top: fitting results (red) to thespectrum (black) from a single pixel. Bottom: Column densities (N), temperatures (T) and line widths (∆v) as derived
from the fits for the first component (left) and second component (right). White contours correspond to the labeled
values with tick marks on each colourbar. The black contour shows the 3σ level of the moment 0 map for the K = 2transition (where σ = 0.19 Jy beam−1), and the black cross marks the location of the 1.3mm continuum peak.
MNRAS 000, 1–18 (2016)
G11.92–0.61 MM1: A Keplerian disc around a massive young proto-O star 13
that range of frequencies. There is good agreement betweenthe line ratios and line widths of the model and the data, sug-gesting we are placing strong constraints on the parameters.The lower panels of Figure 7 show the results for the firstcomponent (left) and second component (right). The firstcomponent is characterised by cooler material (∼ 150 K),with a higher column (∼ 1018 cm−2) and a larger linewidth (∼8 km s−1), while the second component is warmer (∼ 250 K)with a lower column (∼ 1016 cm−2) and exhibits a range oflinewidths (5–8 km s−1). These two temperature compo-nents may be identified with two distinct reservoirsof CH3CN in the disc, as seen in recent chemicalmodels of circumstellar discs around low to inter-mediate mass young stars. These models show thatsubstantial reservoirs of CH3CN can exist in boththe disc midplane and disc atmosphere (Walsh et al.2015). In the upper regions of these disc models,ion-molecule chemistry dominates the production ofCH3CN (with a small contribution from the thermaldesorption of ice mantles), and strong UV fluxes(when present) dominate the destruction throughphotodissociation. For the midplane regions, whichhold the majority of the CH3CN reservoir, produc-tion is dominated by thermal desorption from icemantles in regions where the temperature exceeds150 K, and the molecule simply freezes out in re-gions with lower temperatures (C. Walsh, privatecommunication). It is interesting to note that while theparameters of the first, lower-temperature component ap-pear relatively symmetric about the continuum peak, thetemperature and linewidth of the second component exhibitsignificant asymmetries towards the South-West. In partic-ular, the high temperatures seen towards the South-Westwould be consistent with a disc oriented as modelled in Sec-tion 4.1, if the disc was sufficiently flared and the disc wasoptically thick. Such a geometry would also explain the ori-entation of the looped centroids of emission seen in Section4.1.
4.3 Nature of the central cm-wavelength source
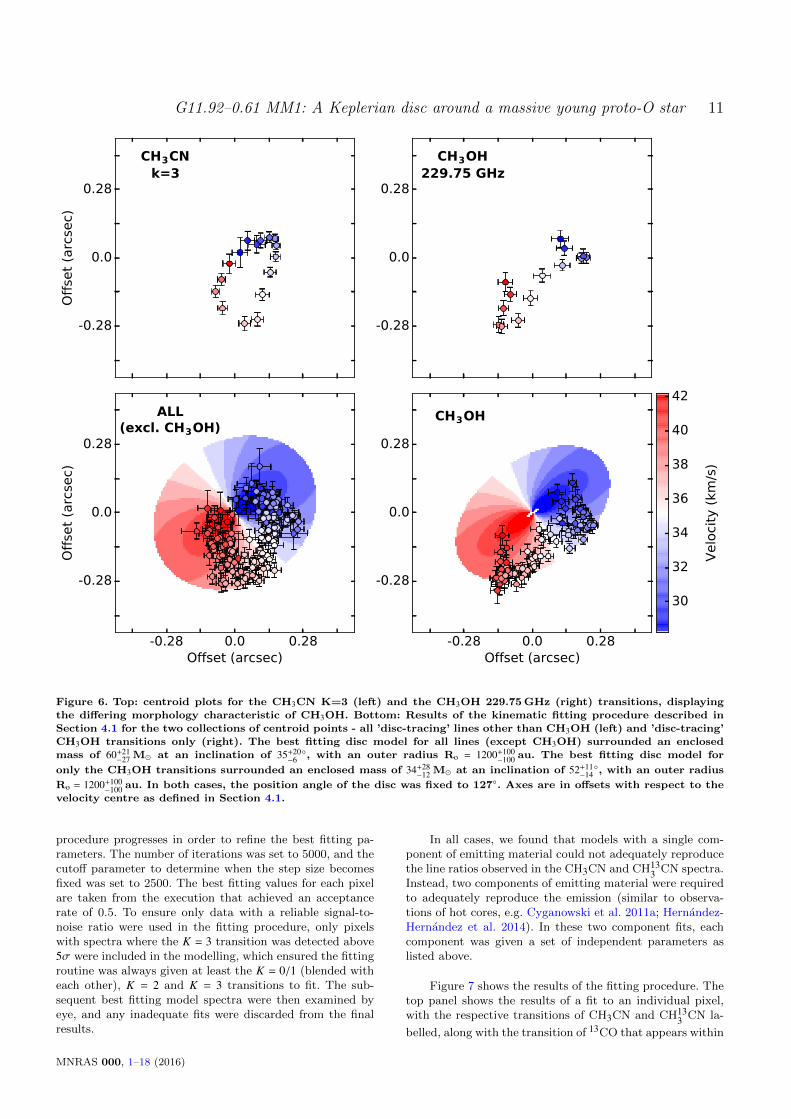
In order to constrain the properties of the central cm-wavelength source, we model the free-free and dust emis-sion simultaneously, using an approach similar to that ofHunter et al. (2014). We first construct the spectral en-ergy distribution (SED) of MM1 shown in Figure 8 (filledpoints) from our new VLA observations, the four data-points in Cyganowski et al. (2014) (1.3 cm, 1.3 mm, 1.1 mm,and 0.88 mm), and the 1.4 mm CARMA measurement fromCyganowski et al. (2011a). We choose these measurementsbecause they are, by design, as comparable as possible inangular resolution and uv -coverage (the new 3.0 and 0.9 cmVLA data are of higher resolution than the other datasets,but designed to be well-matched to each other). The errorbars plotted in Figure 8 represent conservative estimates ofthe absolute flux calibration uncertainty (15 per cent forSMA 1.3 mm VEX, 5 per cent for VLA λ > 2.5 cm, 10per cent for VLA λ < 2.5 cm, 20 per cent for higher-frequency SMA and for CARMA 1.4 mm), added in quadra-ture with the statistical uncertainties from the Gaussian fit-ting.
10 100Frequency (GHz)
0.01
0.1
1
10
100
1000
Flu
x D
ensi
ty (
mJy
)
Dust
Jet
HC HII
A
Figure 8. Spectral energy distribution from centimetreto submillimetre wavelengths of MM1 including data
from this paper (3.0 and 0.9 cm VLA), Cyganowskiet al. (2014) (1.3 cm VLA, 1.3 mm, 1.1 mm, and 0.88 mm
SMA), and Cyganowski et al. (2011a) (1.4 mm CARMA),
shown as filled blue points. These measurements are in-tegrated flux densities from two-dimensional Gaussian
fitting; the error bars represent the statistical uncer-
tainties from the fit combined in quadrature with con-servative estimates for the absolute flux calibration un-
certainty (see Section 4.3). Shown as open white points
are flux densities from Moscadelli et al. (2016) (4.3-5.5,2.3 and 1.4 cm VLA). The best fitting model is shown
as a solid black line, which combines dust emission and
two components of free-free emission: a uniform densityHC H ii region and an ionised jet with a power-law den-
sity profile (labelled black dotted lines). The solid red
line marked ‘A’ shows the best fitting model without anHC H ii region component, i.e. dust emission plus a jet
component, which fails to reproduce the full centimetre-to-submillimetre SED.
To model the centimetre-submillimetre wavelengthSED, we combine a free-free model (Olnon 1975) with asingle-temperature modified graybody function represent-ing the dust emission (e.g. Gordon 1995; Rathborne et al.2010). We explored modelling the free-free component withthe various Olnon (1975) model geometries for the ionisedgas: spherical (uniform density), Gaussian, power law, andtruncated power law (ne ∝ r−2, transitioning to a centralconstant-density sphere to avoid a singularity). We foundthat the uniform density sphere model best reproduces thecentimetre-wavelength shape of the SED (λ = 0.9 − 3 cm),so we focus on that model for our detailed exploration ofparameter space. The initial combined model has sevenfree parameters: the electron density (ne), radius (Re), andelectron temperature (Te) of the ionised sphere and the an-gular diameter (θd), temperature (Td), grain opacity in-dex (β), and reference opacity (τ1.3 mm) of the dust emis-sion. Since we have seven data points with which to con-strain seven free parameters, we explore parameter spaceby constructing a 40 by 40 point grid of electron density
MNRAS 000, 1–18 (2016)
14 J. D. Ilee et al.
(105.6–107.2 cm−3) and Re (15–65 au), and fitting for theother five parameters (ne, θd, Td, β, and τ1.3 mm) at eachpoint in the ne-Re grid (see also Hunter et al. 2014). Thefit ranges for the free parameters were Te = 6000–11000 K,β = 0.5–2.5, θd = 0.2–2.0′′, and Td = 150–250 K; τ1.3 mm wasunconstrained. The range for Td was chosen based on ourmodelling of the CH3CN emission (Section 4.2). At high den-sity, as in MM1, gas and dust temperatures are expected tobe coupled (e.g. Ceccarelli et al. 1996; Kaufman et al. 1998);since β and Td are degenerate, we use the gas temperaturemeasurement to better constrain the dust model.
The combined model of a uniform-density ionised sphereand graybody dust emission provides a good fit to the ob-served centimetre-submillimetre SED of MM1 at wave-lengths λ ≤ 3 cm (≥10 GHz), as shown in Figure 8. Thebest-fit parameters of the dust component are Td = 172 K,β = 2.1, τ1.3mm = 0.86, and θd = 0.′′20 ∼ 700 au. Because theprimary aim of our SED modelling is to better understandthe nature of the central ionised source, we consider thebest-fit dust parameters as indicative, noting in particularthe degeneracy between dust temperature and β due to hav-ing measurements only on the Rayleigh-Jeans portion of thedust emission spectrum. Overlaying the flux densities ofMoscadelli et al. (2016) in Figure 8 (open points),we find reasonable consistency at 2.3 and 1.4 cmconsidering the difference in uv range, but a signif-icant excess of emission at 4.3–5.5 cm compared toour best-fit dust and uniform ionised sphere model.
Given the observed spectral index at these wave-lengths, we model this excess as an ionised jet inthe form of a truncated power law density profile(Fν ∝ ν0.6). Keeping the dust parameters found aboveas fixed, we refit for the ionised gas parameters ofthe uniform density ionised sphere (which we in-terpret as a hypercompact (HC) H ii region, as dis-cussed below) and the jet. The best-fit model for theHC H ii region has electron temperature Te = 9500 K,electron density ne = 5.8 × 106 cm−3, and a radius of21 au (∼ 0.′′006 at a distance of 3.37 kpc). The jetcomponent is not well constrained, especially con-sidering the dispersion in the published flux den-sity measurements at 4.3-5.5 cm, which is due inpart to the complexity in the deconvolution of thebright UC H ii region (G11.94-0.62) located ∼ 1′ tothe north-northeast (Wood & Churchwell 1989). Forthis reason, we adopt a nominal central density ofne = 106 cm−3 and electron temperature of Te=104 Kand fit only for the size, yielding 17 au. The individ-ual model components and their sums are shown inFigure 8. The modelled source sizes for both the ionisedand dust components are consistent with observational con-straints, e.g. with CM1 being unresolved in all of our VLAobservations (and in those of Moscadelli et al. 2016, see alsoSection 3.1), and with MM1 being unresolved by the SMA(Cyganowski et al. 2014). Finally, we attempted a two-component fit of an ionised jet plus dust, i.e. withoutan HC H ii region (red curve in Figure 8), but thisprovides a poor overall fit to the SED, failing to re-produce the ∼ 1.3 cm and ≤ 1.1 mm emission.
Our modelling results support a picture in which thecentimetre-wavelength continuum emission associated with
MM1 arises from a very small hypercompact (HC) H ii re-gion that is gravitationally ‘trapped’ by an accretion flow(e.g. Keto 2003, 2007), possibly accompanied by a com-pact ionised jet. These results are consistent with otherevidence for ongoing accretion by the central (proto)star, in-cluding the fact that it drives an active outflow (Figure 1).Indeed, the momentum outflow rate estimated by Moscadelliet al. (2016) from VLBA observations of H2O masers is ex-ceptionally high, 2 × 10⁻² M� yr−1 km s−1. A high accretionrate also explains the moderate luminosity of the region(∼104 L�) compared to the enclosed mass implied for MM1by our kinematic modelling (Section 4.1): in evolutionarymodels of massive (proto)stars, high accretion rates resultin large radii and low effective temperatures (e.g. Hosokawa& Omukai 2009; Hosokawa et al. 2010). Finally, the earlyevolutionary stage implied by a gravitationally trapped H iiregion and a swollen, non-ZAMS configuration is consistentwith the short dynamical timescale of the outflow driven byMM1, .10,000 years (Cyganowski et al. 2011a).
The self-consistent scenario outlined above – in whicha high rate of accretion governs many observable character-istics – leads us to favour a HC H ii region interpretation ofthe centimetre-wavelength (λ = 0.9 − 3 cm) emission fromMM1. We note, however, that HC H ii regions andionised winds or jets can be difficult to differenti-ate observationally. The distinction is in part dy-namical – jets have higher velocities than winds (asreflected in larger radio recombination line widthsand/or proper motions), which have higher veloc-ities than HC H ii regions (e.g. Hoare et al. 2007;Hoare & Franco 2007). The other distinction is thesource of ionising photons: for HC H ii regions (in-cluding ionised accretion flows or discs), photoioni-sation by the central massive (proto)star dominates,while in jets and winds, shocks may contribute sig-nificantly to the ionisation (e.g. Shepherd et al.2004; Keto 2007; Galvan-Madrid et al. 2010). Nei-ther distinguishing property can be directly accessedwith existing observations, and both HC H ii regionsand ionised winds or jets are characterised by in-termediate centimetre-wavelength spectral indices(Sν ∝ να, −0.1 < α < 2). Moscadelli et al. (2016) inter-pret the centimetre-wavelength emission from G11.92–0.61MM1 as arising from an ionised wind, based largely on theirmeasured centimetre-wavelength spectral indices. The differ-ence in interpretation likely stems from our more extensivewavelength coverage (e.g. into the submillimetre) and the in-clusion of a dust component in our modelling: our combinedmodel provides a good fit to the observed SED, as discussedabove. Moscadelli et al. (2016) also report a slight elonga-tion in their highest-resolution (1.3 cm) image, but the con-tinuum emission is not well-resolved (see also Section 3.1).Additional, higher angular resolution VLA observations (e.g.at 0.9 cm and 0.7 cm, in the most-extended A-configuration)are necessary to establish whether or not the ionised compo-nent is spatially extended on ∼0.′′1 scales. Importantly, acontribution to the centimetre-wavelength emissionfrom an ionised wind or jet–as in our three compo-nent model (Figure 8)–is entirely consistent with ourconclusion that the central source of MM1 is a veryyoung massive (proto)star, characterised by ongoingaccretion and a swollen, non-ZAMS configuration.
MNRAS 000, 1–18 (2016)

G11.92–0.61 MM1: A Keplerian disc around a massive young proto-O star 15
4.4 Physical properties of the disc estimated fromdust emission
Our modelling of MM1’s centimetre-submillimetre wave-length SED confirms that the observed 1.3 mm flux densityis dominated by thermal dust emission: in our best-fit model,dust accounts for 99.5 per cent of the emission at 1.3 mm. Weestimate a gas mass for the disc from the measured 1.3 mmintegrated flux density using a simple model of isothermaldust emission, corrected for dust opacity (Cyganowski et al.2011a, Equation 3). As in Cyganowski et al. (2014), theseestimates assume a gas-to-dust mass ratio of 100 and adust opacity κ1.3 mm = 1.1 cm2 g−1 (for grains with thin icemantles and coagulation at 108 cm−3; Ossenkopf & Henning1994). For these estimates, we adopt the average temper-atures of the cool and warm components from our pixel-by-pixel CH3CN modelling, 153±10 K and 227±14 K (Sec-tion 4.2; the quoted uncertainty is the standard deviationover all fitted pixels), and the best-fit dust temperature fromSection 4.3 of 172 K. As these temperatures are very simi-lar to the range adopted by Cyganowski et al. (2014) basedon fitting the CH3CN spectrum at the millimetre contin-uum peak, the mass estimates are nearly identical to thosein Cyganowski et al. (2014): Mgas = 3.3 M�, 2.9 M�, and2.1 M� for Tdust = 153 K, 172 K, and 227 K, respectively. Wenote that even if the centimetre-wavelength continuum emis-sion arose entirely from an ionised wind (e.g. Moscadelliet al. 2016) with α = 0.6 out to millimetre wavelengths, thecontribution to the 1.3 mm flux density would be negligiblefor our mass estimates (∼1 mJy contribution at 1.3 mm, cor-responding to a difference in the estimated mass of ∼ 0.02–0.04 M�, depending on Tdust).
Calculating corresponding H2 number densities for acylindrical, rather than a spherical, geometry yields esti-mates of nH2 ∼ 2.7–4.2×1010 cm−3 for a characteristic disc
height of 7 au and nH2 ∼ 6.3–9.8×109 cm−3 for a disc heightof 30 au (measured from the midplane). We emphasise thatthese estimated number densities are averages over the entiredisc, based on an isothermal estimate of the gas mass asso-ciated with the observed dust emission–which, as discussedin Section 3.3, is likely more compact than the gas disc. Wealso note that while the calculated dust opacities, estimatedas τdust = −ln(1 − Tb/Tdust), are moderate (0.2–0.3, compara-ble to the estimates in Cyganowski et al. 2014), these aresimilarly averages over the entire source, and do not capturevariations in opacity within the disc (e.g. associated with adense midplane).
4.5 G11.92–0.61 MM1 in context
The results of our kinematic fitting (Section 4.1)suggest that G11.92−0.61 MM1 may be the mostmassive proto-O star to date with strong evidencefor the presence of a Keplerian disc. Of candi-dates reported in the literature, only AFGL 2591-VLA3 has a comparable central source mass: ∼40M� (L∼2×10⁵ L�; Jimenez-Serra et al. 2012; Sannaet al. 2012), compared to ∼30-60 M� for MM1. Stud-ies of other proto-O stars with evidence for Kep-lerian discs find enclosed or central source massesof <30 M�. For NGC6334I(N)-SMA 1b, perhaps theclosest analogue to G11.92−0.61 based on IR prop-
erties, Hunter et al. (2014) find an enclosed massof 10-30 M�. Interestingly, IRAS 16547-4247 andAFGL 4176–regions with luminosities 6-10× thatof G11.92−0.61 (∼104 L�; Cyganowski et al. 2011a;Moscadelli et al. 2016) also have enclosed or centralsource masses of <30 M� (Zapata et al. 2015; John-ston et al. 2015). Taken at face value, this collectionof results suggests that enclosed mass does not scaledirectly with luminosity for proto-O stars. However,the differences between the estimated luminosities ofdifferent sources are comparable to the uncertaintiesin the estimates, particularly for sources that do nothave maser parallax distances (e.g. IRAS 16547-4247and AFGL 4176).
In contrast, our estimated (gas) mass for theMM1 disc is similar to the mass estimates obtainedfor other candidate discs around proto-O stars us-ing similar dust properties. In the context of com-paring the small number of discs around O-type(proto)stars, it is worth noting the substantial un-certainty in mass estimates associated with the (as-sumed) dust opacity, κν. Our estimates above (likethose of Wang et al. 2012; Hunter et al. 2014; Zap-ata et al. 2015) adopt dust opacities from Ossenkopf& Henning (1994) for grains with ice mantles. ForDraine (2003) interstellar grains, κ1.2mm is lower bya factor of &5 (for RV = 5.5, as adopted by John-ston et al. 2015), yielding mass estimates that arelarger by the same factor. This difference in assumeddust properties accounts for the much larger massreported by Johnston et al. (2015) for the AFGL4176 disc (∼12 M�), compared to the values of a fewsolar masses (∼2-6 M�) characteristic of MM1 andother massive disc candidates (e.g. Wang et al. 2012;Hunter et al. 2014; Zapata et al. 2015).
The relatively large disc-to-star mass ratio derived fromour observations of G11.92−0.61 MM1 (&0.035) indi-cates that self-gravity may play a role in the evolution ofthe disc. Self-gravitating discs are efficient transporters ofangular momentum, and hence provide a suitable means ofassembling relatively massive stars on short timescales. In acompanion paper (Forgan et al, submitted) we compute sim-ple semi-analytic models of self-gravitating discs (Forgan &Rice 2011, 2013), both for MM1 and for other massive Kep-lerian disc candidates recently observed. We find that thesesimple models provide reasonably good estimates of the ob-served disc mass, given the observational constraints on thedisc inner and outer radii, stellar mass and accretion rate.Most intriguingly, the models predict that the disc aroundMM1 should be sufficiently unstable to fragment into lowmass protostars. These objects are beyond the resolution ofour observations at this time, but may be detectable withe.g. ALMA.
5 CONCLUSIONS
In this paper, we have used sub-arcsecond(.1550 au) resolution SMA 1.3 mm and VLA 3.0and 0.9 cm observations of the high-mass (proto)starG11.92–0.61 MM1 to characterise the nature of the
MNRAS 000, 1–18 (2016)
16 J. D. Ilee et al.
N
S
WE
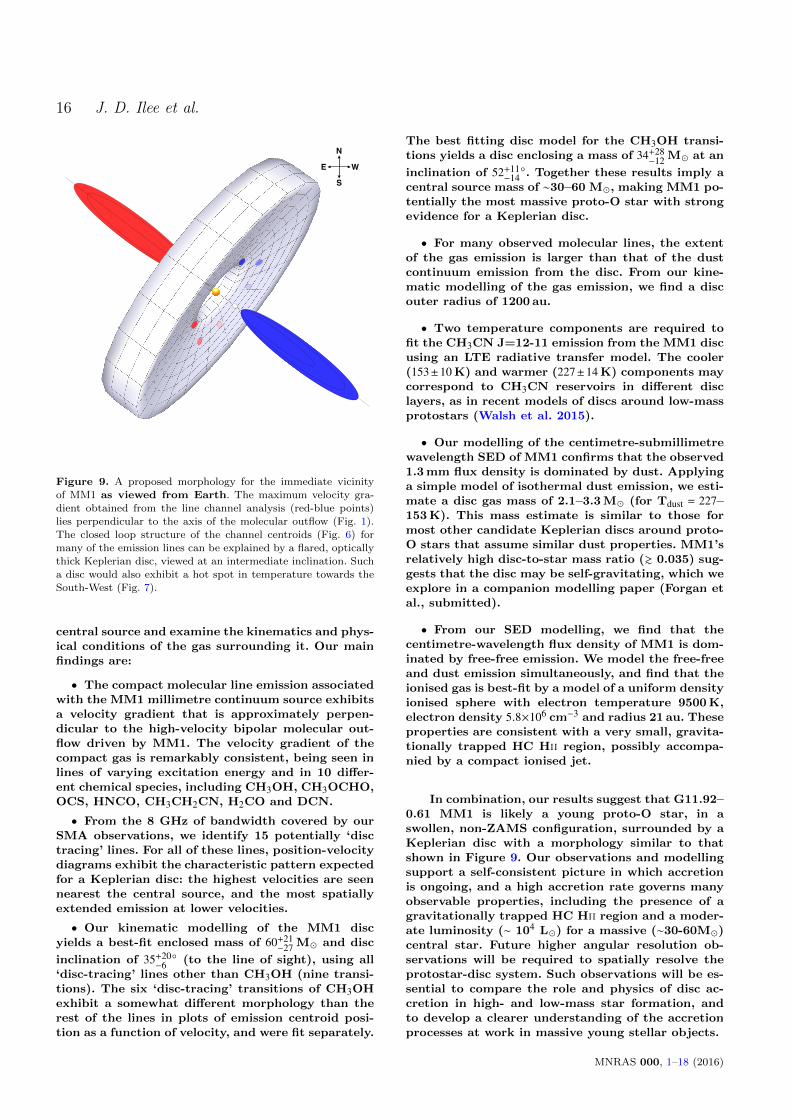
Figure 9. A proposed morphology for the immediate vicinity
of MM1 as viewed from Earth. The maximum velocity gra-dient obtained from the line channel analysis (red-blue points)
lies perpendicular to the axis of the molecular outflow (Fig. 1).
The closed loop structure of the channel centroids (Fig. 6) formany of the emission lines can be explained by a flared, optically
thick Keplerian disc, viewed at an intermediate inclination. Sucha disc would also exhibit a hot spot in temperature towards the
South-West (Fig. 7).
central source and examine the kinematics and phys-ical conditions of the gas surrounding it. Our mainfindings are:
• The compact molecular line emission associatedwith the MM1 millimetre continuum source exhibitsa velocity gradient that is approximately perpen-dicular to the high-velocity bipolar molecular out-flow driven by MM1. The velocity gradient of thecompact gas is remarkably consistent, being seen inlines of varying excitation energy and in 10 differ-ent chemical species, including CH3OH, CH3OCHO,OCS, HNCO, CH3CH2CN, H2CO and DCN.
• From the 8 GHz of bandwidth covered by ourSMA observations, we identify 15 potentially ‘disctracing’ lines. For all of these lines, position-velocitydiagrams exhibit the characteristic pattern expectedfor a Keplerian disc: the highest velocities are seennearest the central source, and the most spatiallyextended emission at lower velocities.
• Our kinematic modelling of the MM1 discyields a best-fit enclosed mass of 60+21
−27 M� and disc
inclination of 35+20−6◦ (to the line of sight), using all
‘disc-tracing’ lines other than CH3OH (nine transi-tions). The six ‘disc-tracing’ transitions of CH3OHexhibit a somewhat different morphology than therest of the lines in plots of emission centroid posi-tion as a function of velocity, and were fit separately.
The best fitting disc model for the CH3OH transi-tions yields a disc enclosing a mass of 34+28
−12 M� at an
inclination of 52+11−14◦. Together these results imply a
central source mass of ∼30–60 M�, making MM1 po-tentially the most massive proto-O star with strongevidence for a Keplerian disc.
• For many observed molecular lines, the extentof the gas emission is larger than that of the dustcontinuum emission from the disc. From our kine-matic modelling of the gas emission, we find a discouter radius of 1200 au.
• Two temperature components are required tofit the CH3CN J=12-11 emission from the MM1 discusing an LTE radiative transfer model. The cooler(153±10 K) and warmer (227±14 K) components maycorrespond to CH3CN reservoirs in different disclayers, as in recent models of discs around low-massprotostars (Walsh et al. 2015).
• Our modelling of the centimetre-submillimetrewavelength SED of MM1 confirms that the observed1.3 mm flux density is dominated by dust. Applyinga simple model of isothermal dust emission, we esti-mate a disc gas mass of 2.1–3.3 M� (for Tdust = 227–153 K). This mass estimate is similar to those formost other candidate Keplerian discs around proto-O stars that assume similar dust properties. MM1’srelatively high disc-to-star mass ratio (& 0.035) sug-gests that the disc may be self-gravitating, which weexplore in a companion modelling paper (Forgan etal., submitted).
• From our SED modelling, we find that thecentimetre-wavelength flux density of MM1 is dom-inated by free-free emission. We model the free-freeand dust emission simultaneously, and find that theionised gas is best-fit by a model of a uniform densityionised sphere with electron temperature 9500 K,electron density 5.8×106 cm−3 and radius 21 au. Theseproperties are consistent with a very small, gravita-tionally trapped HC Hii region, possibly accompa-nied by a compact ionised jet.
In combination, our results suggest that G11.92–0.61 MM1 is likely a young proto-O star, in aswollen, non-ZAMS configuration, surrounded by aKeplerian disc with a morphology similar to thatshown in Figure 9. Our observations and modellingsupport a self-consistent picture in which accretionis ongoing, and a high accretion rate governs manyobservable properties, including the presence of agravitationally trapped HC Hii region and a moder-ate luminosity (∼ 104 L�) for a massive (∼30-60M�)central star. Future higher angular resolution ob-servations will be required to spatially resolve theprotostar-disc system. Such observations will be es-sential to compare the role and physics of disc ac-cretion in high- and low-mass star formation, andto develop a clearer understanding of the accretionprocesses at work in massive young stellar objects.
MNRAS 000, 1–18 (2016)
G11.92–0.61 MM1: A Keplerian disc around a massive young proto-O star 17
ACKNOWLEDGEMENTS
We would like to thank Melvin Hoare, Simon Purserand Katharine Johnston for helpful discussions re-garding the nature of the centimetre-wavelengthemission, and Catherine Walsh for kindly providingfurther information on the behaviour of CH3CN inher chemical models. We also thank Kenny Wood,Claire Davies, and Christine Koepferl for their in-put at an early stage of this project, and the refereefor a constructive report.
JDI gratefully acknowledges support from the DISCSIMproject, grant agreement 341137, funded by the EuropeanResearch Council under ERC-2013-ADG. CJC acknowledgessupport from STFC grant ST/M001296/1. PN, CJC andJDI gratefully acknowledge support in the form of an Under-graduate Research Bursary from the Royal Astronomical So-ciety. DF acknowledges support from the ECOGAL project,grant agreement 291227, funded by the European ResearchCouncil under ERC-2011-ADG. This research has made useof NASA’s Astrophysics Data System Bibliographic Ser-vices; Astropy, a community-developed core Python pack-age for Astronomy (Astropy Collaboration et al. 2013);APLpy, an open-source plotting package for Python hostedat http://aplpy.github.com, and the CASSIS softwareand VADMC databases (http://www.vamdc.eu/). CASSIShas been developed by IRAP-UPS/CNRS (http://cassis.irap.omp.eu). The Submillimeter Array is a joint projectbetween the Smithsonian Astrophysical Observatory andthe Academia Sinica Institute of Astronomy and Astro-physics, and is funded by the Smithsonian Institution andthe Academia Sinica. The National Radio Astronomy Ob-servatory is a facility of the National Science Foundationoperated under agreement by the Associated Universities,Inc.
References
Alexander R. D., Clarke C. J., Pringle J. E., 2006, MNRAS, 369,229
Araya E., Hofner P., Kurtz S., Bronfman L., DeDeo S., 2005,ApJS, 157, 279
Astropy Collaboration et al., 2013, A&A, 558, A33
Beltran M. T., de Wit W. J., 2016, A&ARv, 24, 6
Beltran M. T., Cesaroni R., Neri R., Codella C., 2011, A&A, 525,
A151
Beltran M. T., et al., 2014, A&A, 571, A52
Benedettini M., et al., 2013, MNRAS, 436, 179
Beuther H., Walsh A. J., 2008, ApJ, 673, L55
Bik A., Thi W. F., 2004, A&A, 427, L13
Boley P. A., et al., 2013, A&A, 558, A24
Breen S. L., Ellingsen S. P., 2011, MNRAS, 416, 178
Brogan C. L., Chandler C. J., Hunter T. R., Shirley Y. L., Sarma
A. P., 2007, ApJ, 660, L133
Ceccarelli C., Hollenbach D. J., Tielens A. G. G. M., 1996, ApJ,471, 400
Cesaroni R., 2005, Ap&SS, 295, 5
Cesaroni R., Galli D., Lodato G., Walmsley M., Zhang Q., 2006,
Nature, 444, 703
Cesaroni R., Galli D., Lodato G., Walmsley C. M., Zhang Q.,2007, Protostars and Planets V, pp 197–212
Cesaroni R., Beltran M. T., Zhang Q., Beuther H., Fallscheer C.,2011, A&A, 533, A73
Cesaroni R., Galli D., Neri R., Walmsley C. M., 2014, A&A, 566,
A73
Comito C., Schilke P., Endesfelder U., Jimenez-Serra I., Martın-Pintado J., 2007, A&A, 469, 207
Cyganowski C. J., et al., 2008, AJ, 136, 2391
Cyganowski C. J., Brogan C. L., Hunter T. R., Churchwell E.,2009, ApJ, 702, 1615
Cyganowski C. J., Brogan C. L., Hunter T. R., Churchwell E.,
Zhang Q., 2011a, ApJ, 729, 124
Cyganowski C. J., Brogan C. L., Hunter T. R., Churchwell E.,
2011b, ApJ, 743, 56
Cyganowski C. J., et al., 2014, ApJ, 796, L2
Davies B., Lumsden S. L., Hoare M. G., Oudmaijer R. D., de Wit
W.-J., 2010, MNRAS, 402, 1504
Davies B., Hoare M. G., Lumsden S. L., Hosokawa T., OudmaijerR. D., Urquhart J. S., Mottram J. C., Stead J., 2011, MNRAS,
416, 972
Draine B. T., 2003, ARA&A, 41, 241
Forgan D., Rice K., 2011, MNRAS, 417, 1928
Forgan D., Rice K., 2013, MNRAS, 430, 2082
Galvan-Madrid R., Zhang Q., Keto E., Ho P. T. P., Zapata L. A.,
Rodrıguez L. F., Pineda J. E., Vazquez-Semadeni E., 2010,ApJ, 725, 17
Gordon M. A., 1995, A&A, 301, 853
Guilloteau S., Dutrey A., Pietu V., Boehler Y., 2011, A&A, 529,A105
Harries T. J., Haworth T. J., Acreman D. M., 2014, Astrophysics
and Space Science Proceedings, 36, 395
Hernandez-Hernandez V., Zapata L., Kurtz S., Garay G., 2014,
ApJ, 786, 38
Hoare M. G., Franco J., 2007, Astrophysics and Space ScienceProceedings, 1, 61
Hoare M. G., Kurtz S. E., Lizano S., Keto E., Hofner P., 2007,
Protostars and Planets V, pp 181–196
Hofner P., Churchwell E., 1996, A&AS, 120, 283
Hosokawa T., Omukai K., 2009, ApJ, 691, 823
Hosokawa T., Yorke H. W., Omukai K., 2010, ApJ, 721, 478
Hughes A. M., Wilner D. J., Andrews S. M., Qi C., HogerheijdeM. R., 2011, ApJ, 727, 85
Hunter T. R., Brogan C. L., Cyganowski C. J., Young K. H.,2014, ApJ, 788, 187
Ilee J. D., et al., 2013, MNRAS, 429, 2960
Ilee J. D., Fairlamb J., Oudmaijer R. D., Mendigutıa I., van den
Ancker M. E., Kraus S., Wheelwright H. E., 2014, MNRAS,445, 3723
Jimenez-Serra I., Zhang Q., Viti S., Martın-Pintado J., de Wit
W.-J., 2012, ApJ, 753, 34
Johnston K. G., Beuther H., Linz H., Boley P., Robitaille T. P.,Keto E., Wood K., van Boekel R., 2014, Astrophysics andSpace Science Proceedings, 36, 413
Johnston K. G., et al., 2015, ApJ, 813, L19
Kaufman M. J., Hollenbach D. J., Tielens A. G. G. M., 1998,ApJ, 497, 276
Keto E., 2003, ApJ, 599, 1196
Keto E., 2007, ApJ, 666, 976
Klassen M., Pudritz R., Kuiper R., Peters T., Banerjee R., 2016,
preprint, (arXiv:1603.07345)
Kraus S., et al., 2010, Nature, 466, 339
Krumholz M. R., Klein R. I., McKee C. F., Offner S. S. R., Cun-
ningham A. J., 2009, Science, 323, 754
Kuiper R., Klahr H., Beuther H., Henning T., 2010, ApJ, 722,1556
Kuiper R., Klahr H., Beuther H., Henning T., 2011, ApJ, 732, 20
Lee H.-T., Takami M., Duan H.-Y., Karr J., Su Y.-N., Liu S.-Y.,Froebrich D., Yeh C. C., 2012, ApJS, 200, 2
Lee H.-T., et al., 2013, ApJS, 208, 23
Maret S., 2015, thindisk: Thindisk v1.0,
MNRAS 000, 1–18 (2016)

18 J. D. Ilee et al.
doi:10.5281/zenodo.13823, http://dx.doi.org/10.5281/
zenodo.13823
Moscadelli L., et al., 2016, A&A, 585, A71Mottram J. C., et al., 2011, ApJ, 730, L33
Olnon F. M., 1975, A&A, 39, 217
Ossenkopf V., Henning T., 1994, A&A, 291, 943Pankonin V., Churchwell E., Watson C., Bieging J. H., 2001, ApJ,
558, 194Patel N. A., et al., 2005, Nature, 437, 109
Perez L. M., et al., 2012, ApJ, 760, L17
Qiu K., Zhang Q., Beuther H., Fallscheer C., 2012, ApJ, 756, 170Rathborne J. M., Jackson J. M., Chambers E. T., Stojimirovic I.,
Simon R., Shipman R., Frieswijk W., 2010, ApJ, 715, 310
Sanchez-Monge A., et al., 2013, A&A, 552, L10Sanna A., Reid M. J., Carrasco-Gonzalez C., Menten K. M., Brun-
thaler A., Moscadelli L., Rygl K. L. J., 2012, ApJ, 745, 191
Sato M., et al., 2014, ApJ, 793, 72Shepherd D. S., Kurtz S. E., Testi L., 2004, ApJ, 601, 952
Shimajiri Y., et al., 2015, ApJS, 221, 31
Walsh C., et al., 2014, ApJ, 791, L6Walsh C., Nomura H., van Dishoeck E., 2015, A&A, 582, A88
Wang K.-S., van der Tak F. F. S., Hogerheijde M. R., 2012, A&A,543, A22
Wheelwright H. E., Oudmaijer R. D., de Wit W. J., Hoare M. G.,
Lumsden S. L., Urquhart J. S., 2010, MNRAS, 408, 1840Wood D. O. S., Churchwell E., 1989, ApJS, 69, 831
Yorke H. W., Sonnhalter C., 2002, ApJ, 569, 846
Zapata L. A., Palau A., Galvan-Madrid R., Rodrıguez L. F.,Garay G., Moran J. M., Franco-Hernandez R., 2015, MNRAS,
447, 1826
de Gregorio-Monsalvo I., et al., 2013, A&A, 557, A133
This paper has been typeset from a TEX/LATEX file prepared by
the author.
MNRAS 000, 1–18 (2016)