gaining visibility into application and network behavior · gaining visibility into application and...
TRANSCRIPT
PACKETEER | Page �
White Paper
Fast WAN. Fast Apps. Fast Business.
Gaining Visibility into Application and Network Behavior
Table of Contents
Gaining Visibility into Application and Network Behavior 2
Traffic Classification 2
Automatic Discovery and Classification 3
Classification, a Step Above 4
Common Classification Approaches 6
PacketShaper Reporting 7
Application Performance Reports 7
Response-Time Measurement 7
PacketShaper’s Response-Time Advantages ��
Bandwidth Utilization Reports ��
Diagnostic Reports �5
Sharing Reports: The Customer Portal �8
Adaptive Response �9
Monitor Conditions and Respond Automatically �9
Results at a Glance 20
In Summary 2�
Appendix A: Metrics and Graphs 2�
Appendix B: Comparison with Probes and Sniffers 24
Appendix C: Calculating Delays, Technical Details 25

PACKETEER | Page 2
White Paper
Fast WAN. Fast Apps. Fast Business.
Gaining Visibility into Application and Network BehaviorWhat runs on your network and how does it behave? Do your tools provide sufficient visibility to answer these questions?• Which applications are running on your wide-area network? Which use the most resources?• How much of your bandwidth budget is consumed by critical versus recreational traffic?• Do applications meet your users’ expectations? Do they meet committed service levels? • Which users and which branch offices are the top consumers of a particular application? • How does each MPLS class of service perform? Does performance match service class and cost? • Do remote locations get all the bandwidth they pay for? Are they using it efficiently?
Packeteer gives you the means to answer these questions in broad terms and in amazing detail. This paper delves into some of the features and technology that shed a much-needed light on the details of your network and application behavior. This paper does not cover the Shaping, Compression, or Acceleration Modules, which are integrated with the Monitoring Module to form Packeteer’s application traffic management system. See Packeteer’s website for a paper summarizing all of PacketShaper’s features and benefits as well as a selection of detailed papers.
Traffic ClassificationIdentifying and categorizing the types of network traffic that compete for limited bandwidth is the essential prerequisite for diagnosing and solving performance problems. Packeteer calls this process classification.
Rich traffic classification is crucial — you can’t assess or control an application’s performance if you can’t distinguish its traffic. In addition, administrators are usually surprised to see the diversity of their network applications.
Consider these examples of classification’s crucial management role:• A company’s SAP and Citrix applications are frequently delayed behind huge print jobs. The
company must not only distinguish SAP and Citrix traffic to protect them, but must also spot and contain all print traffic regardless of print protocol.
• Music downloads disguise or encrypt their abundant traffic. Before measures to contain music downloads can be effective, their traffic must be identified.
• All traffic to and from three remote branch offices goes through one main site. One branch tends to grab most of the WAN bandwidth, leaving the other two with poor performance. The main site could keep all branches running smoothly and equitably ... if it could differentiate each office’s traffic.
Enterprise networks usually support many more types of traffic than anyone suspects. This be-comes evident just moments after plugging the PacketShaper’s cables into the network and turning on traffic discovery. The PacketShaper immediately starts identifying and organizing each distinct type of traffic it observes. Network administrators are usually surprised to see the diversity of their own traffic.
Packeteer’s classification builds a hierarchical traffic-classification tree, inserting an entry for every traffic type it observes. Each traffic category is called a traffic class and all classes together form the traffic tree.
PACKETEER | Page 3
White Paper
Fast WAN. Fast Apps. Fast Business.
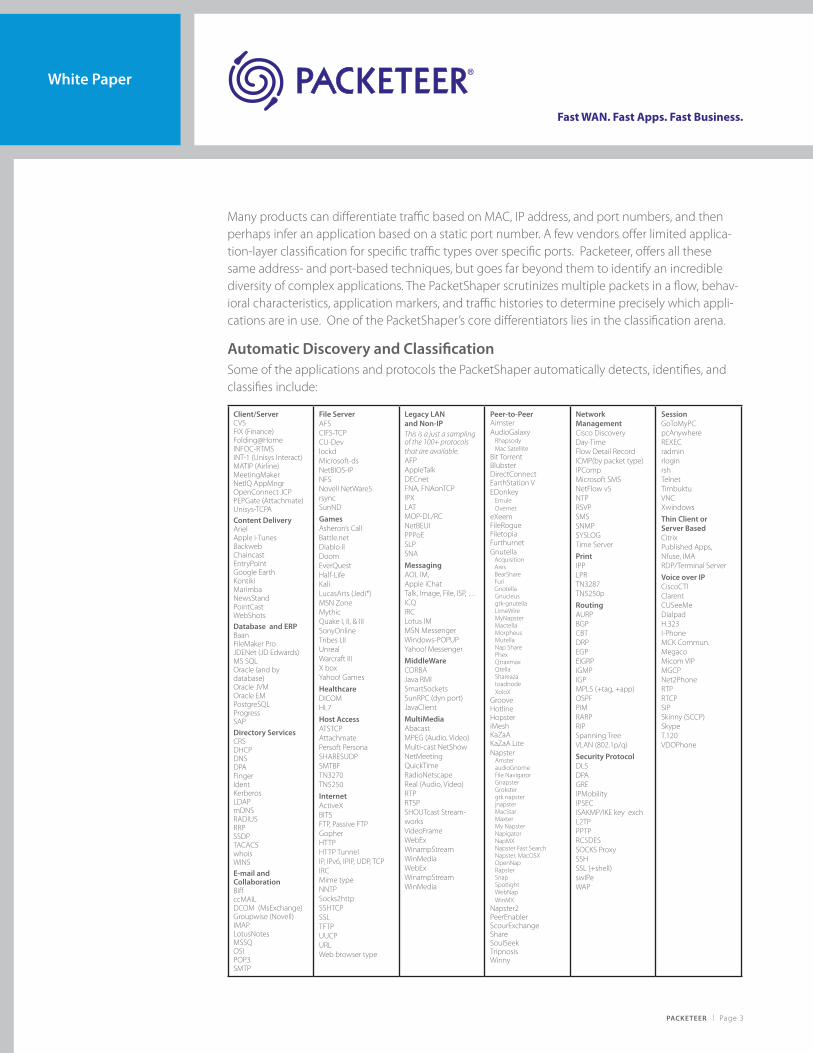
Many products can differentiate traffic based on MAC, IP address, and port numbers, and then perhaps infer an application based on a static port number. A few vendors offer limited applica-tion-layer classification for specific traffic types over specific ports. Packeteer, offers all these same address- and port-based techniques, but goes far beyond them to identify an incredible diversity of complex applications. The PacketShaper scrutinizes multiple packets in a flow, behav-ioral characteristics, application markers, and traffic histories to determine precisely which appli-cations are in use. One of the PacketShaper’s core differentiators lies in the classification arena.
Automatic Discovery and ClassificationSome of the applications and protocols the PacketShaper automatically detects, identifies, and classifies include:
Client/Server CVSFIX (Finance)Folding@Home INFOC-RTMSINT-� (Unisys Interact)MATIP (Airline)MeetingMakerNetIQ AppMngr OpenConnect JCPPEPGate (Attachmate)Unisys-TCPAContent DeliveryArielApple i-Tunes BackwebChaincastEntryPointGoogle EarthKontikiMarimbaNewsStand PointCastWebShots Database and ERPBaanFileMaker ProJDENet (JD Edwards)MS SQLOracle (and by database)Oracle JVMOracle EMPostgreSQLProgressSAPDirectory Services CRSDHCPDNSDPAFingerIdentKerberosLDAPmDNSRADIUSRRPSSDPTACACSwhoisWINSE-mail and CollaborationBiffccMAILDCOM (MsExchange)Groupwise (Novell)IMAPLotusNotes MSSQOSIPOP3SMTP
File ServerAFSCIFS-TCPCU-DevlockdMicrosoft-dsNetBIOS-IPNFSNovell NetWare5rsyncSunND GamesAsheron’s CallBattle.netDiablo IIDoomEverQuestHalf-LifeKali LucasArts (Jedi*)MSN ZoneMythicQuake I, II, & IIISonyOnlineTribes I,IIUnrealWarcraft IIIX boxYahoo! GamesHealthcareDICOMHL7Host AccessATSTCP AttachmatePersoft Persona SHARESUDP SMTBF TN3270TN5250InternetActiveX BITSFTP, Passive FTPGopherHTTP HTTP TunnelIP, IPv6, IPIP, UDP, TCPIRCMime typeNNTPSocks2httpSSHTCPSSLTFTPUUCPURLWeb browser type
Legacy LAN and Non-IPThis is a just a sampling of the 100+ protocols that are available.AFPAppleTalkDECnetFNA, FNAonTCPIPXLATMOP-DL/RCNetBEUI PPPoESLPSNA MessagingAOL IM, Apple iChatTalk, Image, File, ISP, …ICQIRC Lotus IMMSN MessengerWindows-POPUPYahoo! MessengerMiddleWareCORBAJava RMISmartSocketsSunRPC (dyn port)JavaClient MultiMediaAbacastMPEG (Audio, Video)Multi-cast NetShowNetMeetingQuickTimeRadioNetscapeReal (Audio, Video)RTPRTSPSHOUTcast Stream-works VideoFrameWebExWinampStreamWinMediaWebExWinampStreamWinMedia
Peer-to-PeerAimsterAudioGalaxy
RhapsodyMac Satellite
Bit TorrentBlubsterDirectConnectEarthStation VEDonkey
EmuleOvernet
eXeemFileRogueFiletopiaFurthurnetGnutella Acquisition Ares BearShare Furi Gnotella
Gnucleus gtk-gnutellaLimeWireMyNapsterMactellaMorpheusMutellaNap SharePhexQtraxmaxQtellaShareazatoadnodeXoloX
GrooveHotlineHopsteriMeshKaZaAKaZaA LiteNapster
Amster audioGnome File Navigator Gnapster Grokstergtk napster jnapsterMacStar MaxterMy NapsterNapigatorNapMXNapster Fast Search Napster, MacOSX OpenNap RapsterSnap Spotlight WebNap WinMX
Napster2PeerEnablerScourExchangeShare SoulSeekTripnosisWinny
Network Management Cisco DiscoveryDay-TimeFlow Detail RecordICMP(by packet type)IPCompMicrosoft SMSNetFlow v5NTPRSVPSMSSNMPSYSLOGTime ServerPrintIPPLPR TN3287TN5250pRoutingAURPBGPCBTDRPEGPEIGRPIGMPIGPMPLS (+tag, +app)OSPFPIMRARPRIPSpanning TreeVLAN (802.�p/q)Security ProtocolDLSDPAGREIPMobilityIPSECISAKMP/IKE key exchL2TPPPTPRC5DESSOCKS ProxySSHSSL (+shell)swIPeWAP
SessionGoToMyPCpcAnywhereREXECradminrloginrsh TelnetTimbuktuVNCXwindows Thin Client or Server BasedCitrixPublished Apps,Nfuse, IMARDP/Terminal Server Voice over IPCiscoCTIClarentCUSeeMeDialpadH.323I-PhoneMCK Commun.MegacoMicom VIPMGCPNet2PhoneRTPRTCPSIPSkinny (SCCP)SkypeT.�20VDOPhone
PACKETEER | Page 4
White Paper
Fast WAN. Fast Apps. Fast Business.
The PacketShaper can classify traffic with a wide range of criteria, including the following:
• Advanced Layer 7 application signatures: Layer 7 Plus
• Application sub-classification including Oracle and PostgreSQL (by database), Citrix (by published application, client name, or priority tag), FTP (by file name or extension), ICMP (by message type such as ping), NNTP (by name or type of newsgroup), DICOM (by healthcare application), VoIP (by protocol or CODECs)
• HTTP sub-classification by URL, URL wildcard, content type, MIME type, browser type, HTTP tunnel, HTTP �.� virtual server
• SSL sub-classification by certificate common name
• Layer 4 UDP and TCP ports, port ranges, and port lists
• Layer 3 IP addresses, address ranges, subnets, subnet ranges, MAC addresses, host lists, and LANs or physical device
• QoS markings, including DiffServ, IP-ToS, IP-CoS, IP precedence, MPLS label, MPLS experimen-tal bits
• Frame relay interface, PVC/DLCI, ATM PVC, ATM interface, ISL-VLAN, 802.�q-VLAN, 802.�p-LAN
Classification, a Step AboveThe growing complexities associated with network traffic make sophisticated classification techniques a necessity. Simple IP address or static port schemes fall short. Packeteer’s classifica-tion detects dynamic and migrating port assignments, differentiates applications using the same port, and uses Layer 7 application indicators to identify applications.
Web ClassificationSometimes it seems that two-thirds of network traffic is web traffic — from web browsing, to web-based clients for mission-critical applications, to XML-based e-commerce. But not all web traffic requires or deserves the same treatment. Web traffic can vary in urgency, sensitivity to latency, and performance requirements. To complicate matters further, non-web traffic can try to disguise itself as web traffic.
The PacketShaper helps you differentiate between the different types of true or masquerading web traffic so that you can manage each with an appropriate strategy. You can sub-divide HTTP traffic (using mime type, URLs, browser type, and others), detect non-HTTP traffic using port 80 (KaZaA over port 80, for example), spot non-HTTP traffic within an HTTP tunnel, and more.
For example, you can use travel direction, server location, and/or URLs to distinguish employee browsing from your own customers’ shopping. You can separate business-critical HTTP XML from recreational HTTP MPEGs, preventing someone’s musical enthusiasm from interfering with e-busi-ness. Some very thin web-based clients, such as Oracle’s WebForms™ and web-based S390/AS400 host access, can look like normal HTTP traffic, but the PacketShaper can classify them separately.
Sometimes, in an attempt to bypass security and circumnavigate traffic controls, traffic disguises itself by running over an HTTP tunnel (using http-tunnel or socks2http protocols) and disrupts performance of critical HTTP applications. Morpheus and instant messaging are examples of traf-fic that can hide within an HTTP tunnel. The PacketShaper spots and separates this tunnel traffic so you can manage it appropriately. In addition, you can distinguish spam pop-up windows that are sent out with applications such as DirectAdvertising.
PACKETEER | Page 5
White Paper
Fast WAN. Fast Apps. Fast Business.
Citrix and Oracle ClassificationThe PacketShaper can automatically isolate each published application running within a Citrix environment. For example, it can distinguish Microsoft Word from PeopleSoft, and it can distin-guish interactive PeopleSoft traffic from its print traffic.
In addition, the PacketShaper differentiates many types of Oracle traffic, allowing you to tailor your analysis or management strategies. For example, the PacketShaper can separate Oracle traffic accessing the “sales” database from Oracle traffic accessing the “accounting” database. The PacketShaper identifies back-end database traffic consisting of Oracle8i/9i/�0g and netv2 proto-cols using a multi-threaded server as well as the older Oracle 7 (or before) and netv� protocols using a dedicated server. Furthermore, the PacketShaper identifies Oracle’s Java-based, front-end, client traffic, as well as Oracle over SSL and Oracle’s Enterprise Manager traffic.
Intricate Port ClassificationWhen multiple applications use the same port, it is usually difficult to apply different manage-ment strategies because they appear as one application. Not so for the PacketShaper. For ex-ample, the PacketShaper can distinguish TN3270 and TN5250 sessions from other Telnet sessions even though all use well-known port 23.
In addition, an application that hops from port to port can be a challenge to identify, because it looks like different applications. But, as before, not so for the PacketShaper. For example, AOL (America Online) traffic and KaZaA both hop ports frequently, but the PacketShaper tracks them both throughout their journeys.
File-Sharing ProtocolsAlthough specific peer-to-peer applications come and go with political and legal battles, there are now whole groups of peer-to-peer applications that facilitate file sharing. These favorites of music lovers have taken a heavy toll on network performance. Schools, businesses, and other organizations have no desire to issue oppressive and controversial mandates regarding unsanc-tioned use of the network. However, they do want to maintain control over their networks and uphold acceptable performance for critical applications.
The PacketShaper automatically identifies a large number of these file-sharing applications, enabling you to analyze or control their behavior. These include examples such as AudioGalaxy, eDonkey, more than a dozen Gnutella variations, KaZaA, Winny, lots of descendents from the original Napster, the new Napster generation, and more.
The PacketShaper can also spot peer-to-peer traffic hiding inside an HTTP tunnel. In addition, sometimes peer-to-peer traffic uses encryption to try to disguise itself and avoid detection. But it doesn’t evade PacketShaper’s classification.
Multiple LocationsWhen customers choose a main-site deployment, the ability to distinguish traffic to and from each branch office becomes crucial. The PacketShaper can classify traffic according to subnet, IP address, address ranges, and host lists, which can all work to discern different offices’ traffic. Even better, the PacketShaper can then automatically discover all applications used by any location. It keeps them separate (or not, your choice) from those discovered at other locations, allowing different management strategies for the same application at different offices.
PACKETEER | Page 6
White Paper
Fast WAN. Fast Apps. Fast Business.
Classification in Heterogeneous NetworksThe PacketShaper can identify and track hosts by their DNS name, even if DHCP (Dynamic Host Configuration Protocol) changes the host’s IP address frequently. You can use LDAP (Lightweight Directory Access Protocol) host lists to isolate any traffic associated with any host in the list.
Packeteer’s products fit well within VLAN environments, both ISL and 802.�p/q VLANs, as they classify and perpetuate traffic division based on virtual LAN. The PacketShaper can classify traffic based on IP COS/TOS bits, Diffserv settings, and MPLS labels, allowing traffic types to have uni-form end-to-end treatment by multi-vendor devices in heterogeneous WANs.
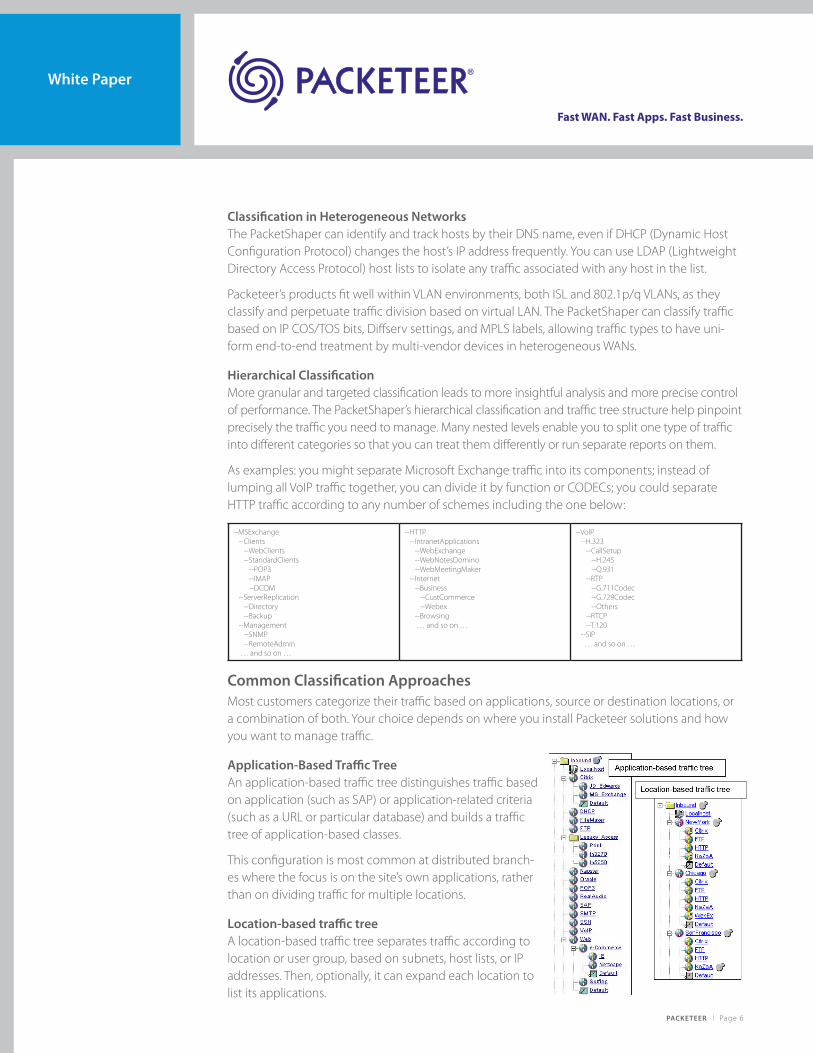
Hierarchical ClassificationMore granular and targeted classification leads to more insightful analysis and more precise control of performance. The PacketShaper’s hierarchical classification and traffic tree structure help pinpoint precisely the traffic you need to manage. Many nested levels enable you to split one type of traffic into different categories so that you can treat them differently or run separate reports on them.
As examples: you might separate Microsoft Exchange traffic into its components; instead of lumping all VoIP traffic together, you can divide it by function or CODECs; you could separate HTTP traffic according to any number of schemes including the one below:
--MSExchange --Clients --WebClients --StandardClients --POP3 --IMAP --DCOM --ServerReplication --Directory --Backup --Management --SNMP --RemoteAdmin … and so on …
--HTTP --IntranetApplications --WebExchange --WebNotesDomino --WebMeetingMaker --Internet --Business --CustCommerce --Webex --Browsing … and so on …
--VoIP --H.323 --CallSetup --H.245 --Q.93� --RTP --G.7��Codec --G.729Codec --Others --RTCP --T.�20 --SIP … and so on …
Common Classification ApproachesMost customers categorize their traffic based on applications, source or destination locations, or a combination of both. Your choice depends on where you install Packeteer solutions and how you want to manage traffic.
Application-Based Traffic TreeAn application-based traffic tree distinguishes traffic based on application (such as SAP) or application-related criteria (such as a URL or particular database) and builds a traffic tree of application-based classes.
This configuration is most common at distributed branch-es where the focus is on the site’s own applications, rather than on dividing traffic for multiple locations.
Location-based traffic treeA location-based traffic tree separates traffic according to location or user group, based on subnets, host lists, or IP addresses. Then, optionally, it can expand each location to list its applications.
PACKETEER | Page 7
White Paper
Fast WAN. Fast Apps. Fast Business.
This configuration is most common at main sites to manage traffic with distinct strategies for several branches or for several departments.
PacketShaper ReportingWhy generate network and application reports? Lots of reasons!
• To investigate and diagnose
• To evaluate service levels
• To search for historical trends
• To notify someone of critical conditions
• To check on a configuration change
• To justify an equipment purchase
• To communicate network and application conditions to employees, executives, and/or customers
The PacketShaper measures hundreds of characteristics about traffic as it passes, creating an ex-tensive collection of measurement data. These metrics form the basis of PacketShaper’s reports. PacketShapers offer a variety of handy, built-in reports — you’ll see many in this paper. Packeteer ReportCenter™ centralizes reporting functions and enables you to compare, correlate, and sum-marize behavior across locations throughout an organization. All reports on PacketShapers and ReportCenter are accessible with a web browser. In addition, you can optionally save your report to a Microsoft Word document, an easy format to share and save for use in the future.
The PacketShaper stores measurement data on appliances for up to two months and for months or years once converted to an Oracle format and forwarded to a ReportCenter server. The PacketShaper’s metrics can also be incorporated into SNMP management platforms, NetFlow v5 collectors, and third-party reporting tools, such as Concorde, InfoVista , and Microsoft Excel. More details about PacketShaper metrics are available in an appendix at the end of this paper.
Packeteer’s reports offer insight into many aspects of network and application behavior. But for the most part, reports fall into one of three categories:
• Performance: how long application traffic spends in different portions of the network
• Utilization: bandwidth usage by applications, locations, and users
• Diagnostic Aids: Information that helps when trying to analyze and pinpoint a problem
Application Performance ReportsResponse-time measurement (RTM) quantifies what has traditionally been subjective, anecdotal information about slow applications. It’s not enough to measure availability and bandwidth us-age. These figures don’t reflect the user’s perception of performance — time — how long it takes after pressing the Enter key to get a response. RTM measures the user experience.
Response-Time MeasurementResponse-time measurement is crucial. RTM substantiates user complaints and evaluates performance problems before they disrupt business. With a mechanism to compare actual and anticipated performance, service-level agreements become more than empty promises. In addi-tion, the ability to quantify and validate performance claims can help justify new equipment and assist with future IT planning.
PACKETEER | Page 8
White Paper
Fast WAN. Fast Apps. Fast Business.
PacketShaper’s RTM features offer techniques to measure performance, troubleshoot sluggish response, set service-level goals, and assess compliance. With RTM, you can:
• Track delay statistics for flexible traffic categories. Measure response times for individual ap-plications, hosts, subnets, and for any transaction-oriented TCP traffic class.
• Break down each response-time measurement into network delay (time spent in transit) and server delay (time the server used to process the request).
• Identify users and servers with the slowest performance.
• Set acceptability standards and track whether performance adheres to them. Set the speed that divides good responses from bad (500 ms, for example), and set the percentage of trans-actions that should meet designated performance goals (95 percent, for example).
• View current and historical performance data in intuitive tables and graphs, in a MIB (manage-ment information base) via an XML API, or as raw data. SNMP management tools and third-party reporting tools integrate smoothly.
Measuring Response Times The PacketShaper’s position in the network — monitoring all the traffic that passes — gives it a unique opportunity to provide accurate response-time measurements at a very low cost. Already seeing every packet, the PacketShaper can easily calculate the time traffic spends traveling between a client and a server, the time used by the server, and the time spent on either side of the PacketShaper unit itself. The PacketShaper notes response times as traffic passes. This simple approach provides rich data without network impact or overhead.
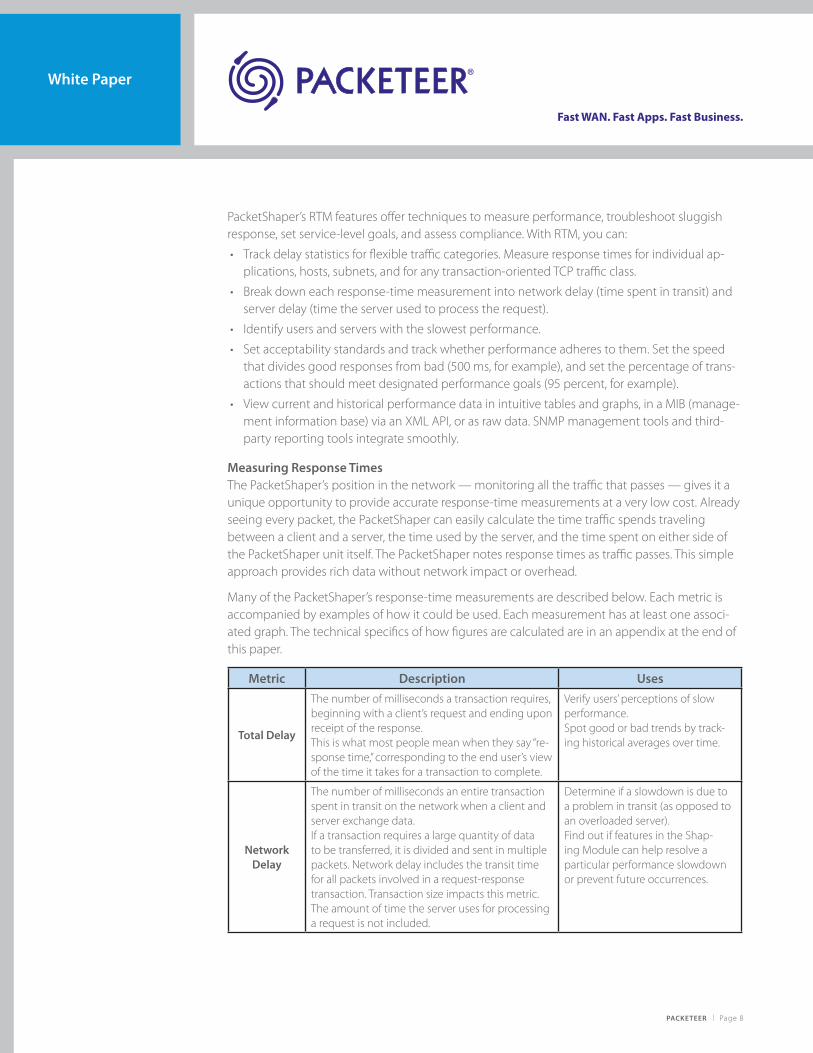
Many of the PacketShaper’s response-time measurements are described below. Each metric is accompanied by examples of how it could be used. Each measurement has at least one associ-ated graph. The technical specifics of how figures are calculated are in an appendix at the end of this paper.
Metric Description Uses
Total Delay
The number of milliseconds a transaction requires, beginning with a client’s request and ending upon receipt of the response. This is what most people mean when they say “re-sponse time,” corresponding to the end user’s view of the time it takes for a transaction to complete.
Verify users’ perceptions of slow performance.Spot good or bad trends by track-ing historical averages over time.
Network Delay
The number of milliseconds an entire transaction spent in transit on the network when a client and server exchange data.If a transaction requires a large quantity of data to be transferred, it is divided and sent in multiple packets. Network delay includes the transit time for all packets involved in a request-response transaction. Transaction size impacts this metric. The amount of time the server uses for processing a request is not included.
Determine if a slowdown is due to a problem in transit (as opposed to an overloaded server). Find out if features in the Shap-ing Module can help resolve a particular performance slowdown or prevent future occurrences.
PACKETEER | Page 9
White Paper
Fast WAN. Fast Apps. Fast Business.
Metric Description Uses
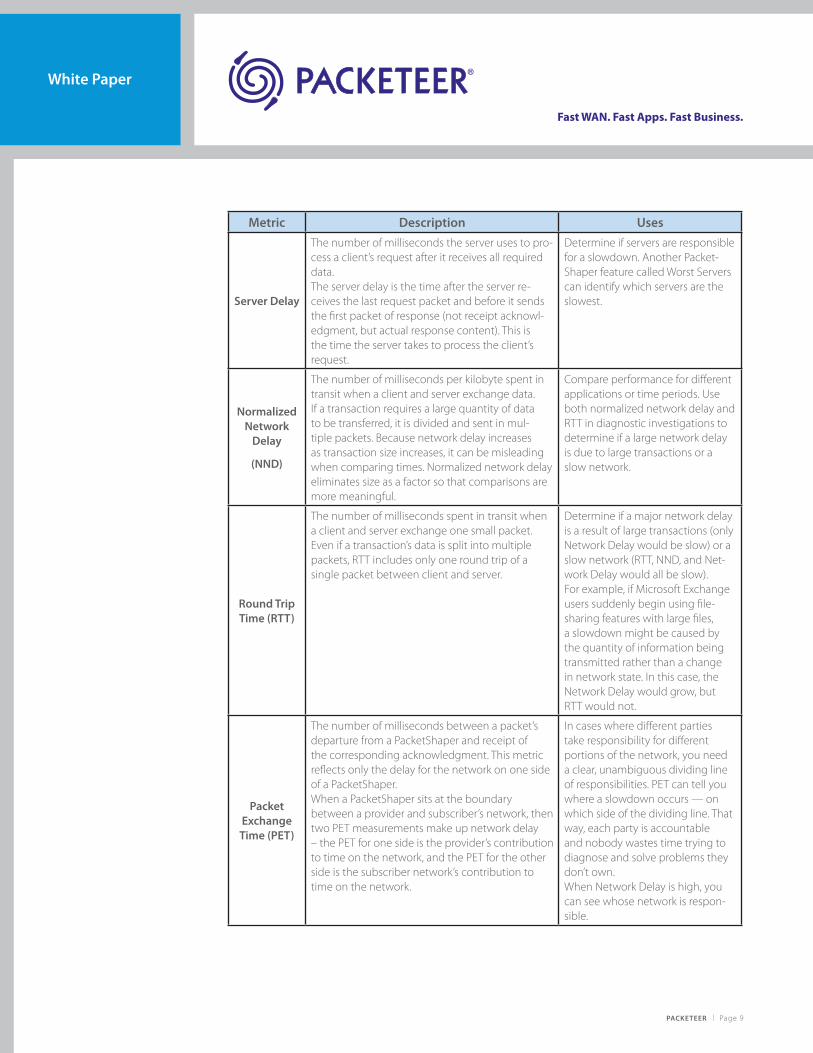
Server Delay
The number of milliseconds the server uses to pro-cess a client’s request after it receives all required data. The server delay is the time after the server re-ceives the last request packet and before it sends the first packet of response (not receipt acknowl-edgment, but actual response content). This is the time the server takes to process the client’s request.
Determine if servers are responsible for a slowdown. Another Packet-Shaper feature called Worst Servers can identify which servers are the slowest.
Normalized Network
Delay
(NND)
The number of milliseconds per kilobyte spent in transit when a client and server exchange data. If a transaction requires a large quantity of data to be transferred, it is divided and sent in mul-tiple packets. Because network delay increases as transaction size increases, it can be misleading when comparing times. Normalized network delay eliminates size as a factor so that comparisons are more meaningful.
Compare performance for different applications or time periods. Use both normalized network delay and RTT in diagnostic investigations to determine if a large network delay is due to large transactions or a slow network.
Round Trip Time (RTT)
The number of milliseconds spent in transit when a client and server exchange one small packet. Even if a transaction’s data is split into multiple packets, RTT includes only one round trip of a single packet between client and server.
Determine if a major network delay is a result of large transactions (only Network Delay would be slow) or a slow network (RTT, NND, and Net-work Delay would all be slow). For example, if Microsoft Exchange users suddenly begin using file-sharing features with large files, a slowdown might be caused by the quantity of information being transmitted rather than a change in network state. In this case, the Network Delay would grow, but RTT would not.
Packet Exchange Time (PET)
The number of milliseconds between a packet’s departure from a PacketShaper and receipt of the corresponding acknowledgment. This metric reflects only the delay for the network on one side of a PacketShaper.When a PacketShaper sits at the boundary between a provider and subscriber’s network, then two PET measurements make up network delay – the PET for one side is the provider’s contribution to time on the network, and the PET for the other side is the subscriber network’s contribution to time on the network.
In cases where different parties take responsibility for different portions of the network, you need a clear, unambiguous dividing line of responsibilities. PET can tell you where a slowdown occurs — on which side of the dividing line. That way, each party is accountable and nobody wastes time trying to diagnose and solve problems they don’t own. When Network Delay is high, you can see whose network is respon-sible.
PACKETEER | Page �0
White Paper
Fast WAN. Fast Apps. Fast Business.
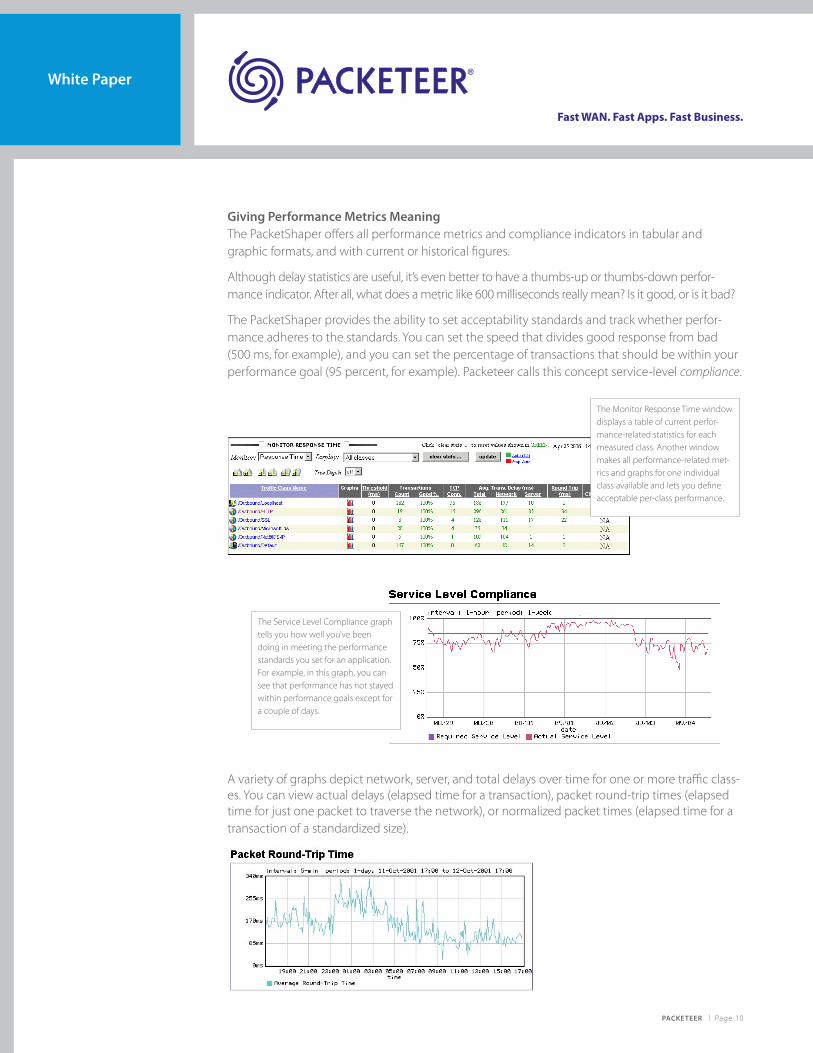
Giving Performance Metrics MeaningThe PacketShaper offers all performance metrics and compliance indicators in tabular and graphic formats, and with current or historical figures.
Although delay statistics are useful, it’s even better to have a thumbs-up or thumbs-down perfor-mance indicator. After all, what does a metric like 600 milliseconds really mean? Is it good, or is it bad?
The PacketShaper provides the ability to set acceptability standards and track whether perfor-mance adheres to the standards. You can set the speed that divides good response from bad (500 ms, for example), and you can set the percentage of transactions that should be within your performance goal (95 percent, for example). Packeteer calls this concept service-level compliance.
A variety of graphs depict network, server, and total delays over time for one or more traffic class-es. You can view actual delays (elapsed time for a transaction), packet round-trip times (elapsed time for just one packet to traverse the network), or normalized packet times (elapsed time for a transaction of a standardized size).
The Monitor Response Time window displays a table of current perfor-mance-related statistics for each measured class. Another window makes all performance-related met-rics and graphs for one individual class available and lets you define acceptable per-class performance.
The Service Level Compliance graph tells you how well you’ve been doing in meeting the performance standards you set for an application. For example, in this graph, you can see that performance has not stayed within performance goals except for a couple of days.
PACKETEER | Page ��
White Paper
Fast WAN. Fast Apps. Fast Business.
PacketShaper’s Response-Time Advantages The PacketShaper’s strengths in the response-time arena are based significantly on what it does not do and from the problems it does not impose. The PacketShaper avoids common pitfalls, including:• No application modifications The PacketShaper does not require the addition of API calls or software wrappers around
measured applications.• No desktop and server changes The PacketShaper does not need anything loaded on client desktops or any server.• No artificial traffic overhead The PacketShaper does not create extraneous application requests merely to time their
responses and does not issue pings. It can issue synthetic transactions, if requested, but calcu-lates all response-time metrics without needing to generate artificial traffic.
• No router reconfiguration or topology changes The PacketShaper requires no changes to router configuration, protocols, servers, desktops, or
topology. • No location restrictions The PacketShaper measures performance anywhere on the network, as long as it sees the traffic
it is measuring. It can sit on the client side or on the server side of the topology. If the Internet separates the client and server, it does not matter on which side the PacketShaper is deployed.
Bandwidth Utilization ReportsBandwidth is a valuable resource. Links to the Internet and WAN are pricey and are prone to con-gestion. The PacketShaper determines how much bandwidth and which applications, protocols, and services are being used.
To manage your links effectively, the PacketShaper answers these and many other questions:• Do critical applications get sufficient bandwidth access? Do the wrong applications get too
much access? For example, do file transfers and print traffic (important, but not time-sensitive) monopolize your link while SAP and Oracle starve?
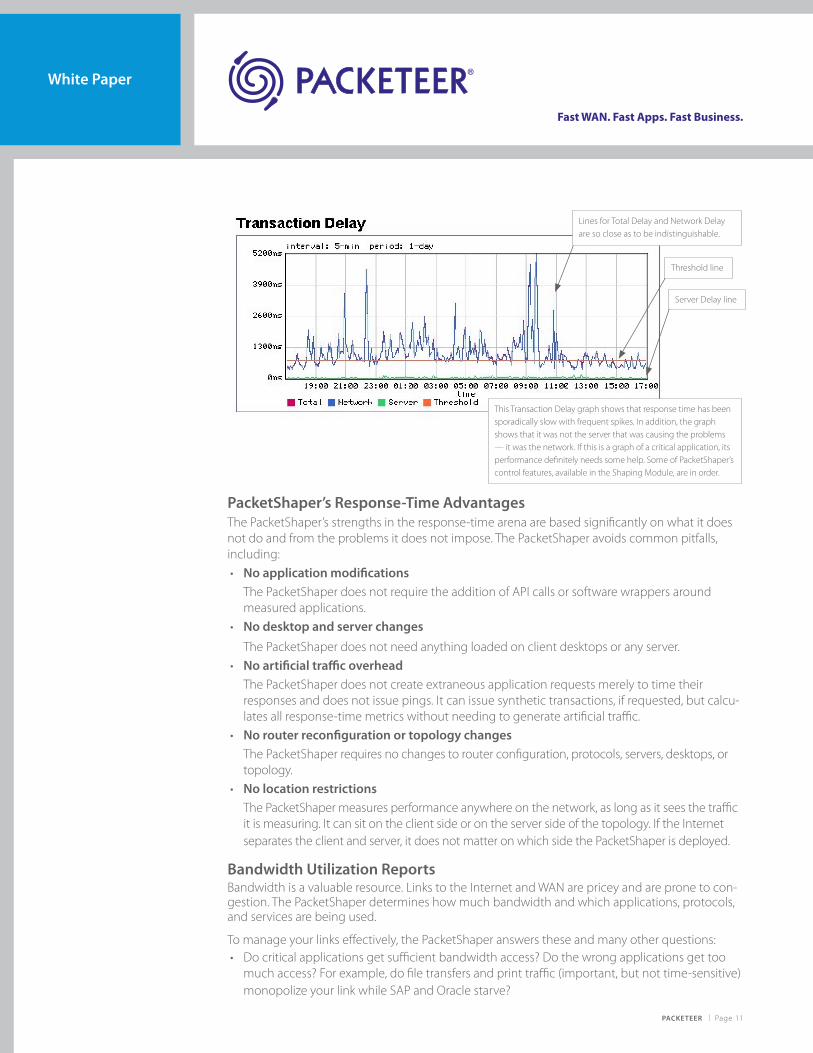
This Transaction Delay graph shows that response time has been sporadically slow with frequent spikes. In addition, the graph shows that it was not the server that was causing the problems — it was the network. If this is a graph of a critical application, its performance definitely needs some help. Some of PacketShaper’s control features, available in the Shaping Module, are in order.
Lines for Total Delay and Network Delay are so close as to be indistinguishable.
Threshold line
Server Delay line
PACKETEER | Page �2
White Paper
Fast WAN. Fast Apps. Fast Business.
• Are you getting all the bandwidth you’re paying for? For example, suppose you purchase a 5�2 Kbps line for a branch office in South America, but receive less than 256 Kbps.
Do you need all the bandwidth you’re buying? For example, perhaps you could support your critical applications with half or two thirds of the bandwidth you have (especially if it were man-aged more effectively).
Evaluating the Usage “Tops”The PacketShaper offers a variety of mechanisms to track top consumers of bandwidth. Lists, tables, pie charts, line graphs, bar charts, and voluminous raw data are all available. You can evalu-ate the top applications, users, locations, websites, chattiest host IP pairs, and other possibilities.
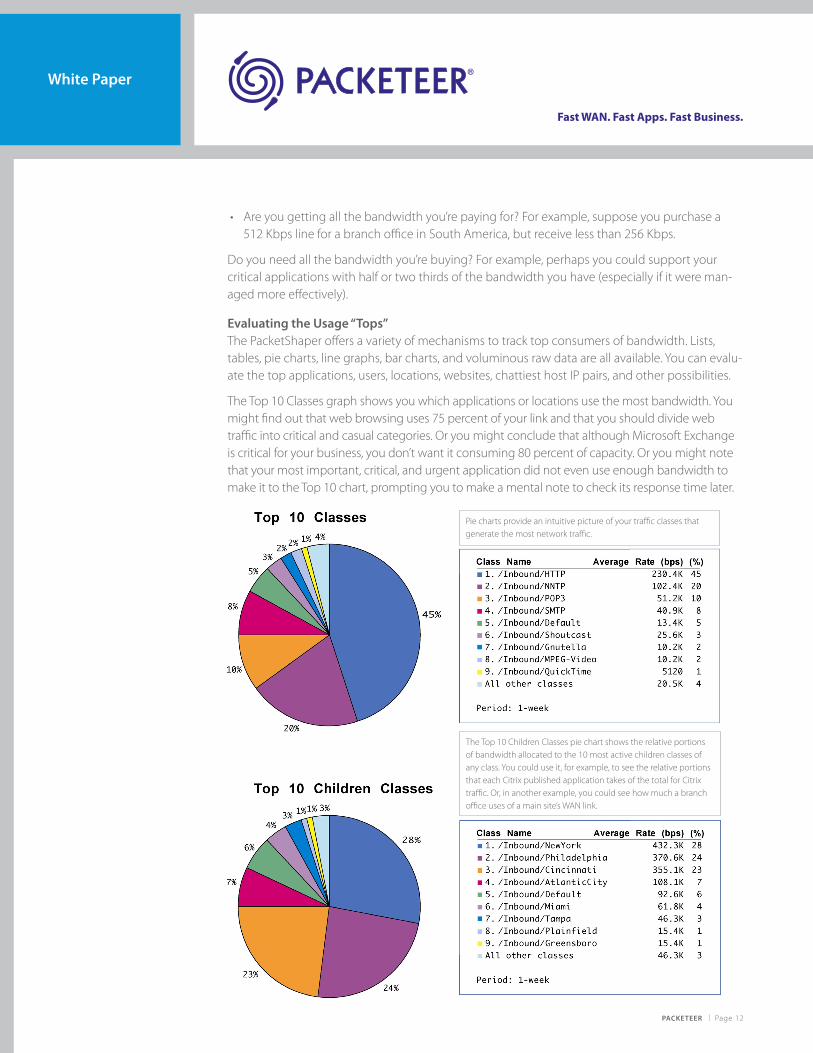
The Top �0 Classes graph shows you which applications or locations use the most bandwidth. You might find out that web browsing uses 75 percent of your link and that you should divide web traffic into critical and casual categories. Or you might conclude that although Microsoft Exchange is critical for your business, you don’t want it consuming 80 percent of capacity. Or you might note that your most important, critical, and urgent application did not even use enough bandwidth to make it to the Top �0 chart, prompting you to make a mental note to check its response time later.
Pie charts provide an intuitive picture of your traffic classes that generate the most network traffic.
The Top �0 Children Classes pie chart shows the relative portions of bandwidth allocated to the �0 most active children classes of any class. You could use it, for example, to see the relative portions that each Citrix published application takes of the total for Citrix traffic. Or, in another example, you could see how much a branch office uses of a main site’s WAN link.
PACKETEER | Page �3
White Paper
Fast WAN. Fast Apps. Fast Business.
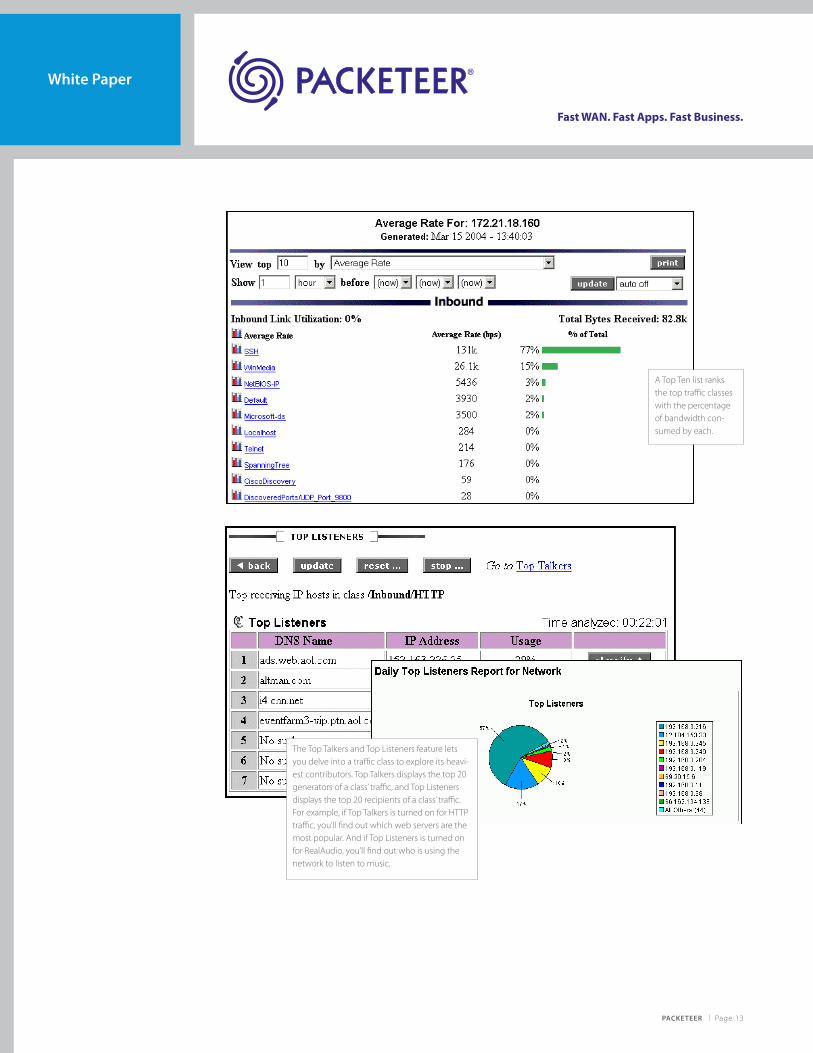
A Top Ten list ranks the top traffic classes with the percentage of bandwidth con-sumed by each.
The Top Talkers and Top Listeners feature lets you delve into a traffic class to explore its heavi-est contributors. Top Talkers displays the top 20 generators of a class’ traffic, and Top Listeners displays the top 20 recipients of a class’ traffic. For example, if Top Talkers is turned on for HTTP traffic, you’ll find out which web servers are the most popular. And if Top Listeners is turned on for RealAudio, you’ll find out who is using the network to listen to music.
PACKETEER | Page �4
White Paper
Fast WAN. Fast Apps. Fast Business.
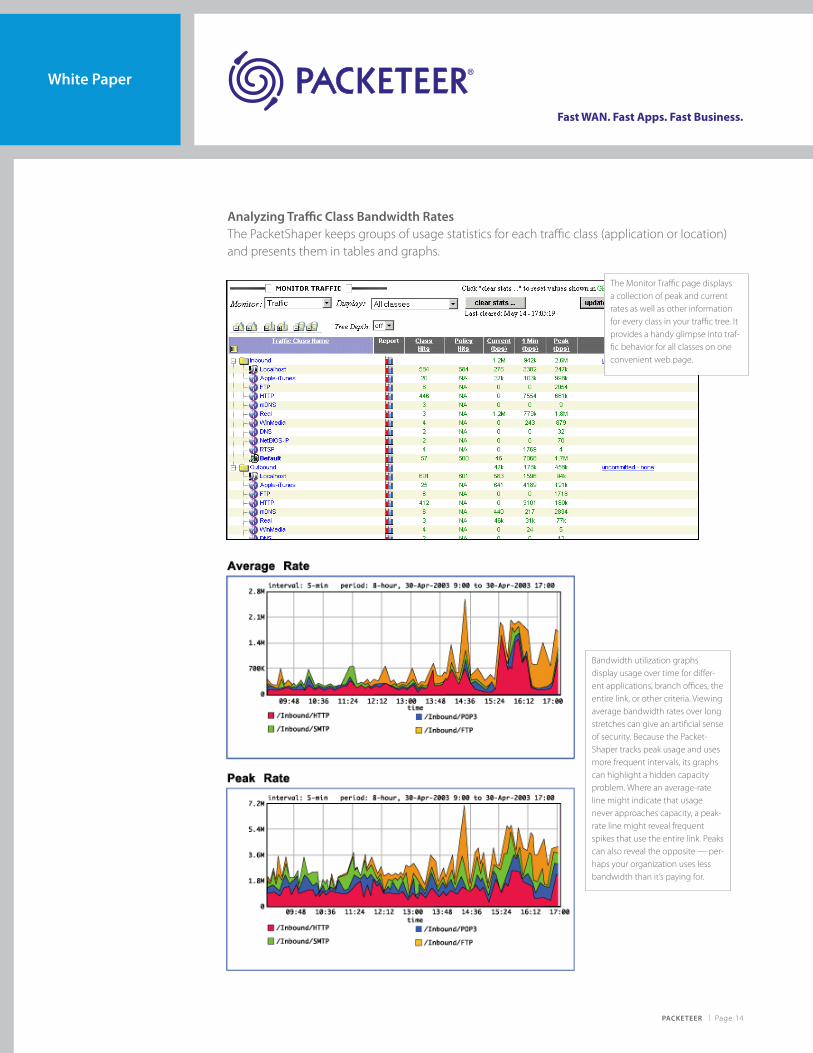
Analyzing Traffic Class Bandwidth RatesThe PacketShaper keeps groups of usage statistics for each traffic class (application or location) and presents them in tables and graphs.
The Monitor Traffic page displays a collection of peak and current rates as well as other information for every class in your traffic tree. It provides a handy glimpse into traf-fic behavior for all classes on one convenient web page.
Bandwidth utilization graphs display usage over time for differ-ent applications, branch offices, the entire link, or other criteria. Viewing average bandwidth rates over long stretches can give an artificial sense of security. Because the Packet-Shaper tracks peak usage and uses more frequent intervals, its graphs can highlight a hidden capacity problem. Where an average-rate line might indicate that usage never approaches capacity, a peak-rate line might reveal frequent spikes that use the entire link. Peaks can also reveal the opposite — per-haps your organization uses less bandwidth than it’s paying for.
PACKETEER | Page �5
White Paper
Fast WAN. Fast Apps. Fast Business.
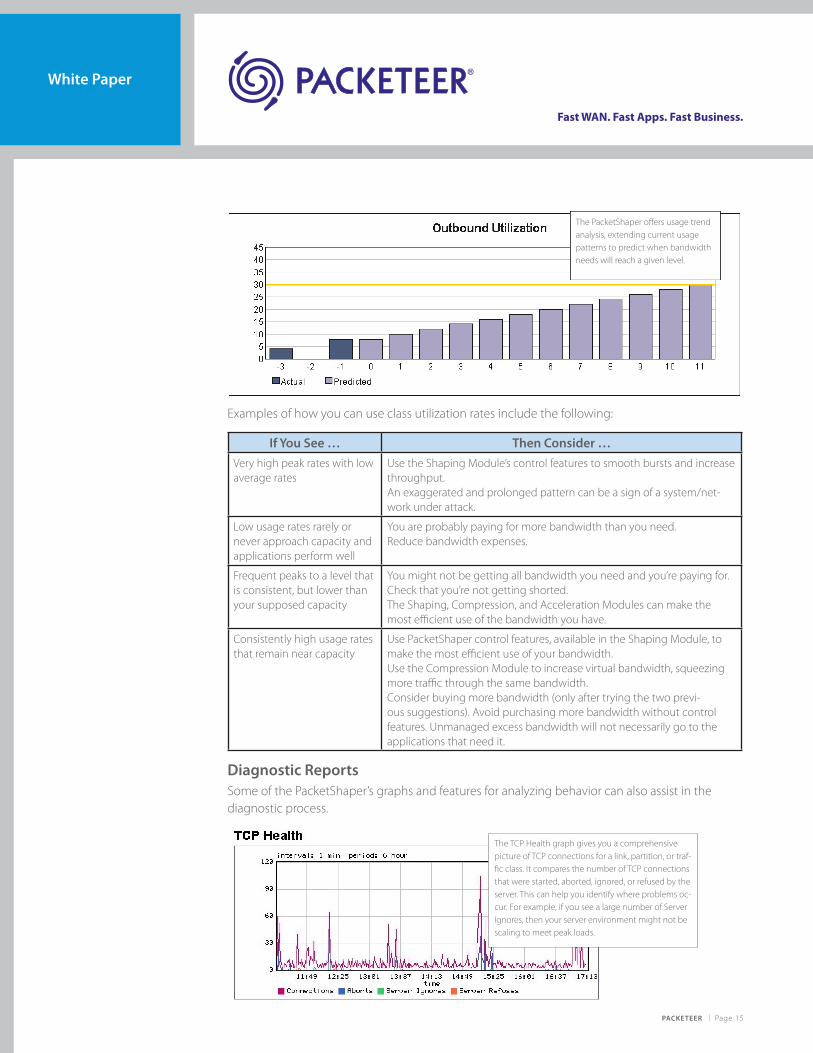
The PacketShaper offers usage trend analysis, extending current usage patterns to predict when bandwidth needs will reach a given level.
Examples of how you can use class utilization rates include the following:
If You See … Then Consider …Very high peak rates with low average rates
Use the Shaping Module’s control features to smooth bursts and increase throughput.An exaggerated and prolonged pattern can be a sign of a system/net-work under attack.
Low usage rates rarely or never approach capacity and applications perform well
You are probably paying for more bandwidth than you need. Reduce bandwidth expenses.
Frequent peaks to a level that is consistent, but lower than your supposed capacity
You might not be getting all bandwidth you need and you’re paying for. Check that you’re not getting shorted.The Shaping, Compression, and Acceleration Modules can make the most efficient use of the bandwidth you have.
Consistently high usage rates that remain near capacity
Use PacketShaper control features, available in the Shaping Module, to make the most efficient use of your bandwidth.Use the Compression Module to increase virtual bandwidth, squeezing more traffic through the same bandwidth. Consider buying more bandwidth (only after trying the two previ-ous suggestions). Avoid purchasing more bandwidth without control features. Unmanaged excess bandwidth will not necessarily go to the applications that need it.
Diagnostic ReportsSome of the PacketShaper’s graphs and features for analyzing behavior can also assist in the diagnostic process.
The TCP Health graph gives you a comprehensive picture of TCP connections for a link, partition, or traf-fic class. It compares the number of TCP connections that were started, aborted, ignored, or refused by the server. This can help you identify where problems oc-cur. For example, if you see a large number of Server Ignores, then your server environment might not be scaling to meet peak loads.
PACKETEER | Page �6
White Paper
Fast WAN. Fast Apps. Fast Business.
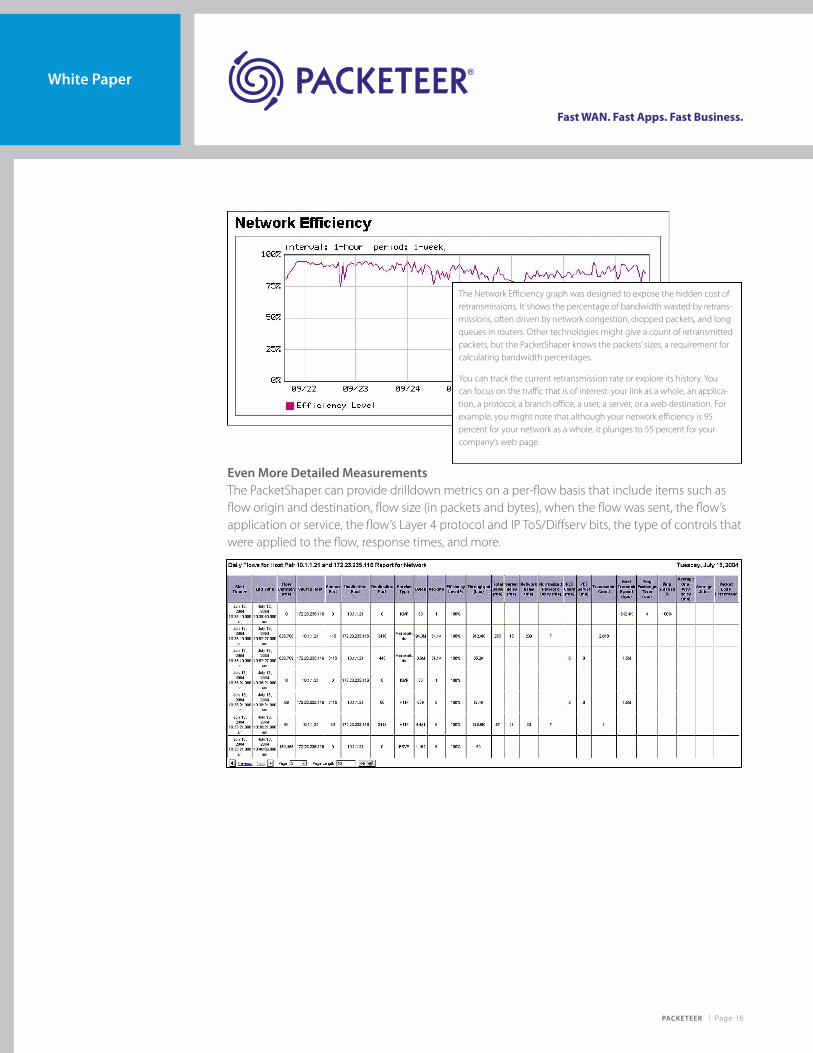
The Network Efficiency graph was designed to expose the hidden cost of retransmissions. It shows the percentage of bandwidth wasted by retrans-missions, often driven by network congestion, dropped packets, and long queues in routers. Other technologies might give a count of retransmitted packets, but the PacketShaper knows the packets’ sizes, a requirement for calculating bandwidth percentages.
You can track the current retransmission rate or explore its history. You can focus on the traffic that is of interest: your link as a whole, an applica-tion, a protocol, a branch office, a user, a server, or a web destination. For example, you might note that although your network efficiency is 95 percent for your network as a whole, it plunges to 55 percent for your company’s web page.
Even More Detailed MeasurementsThe PacketShaper can provide drilldown metrics on a per-flow basis that include items such as flow origin and destination, flow size (in packets and bytes), when the flow was sent, the flow’s application or service, the flow’s Layer 4 protocol and IP ToS/Diffserv bits, the type of controls that were applied to the flow, response times, and more.
PACKETEER | Page �7
White Paper
Fast WAN. Fast Apps. Fast Business.
This granular level of detail opens up a wealth of opportunity for enhanced troubleshooting and forensic help. For example:
• Examine the “chattiest” host IP pairs for traffic from a specific application, location, or combina-tion of the two.
• Split the traffic from one branch office into its different application, service, or DSCP types, even if you didn’t sub-classify traffic into its services as it passed.
• List traffic’s busiest ports; list the ports a specific application or host used; list which applica-tions used a specific port; spot potential portscans.
• Enable billing tools to bill customers or departments by application usage and, if desired, have different billing rates for different types of applications (such as for P2P, VoIP, email, and web surfing).
• Expose the top current or historical traffic contributors or recipients for a location or applica-tion (even when the Packeteer features to spot top contributors were not enabled during the time in question).
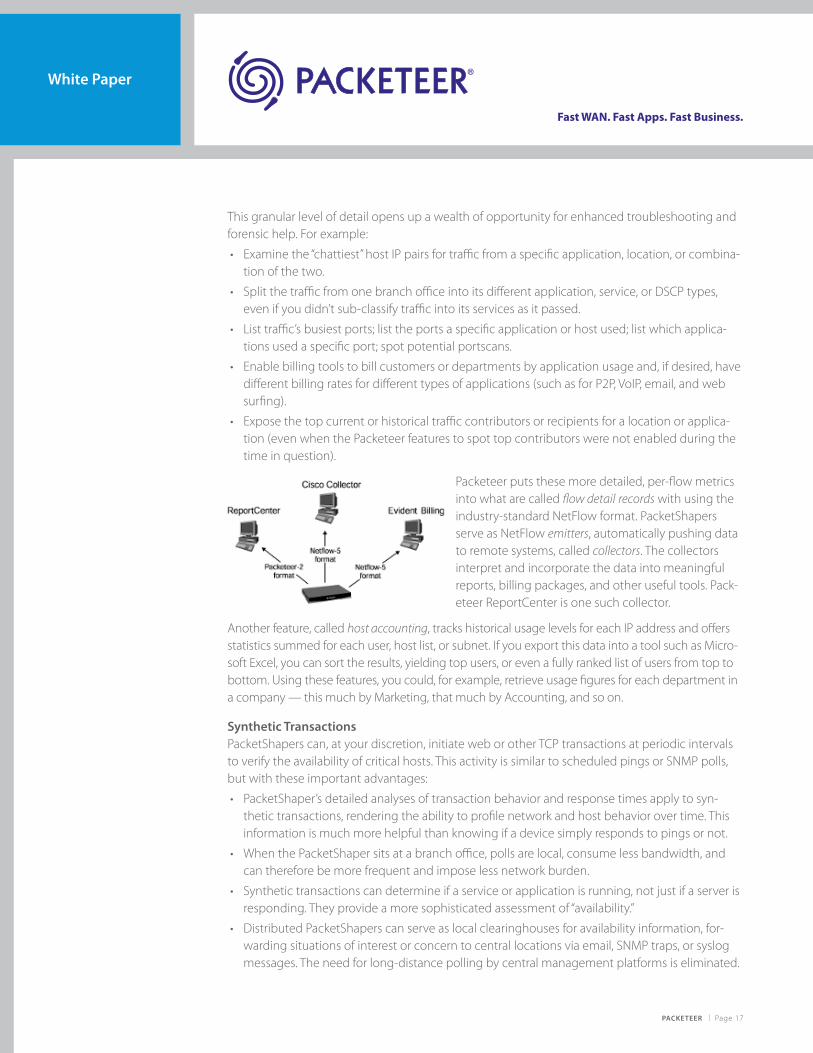
Packeteer puts these more detailed, per-flow metrics into what are called flow detail records with using the industry-standard NetFlow format. PacketShapers serve as NetFlow emitters, automatically pushing data to remote systems, called collectors. The collectors interpret and incorporate the data into meaningful reports, billing packages, and other useful tools. Pack-eteer ReportCenter is one such collector.
Another feature, called host accounting, tracks historical usage levels for each IP address and offers statistics summed for each user, host list, or subnet. If you export this data into a tool such as Micro-soft Excel, you can sort the results, yielding top users, or even a fully ranked list of users from top to bottom. Using these features, you could, for example, retrieve usage figures for each department in a company — this much by Marketing, that much by Accounting, and so on.
Synthetic TransactionsPacketShapers can, at your discretion, initiate web or other TCP transactions at periodic intervals to verify the availability of critical hosts. This activity is similar to scheduled pings or SNMP polls, but with these important advantages:
• PacketShaper’s detailed analyses of transaction behavior and response times apply to syn-thetic transactions, rendering the ability to profile network and host behavior over time. This information is much more helpful than knowing if a device simply responds to pings or not.
• When the PacketShaper sits at a branch office, polls are local, consume less bandwidth, and can therefore be more frequent and impose less network burden.
• Synthetic transactions can determine if a service or application is running, not just if a server is responding. They provide a more sophisticated assessment of “availability.”
• Distributed PacketShapers can serve as local clearinghouses for availability information, for-warding situations of interest or concern to central locations via email, SNMP traps, or syslog messages. The need for long-distance polling by central management platforms is eliminated.
PACKETEER | Page �8
White Paper
Fast WAN. Fast Apps. Fast Business.
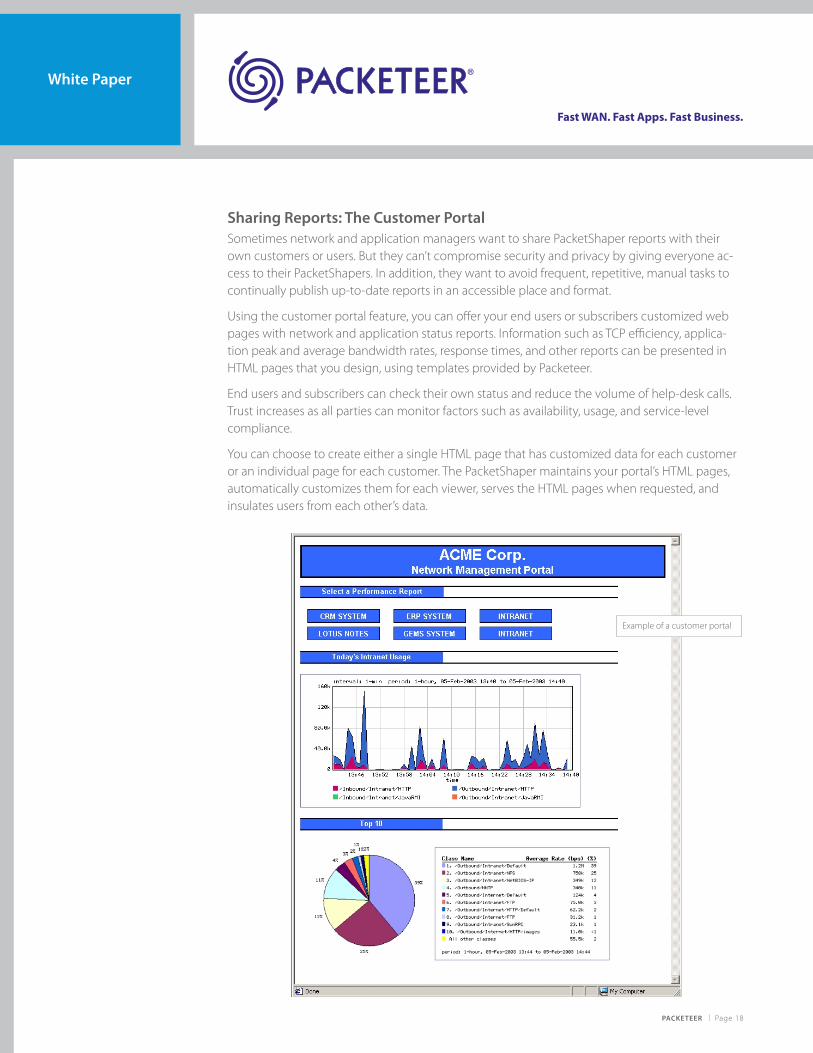
Sharing Reports: The Customer PortalSometimes network and application managers want to share PacketShaper reports with their own customers or users. But they can’t compromise security and privacy by giving everyone ac-cess to their PacketShapers. In addition, they want to avoid frequent, repetitive, manual tasks to continually publish up-to-date reports in an accessible place and format.
Using the customer portal feature, you can offer your end users or subscribers customized web pages with network and application status reports. Information such as TCP efficiency, applica-tion peak and average bandwidth rates, response times, and other reports can be presented in HTML pages that you design, using templates provided by Packeteer.
End users and subscribers can check their own status and reduce the volume of help-desk calls. Trust increases as all parties can monitor factors such as availability, usage, and service-level compliance.
You can choose to create either a single HTML page that has customized data for each customer or an individual page for each customer. The PacketShaper maintains your portal’s HTML pages, automatically customizes them for each viewer, serves the HTML pages when requested, and insulates users from each other’s data.
Example of a customer portal
PACKETEER | Page �9
White Paper
Fast WAN. Fast Apps. Fast Business.
Adaptive ResponseAlthough reports are valuable for many purposes, they are not the greatest choice to catch and respond to problems as they happen. Reports require human intervention — someone to gener-ate them, examine results, interpret findings, and take corrective action based on conclusions.
Most people don’t want to be caught by surprise by significant network or application events. Being notified of a few key situations — without having to continually check their status — avoids unpleasant consequences. Automatic problem detection and notification would solve this dilemma. The addition of automatic resolution would really make a compelling toolset.
PacketShaper’s adaptive response feature automatically monitors for conditions of interest, detects potential problems, notifies somebody if a problem is detected, and, optionally, takes corrective actions. You get to decide what constitutes a problem, if you want to be notified, if corrective actions are needed and, if so, which actions are appropriate.
The PacketShaper offers many preconfigured conditions that might be of interest, or you can define your own. Examples of situations you could monitor and possible automatic responses include:
• Send HP OpenView an alert when retransmissions rise to occupy �5 percent of your network.
• Dedicate more bandwidth to SAP or boost SAP’s MPLS service class whenever �0 percent or more of its transactions fail to respond within two seconds.
• Send yourself an email whenever a new application appears on the network that claims more than 8 percent of capacity.
• Temporarily contain and quarantine greedy users who consume an unfair portion of band-width.
Adaptive response uses PacketShaper’s Monitoring Module (to detect the conditions of interest and notify) and its Shaping Module (to take corrective actions).
Monitor Conditions and Respond Automatically When the PacketShaper monitors situation of interest, an agent is the mechanism that checks the condition and scrutinizes its status. Several groups of predefined agents include categories for the health of the network, applications, and the appliance itself.
Each adaptive response agent belongs to one of the following categories:
• Unit Health agents monitor capacity and load on a PacketShaper.
• Network Health agents monitor traffic efficiency and how much of a bandwidth partition is utilized.
• Application Health agents monitor new network traffic and traffic that is classified into /default.
• Host agents detect hosts that are using a disproportionate share of the link.
• Custom agents monitor the value of any PacketShaper metric to detect a variety of condi-tions for traffic classes, links, and partitions.
PACKETEER | Page 20
White Paper
Fast WAN. Fast Apps. Fast Business.
Because acceptable behavior on one network or unit might be considered unacceptable on another, you can customize each agent to reflect your own preferences. By tailoring an agent’s definition, you can monitor precisely the condition you have in mind and respond in the way you prefer. Items you can specify include:
• Condition or metric to monitor
Example: Check for individual hosts using unreasonable amounts of bandwidth.
• Threshold that indicates a problem
Example: Specify �2 percent as the percentage of capacity one host must use to be consid-ered unreasonable.
• Threshold that indicates a return to normalcy
Example: Specify 5 percent as the maximum percentage of capacity each host can use and still be considered reasonable.
• Frequency to check the metric or condition
Example: Check host usage every two minutes.
• If notification is needed, and, if so, which method (email, a Syslog server message, or an SNMP trap)
Example: Yes, notification is needed. Send an email to IT that explains the problem and in-cludes the offending host’s IP address.
• If automatic corrective actions are needed, and, if so, which actions (any PacketShaper com-mand with any parameters)
Example: Yes, corrective actions are needed. Enter the offending IP address in a host list, and limit the bandwidth to these hosts. (Note: Bandwidth restriction requires the Shaping Module.)
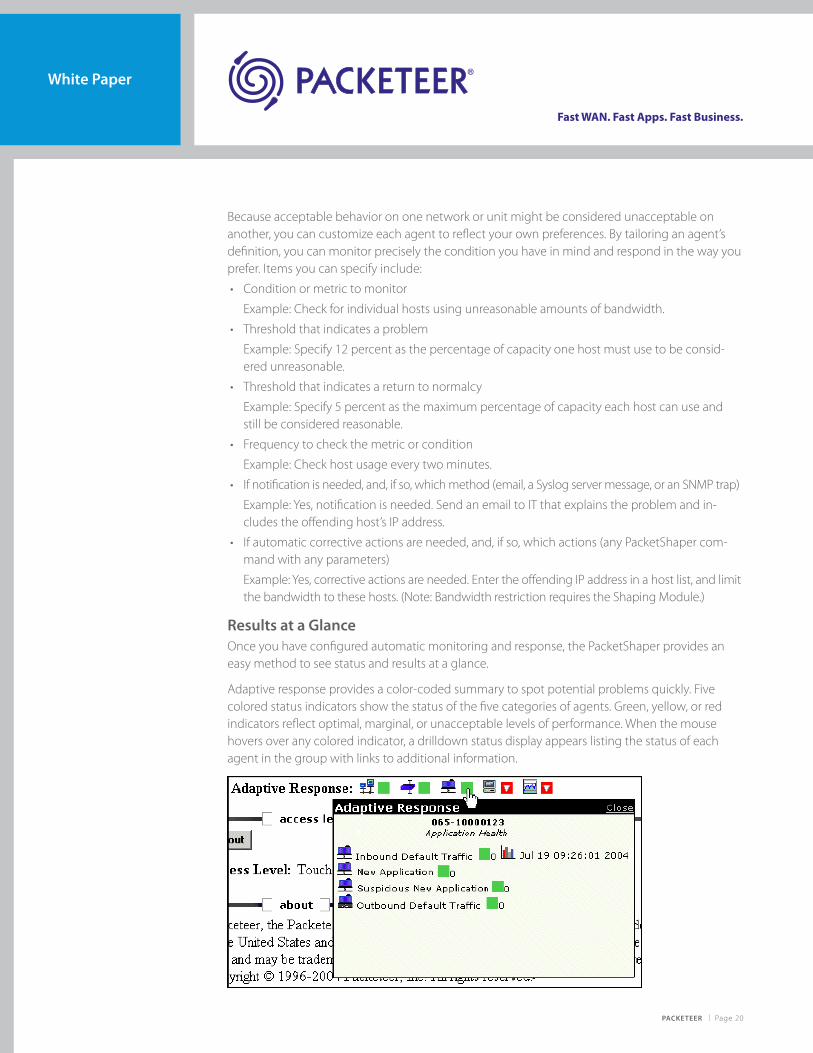
Results at a GlanceOnce you have configured automatic monitoring and response, the PacketShaper provides an easy method to see status and results at a glance.
Adaptive response provides a color-coded summary to spot potential problems quickly. Five colored status indicators show the status of the five categories of agents. Green, yellow, or red indicators reflect optimal, marginal, or unacceptable levels of performance. When the mouse hovers over any colored indicator, a drilldown status display appears listing the status of each agent in the group with links to additional information.

PACKETEER | Page 2�
White Paper
Fast WAN. Fast Apps. Fast Business.
In SummaryPacketeer’s visibility features reveal your network and applications’ behavior. Rather than simply collect data, The PacketShaper’s Monitoring Module organizes findings, synthesizes conclusions, and flags problems early to help manage your network more effectively. With the Monitor-ing Module included with the PacketShaper, you can find out which applications traverse the network, what portion of network bandwidth they consume, how well they perform, and where delays originate.
With the Monitoring Module, you can:
• Automatically detect and classify hundreds of business and recreational applications
• Identify top applications, users, servers, branch offices, and web destinations
• Analyze bandwidth usage, response times, the impact of configuration changes, and sources of delay
• Track response times and break them into time spent on the network and server
• Set standards for service levels and track their compliance
• Monitor conditions of interest, then, when thresholds are crossed, automatically take action to correct, document, and/or notify someone of the problem
• Measure, graph, and/or export more than �00 metrics describing usage, availability, efficiency, response times, errors, and diagnostics
If you’d like more information, consult Packeteer’s website (www.packeteer.com) or call 408-873-4400 or 800-697-2253.
Appendix A: Metrics and GraphsThe PacketShaper’s rich set of metrics can be viewed with built-in reports, with Packeteer’s cen-tral-reporting product (ReportCenter), or they can be retrieved for use by other tools. Third-party reporting packages (such as Concorde, InfoVista , Microsoft Excel and Word), standard web re-porting tools, NetFlow v5 collectors, and the reporting functions within HP OpenView and other SNMP-based platforms can all generate reports based on PacketShaper data.
Administrators can extract data using HTML, XML, and CGI APIs (application programming interfaces), or the PacketShaper user interface. In addition, SNMP requests, SNMP traps, and POP3 email all work for gathering either synchronous or asynchronous data. You can save extracted data in a variety of formats including SML, CSV, TSV, and ASCII. Packeteer’s HTML and XML APIs provide database connectivity. Most modern database packages, such as Oracle and ODBC, pro-vide data extraction agents based on these standards.
Most of the PacketShaper’s metrics can apply to all traffic or to just a portion, such as one applica-tion or a particular group of users. They can also reflect a flexible time interval.
PACKETEER | Page 22
White Paper
Fast WAN. Fast Apps. Fast Business.
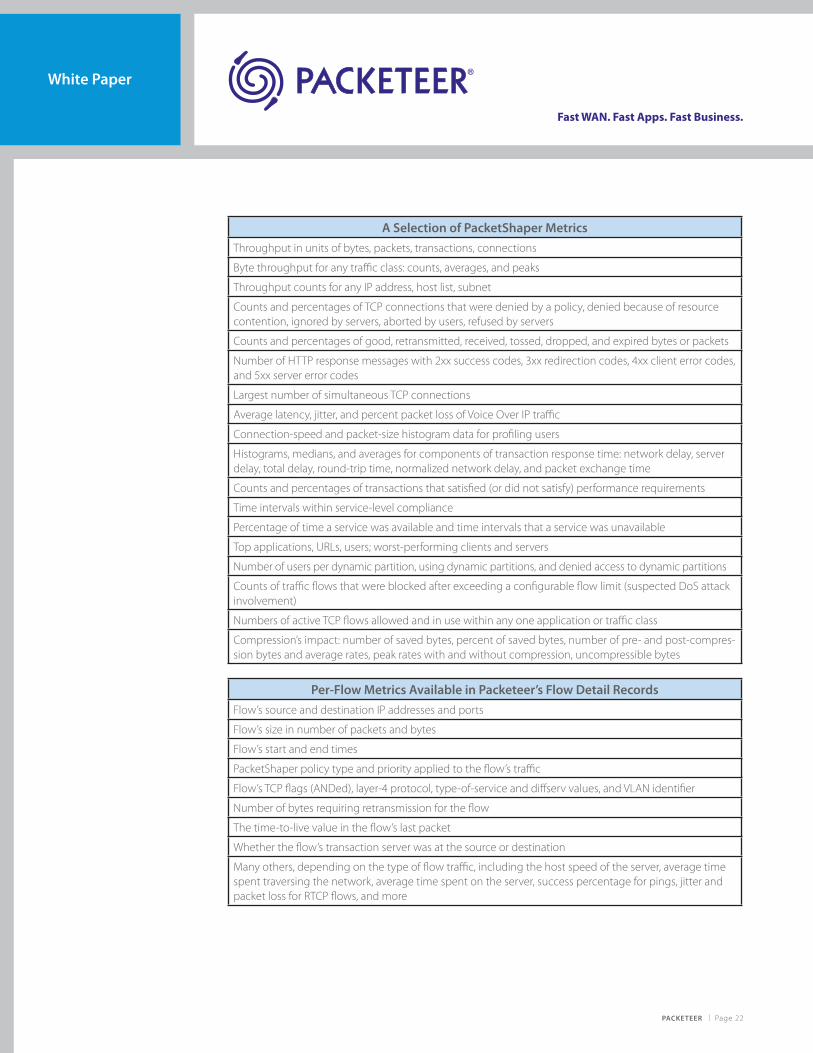
A Selection of PacketShaper MetricsThroughput in units of bytes, packets, transactions, connections
Byte throughput for any traffic class: counts, averages, and peaks
Throughput counts for any IP address, host list, subnet
Counts and percentages of TCP connections that were denied by a policy, denied because of resource contention, ignored by servers, aborted by users, refused by servers
Counts and percentages of good, retransmitted, received, tossed, dropped, and expired bytes or packets
Number of HTTP response messages with 2xx success codes, 3xx redirection codes, 4xx client error codes, and 5xx server error codes
Largest number of simultaneous TCP connections
Average latency, jitter, and percent packet loss of Voice Over IP traffic
Connection-speed and packet-size histogram data for profiling users
Histograms, medians, and averages for components of transaction response time: network delay, server delay, total delay, round-trip time, normalized network delay, and packet exchange time
Counts and percentages of transactions that satisfied (or did not satisfy) performance requirements
Time intervals within service-level compliance
Percentage of time a service was available and time intervals that a service was unavailable
Top applications, URLs, users; worst-performing clients and servers
Number of users per dynamic partition, using dynamic partitions, and denied access to dynamic partitions
Counts of traffic flows that were blocked after exceeding a configurable flow limit (suspected DoS attack involvement)
Numbers of active TCP flows allowed and in use within any one application or traffic class
Compression’s impact: number of saved bytes, percent of saved bytes, number of pre- and post-compres-sion bytes and average rates, peak rates with and without compression, uncompressible bytes
Per-Flow Metrics Available in Packeteer’s Flow Detail RecordsFlow’s source and destination IP addresses and ports
Flow’s size in number of packets and bytes
Flow’s start and end times
PacketShaper policy type and priority applied to the flow’s traffic
Flow’s TCP flags (ANDed), layer-4 protocol, type-of-service and diffserv values, and VLAN identifier
Number of bytes requiring retransmission for the flow
The time-to-live value in the flow’s last packet
Whether the flow’s transaction server was at the source or destination
Many others, depending on the type of flow traffic, including the host speed of the server, average time spent traversing the network, average time spent on the server, success percentage for pings, jitter and packet loss for RTCP flows, and more
PACKETEER | Page 23
White Paper
Fast WAN. Fast Apps. Fast Business.
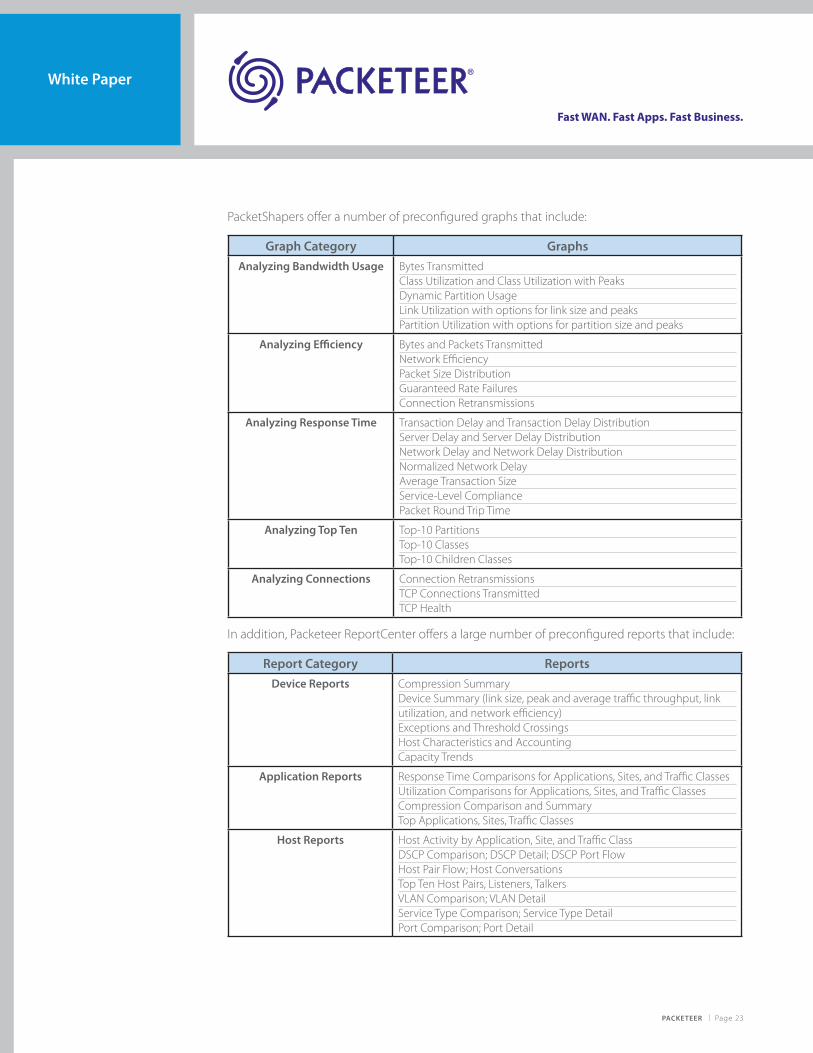
PacketShapers offer a number of preconfigured graphs that include:
Graph Category GraphsAnalyzing Bandwidth Usage Bytes Transmitted
Class Utilization and Class Utilization with PeaksDynamic Partition UsageLink Utilization with options for link size and peaksPartition Utilization with options for partition size and peaks
Analyzing Efficiency Bytes and Packets TransmittedNetwork EfficiencyPacket Size DistributionGuaranteed Rate FailuresConnection Retransmissions
Analyzing Response Time Transaction Delay and Transaction Delay DistributionServer Delay and Server Delay DistributionNetwork Delay and Network Delay DistributionNormalized Network DelayAverage Transaction SizeService-Level CompliancePacket Round Trip Time
Analyzing Top Ten Top-�0 PartitionsTop-�0 ClassesTop-�0 Children Classes
Analyzing Connections Connection RetransmissionsTCP Connections TransmittedTCP Health
In addition, Packeteer ReportCenter offers a large number of preconfigured reports that include:
Report Category ReportsDevice Reports Compression Summary
Device Summary (link size, peak and average traffic throughput, link utilization, and network efficiency) Exceptions and Threshold Crossings Host Characteristics and AccountingCapacity Trends
Application Reports Response Time Comparisons for Applications, Sites, and Traffic ClassesUtilization Comparisons for Applications, Sites, and Traffic ClassesCompression Comparison and SummaryTop Applications, Sites, Traffic Classes
Host Reports Host Activity by Application, Site, and Traffic ClassDSCP Comparison; DSCP Detail; DSCP Port FlowHost Pair Flow; Host ConversationsTop Ten Host Pairs, Listeners, TalkersVLAN Comparison; VLAN DetailService Type Comparison; Service Type DetailPort Comparison; Port Detail
PACKETEER | Page 24
White Paper
Fast WAN. Fast Apps. Fast Business.
Appendix B: Comparison with Probes and SniffersBecause Packeteer provides a monitoring solution, customers sometimes compare it with net-work probes, sniffers, protocol analyzers, and other common diagnostic tools that capture and analyze passing packets. The PacketShaper’s capabilities encompass more than these types of products, but there is some overlap.
Differences in InformationIn general, probes give low-level network information. Although detail about protocol underpin-nings and each interface on each device can assist with detailed connectivity troubleshooting, it does not help diagnose applications’ performance problems. It sometimes leaves users searching for a bigger picture or a broader conclusion.
PacketShaper’s correlated statistics on each traffic class make investigative efforts and perfor-mance conclusions easier. While a probe might give you packet rates on a per-interface or per-device basis, a PacketShaper can offer packet rates on a per-application or per-database basis, independent of host. If a host’s rate is what’s needed, a PacketShaper can do that too.
For example, suppose you’re investigating slow SAP performance. A probe might give you packet rates for one of the hosts using SAP. But which portion is SAP traffic? What about other SAP users? A PacketShaper gives you usage rates for SAP traffic — for everyone, certain hosts, and/or certain applications.
An Alternative to Distributed SniffersSometimes organizations deploy distributed sniffers at strategic locations throughout the network for use with third-party analyzing software such as EtherPeek, Ethereal, or a centralized, shared sniffer. The approach can be pricey, especially if many sites are involved.
Many of the statistics presented by sniffers, probes, and analyzers are also available from the PacketShaper’s screens, graphs, metrics, and/or flow detail records (see previous appendix). This data is usually more than sufficient, whether it’s viewed from within PacketShaper’s built-in reports, ReportCenter, or third-party reporting tools.
If you need information that Packeteer does not provide, and you think distributed, collection sniffers are the only alternative — you do have another option. PacketShaper can capture pack-ets and save them in log files for use with the very same analyzing software such as EtherPeek, Ethereal, or a centralized sniffer. You can even choose which traffic is logged and which is not with flexible criteria. And you can avoid a costly, distributed, sniffer deployment.
PACKETEER | Page 25
White Paper
Fast WAN. Fast Apps. Fast Business.
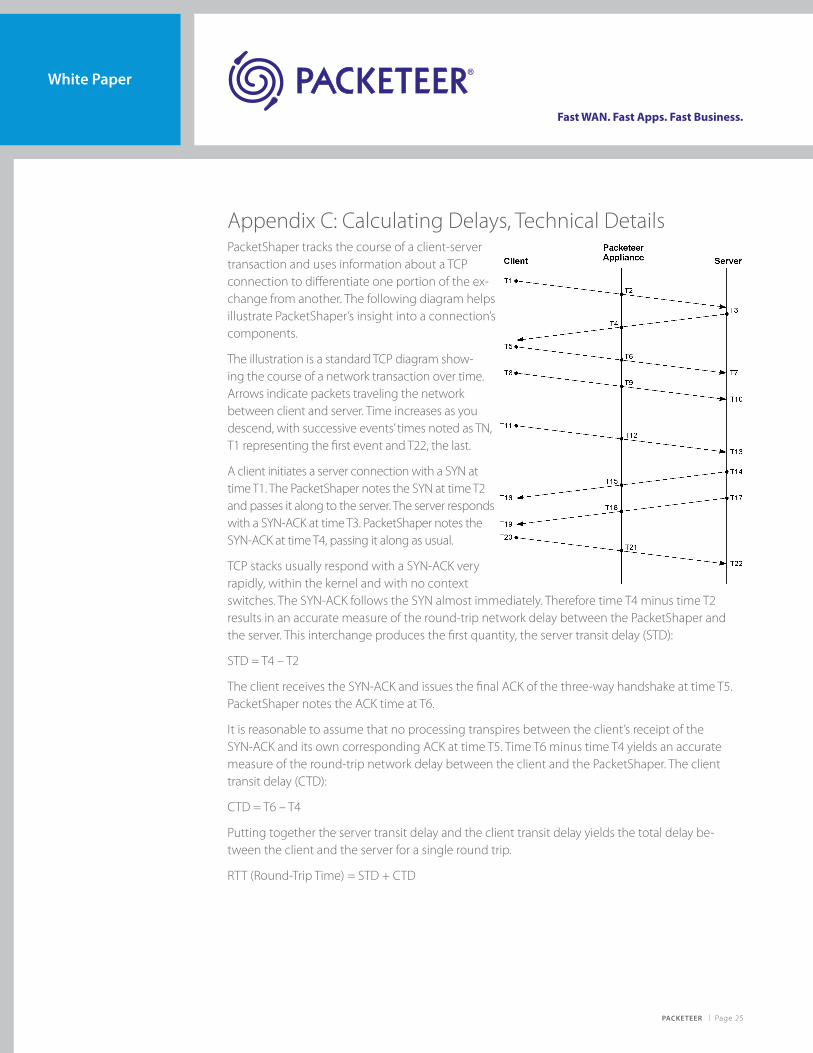
Appendix C: Calculating Delays, Technical DetailsPacketShaper tracks the course of a client-server transaction and uses information about a TCP connection to differentiate one portion of the ex-change from another. The following diagram helps illustrate PacketShaper’s insight into a connection’s components.
The illustration is a standard TCP diagram show-ing the course of a network transaction over time. Arrows indicate packets traveling the network between client and server. Time increases as you descend, with successive events’ times noted as TN, T� representing the first event and T22, the last.
A client initiates a server connection with a SYN at time T�. The PacketShaper notes the SYN at time T2 and passes it along to the server. The server responds with a SYN-ACK at time T3. PacketShaper notes the SYN-ACK at time T4, passing it along as usual.
TCP stacks usually respond with a SYN-ACK very rapidly, within the kernel and with no context switches. The SYN-ACK follows the SYN almost immediately. Therefore time T4 minus time T2 results in an accurate measure of the round-trip network delay between the PacketShaper and the server. This interchange produces the first quantity, the server transit delay (STD):
STD = T4 – T2
The client receives the SYN-ACK and issues the final ACK of the three-way handshake at time T5. PacketShaper notes the ACK time at T6.
It is reasonable to assume that no processing transpires between the client’s receipt of the SYN-ACK and its own corresponding ACK at time T5. Time T6 minus time T4 yields an accurate measure of the round-trip network delay between the client and the PacketShaper. The client transit delay (CTD):
CTD = T6 – T4
Putting together the server transit delay and the client transit delay yields the total delay be-tween the client and the server for a single round trip.
RTT (Round-Trip Time) = STD + CTD
PACKETEER | Page 26
White Paper
Fast WAN. Fast Apps. Fast Business.
Determining the Server DelayThe client initiates its request at time T8, arriving at the PacketShaper at time T9. For large re-quests, the request is divided into multiple packets. The TCP diagram eliminates the server’s cor-responding ACKs to simplify the picture, because these ACKs are not material to PacketShaper’s calculations. The last request packet, sent at time T��, has its push flag set to one indicating it is the final packet. PacketShaper notes the time of this last request packet at T�2.
After the last request packet arrives at the server at time T�3, the server assembles the request, conducts whatever processing is required for the request, and assembles its response. The server sends the first packet (of potentially several response packets) at time T�4. Time T�4 minus time T�3 is the actual server-processing time required for the request, but these times are not visible to the PacketShaper.
PacketShaper knows that the server’s processing time occurred after it saw the last request packet and before it saw the first response packet (time T�5 minus time T�2). Additionally, it knows that another component of this interval was the transit time from the PacketShaper to the server and back again. Conveniently, it already has that figure — it’s the server transit delay (STD). In addition, there is a small amount of time spent serializing the bits in the response packet and preparing them for their bit stream. This time was not included in the original server transit delay because the SYN and ACK packets are extremely small. PacketShaper knows the size of the packet, calculates this preparation time accordingly (∆�), and adds it to the STD before subtract-ing the sum from the time difference.
Server Delay = (T�5 – T�2) – (STD + ∆�)
Determining the Total DelayThe termination of a transaction is key to calculating the total delay; however, it’s not always obvi-ous when a transaction ends. The combination of a push flag from the server and its correspond-ing ACK from the client frequently signal the end. But long transactions often insert push flags throughout the transaction.
In addition to monitoring push flags, the PacketShaper uses a timer to track transactions and uses these rules:
• If a push flag seems to indicate a transaction’s end, but the server continues sending more data, the timer continues to advance.
• If the client sends a new request, the PacketShaper ends the last transaction and records the last time noted.
• If there is no activity from either the server or the client, the PacketShaper considers the trans-action complete and records the last time noted.
• When the connection ends, the PacketShaper sees the FIN and records the last time noted.
Using these techniques, the PacketShaper notes the last response packet at time T�8, makes sure that it saw all required ACKs for the request packets, and verifies that the last response packet indeed represented the end of the transaction.
After the client receives the final response packet at time T�9, it sends an ACK. The ACK reaches the PacketShaper at time T2�. The client’s perspective of response time starts with sending the first request packet (T8) and ends with receipt of the final response packet (T20). The Packet-
PACKETEER | Page 27
White Paper
Fast WAN. Fast Apps. Fast Business.
Shaper sees that interval as time T9 until time T2�. Although this is a close estimate of the client’s view, it’s missing some extra preparation time for serializing the first request packet, assuming it is larger than the final ACK. Because the PacketShaper knows the packet-size difference, it can calculate this small discrepancy (∆2).
Total delay = (T2� – T9) + ∆2
Once the PacketShaper has the server delay and the total delay, it can calculate the amount of time the transaction spent in transit.
Network delay = (Total delay) – (Server delay)
Whereas the RTT represents the transit time for just one round trip, the network delay reflects all transit time for the transaction. If the transaction’s data is large, multiple packets need to make their way to and from the server. Only the network delay reflects this overhead. The network de-lay is not necessarily an even multiple of the RTT because multiple packets are not sent consecu-tively but tend to overlap to varying degrees. In addition, because network and total delay are products of transaction size, ping times and RTM measurements are not comparable.
As you can see, the PacketShaper uses its intermediary position to make observations of elapsed time and data size during a transaction. Then it incorporates TCP basics to render accurate perfor-mance figures.
Copyright © 2004-2006 Packeteer, Inc. All rights reserved. Packeteer, the Packeteer logo, Mentat, PacketWise, PacketShaper, PacketShaper Xpress, PacketSeeker, ReportCenter, PolicyCenter and SkyX are trademarks or registered trademarks of Packeteer, Inc., in the United States and other countries. All other company trademarks are the property of their respective owners. No part of this document may be reproduced, photocopied, stored on a retrieval system, transmitted, or translated into another language without the express written consent of Packeteer, Inc., �608.A ��/04.