gao-14-575, conflict materials: stakeholder options for
TRANSCRIPT

CONFLICT MINERALS
Stakeholder Options for Responsible Sourcing Are Expanding, but More Information on Smelters Is Needed
Report to Congressional Committees
June 2014
GAO-14-575
United States Government Accountability Office

United States Government Accountability Office
Highlights of GAO-14-575, a report to congressional committees
June 2014
CONFLICT MINERALS Stakeholder Options for Responsible Sourcing Are Expanding, but More Information on Smelters Is Needed
Why GAO Did This Study Armed groups in eastern DRC continue to commit severe human rights abuses and profit from the exploitation of minerals, according to reports from the United Nations. Congress included a provision in the 2010 Dodd-Frank Wall Street Reform and Consumer Protection Act to address the trade in “conflict minerals”—tin, tantalum, tungsten, and gold. Section 1502 of the Act directed several U.S. agencies to report or focus on issues related to conflict minerals.
This report examines, among other things, (1) the extent to which relevant U.S. agencies have undertaken activities related to responsible sourcing of conflict minerals and (2) what is known about the status of, and information provided by, stakeholder initiatives focused on responsible sourcing of conflict minerals from the DRC and adjoining countries. GAO reviewed and analyzed documents and data covering 2003 through 2014. We interviewed representatives from State, USAID, SEC, Commerce, nongovernmental organizations, industry, and international organizations who are cognizant of conflict minerals issues.
What GAO Recommends GAO recommends that the Secretary of Commerce provide Congress a plan that outlines the steps, with associated timeframes, to develop and report the required information about smelters and refiners of conflict minerals worldwide. Commerce concurred with GAO’s recommendation and noted that it will submit a listing of all known conflict minerals processing facilities worldwide to Congress by September 1, 2014.
What GAO Found Since the Dodd-Frank Wall Street Reform and Consumer Protection Act (the Act) was passed in 2010, relevant U.S. agencies have undertaken various activities related to responsible sourcing of conflict minerals from the Democratic Republic of the Congo (DRC) and adjoining countries. In response to the Act, the Department of State (State) and the U.S. Agency for International Development (USAID) developed a strategy in 2011 to address the linkages among human rights abuses, armed groups, and the mining of conflict minerals and are implementing various strategy objectives. The Securities and Exchange Commission (SEC) issued a rule in 2012 requiring certain companies to disclose the source and chain of custody of necessary conflict minerals in their products. However, the Department of Commerce (Commerce) has not yet compiled a list of all conflict minerals processing facilities—smelters and refiners—known worldwide, required by January 2013 by the Act. Commerce cited difficulties with, for example, tracking conflict minerals operations but told GAO that it had completed outreach efforts with the majority of stakeholders. Commerce did not have a plan of action, with associated time frames, for developing and reporting on the list of conflict minerals processing facilities worldwide. Standard practices in program and project management include, among other things, developing a plan to execute specific projects needed to obtain defined results within a specific time frame. An action plan with timeframes could better position Commerce to report on the status of its efforts to produce a final list to Congress and to hold its personnel accountable for completing activities.
Over the past several years, a number of stakeholders—foreign governments, multilateral organizations, and industry associations, among others—have expanded, or made plans to expand, initiatives focused on responsible sourcing of conflict minerals in the DRC and adjoining countries. These stakeholder initiatives, such as in-region tracing of conflict minerals and development of guidance documents and audit protocols, have grown to include new mine sites, countries, and smelters. For example, the Conflict-Free Smelter Program, an industry-led effort, has expanded from 26 smelters certified as conflict-free in 2013 to 85 smelters as of April 25, 2014 (see table). New stakeholder initiatives are also underway or planned in the region, including the first responsible sourcing initiative in the Congo-Brazzaville. Some initiatives have yielded publicly available information, including data on production of conflict-free minerals and export data. For example, one stakeholder has reported production data for tin, tungsten, and tantalum from three provinces in the DRC and in Rwanda.
Number of Smelters and Refiners in the Conflict-Free Smelter Program as of April 25, 2014
Mineral Number of smelters/refiners
certified as compliant Number of smelters/refiners working toward certification Total
Tantalum 28 1 29 Tin 13 14 27 Tungsten 1 8 9 Gold 43 2 45 Total 85 25 110
Source: Conflict-Free Sourcing Initiative data, GAO (analysis). View GAO-14-575. For more information, contact Kimberly M. Gianopoulos at (202) 512-8612 or [email protected].

Page i GAO-14-575 Conflict Minerals
Letter 1
Background 5 U.S. Agencies Have Taken Actions Related to Responsible
Sourcing of Conflict Minerals, but Commerce Has Not Yet Fulfilled Its Requirements 13
Stakeholder Initiatives Are Expanding and Provide Some Information on Sourcing of Conflict Minerals 21
Little Additional Information on Rate of Sexual Violence in Eastern DRC and Adjoining Countries since July 2013 31
Conclusions 35 Recommendation for Executive Action 36 Agency and Third Party Comments and Our Evaluation 36
Appendix I Objectives, Scope, and Methodology 40
Appendix II State Department Map of Armed Groups Present at Mine Sites in the Democratic Republic of the Congo 43
Appendix III SEC Flowchart Summary of the Disclosure Process for the Final Conflict Minerals Rule 45
Appendix IV Sample Data from the ITRI Supply Chain Initiative 48
Appendix V Conflict Mineral Production and Export Data as Reported by the DRC and Rwandan Governments 52
Appendix VI Conflict Minerals Data from the International Trade Centre Data on Global Conflict Mineral Imports 56
Appendix VII Comments from the Department of Commerce 65
Contents

Page ii GAO-14-575 Conflict Minerals
Appendix VIII GAO Contacts and Staff Acknowledgments 67
Tables
Table 1: Number of Smelters and Refiners in the Conflict-Free Smelter Program as of April 25, 2014 23
Table 2: Production of Minerals from Maniema Covered by iTSCi for Q1 and Q2 of 2013, in Metric Tons 48
Table 3: Sales of Minerals from Maniema Covered by iTSCi for Q1 and Q2 of 2013, in Thousands of U.S. Dollars 49
Table 4: Production of Minerals from South Kivu Covered by iTSCi for Q4 of 2012 through Q2 of 2013, in Metric Tons 49
Table 5: Sales of Minerals from South Kivu Covered by iTSCi for Q4 of 2012 through Q2 of 2013, in Thousands of U.S. Dollars 49
Table 6: Production of Minerals from Katanga Covered by iTSCi for Q2 of 2011 through Q2 of 2013, in Metric Tons 50
Table 7: Sales of Minerals from Katanga Covered by iTSCi for Q2 of 2011 through Q2 of 2013, in Thousands of U.S. Dollars 50
Table 8: Production of Minerals from Rwanda Covered by iTSCi for Q2 of 2011 through Q2 of 2013, in Metric Tons 51
Table 9: Sales of Minerals from Rwanda Covered by iTSCi for Q2 of 2011 through Q2 of 2013, in Thousands of U.S. Dollars 51
Table 10: Total Volume of Tin Production and Export from DRC for 2003-2012, in Metric Tons 52
Table 11: Total Volume of Tantalum Production and Export from DRC for 2003-2012, in Metric Tons 53
Table 12: Total Volume of Tungsten Production and Export from DRC for 2003-2012, in Metric Tons 53
Table 13: Total Volume of Gold Production and Export from DRC for 2003-2012, in Metric Tons 54
Table 14: Total Volume of Tin, Tantalum, and Tungsten Exports from Rwanda January-August 2013, in Metric Tons 54
Table 15: Total Value of Tin, Tantalum, and Tungsten Exports from Rwanda January-August 2013, in Thousands of U.S. Dollars 55
Table 16: ITC Estimates of Exports of Conflict Minerals from the Democratic Republic of the Congo for Fiscal Years 2009-2013, in Metric Tons 56

Page iii GAO-14-575 Conflict Minerals
Table 17: ITC Estimates of Export Value of Conflict Minerals from the DRC for F Fiscal Years 2009-2013, in Thousands of U.S. Dollars 57
Table 18: ITC Estimates of Exports of Conflict Minerals from Angola for Fiscal Years 2009-2012, in Metric Tons 57
Table 19: ITC Estimates of Export Value of Conflict Minerals from Angola for Fiscal Years 2009-2013, in Thousands of U.S. Dollars 58
Table 20: ITC Estimates of Exports of Conflict Minerals from Burundi for Fiscal Years 2009-2012, in Metric Tons 58
Table 21: ITC Estimates of Export Value of Conflict Minerals from Burundi for Fiscal Years 2009-2013, in Thousands of U.S. Dollars 59
Table 22: ITC Estimates of Exports of Conflict Minerals from Central African Republic for Fiscal Years 2009-2012, in Metric Tons 59
Table 23: ITC Estimates of Export Value of Conflict Minerals from Central African Republic for Fiscal Years 2009-2013, in Thousands of U.S. Dollars 60
Table 24: ITC Estimates of Exports of Conflict Minerals from Rwanda for Fiscal Years 2009-2012, in Metric Tons 60
Table 25: ITC Estimates of Export Value of Conflict Minerals from Rwanda for Fiscal Years 2009-2013, in Thousands of U.S. Dollars 61
Table 26: ITC Estimates of Export of Conflict Minerals from Tanzania for Fiscal Years 2009-2012, in Metric Tons 61
Table 27: ITC Estimates of Export Value of Conflict Minerals from Tanzania for Fiscal Years 2009-2013, in Thousands of U.S. Dollars 62
Table 28: ITC Estimates of Exports of Conflict Minerals from Uganda for Fiscal Years 2009-2012, in Metric Tons 62
Table 29: ITC Estimates of Export Value of Conflict Minerals from Uganda for Fiscal Years 2009-2013, in Thousands of U.S. Dollars 63
Table 30: ITC Estimates of Exports of Conflict Minerals from Zambia for Fiscal Years 2009-2012, in Metric Tons 63
Table 31: ITC Estimates of Export Value of Conflict Minerals from Zambia for Fiscal Years 2009-2013, in Thousands of U.S. Dollars 64

Page iv GAO-14-575 Conflict Minerals
Figures
Figure 1: Map of the Democratic Republic of the Congo with Provinces and Adjoining Countries 6
Figure 2: Simplified Conflict Minerals Supply Chain 11 Figure 3: Timeline of the Starting Dates of Stakeholder-led
Initiatives from 2008 to June 2014 22 Figure 4: Timeline of Population-Based Surveys Estimating the
Rate of Sexual Violence in Eastern DRC, Rwanda, Uganda, and Burundi 33
Figure 5: State Department Map of the Presence of Armed Groups at Mine Sites in the Democratic Republic of the Congo, as of February 2014 44
Figure 6: SEC Flowchart Summary of Conflict Minerals Rule 46
Page v GAO-14-575 Conflict Minerals
Abbreviations BGR German Federal Institute for Geosciences and Natural Resources CFSI Conflict-Free Sourcing Initiative CFTI Conflict-Free Tin Initiative Commerce United States Department of Commerce DHS Demographic and Health Survey Dodd-Frank Act Dodd-Frank Wall Street Reform and Consumer Protection Act DRC Democratic Republic of the Congo EICC Electronic Industry Citizenship Coalition GeSI Global e-Sustainability Initiative EU European Union ICGLR International Conference on the Great Lakes Region iTSCi ITRI Tin Supply Chain Initiative LBMA London Bullion Market Association M-23 March 23 Movement MONUSCO UN Organization Stabilization Mission in the Democratic Republic of the Congo NGO nongovernmental organization OECD Organisation for Economic Co-operation and Development PPA Public-Private Alliance for Responsible Minerals Trade SEC Securities and Exchange Commission State United States Department of State UN United Nations USAID United States Agency for International Development
This is a work of the U.S. government and is not subject to copyright protection in the United States. The published product may be reproduced and distributed in its entirety without further permission from GAO. However, because this work may contain copyrighted images or other material, permission from the copyright holder may be necessary if you wish to reproduce this material separately.

Page 1 GAO-14-575 Conflict Minerals
441 G St. N.W. Washington, DC 20548
June 26, 2014
Congressional Committees
Over the past decade, the United States and the international community have sought to improve security in the Democratic Republic of the Congo (DRC), the site of one of the world’s worst humanitarian crises. The International Rescue Committee has previously estimated that since 1998, more than 5.4 million people have died in the DRC as a result of this crisis, which has also destabilized the minerals-rich eastern part of the country, created insecurity, displaced thousands of people, and perpetuated a cycle of poverty. As we previously reported, illegal armed groups and some units of the Congolese national military have committed severe human rights abuses and mass killings and profited from the illegal exploitation of minerals originating in eastern DRC, particularly in the provinces of North Kivu and South Kivu.1 Despite some success in efforts to improve security in eastern DRC—notably, the November 2013 defeat of M-23, an illegal armed group,2 as well as campaigns against other illegal armed groups—the UN reported that as of December 2013, illegal armed groups in eastern DRC continued to pose a threat to security, to be responsible for human rights abuses and displacements of people, and to derive funding from the illicit production, trade, and smuggling of conflict minerals.3
Citing the continuing urgency of the humanitarian situation and the need to take action, in July 2010, Congress included in the Dodd-Frank Wall Street Reform and Consumer Protection Act (hereafter referred to as the
1GAO, The Democratic Republic of the Congo: U.S. Agencies Should Take Further Actions to Contribute to the Effective Regulation and Control of the Minerals Trade in Eastern Democratic Republic of the Congo, GAO-10-1030 (Washington, D.C.: Sept. 30, 2010). 2M-23 was created in May 2012 in eastern DRC and surrendered to DRC forces in November 2013. 3United Nations Security Council, “Letter dated 12 December 2013 from the Group of Experts on the Democratic Republic of the Congo addressed to the Chair of the Security Council Committee established pursuant to resolution 1533 (2004) concerning the Democratic Republic of the Congo,” Annex to “Letter dated 22 January 2014 from the Coordinator of the Group of Experts on the Democratic Republic of the Congo addressed to the President of the Security Council,” S/2014/42 (Jan. 23, 2014).

Page 2 GAO-14-575 Conflict Minerals
Act or Dodd-Frank Act) provisions pertaining to trade involving conflict minerals—tantalum, tin, tungsten, and gold.4 Section 1502 of the Act directed several U.S. agencies—the Securities and Exchange Commission (SEC), the Department of State (State), the U.S. Agency for International Development (USAID), and the Department of Commerce (Commerce)—to take certain actions to implement the Act’s conflict minerals provisions, including provisions related to responsible sourcing of conflict minerals from the DRC and the adjoining countries.5 The Act specifically directed the SEC to promulgate a rule, which SEC issued in August 2012, that requires certain issuers to disclose annually to SEC whether any of such minerals are necessary to the functionality or production of products manufactured, or contracted to be manufactured, by the issuer originated in the DRC or adjoining country and if so, to provide an additional report.6
To address our mandates, since July 2011 we have issued several reports on topics ranging from the rate of sexual violence in the DRC and adjoining countries to SEC’s rule and initiatives focused on responsible
The Act also mandated GAO to report, beginning in 2012 and annually thereafter, on the effectiveness of the SEC rule in promoting peace and security in the DRC and adjoining countries, and annually, beginning in 2011, on the rate of sexual violence in war-torn areas of DRC and adjoining countries, among other things.
4The Dodd-Frank Act defines conflict minerals as columbite-tantalite (coltan), cassiterite, gold, wolframite, or their derivatives, or any other mineral or its derivatives that are determined by the Secretary of State to be financing conflict in the DRC or an adjoining country. See Pub. L. No. 111-203 §1502, (e)(4). Columbite-tantalite (coltan), cassiterite, and wolframite are the ores from which tantalum, tin, and tungsten, respectively, are processed. 5In this report, the countries adjoining DRC—Angola, Burundi, Central African Republic, the Republic of the Congo, Rwanda, South Sudan, Tanzania, Uganda, and Zambia—are often termed “Dodd-Frank affected countries.” 6Under the rule, SEC-reporting companies with “necessary” conflict minerals in products they manufactured or contracted to have manufactured must conduct a “reasonable country of origin inquiry” to determine whether their conflict minerals originated in the DRC or adjoining countries. If none of their conflict minerals originated in that region, they must file a Form SD to disclose the reasonable country of origin inquiry they conducted and the results. If any of a company’s “necessary” conflict minerals originated in the DRC or adjoining countries, the company must exercise due diligence on the source and chain of custody of its conflict minerals and also file a Conflict Minerals Report.
Page 3 GAO-14-575 Conflict Minerals
sourcing of minerals.7 Because the first SEC-required disclosures of manufacturers’ use of conflict minerals were not due to SEC until June 2014, and because sufficient time must elapse to allow the rule’s full impact to materialize, we have not yet addressed the effectiveness of SEC’s conflict minerals rule as required under the legislation. Moreover, our ability to report on the rule’s effectiveness will depend on the availability of information on stakeholder initiatives to, for example, monitor, ensure, or report on responsible sourcing of conflict minerals from the DRC and adjoining countries.8
1. the extent to which relevant U.S. agencies have taken actions related to the responsible sourcing of conflict minerals;
Consequently, in this report, we examine
2. what is known about the status of, and any information provided by, stakeholder initiatives focused on responsible sourcing of conflict minerals from the DRC and adjoining countries; and
3. any new information about the rate of sexual violence in eastern DRC and three adjoining countries—Burundi, Rwanda, and Uganda—that has become available since we issued our 2013 report.9
To address our first and second objectives, we reviewed and analyzed available data covering 2003 through 2014 on conflict minerals from the DRC and adjoining countries and from responsible sourcing initiatives, as well as reports and other documents from relevant U.S. agencies, foreign governments, multilateral organizations, nongovernmental organizations (NGOs), and industry associations. Because the data were not used to
7GAO, The Democratic Republic of the Congo: Information on the Rate of Sexual Violence in War-Torn Eastern DRC and Adjoining Countries, GAO-11-702 (Washington, D.C.: July 13, 2011); Conflict Minerals Disclosure Rule: SEC’s Actions and Stakeholder-Developed Initiatives, GAO-12-763 (Washington, D.C.: July 16, 2012); SEC Conflict Minerals Rule: Information on Responsible Sourcing and Companies Affected, GAO-13-689 (Washington, D.C.: July 18, 2013). In our 2012 report, we addressed, for example, a congressional mandate that asked us to describe any issues that the SEC encountered in promulgating a conflict minerals disclosure rule. In our 2013 report, we addressed, for example, a mandate that asked us to describe information that may be publicly available about entities that use conflict minerals but are not required to report to SEC under the rule. 8Stakeholders include relevant U.S. agencies; foreign governments; multilateral organizations, such as the Organization for Economic Cooperation and Development (OECD); nongovernmental organizations (NGOs); and industry associations. 9GAO-13-689.

Page 4 GAO-14-575 Conflict Minerals
support findings, conclusions, or recommendations, we did not assess their reliability. We also interviewed State, USAID, Commerce, and SEC officials as well as stakeholder representatives from international organizations, NGOs, and industry associations who are cognizant of conflict minerals issues. We selected these stakeholders based on their expertise on responsible sourcing issues, because they represented a range of perspectives on conflict minerals, and because we had established contacts with these entities on our last review.10 In addition, some of the stakeholders we talked to have been working on the ground in the DRC. The stakeholders we spoke with constitute a nongeneralizable sample, and the information we gathered from them cannot be used to infer views of other stakeholders cognizant of conflict minerals issues. To address our third objective, we reviewed and analyzed relevant documents and interviewed representatives from State, USAID, various UN agencies, relevant NGOs, and researchers to identify any new data on sexual violence. Specifically, we followed up with officials from those groups we interviewed for our prior review on sexual violence rates in eastern DRC and adjoining countries.11
We conducted this performance audit from September 2013 to June 2014 in accordance with generally accepted government auditing standards. Those standards require that we plan and perform the audit to obtain sufficient, appropriate evidence to provide a reasonable basis for our findings and conclusions based on our audit objectives. We believe that the evidence obtained provides a reasonable basis for our findings and conclusions based on our audit objectives.
We also conducted Internet literature searches to identify new academic articles containing any additional information available since our 2013 report. See appendix I for a complete description of our scope and methodology.
10GAO-13-689. 11GAO-13-689.

Page 5 GAO-14-575 Conflict Minerals
The DRC is a vast, mineral-rich nation with an estimated population of about 75 million people and an area that is roughly one-quarter the size of the United States, according to the UN. The map in figure 1 shows the DRC’s provinces and adjoining countries.
Background
Brief History of Conflict in the DRC and the Region

Page 6 GAO-14-575 Conflict Minerals
Figure 1: Map of the Democratic Republic of the Congo with Provinces and Adjoining Countries

Page 7 GAO-14-575 Conflict Minerals
Since its independence in 1960, the DRC has undergone political upheaval, including a civil war, according to State. In particular, the eastern DRC has continued to be plagued by violence often perpetrated by illegal armed groups and some members of the Congolese national military against civilians. In November 2012, M-23, an illegal armed group, occupied the city of Goma and other cities in eastern DRC and clashed with the Congolese national army. During this time, the UN reported numerous cases of sexual violence against civilians, including women and children, that were perpetrated by armed groups and some members of the Congolese national military.12
Prior to the defeat of M-23, in February 2013, the 11 countries in the region adopted the “Peace, Security and Cooperation Framework for the Democratic Republic of the Congo and the Region.”
Although M-23 eventually withdrew from the cities, the group’s presence in the region continued. In December 2012, the Ugandan president began to broker peace talks, known as the Kampala Dialogue, between M-23 and the DRC government, aimed at reaching a final and principled agreement that ensured the disarmament and demobilization of M-23 and accountability for human rights abuses. The M-23 was defeated in November 2013 by the Congolese national military with support from UN forces. In December 2013, the former M-23 and the DRC each signed individual declarations that, among other things, set out the conditions for the disarmament, demobilization, and reintegration of M23 into Congolese society and called for those responsible for war crimes and crimes against humanity to be held accountable.
13
12The Office of the High Commissioner for Human Rights and the United Nations Organization Stabilization Mission in the Democratic Republic of the Congo (MONUSCO) issued a report in May 2013 on mass rapes and other violations of human rights committed in Minova, a town in South Kivu, and surrounding areas in November 2012. The report documented 135 cases of sexual violence perpetrated by elements of the Congolese national army in and around the town of Minova as units retreated from the front lines.
Some of the
13The eleven signatories to the framework were Angola, Burundi, the Central Africa Republic, the DRC, the Republic of the Congo (also known Congo-Brazzaville), Rwanda, South Africa, South Sudan, Tanzania, Uganda, and Zambia. The UN Secretary-General, the Chairperson of the African Union Commission, the Chairperson of the Southern African Development Community, and the Chairperson of the International Conference on the Great Lakes Region signed the agreement as witnesses. In January 2014, two additional countries, Kenya and Sudan, also signed the framework. According to the UN, the framework encompasses commitments at the national, regional and international levels to bring peace and stability to the eastern DRC and the region.
Page 8 GAO-14-575 Conflict Minerals
adjoining countries in the region have also experienced recent turmoil, which has led to flows of large numbers of refugees into the DRC in addition to internally displaced persons.14
The United Nations High Commissioner for Refugees (UNHCR) estimated, as of mid 2013, that there were close to 50,000 refugees from the Central African Republic, in addition to over 120,000 refugees from other countries, as well as around 2.6 million internally displaced persons living in camps or with host families in the DRC.
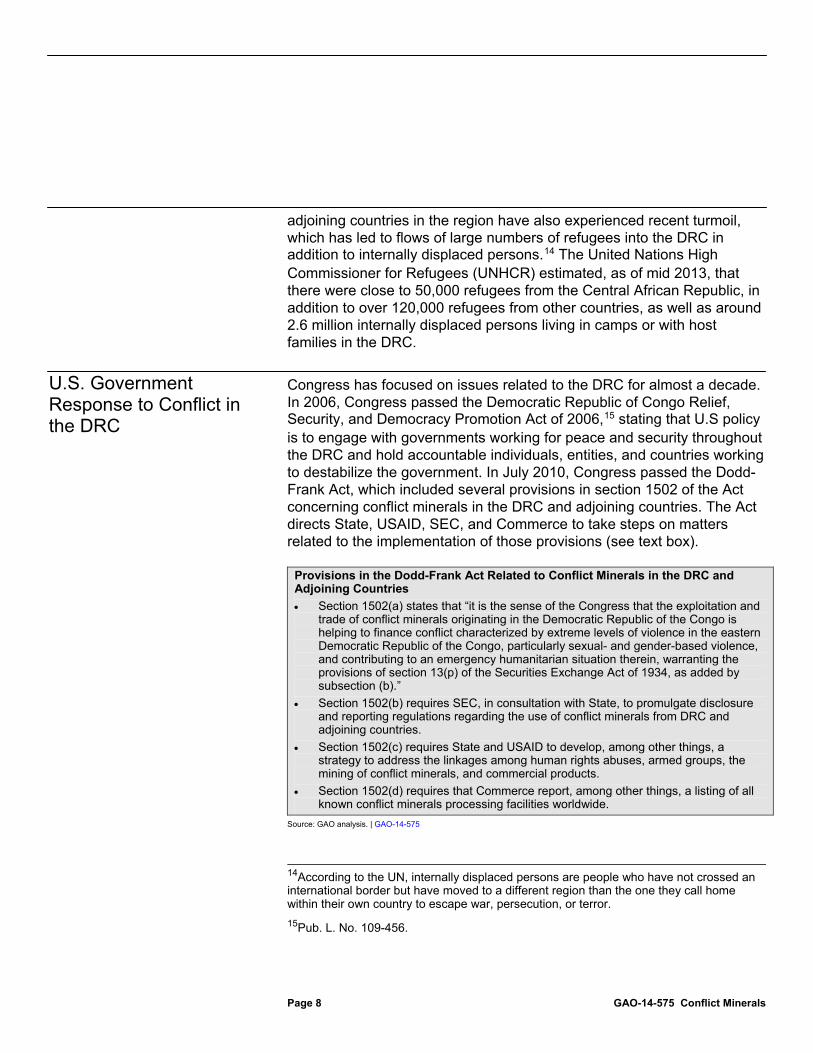
Congress has focused on issues related to the DRC for almost a decade. In 2006, Congress passed the Democratic Republic of Congo Relief, Security, and Democracy Promotion Act of 2006,15
Provisions in the Dodd-Frank Act Related to Conflict Minerals in the DRC and Adjoining Countries
stating that U.S policy is to engage with governments working for peace and security throughout the DRC and hold accountable individuals, entities, and countries working to destabilize the government. In July 2010, Congress passed the Dodd-Frank Act, which included several provisions in section 1502 of the Act concerning conflict minerals in the DRC and adjoining countries. The Act directs State, USAID, SEC, and Commerce to take steps on matters related to the implementation of those provisions (see text box).
• Section 1502(a) states that “it is the sense of the Congress that the exploitation and trade of conflict minerals originating in the Democratic Republic of the Congo is helping to finance conflict characterized by extreme levels of violence in the eastern Democratic Republic of the Congo, particularly sexual- and gender-based violence, and contributing to an emergency humanitarian situation therein, warranting the provisions of section 13(p) of the Securities Exchange Act of 1934, as added by subsection (b).”
• Section 1502(b) requires SEC, in consultation with State, to promulgate disclosure and reporting regulations regarding the use of conflict minerals from DRC and adjoining countries.
• Section 1502(c) requires State and USAID to develop, among other things, a strategy to address the linkages among human rights abuses, armed groups, the mining of conflict minerals, and commercial products.
• Section 1502(d) requires that Commerce report, among other things, a listing of all known conflict minerals processing facilities worldwide.
Source: GAO analysis. | GAO-14-575
14According to the UN, internally displaced persons are people who have not crossed an international border but have moved to a different region than the one they call home within their own country to escape war, persecution, or terror. 15Pub. L. No. 109-456.
U.S. Government Response to Conflict in the DRC

Page 9 GAO-14-575 Conflict Minerals
In addition, in July 2013, the United States appointed the current Special Envoy for the Great Lakes Region and the DRC, whose office develops and leads the implementation of U.S. regional policy on cross-border security, political, economic and social issues. The Special Envoy leads U.S. efforts to support the implementation of the Peace, Security, and Cooperation Framework Agreement, including the development and implementation of a comprehensive strategy to stop human suffering and violence in the region, by promoting political, economic, and social reconciliation.
In 1999, the UN Security Council authorized peacekeeping operations in the DRC, known as the UN Organization Mission in Democratic Republic of the Congo (MONUC).16
The international community has also responded to the conflict in the DRC and adjoining countries by appointing special envoys to the region. For example, in March 2013, the UN appointed a Special Envoy of the Secretary-General for the Great Lakes Region to support the implementation of the 11-nation Peace, Security and Cooperation Framework for the Democratic Republic of the Congo and the Region.
MONUC’s mission included achieving a ceasefire and protecting civilians and other nonmilitary personnel from threats of physical violence. In 2010, MONUC was replaced by the UN Organization Stabilization Mission in the Democratic Republic of the Congo (MONUSCO), whose priorities also include protecting civilians and stabilizing the country.
17
16Initially, MONUC’s focus was on the ceasefire and disengagement of forces and maintenance of liaison with all parties involved with the civil war, but the operation expanded to include the effective protection of civilians, humanitarian personnel, and human rights defenders under imminent threat of physical violence.
In June 2013, the UN also appointed the current Special Representative of the Secretary-General for the Democratic Republic of the Congo and Head of MONUSCO. Both the European Union and African Union also have appointed representatives for the Great Lakes Region. To address imminent threats to peace and security, the UN Security Council also authorized the deployment of a force intervention brigade within the current peacekeeping operations in the DRC on March 28, 2013. The
17According to the UN, the envoy’s key tasks include undertaking good offices to strengthen the relations between the signatories of the framework, revitalizing existing accords and coordinating the international engagement.
International Response to Conflict in the DRC

Page 10 GAO-14-575 Conflict Minerals
objectives of the new force based in North Kivu province are to neutralize armed groups, reduce the threat they pose to state authority and civilian security, and make space for stabilization activities.18
In addition, the European Union (EU) is exploring possible legislation related to conflict minerals and responsible sourcing.
19 According to a European Commission release, in March 2014, the EU proposed a draft regulation setting up an EU system of self-certification for importers of tin, tantalum, tungsten, and gold for imports into the EU. The draft regulation indicated that the self-certification would align with the Organization for Economic Cooperation and Development’s (OECD) “OECD Due Diligence Guidance for Responsible Supply Chains of Minerals from Conflict-Affected and High-Risk Areas,” which includes a five-step framework for risk-based due diligence in the supply chain.20
According to the release, the regulation gives EU importers an opportunity to deepen ongoing efforts to ensure clean supply chains when trading legitimately with operators in conflict-affected countries.
18The mandate of the force intervention brigade was renewed by the UN Security Council until March 2015. 19Canada also has a proposed conflict minerals initiative. According to State, Canada’s Conflict Minerals Act was reintroduced for discussion in the Canadian parliament in April 2014 and would require Canadian companies to exercise due diligence in respect of the exploitation and trading of designated conflict minerals originating in the Great Lakes Region of Africa. 20The OECD due diligence guidance, which OECD adopted in 2011, includes supplements on tin, tantalum, tungsten, and gold. The framework’s five steps are (1) establishing strong company management systems, (2) identifying and assessing risk in the supply chain, (3) designing and implementing a strategy to respond to identified risks, (4) carrying out an independent third-party audit of supply chain due diligence at identified points in the supply chain, and (5) reporting on supply chain due diligence. Organization for Economic Cooperation and Development, OECD Due Diligence Guidance for Responsible Supply Chains of Minerals from Conflict-Affected and High-Risk Areas: Second Edition, OECD Publishing (2013), accessed June 23, 2014, http://dx.doi.org/10.1787/9789264185050-en.

Page 11 GAO-14-575 Conflict Minerals
Supply chains for companies using tin, tantalum, tungsten, and gold generally begin at the mine site, where ore is extracted from the ground with mechanized or artisanal mining techniques.21
Figure 2: Simplified Conflict Minerals Supply Chain
However, these supply chains can be complex and vary considerably, according to some industry association and company representatives. For example, as figure 2 shows, in the “upstream” segment of the supply chain—that is, from mine to smelter—ore may be purchased by a local processor or trader and then by an exporter, who ships it to a smelter for refinement; in other cases, the ore may be sold directly to an exporter. The “downstream” segments of conflict mineral supply chains—that is, from smelter to manufacturer—may vary as well, depending in part on the type of mineral. Figure 2 provides a simplified depiction of the supply chain for the four conflict minerals.
Smelters and refiners are considered the “choke points” in the supply chain, since a limited number of smelters and refiners process conflict minerals worldwide and the origin of the minerals after processing can be difficult to verify. Smelters primarily provide high-purity tin, tantalum, and tungsten directly to component parts manufacturers, although some sell high-purity metals through traders or exchanges. Gold refiners typically sell high-purity gold to banks for use as a store of value or to international exchanges where gold is bought and sold,22
21Artisanal mining is a form of mining characterized by a lack of mechanization or capital investment.
although some refiners sell
22According to a World Gold Council representative, in most cases refiners are paid a fee to refine gold and the transaction is conducted by the miner, the trader, and the bank.
Uses of Conflict Minerals Various industries, particularly manufacturing industries, use the four conflict minerals in a wide variety of products. For example, tin is used to solder metal pieces and is also found in food packaging, in steel coatings on automobile parts, and in some plastics. Most tantalum is used to manufacture tantalum capacitors, which enable energy storage in electronic products such as cell phones and computers as well as used to produce alloy additives, which can be found in turbines in jet engines. Tungsten is used in automobile manufacturing, drill bits and cutting tools, and other industrial manufacturing tools and is the primary component of filaments in light bulbs. Gold is used as reserves and in jewelry and is also used by the electronics industry. Source: GAO-12-763. | GAO-14-575
Conflict Minerals Supply Chains

Page 12 GAO-14-575 Conflict Minerals
gold directly to manufacturers; banks and traders may also sell gold to manufacturers, including jewelry and component parts manufacturers. Component parts manufacturers use the refined tin, tantalum, tungsten, or gold to construct individual parts—such as capacitors, engine parts, or clasps for necklaces—that they sell to original equipment manufacturers. The original equipment manufacturers complete the final assembly of a product and sell the final product to the consumer.
Various stakeholders—including governments, industry associations, international organizations, and international and local NGOs working in the Great Lakes Region—operate or support initiatives to promote and exercise responsible sourcing of conflict minerals. Stakeholder-developed initiatives—which include the development of guidance documents, audit protocols, and sourcing practices—support efforts by companies reporting to SEC under the rule to (1) conduct due diligence of their conflict minerals supply chain, (2) identify the source of conflict minerals within their supply chain, and (3) responsibly source conflict minerals. The initiatives can be divided into two categories: global or in-region.23
Most responsible sourcing initiatives follow OECD’s due-diligence guidance.
24
The guidance is for use by any company potentially sourcing minerals or metals from conflict-affected and high-risk areas and, according to OECD, is one of the only international frameworks available to help companies meet their due diligence reporting requirements.
23See GAO-12-763. 24Organization for Economic Cooperation and Development, OECD Due Diligence Guidance for Responsible Supply Chains of Minerals from Conflict-Affected and High-Risk Areas: Second Edition (Paris: November 2012).
Responsible Sourcing Initiatives
Global and In-Region Sourcing Initiatives Global sourcing initiatives may minimize the risk that minerals that have been exploited by illegal armed groups will enter the supply chain and may also support companies’ efforts to identify the source of the conflict minerals across the supply chain around the world. In-region sourcing initiatives may support responsible sourcing of conflict minerals from Central Africa and the identification of specific mines of origin for those minerals. Such initiatives in DRC and adjoining countries focus on tracing minerals from the mine to the mineral smelter or refiner by supporting a bagging and tagging program or some type of traceability scheme. Source: GAO | GAO-14-575

Page 13 GAO-14-575 Conflict Minerals
Since the Act was passed in 2010, State, USAID, SEC, and Commerce have undertaken activities related to implementation of the Act’s conflict minerals provisions, including activities related to responsible sourcing of such minerals from the DRC and adjoining countries. As required by the Act, State and USAID developed a strategy in 2011 aimed at addressing the linkages between human rights abuses, armed groups, the mining of conflict minerals, and commercial products and are implementing various objectives of the strategy. State also produced a map of mineral-rich areas under control of armed groups in the DRC. SEC issued its required conflict minerals rule in 2012. As of May 2014, Commerce had taken steps toward producing a list of all conflict minerals processing facilities worldwide, which the Act required by January 2013, but had not completed the task. Moreover, Commerce had not developed a plan of action with associated timeframes for how and when it expects to complete this effort and report to Congress. Standard practices in program and project management and execution include, among other things, developing a plan to execute specific projects needed to obtain defined results within a specific time frame.25
State, USAID, SEC, and Commerce also have engaged in activities involving stakeholder partnerships and outreach and have provided technical assistance to other governments related to activities focused on the responsible sourcing of conflict minerals.
The Act directed State, USAID, SEC, and Commerce to undertake various activities to implement its provisions related to conflict minerals. Since the Act was passed in 2010, the agencies have taken the following actions.
Responding to the Act, State and USAID developed a strategy in 2011 to address the linkages among human rights abuses, armed groups, the mining of conflict minerals, and commercial products. The Act required State and USAID to submit, by January 2011,26
25The Project Management Institute, The Standard for Program Management (2013).
a strategy to address the
26The Act states that a strategy be submitted to Congress no later than 180 days after the enactment of the law.
U.S. Agencies Have Taken Actions Related to Responsible Sourcing of Conflict Minerals, but Commerce Has Not Yet Fulfilled Its Requirements
State, USAID, and SEC Have Addressed the Act’s Requirements, and Commerce Is Working toward Fulfilling Its Requirements
State and USAID Developed a Strategy, and State Produced a Conflict Minerals Map

Page 14 GAO-14-575 Conflict Minerals
linkages between human rights abuses, armed groups, mining of conflict minerals, and commercial products. The strategy document that State and USAID submitted to Congress in 2011 lists five objectives: (1) promote an appropriate role of security forces, (2) enhance civilian regulation of minerals trade in the DRC, (3) protect artisanal miners and local communities, (4) strengthen regional and international efforts, and (5) promote due diligence and responsible trade through public outreach. The strategy includes activities corresponding with each of these objectives—for example, building the capacity of civilian mining authorities in the DRC to certify mine sites, supporting the implementation and coordination of certification and traceability schemes, building the capacity of the ICGLR related to mineral audit mechanisms, and engaging with industries and civil society groups regarding supply chain due diligence efforts. State and USAID officials indicated that they have been implementing objectives of the strategy over the past few years. According to the U.S. Special Envoy for the Great Lakes Region and the DRC, the strategy remains relevant and accurate and State has used it in conjunction with other U.S. government agencies as a roadmap for efforts to help break the link between armed groups and conflict minerals.
In addition, in 2011, State developed a map of mineral-rich zones and areas under control of armed groups in the DRC and has subsequently published several updated maps, as required by the Act.27 The maps are focused on the exploitation of tin, tantalum, tungsten, and gold in the provinces of North and South Kivu and parts of Orientale, Maniema, and Katanga provinces. According to State, the most current map, which State published in February 2014, was based on data from surveys conducted in 2013 by the International Peace Information Service (IPIS)—an NGO— and on information from consultations with the DRC government, the UN Group of Experts, and MONUSCO (see app. II for the 2014 map).28
27The Act requires that State should update its map every 180 days.
State reported that lack of complete or fully verifiable data makes it difficult to confirm the location of many mine sites, to establish which mine sites are active at any given time, and to comprehensively verify reports of armed groups or other entities that are
28IPIS has also published a report that analyzes the information it collects and populates in its interactive map. See International Peace Information Service, Analysis of the Interactive Map of Artisanal Mining Areas in Eastern DR Congo, (Antwerp, Belgium: November 2013), accessed June 23, 2014, http://ipisresearch.be/mapping/webmapping/drcongo.

Page 15 GAO-14-575 Conflict Minerals
either present at mines or have access to revenue streams emanating from them. State officials indicated that in the future the map may become digital rather than paper based.
As we previously reported,29 SEC issued its conflict minerals rule in August 2012.30 The Act required that SEC promulgate, by April 2011, disclosure and reporting regulations regarding the use of conflict minerals from the DRC and adjoining countries.31
29
GAO-13-689. 30In October 2012, the U.S. Chamber of Commerce, the National Association of Manufacturers, and the Business Roundtable filed a lawsuit against SEC challenging the final conflict minerals rule, making claims based on the Administrative Procedure Act, the Securities Exchange Act of 1934, and the First Amendment. In July 2013, the U.S. District Court for the District of Columbia denied the plaintiff’s claims on all counts. See National Association of Manufacturers v. SEC, 956 F. Supp. 2d 43 (D.D.C. 2013). In August 2013, the petitioners appealed the decision to the U.S. Court of Appeals for the District of Columbia Circuit, and on April 14, 2014, the appeals court upheld the District Court’s findings on all the petitioners’ claims except the First Amendment claims, concluding that section 13(p) of the Exchange Act and the final conflicts minerals rule violate the First Amendment “to the extent the statute and rule require regulated entities to report to the Commission and to state on their website that any of their products have ‘not been found to be DRC conflict free.’” National Association of Manufacturers, et al. v. SEC et al., No. 13-5252 (D.C. Cir. April 14, 2014). In response to the appeals court’s findings, SEC staff, on April 29, 2014, issued a statement that it expects companies to file any reports required under Rule 13p-1 subject to any further action that may be taken either by the Commission or a court. The SEC staff’s statement contains guidance to companies, which provides, among other things, that no company is required to describe its products (1) as “DRC conflict free” (2) as having “not been found to be ‘DRC conflict free’,” or (3) as “DRC conflict undeterminable” in their reports. The guidance also states that a company may voluntarily elect to describe any of its products as “DRC conflict free” in its report if it had obtained an independent private sector audit as required by the rule. In addition, the guidance states that, pending further action, an independent private sector audit will not be required unless a company voluntarily elects to describe a product as “DRC conflict free” in its Conflict Minerals Report. On May 2, 2014, the SEC issued an order staying the effective date for compliance with the portions of Rule 13p-1 and Form SD subject to the appeals court’s First Amendment holding pending the completion of judicial review. On May 5, 2014, the plaintiffs filed a motion with the appeals court asking the court to stay the entire rule pending the completion of judicial review which the Commission opposed, and on May 2014, the appeals court denied the motion. 31Pub. L. No. 111-203, sec 1502(b). The Act required that a rule should be promulgated no later than 270 days after the law’s enactment. As we reported in 2012, SEC’s issuance of the rule encountered delays, including delays in developing, modifying, and finalizing the rule, as a result of several factors. See GAO-12-763. Also see appendix III for a flowchart summarizing the conflict minerals rule that SEC published when the rule was adopted in 2012.
SEC Issued Its Conflict Minerals Rule in 2012
Page 16 GAO-14-575 Conflict Minerals
SEC issued a “frequently asked questions” (FAQ) document in May 2013 to address questions by companies that will have to report to SEC under the conflict minerals rule. SEC officials indicated that these FAQs included questions posed most often by companies regarding interpretation of the rule. In April 2014, SEC issued additional FAQs addressing questions that mostly pertained to the independent private sector audit of companies’ conflict minerals disclosure reports. According to an SEC official, these FAQs were based on interpretive questions asked by SEC-reporting companies and the audit community.
In January 2014, SEC made “Form SD,” a specialized disclosure form for reporting compliance with the conflict minerals rule, available for electronic filing. The form, originally published with the conflict minerals rule, provides general instructions to SEC-reporting companies for filing the conflict minerals disclosure and specifies the information that their conflict minerals reports must include. SEC-reporting companies were required to file under the rule for the first time by June 2, 2014, and annually thereafter on May 31.32 According to SEC officials, based on preliminary feedback they received, they anticipated that most SEC-reporting companies subject to the rule would be unable to determine whether or not their products qualified as “DRC conflict-free.”33
More than a year after the deadline required by the Act, Commerce has not yet fulfilled its mandate under section 1502 of the Act. Section 1502 directed Commerce to report, among other things, a list of all known conflict minerals processing facilities worldwide to appropriate congressional committees annually starting no later than 30 months after
32The SEC rule indicates that if the deadline for filing the conflict mineral disclosure report occurs on a weekend, or on a holiday which the SEC is not open for business, then the deadline shall be the next business day. 33According to the rule, for a temporary period following the effective date of the rule—4 years for smaller reporting companies or 2 years for all other reporting companies—if a company is unable to determine whether the minerals in its products originated in DRC or the adjoining countries or financed or benefited armed groups in those countries, then those products are considered “DRC conflict undeterminable” and no audit is required. According to SEC officials, as a result of the SEC’s partial stay order and the SEC staff’s statement, companies are not required to describe their products in their reports as “DRC conflict undeterminable” pending further action by the SEC or a court, and no audits are required unless a company voluntarily describes any of its products as “DRC conflict free” in its Conflict Minerals Report.
Commerce Has Taken Steps but Has Not Provided a List of Conflict Minerals Processing Facilities to Congress

Page 17 GAO-14-575 Conflict Minerals
the Act’s enactment—that is, by January 2013.34
Commerce officials said that they had encountered some challenges associated with gathering data on conflict minerals to help inform their outreach plan and required reporting. For example, according to the officials, conflict minerals and mining operations are difficult to track; because the equipment used to process conflict minerals can be moved easily, such operations can emerge in different locations. In addition, Commerce officials mentioned that some conflict minerals data may be inaccessible to the U.S. government because a large number of conflict
As of May 2014, Commerce had not developed such a list or developed a plan of action, with associated time frames, for completing this requirement and reporting it to Congress. Standard practices in program and project management include developing, among other things, a program plan to execute specific projects needed to obtain defined programmatic results within a specific time frame. In January 2014, Commerce officials told us that they had identified entities that they hoped would help them identify publicly available information about conflict minerals and identify stakeholders who are knowledgeable about conflict minerals issues. Specifically, Commerce officials indicated that they had assembled a proposed and internal outreach plan, which includes meeting with stakeholders to discuss how these organizations have gathered information on conflict mineral smelters and identifies other efforts that Commerce can explore to develop the list of conflict minerals processing facilities. Commerce officials also indicated that they anticipated a 3- to 4-month time frame for the proposed outreach efforts to talk to stakeholders. In May 2014, Commerce officials stated that they had completed discussions with the majority of the stakeholders identified in the outreach plan and have developed several preliminary lists of conflict minerals processing facilities, based on information they obtained from the stakeholders. However, Commerce officials stated that they did not have a timeframe for completing the final list for Congress.
34The Act also requires Commerce to annually report (1) an assessment of the accuracy of the independent private sector audits and other due diligence processes required under section 1502 and (2) recommendations for the processes to carry out such audits, including ways to improve the accuracy of the audits and to establish standards of best practices. Commerce officials stated that it was unable to implement these aspects of the Act’s requirement because the SEC disclosure reports, which are needed for the assessment, were not due to SEC until June 2, 2014.

Page 18 GAO-14-575 Conflict Minerals
mineral smelters are in China.35
Some stakeholders that we contacted, including government and industry officials and representatives of the UN Group of Experts and an NGO, indicated that a comprehensive list of conflict minerals smelters and refiners—considered the “choke point” of the supply chain—would be very useful in the effort to ensure responsible sourcing of minerals in the DRC and adjoining countries. According to these stakeholders, such a list would enable companies that are subject to the SEC rule to maintain transparency regarding their supply chains, particularly in their communications with smelters, and would also provide companies the information they need for their SEC-required conflict minerals disclosure reports.
Having an action plan with associated timeframes could better position Commerce to report on the status of its efforts to compile a list of conflict minerals processing facilities worldwide and to hold its personnel accountable for completing its related activities.
U.S. government agencies have engaged in a variety of activities that involve partnerships and coordination with other stakeholders or outreach to stakeholders, and some agencies have provided technical assistance to stakeholders regarding responsible sourcing of conflict minerals. Some agencies’ activities contribute to global and in-region responsible sourcing initiatives and some of the activities address the implementation of objectives outlined in the strategy to address the linkages between human rights abuses, armed groups, and the mining of conflict minerals.
Some U.S. agencies have partnered and coordinated with other stakeholders—other government agencies, industry, and civil society—regarding issues related to responsible sourcing of conflict minerals. For example:
• State and USAID, both in headquarters and posts or missions overseas, and other U.S. agencies coordinate with one another on weekly or biweekly conference calls to discuss the progress of responsible sourcing efforts, provide updates on recent events, and collaborate on future events, according to State and USAID officials.
35Our 2013 report identified 82 smelters and refiners of tin, tantalum, tungsten, and gold located in China, of the 278 smelters and refiners that we identified worldwide.
U.S. Agencies Have Engaged in Partnerships and Outreach and Provided Technical Assistance to Stakeholders
U.S. Agency Partnerships and Coordination Efforts

Page 19 GAO-14-575 Conflict Minerals
• USAID works in a collaborative and coordinated manner with State in Washington and regionally, using the 2011 U.S. strategy as a framework for the coordination, according to USAID officials. The officials indicated that funding also has been coordinated between the two agencies across the five objectives of the strategy and totals over $25 million, as of 2013.
• State and USAID coordinate with other stakeholders through the Public-Private Alliance for Responsible Minerals Trade (PPA) to fund and support organizations working on responsible sourcing efforts. Both State and USAID are on the PPA’s Governance Committee, which consists of participants from foreign governments, industry, and civil society.36
• USAID has partnered with the International Organization for Migration to help enhance civilian control of the DRC’s mineral trade through infrastructure improvements and institutional reforms, according to agency officials. The officials reported that with USAID funding, the organization will also establish pilot certification and traceability systems in and around the mineral trading centers and other areas of South and North Kivu.
37
• USAID has partnered and coordinated with stakeholders in the DRC, according to agency officials. For example, the officials said that USAID is coordinating with the DRC government regarding various aspects of minerals trade, is involved in the multi-stakeholder Mining Thematic Group in the DRC, and facilitates the Eastern Congo Mining Coordination Team.
• On a multilateral level, both USAID and State participate in the OECD Responsible Sourcing Stakeholder Forums held every 6 months, according to USAID officials. This forum, coordinated by the ICGLR, OECD, and the UN Group of Experts, is a platform for governments, the private sector, international organizations, and civil society to share experiences with implementation of supply chain due diligence for responsible sourcing of minerals from conflict-affected and high-
36According to USAID, it holds two of the four government positions on the Committee in addition to State and the ICGLR. There are four civil society and four private sector members of the Committee as well. 37According to an NGO report, the objective of mineral trading centers, or centre de negoce, is to provide a center where miners and traders can do business without interference from armed groups. The report notes that, at the same time, state agents can exert control and levy taxes, traders can receive the necessary paperwork, and miners can profit from a market environment in which they can negotiate better prices for their products.

Page 20 GAO-14-575 Conflict Minerals
risk areas. Both State and USAID officials have participated at times as facilitators of these forums.
• The current U.S. Special Envoy for the Great Lakes Region and the DRC has collaborated with other stakeholders, such as the UN Special Envoy for the Great Lakes, the African Union, and other multilateral and bilateral partners, to strengthen international coordination mechanisms on the crisis in the Great Lakes, according to State. These efforts have taken place under the Peace, Security, and Cooperation Framework Agreement for the DRC and the Region.
A couple of U.S. government agencies indicated that they have conducted outreach to various stakeholders to promote responsible sourcing of conflict minerals and to obtain information about conflict mineral sourcing and supply chains. For example, State and Commerce officials reported the following.
• State officials told us that State has engaged with foreign governments and industry associations regarding the Dodd-Frank Act requirements. According to these officials, State’s efforts have included sending letters about section 1502 of the Act to foreign governments that are prominent in the conflict mineral supply chain as well as encouraging these governments and companies in those countries to support the aim of the legislation. In a November 2013 briefing, the Deputy Assistant Secretary of State for Counter Threat Finance and Sanctions reported that he had travelled to Asia and Europe to talk with representatives from smelters and governments about responsible sourcing initiatives and encourage participation in such initiatives. State officials also indicated that they have facilitated outreach efforts for industry associations, such as the Conflict-Free Smelter Initiative (CFSI) and others, to help them secure meetings in Asian countries to discuss conflict free mining and smelting. According to the State officials, during the outreach some members from industry and industry associations expressed interest in talking to Commerce about smelters and support for responsible sourcing, according to State officials.
• Commerce officials stated that their proposed outreach plan identified entities that could enable them to develop the list of conflict mineral smelters and refiners required by the Act. According to these officials, they have conducted outreach to these entities, including government agencies, industry associations, international organizations, and NGOs.
Some U.S. agencies have provided technical assistance related to responsible sourcing of conflict minerals to various stakeholders. According to agency officials, these stakeholders have consisted primarily
U.S. Agency Outreach Efforts
U.S. Agency Technical Assistance

Page 21 GAO-14-575 Conflict Minerals
of other governments, particularly in the Great Lakes Region. For example:
• State officials said that they had shared experiences and challenges related to implementing the Act with officials from the EU who were working on proposed conflict minerals legislation.
• SEC officials stated that they had discussed with EU officials issues that SEC considered when drafting the conflict minerals rule as well as questions about the rule that SEC received from industry.
• USAID officials stated that they had been working with the ICGLR in providing technical assistance on conflict minerals programs, particularly through the steering committee for ICGLR’s Regional Initiative against the Illegal Exploitation of Natural Resources.38
Specifically, according to USAID officials, USAID has been implementing a multiyear institutional capacity program in support of the ICGLR to build the overall strength of the Executive Secretariat as well as the ICGLR’s regional initiative. USAID officials said that the agency will soon begin implementing activities to support a third-party supply chain audit mechanism and an independent conflict minerals supply chain auditor.
Since we reported in July 2013,39
stakeholders have expanded existing initiatives and added new initiatives focused on responsible sourcing of conflict minerals in the DRC and adjoining countries, to include new mine sites, countries, and smelters. Some of these initiatives have yielded publically available information, including data on production of conflict-free minerals and export data, as well as reports on the progress and results of the initiatives. However, this information is limited in scope and thus may not provide a comprehensive description of the sourcing of conflict minerals from the DRC and adjoining countries.
38The Regional Steering Committee, comprising technical experts from all ICGLR member states, has been charged with the steering of all activities within the initiative since September 2009. Its suggestions on policies and technical guidelines are to be approved at a later stage by the Regional Inter-Ministerial Committee as well as the ICGLR Summit. 39GAO-13-689.
Stakeholder Initiatives Are Expanding and Provide Some Information on Sourcing of Conflict Minerals
Page 22 GAO-14-575 Conflict Minerals
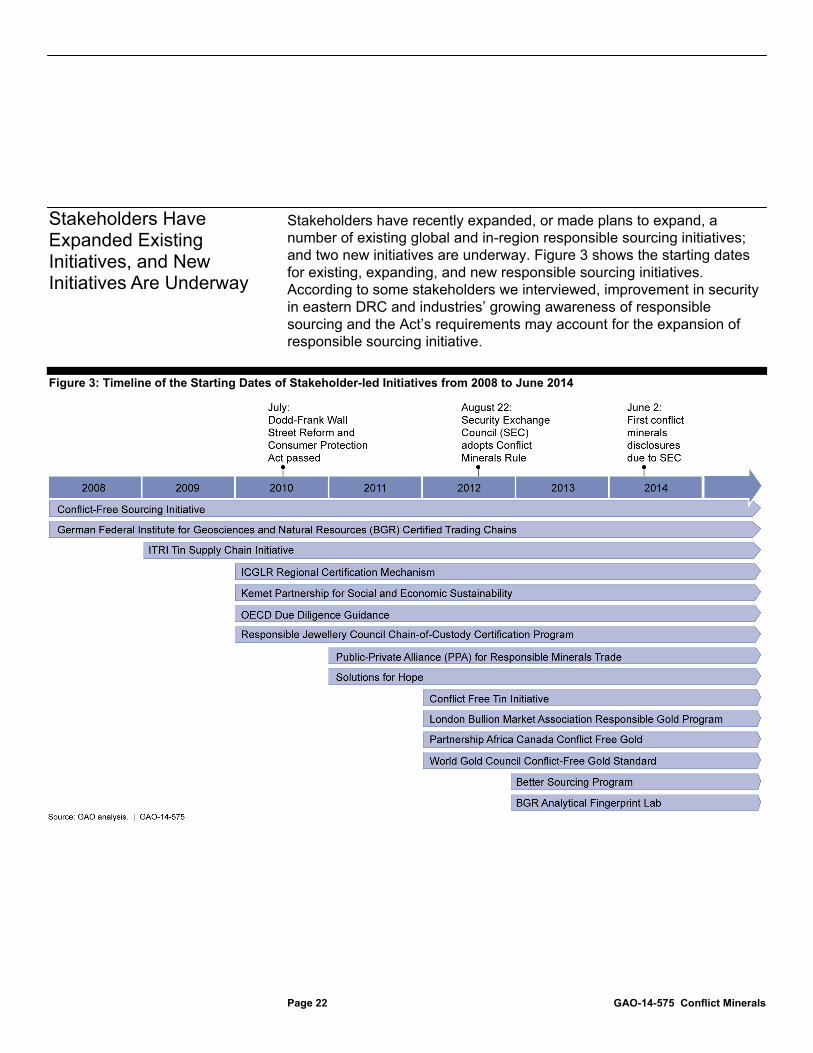
Stakeholders have recently expanded, or made plans to expand, a number of existing global and in-region responsible sourcing initiatives; and two new initiatives are underway. Figure 3 shows the starting dates for existing, expanding, and new responsible sourcing initiatives. According to some stakeholders we interviewed, improvement in security in eastern DRC and industries’ growing awareness of responsible sourcing and the Act’s requirements may account for the expansion of responsible sourcing initiative.
Figure 3: Timeline of the Starting Dates of Stakeholder-led Initiatives from 2008 to June 2014
Stakeholders Have Expanded Existing Initiatives, and New Initiatives Are Underway

Page 23 GAO-14-575 Conflict Minerals
The following are examples of global responsible-sourcing initiatives that stakeholders have expanded since we reported in July 2013.40
Conflict-Free Sourcing Initiative
The Conflict-Free Sourcing Initiative (CFSI) has expanded in several aspects related to responsible sourcing.41 First, CFSI’s Conflict-Free Smelter Program has expanded the number of smelters it has certified as conflict free. The program is a voluntary one in which smelters undergo an independent third-party audit, in accordance with OECD’s due diligence guidelines, to verify the origin of minerals processed at their facilities. The number of smelters that the program has certified as conflict-free has expanded from 26 smelters in summer 2013 to 85 smelters as of April 25, 2014 (see table 1). An additional 25 smelters are in the process of being certified, bringing the total number of smelters involved in the program to 110.42
Table 1: Number of Smelters and Refiners in the Conflict-Free Smelter Program as of April 25, 2014
As of January 2014, the Conflict-Free Smelter Program has expanded to include smelters for tungsten in addition to the other three conflict minerals.
Mineral Number of certified
smelters/refiners Number of smelters/refiners working toward certification Total
Tantalum 28 1 29 Tin 13 14 27 Tungsten 1 8 9 Gold 43 2 45 Total 85 25 110
Source: Conflict-Free Sourcing Initiative data, GAO (analysis). | GAO-14-575
40GAO-13-689. 41CFSI was founded in 2008 by members of the Electronic Industry Citizenship Coalition (EICC) and the Global e-Sustainability Initiative (GeSI). According to EICC and GeSI, as of April 30, 2013, CFSI now includes EICC and GeSI activities and is an expanded initiative of the EICC and GeSI Extractives Working Group, which includes more stakeholders and a wider range of industry sectors supporting the sourcing of conflict-free minerals. 42The actual number of smelters and refiners of conflict minerals is unknown. However, in 2013, we reported that the total number of smelters and refiners worldwide could be as high as 500. See GAO-13-689.
Some Existing Global Initiatives Are Expanding

Page 24 GAO-14-575 Conflict Minerals
Second, according to CFSI representatives, through outreach to industry, CFSI has expanded its collaboration with companies involved with the conflict minerals supply chain. CFSI’s outreach includes twice-yearly workshops on conflict minerals issues that are open to all participants. According to CFSI, outreach such as these workshops bring together hundreds of representatives from industry, government, and civil society for updates, in-depth discussions, and guidance on best practices for responsible mineral sourcing.43
Third, in 2014, CFSI began offering its members information about the SEC-required “reasonable country of origin” data for conflict minerals, providing the most detailed information currently available about the source of conflict minerals for smelting and refining facilities that are validated through the Conflict-Free Smelter Program. According to CFSI, this information may be useful to companies as they prepare the conflict minerals disclosure reports required by the SEC rule and demonstrate conformance with the OECD due diligence guidelines.
CFSI officials stated that such outreach recently resulted in collaboration with the tungsten industry, which led to certification of the first conflict-free tungsten smelter in 2014.
Responsible Gold Program
In January 2012, the London Bullion Market Association (LBMA), which represents the global market for gold and silver, finalized and published its Responsible Gold Guidance to ensure that the gold refiners it accredits purchase only conflict-free gold.44
43The World Bank defines “civil society” as referring to the wide array of nongovernmental and not-for-profit organizations that have a presence in public life, expressing the interests and values of their members or others, based on ethical, cultural, political, scientific, religious, or philanthropic considerations.
The refiners accredited by LBMA are required to complete an annual third-party audit to verify their compliance with the LBMA guidance, according to an LBMA official. As of March 2014, of the 67 gold refiners that LBMA oversees, more than three-quarters had successfully submitted their audits and received the Responsible Gold Certificate, according to the official. The representative stated that if a refiner does not submit a third-party audit by the end of
44LBMA oversees the London Good Delivery List, a list of 67 accredited gold refiners that meet a specific standard for the quality of their refined gold and silver bars. According to LBMA representatives, most banks and exchanges will only contract with refiners on the Good Delivery List.

Page 25 GAO-14-575 Conflict Minerals
2014, the refiner will be removed from LBMA’s list of accredited refiners. An LBMA official said that the association also collaborates with other responsible sourcing stakeholders and global gold exchanges and works closely with OECD. For example, the official said that, working through OECD, LBMA has met with Chinese industry representatives to clarify the purpose and benefits of conducting due diligence audits of their refiners.
Responsible Jewellery Council Chain-of-Custody Certification Program
The Responsible Jewellery Council—a diamond and precious metals industry association—launched a chain-of-custody certification program in March 2012 to help its member companies identify and track conflict-free gold throughout their supply chains.45 The program’s requirements, which are aligned with the OECD Due Diligence Guidance for gold, include a third-party audit of each certified entity to ensure that its gold is conflict-free, according to the Responsible Jewellery Council. According to an official with the Responsible Jewellery Council, this certification can support companies’ compliance with the Dodd Frank Act. As of April 2014, nine entities had been validated under the council’s certification program and more entities were in the process of being certified, according to the official.46
The following are examples of in-region responsible sourcing initiatives that stakeholders have expanded, or made plans to expand, since we reported in July 2013.
45The Responsible Jewellery Council launched its chain-of-custody program to also help its member companies identify and track the supply chains of other precious metals, such as platinum, palladium, and rhodium. Chain of custody refers to the paper trail that documents the sequence of entities with custody of minerals as they move through a supply chain. 46Officials of the Responsible Jewellery Council reported that the council has developed cross-recognition agreements with CFSI, LBMA, and the World Gold Council to reduce unnecessary duplicative audits for their member companies. For example, according to an LBMA official, once LBMA approves a third-party audit, verifying that a gold refiner is conflict-free, the association contacts CFSI to add the refiner to CFSI’s list of compliant smelters and refiners.
Some In-Region Initiatives Have Also Expanded

Page 26 GAO-14-575 Conflict Minerals
ITRI Tin Supply Chain Initiative
The ITRI Tin Supply Chain Initiative (iTSCi) recently announced that it is expanding its in-region operations. The initiative works with “upstream” entities (i.e., companies involved in the conflict minerals supply chain from mine to smelter) in instituting the actions, structures, and processes necessary to conform with the OECD Due Diligence Guidance and helps relevant U.S. companies report on their due diligence efforts to the SEC as required by the Dodd-Frank Act.47
In February 2014, iTSCi announced that it was expanding its traceability program into a remote area in the northern region of the Maniema province of the DRC, and into the North Kivu province of the DRC. According to iTSCi, improved security in North Kivu, which has a history of armed conflict, accounts in part for the expansion into the province. An iTSCi official stated that the initiative is currently looking at options for extending into South Kivu. Additionally, in April 2014, iTSCi announced that the program had started operations in Burundi. According to iTSCi, there is presently little evidence of activity by nongovernment armed groups in Burundi, since there have been no reports that armed groups are controlling mine sites or transportation routes, extorting money or minerals, or illegally taxing the trade of minerals. iTSCi further reported that it may extend the program to Uganda and eventually to the entire Great Lakes Region. Also, an iTSCi official stated that the initiative had successfully piloted technology in Rwanda to collect and manage data on conflict minerals electronically, which would replace the current paper-based system and increase efficiency of data collection.
The assistance that iTSCi provides includes a system to trace bags of minerals from the mines to the exporter, due diligence audits of iTSCi’s member companies, and assessments of the political and security situations, which have been conducted at various mine sites in the DRC and Rwanda.
47According to iTSCi, as of November 2013, the traceability program is used at more than 850 mines in the South Kivu, Maniema, and Katanga provinces of the DRC and in Rwanda. Almost all in-region responsible sourcing initiatives—including Solutions for Hope and the Conflict-Free Tin Initiative—use iTSCi’s traceability system of tracking minerals from the mine to the exporter to ensure that their minerals are conflict-free.

Page 27 GAO-14-575 Conflict Minerals
Solutions for Hope
Launched by Motorola Solutions and AVX in 2011, the Solutions for Hope tantalum program is a “closed-pipeline” initiative that traces the flow of tantalum from the mine to the end-use company.48
Conflict-Free Tin Initiative
In June 2013, Solutions for Hope reported that it had completed six shipments of tantalum, totaling more than 145 metric tons, from the Katanga province in the DRC. According to officials, in part because of improved security in the province, the initiative started sourcing tantalum from North Kivu in March 2014. Officials also noted that Solutions for Hope is exploring a closed pipeline system for gold in the DRC.
The Conflict-Free Tin Initiative (CFTI), a multistakeholder effort supported by the Netherlands government, is a closed-pipeline initiative, similar to Solutions for Hope, started in October 2012 for sourcing tin from the South Kivu province of the DRC. According to CFTI, the initiative has expanded its mining operation to Maniema, a province bordering South Kivu, which is less prone to conflict and the government is reinvesting tax income into the mining communities. According to USAID, a CFTI stakeholder, from October 2012 to December 2013, the initiative generated a total export value of more than $3 million.
Regional Certification Mechanism
In 2010, the International Conference on the Great Lakes Region (ICGLR) began working with an NGO to develop a regional certification mechanism to ensure that conflict minerals are fully traceable. ICGLR’s Regional Certification Mechanism (RCM) enables member countries and their mining companies to demonstrate where and under what conditions minerals were produced, allowing member governments to issue ICGLR regional certificates for those mineral shipments that are in compliance with the standards of the mechanism. The ICGLR issued its first certificate in November 2013 to a mine in Rwanda. According to an ICGLR official, the DRC launched its certificate program but had not yet issued any certificates as of November 2013. He added that Tanzania
48According to Solutions for Hope, its closed pipeline involved working through a defined set of key suppliers—mines (including artisanal cooperatives), smelter/processor, component manufacturer, and end user—identified in advance of initiating the project.
Page 28 GAO-14-575 Conflict Minerals
and Burundi may be able to issue certificates by the end of 2014. The ICGLR official noted several challenges in instituting the RCM in the DRC and the region. For example, he cited that it is logistically difficult to catalogue all mines in each country. In addition, the official noted that training local officials to use the RCM software is difficult and time consuming. The official added that it takes member countries 1 year to prepare for all components associated with launching the RCM.
In the past year, one existing stakeholder has launched a new in-region responsible sourcing initiative and a new stakeholder has established an initiative.
Analytical Fingerprint Project
The German government’s Federal Institute for Geosciences and Natural Resources (BGR), an existing stakeholder, launched a new initiative in the past year. According to a representative, BGR’s primary role is to support the region’s governments and to build government capacity. Since 2013, BGR has initiated the Analytical Fingerprint Project to allow for independent verification of the origin of the conflict mineral by comparing the composition of tantalum, tin, and tungsten concentrate samples of a known origin with unknown samples, similar to a DNA test. According to a BGR official, the project has three types of units—sample preparation labs, high tech labs, and a management unit. To date, BGR has established sample preparation labs, located in Rwanda since 2013 and in the DRC since 2014, where mineral ore samples are prepared for analysis. A third sample preparation lab is under construction in Burundi. BGR is in negotiations to establish a high tech lab in Tanzania, which receives and analyzes the samples from the preparation labs. Additionally, in 2013, according to a BGR official, BGR established a project management unit at the ICGLR headquarters in Burundi, which evaluates the raw data and produces the analytical fingerprints.
Better Sourcing Program Responsible-Sourcing Pilot
The Better Sourcing Program (BSP), a private company that offers an independently audited due diligence assurance program to enable companies to source tantalum, tin, tungsten, and gold from the region, is a new stakeholder in the region in 2013. The Better Sourcing Program established a pilot program that covers a tantalum supply chain originating from the Republic of the Congo (also known as Congo-Brazzaville), which is the first responsible-sourcing initiative in that country. Better Sourcing Program officials stated that they chose to pilot
New Initiatives Have Launched in the Region Since 2013
Page 29 GAO-14-575 Conflict Minerals
the initiative in the Republic of the Congo because no other scheme to support producers existed there, because the country is relatively conflict free, and because the government has been cooperative.
Some stakeholders that we interviewed noted various challenges to expanding or launching responsible-sourcing efforts in the DRC and adjoining countries. For example:
• Lack of infrastructure. Some stakeholders reported that inadequate infrastructure in the DRC and adjoining countries affects their ability to operate in the region and expand initiatives to new areas. Representatives from Solutions for Hope stated that infrastructure in the DRC cannot support a large-scale smelter. According to these representatives, the power supply in the DRC can be inconsistent and, because smelting facilities require a large, consistent power supply to function properly, all tin, tantalum, and tungsten currently are exported from the DRC and Rwanda for smelting.49
• Lack of government support. Some stakeholders reported some operational challenges related to the region’s national and provincial governments. For example, stakeholders involved in the Conflict Free Tin Initiative stated that sales of tin from their mine in South Kivu were halted for nearly 2 months in 2013 after the provincial government of the region imposed harsh taxes on the minerals mined there. Additionally, Solutions for Hope officials reported that the DRC’s current tax structure is not conducive to legitimizing gold and that expanding the initiative to include gold is therefore difficult.
• Lack of buyers for conflict minerals from conflict zones. Several stakeholders and agency officials reported that some companies are reluctant to buy minerals produced in the DRC and adjoining countries because of the high cost of the due diligence required by the Dodd-Frank Act and the perceived reputational risk. For example, according to one industry official, a major challenge to responsible sourcing in the region is that the cost of complying with the SEC rule makes it difficult for SEC-reporting companies to compete in the global market against companies that are not required to perform costly due diligence. In addition, an official from the Responsible Jewellery Council noted that gold is mined in many locations around the world
49According to Solutions for Hope officials, a tin smelter in the Katanga province is currently idle due to lack of consistent power, and another smelter in Rwanda, which is working toward certification by the Conflict-Free Smelter Program, has been idle for over 5 years.
Stakeholders Face Operational Challenges in Expanding or Launching In-Region Initiatives

Page 30 GAO-14-575 Conflict Minerals
and that production costs must always be taken into account. She stated that because the cost of due diligence for gold is usually proportional to risk, mining and sourcing responsibly in the Great Lakes Region could become more expensive than in other, lower-risk areas and that this represents a challenge to responsible sourcing efforts in the region.
Some stakeholders and governments in the region provide publicly available information related to in-region mining of conflict minerals and responsible sourcing initiatives. According to industry officials, the amount of publicly available data reported by responsible sourcing initiatives has increased over the past year. We found that iTSCi publishes various reports on its public website as part of its due diligence system for its members. These reports provide production and export data for tin, tantalum, and tungsten, including amounts traced through the iTSCi program, from three provinces in the DRC and Rwanda, as well as the mineral sales in U.S. dollars (for more details, including the applicable quantitative data, see app. IV). Also on its website, iTSCi publishes third-party audits of member companies, which assess the extent to which the companies have implemented the OECD Due Diligence Guidance and evaluate the companies’ adherence to iTSCi’s traceability and due diligence procedure. Additionally, iTSCi publishes governance assessments covering a range of topics. Examples include the security and political situation in areas without an iTSCi presence and the risks and performance, relative to the OECD Due Diligence Guidance and the SEC rule, of stakeholders that are part of, or play a role in monitoring, the conflict minerals supply chain.50
A comparison of production data from the conflict-free sourcing initiatives in the context of each country’s or the region’s total production or exports of tin, tantalum, tungsten, or gold is not feasible, because no reliable, comprehensive data on the production or export of conflict minerals for the countries or region are available. However, some quantitative government data on the production and exports of conflict minerals from the DRC and adjoining countries are available (see app. V). For example, the DRC government has published data on production and exports of all four conflict minerals and the Rwandan government has published export
50According to an iTSCi official, the governance assessments also include summaries of all incidents that have occurred and how they have been mitigated or otherwise resolved.
Some Information about the Conflict Minerals Trade Is Publicly Available

Page 31 GAO-14-575 Conflict Minerals
and value data for tin, tantalum, and tungsten. In addition, the International Trade Centre, a joint agency of the World Trade Organization and the UN, collects export data from governments that provide some context for the amount of conflict minerals declared as exported from the region, although these data do not identify minerals from conflict-free mines (see app. VI).
Some stakeholders indicated that the ICGLR may, at some point, be able to provide production and export data of conflict minerals from its member states, mostly Dodd-Frank-affected countries. This information could increase transparency at the individual country level. ICGLR requires its member states to implement a chain-of-custody tracking system for conflict minerals and to transmit data on mineral flows (i.e., quantities and destinations) at regular intervals to be incorporated in the ICGLR Regional Mineral Tracking Database. According to an ICGLR official, this database is populated with three types of information: (1) a historical record of mine sites in each country, (2) types and quantities of minerals produced at each mine site, and (3) mineral flows from the mine sites. According to ICGLR documentation, the data are used to track, analyze, and reconcile regional mineral flows and will become publicly available to ensure ICGLR’s credibility. In November 2013, the ICGLR official stated that four of the 12 member countries had submitted information for the regional database: Rwanda, Uganda, the DRC, and, to a lesser extent, Burundi.
Since we reported in July 2013, no new population-based surveys related to sexual violence in the DRC, Uganda, Rwanda, or Burundi have been published. However, population-based surveys are underway, or being planned, in three of those countries—the DRC, Burundi, and Rwanda. In addition, some new case file data on sexual violence are available for all four countries. However, as we reported in 2011, case file data on sexual violence are not suitable for estimating a rate of sexual violence.
Little Additional Information on Rate of Sexual Violence in Eastern DRC and Adjoining Countries since July 2013

Page 32 GAO-14-575 Conflict Minerals
Although no new surveys related to sexual violence in the DRC, Uganda, Rwanda, or Burundi have been published since July 2013, population-based surveys in the DRC, Burundi, and Rwanda are underway or planned by ICF International.51
Figure 4 shows the anticipated timelines for the population-based surveys on sexual violence that are currently underway or planned in the DRC, Burundi, and Rwanda. It also shows the publication dates for eight population-based surveys that provided data on the rate of sexual violence in eastern DRC, Rwanda, and Uganda that have been published since we started reporting on sexual violence in the region in 2011.
According to ICF International, data collection for a Demographic and Health Survey (DHS), which is a type of population-based survey, for the DRC is complete, but data resulting from the survey are not expected until September 2014 or later. ICF International also said that fieldwork for a DHS in Rwanda is likely to start in September or October 2014. ICF International indicated that a DHS is planned to start in Burundi in 2014; however, data collection may be delayed by funding gaps and, as a result, the survey may not take place until 2015.
51ICF International implements the Demographic and Health Surveys (DHS) Program, which has provided technical assistance to more than 300 surveys in over 90 countries. The DHS Program provides capacity building to host-country implementing agencies through all survey stages, including survey design and sampling, training, field work, data tabulation and analysis, report writing, and dissemination and use of findings.
Several Population-Based Surveys Are Underway or Planned

Page 33 GAO-14-575 Conflict Minerals
Figure 4: Timeline of Population-Based Surveys Estimating the Rate of Sexual Violence in Eastern DRC, Rwanda, Uganda, and Burundi
Since 2013, some U.S. and UN agencies as well as researchers and an NGO have provided additional case file data on instances of sexual violence in the DRC and adjoining countries. In February 2014, State submitted its annual country reports on human rights practices to Congress, which provided the following data pertaining to sexual violence in the DRC, Burundi, and Uganda.52
• In the DRC, the government reported 18,729 cases of sexual violence in 2012.
For example,
• In Burundi, 3,781 cases of gender-based violence were reported in 2010, according to a report compiled from family development centers throughout the country.
• In Uganda, 530 cases of rape were registered in 2012, and 301 of the alleged rapists were tried and convicted.
52U.S. Department of State, Bureau of Democracy, Human Rights and Labor, Country Reports on Human Rights Practices for 2013, accessed May 18, 2014, http://www.state.gov/j/drl/rls/hrrpt/humanrightsreport/index.htm#wrapper.
Some Additional Case File Data on Sexual Violence Have Become Available since GAO’s 2013 Report

Page 34 GAO-14-575 Conflict Minerals
In addition, some UN entities reported case file information. For example:
• MONUSCO reported that between October 1, 2013, and December 5, 2013, it recorded acts of sexual violence against at least 79 women and 28 girls in conflict-affected provinces in the DRC.53
• MONUSCO reported in March 2014 that sexual violence crimes continued to be committed by armed groups and that such crimes were allegedly committed against at least four women, 35 girls, and one man by elements of illegal armed forces and members of the Congolese military and police in January 2014.
• The United Nations Joint Human Rights Office reported in April 2014 that between the period of January 2010 and December 2013, it registered 3,635 victims of sexual violence throughout the DRC.54
Moreover, the DRC government reported case file information. For example:
The report indicated that, for the reporting period, while more than half of the total alleged acts of sexual violence were committee by illegal armed groups, members of the Congolese national military committed less than half of the other alleged acts.
• A report published in June 2013 by the DRC Ministry of Gender, the Family, and Child, with support by the UN Population Fund, highlighted cases of sexual violence in seven provinces in the country: Bandundu, Bas Congo, Katanga, Kinshasa, North Kivu, Orientale, and South Kivu.55
53UN Security Council, Report of the Secretary-General on the United Nations Organization Stabilization Mission in the Democratic Republic of the Congo, S/2013/757 (New York, NY: Dec 17, 2013).
Data in the report indicate that 10,322 incidents of sexual and gender-based violence were reported for the seven provinces in 2011 and that the number increased to 15,654 incidents in 2012. While the data also indicate that most of these assaults were committed by people dressed in civilian clothes—85 percent in 2011 and 78 percent in 2012—incidents involving armed groups between 2011 and 2012 increased in South Kivu from 36 to 76 percent, respectively, and in North Kivu from 32 to 61 percent, respectively.
54Progress and Obstacles in the Fight Against Impunity for Sexual Violence in the Democratic Republic of the Congo, United Nations Joint Human Rights Office, April 2014. 55Extent of Sexual Violence in the DRC and Actions to Fight against the Phenomenon of 2011 to 2012, DRC Ministry of Gender, the Family, and Child; Kinshasa, June 2013. This report was not publicly available before we issued our report in July 2013.

Page 35 GAO-14-575 Conflict Minerals
An NGO also published case file information. For example:
• Médecins sans Frontières reported in March 2014 that in 2012 it provided medical care to a total of 4,037 women, men, and children after incidents of sexual violence in different project locations in the DRC.56
Several factors make case file data unsuitable for estimating rates of sexual violence. First, because case file data are not aggregated across various sources, and because the extent to which various reports overlap is unclear, it is difficult to obtain complete data, or a sense of magnitude, from case files. Second, in case file data as well as surveys, time frames, locales, and definitions of sexual violence may be inconsistent across data collection operations. Third, case file data are not based on a random sample and the results of analyzing these data are not generalizable.
It reported treating, in a 5-week period in late 2012 through early 2013, 95 of those individuals in one camp for Internally Displaced People in North Kivu.
The long-running humanitarian crisis in eastern DRC, one of the most volatile areas in Africa, continues to be a concern for the U.S. government and the international community. As we have previously reported, section 1502 of the Dodd-Frank Wall Street Reform and Consumer Protection Act, enacted in 2010, is part of the U.S. effort to address the perpetration of sexual violence and mass killings in the DRC by armed groups who profit from the exploitation and trading of conflict minerals. We have compiled stakeholder data on the production and trade of conflict minerals that demonstrates, to some extent, the degree of transparency related to the conflict minerals trade. The actions undertaken by U.S. agencies in response to the Act could facilitate SEC-reporting companies’ compliance with the SEC rule, promulgated pursuant to the Act, as they conduct due diligence and prepare the required annual reports disclosing the use and the origin of conflict minerals in their products. However, because Commerce has not met the Act’s requirement that it compile by January 2013 a list of smelters and refiners—considered the “choke point” of the conflict minerals supply chain—these companies lack a source of critical information about the conflict minerals supply chain.
56Medecins sans Frontieres, Everyday Emergency: Silent Suffering in the Democratic Republic of Congo, Amsterdam, 2014.
Conclusions
Page 36 GAO-14-575 Conflict Minerals
Some stakeholders indicated that a comprehensive list of conflict minerals smelters and refiners could enable companies that are subject to the SEC rule to maintain transparency of the supply chain, and also provide companies the information they need for their SEC-required conflict minerals disclosure reports. Commerce cited several challenges that have hindered its providing the required list to Congress. However, having an action plan with associated timeframes could better position Commerce to report on the status of its efforts to produce a final list and provide it to Congress and to hold its personnel accountable for completing related activities.
To give Congress a sense of Commerce’s efforts to produce a listing of all known conflict minerals processing facilities worldwide, as required by section 1502 of the Dodd-Frank Wall Street Reform and Consumer Protection Act, we recommend that the Secretary of Commerce provide to Congress a plan that outlines the steps, with associated timeframes, to develop and report the required information about smelters and refiners of conflict minerals worldwide.
We provided a draft of this report to SEC, State, USAID, and Commerce for their review. Commerce provided written comments, which we have reproduced in appendix VII. SEC and State provided technical comments, which we incorporated as appropriate. We also provided relevant portions of the draft report to some industry associations and other stakeholders of conflict minerals initiatives from whom we had obtained information during our review; some of these stakeholders provided technical comments that we incorporated as appropriate.
In its written comments, Commerce noted in response to our recommendation that it had provided and briefed us on a detailed outreach action plan that set forth how it intended to assemble the list of conflict minerals processing facilities required by the Act. However, as we have noted in this report, the document that Commerce provided was an outreach plan, consisting of a list of stakeholders that Commerce intended to contact to obtain information on conflict minerals smelters and refiners. The plan did not indicate a timeframe for completing and submitting to Congress the required listing of conflict minerals processing facilities worldwide. Commerce concurred with our recommendation and noted that it will submit a listing of all known conflict minerals processing facilities worldwide to Congress by September 1, 2014.
Recommendation for Executive Action
Agency and Third Party Comments and Our Evaluation
Page 37 GAO-14-575 Conflict Minerals
We are sending copies of this report to appropriate congressional committees. The report is also available at no charge on the GAO website at http://www.gao.gov/.
If you or your staffs have any questions about this report, please contact me at (202) 512-8612 or [email protected]. Contact points for our Offices of Congressional relations and Public Affairs may be found on the last page of this report. GAO staff who made key contributions to this report are listed in appendix VIII.
Kimberly M. Gianopoulos Acting Director, International Affairs and Trade
Page 38 GAO-14-575 Conflict Minerals
List of Addressees
The Honorable Barbara Mikulski Chairwoman The Honorable Richard Shelby Vice Chairman Committee on Appropriations United States Senate The Honorable Tim Johnson Chairman The Honorable Mike Crapo Ranking Member Committee on Banking, Housing, and Urban Affairs United States Senate The Honorable Ron Wyden Chairman The Honorable Orrin G. Hatch Ranking Member Committee on Finance United States Senate The Honorable Robert Menendez Chairman The Honorable Bob Corker Ranking Member Committee on Foreign Relations United States Senate The Honorable Hal Rogers Chairman The Honorable Nita Lowey Ranking Member Committee on Appropriations House of Representatives The Honorable Jeb Hensarling Chairman The Honorable Maxine Waters Ranking Member Committee on Financial Services House of Representatives

Page 39 GAO-14-575 Conflict Minerals
The Honorable Ed Royce Chairman The Honorable Eliot Engel Ranking Member Committee on Foreign Affairs House of Representatives The Honorable Dave Camp Chairman The Honorable Sander Levin Ranking Member Committee on Ways and Means House of Representatives

Appendix I: Objectives, Scope, and Methodology
Page 40 GAO-14-575 Conflict Minerals
To determine the extent, if any, to which relevant U.S. agencies have engaged in activities related to responsible sourcing of conflict minerals, we interviewed officials who are cognizant of conflict minerals issues from the Departments of Commerce and State (State) and the United States Agency for International Development (USAID), and the Securities and Exchange Commission (SEC). We reviewed Section 1502 of the Dodd-Frank Wall Street Reform and Consumer Protection Act (Pub. L. No. 111-203) to identify the requirements for Commerce, State, SEC, and USAID related to implementation of section 1502. We also reviewed and analyzed reports and other documents from the agencies, such as the U.S. Strategy to Address the Linkages Between Human Rights Abuses, Armed Groups, Mining of Conflict Minerals, and Commercial Products; the conflict minerals rule; and maps of mineral-rich zones and areas under control of armed groups in the DRC. In addition, we reviewed and analyzed press releases, statements, plans, and guidance pertaining to conflict minerals and responsible sourcing that were issued by U.S. agencies. We also reviewed notes and agendas of responsible sourcing forums and other meetings attended by U.S. officials.
To analyze what is known about the status of, and any information provided by, initiatives focused on responsible sourcing of conflict minerals from the DRC and adjoining countries, we interviewed officials and reviewed and analyzed documents from State, USAID, and the United Nations Group of Experts on the Democratic Republic of the Congo (UNGoE); interviewed representatives and reviewed and analyzed guidance documents, reports, and presentations from foreign government, industry associations, multilateral organizations, companies, and nongovernmental organizations (NGOs). We selected these stakeholders based on their expertise on responsible sourcing issues, because they represented a range of perspectives on conflict minerals, and because we had established contacts with these entities on our last review.1
1GAO, SEC Conflict Minerals Rule: Information on Responsible Sourcing and Companies Affected,
In addition, some of the stakeholders we talked to have been working on the ground in the DRC. The stakeholders we spoke with constitute a nongeneralizable sample, and the information we gathered from them cannot be used to infer views of other stakeholders cognizant of conflict minerals issues. To determine which initiatives had expanded and which were new initiatives in the region, we interviewed U.S. agency
GAO-13-689 (Washington, D.C.: July 18, 2013).
Appendix I: Objectives, Scope, and Methodology

Appendix I: Objectives, Scope, and Methodology
Page 41 GAO-14-575 Conflict Minerals
officials and relevant stakeholders and reviewed documentation from initiatives in the region. This report covers initiatives on which we have previously reported and new initiatives since our 2013 report, as described by stakeholders we interviewed.2
To demonstrate other sources of publicly available data on conflict minerals, we collected and analyzed stakeholder and government data covering 2003 through 2014. Because the data were not used to support findings, conclusions, or recommendations, we did not assess their reliability. To demonstrate the output of one of the in-region initiatives, we collected production and export data for the ITRI Supply Chain Initiative (iTSCi). We reviewed the production reports for three provinces in the DRC and for Rwanda published on iTSCi’s website, abbreviated the data to include those most relevant to this study, and converted the data to tons and thousands of U.S. dollars. A limitation of the data is that the disaggregated production data–by mineral and mine–are proprietary to iSTCi members, so it is not possible to quantify the total amount of any of the minerals separately. We also collected conflict mineral production and export data from the websites of the governments of the DRC and Rwanda and from the International Trade Centre. We are presenting these data in the appendixes of the report because these are the only publicly available data we found for sourcing conflict minerals from the region. There is no distinction in these data between minerals that are
However, it is possible that the agency officials and stakeholders with whom we spoke may be unaware of other stakeholders and/or responsible sourcing initiatives active in the DRC and region. To determine the starting dates of the initiatives, we interviewed stakeholders and reviewed the websites of the various initiatives. To demonstrate what information stakeholders have reported regarding responsible sourcing initiatives, we reviewed and analyzed information published on the websites associated with the various responsible sourcing initiatives. When reporting on information provided by the initiatives and stakeholders, we are referring to information such as reports published, amount of minerals mined per region/country, amount of minerals exported, and value of minerals produced and exported, including data covering 2012 through 2014. The information gathered cannot be generalized and cannot be used to infer views of other stakeholders cognizant of conflict minerals issues.
2GAO, Conflict Minerals Disclosure Rule: SEC’s Actions and Stakeholder-Developed Initiatives, GAO-12-763 (Washington, D.C.: July 16, 2012) and GAO-13-689.

Appendix I: Objectives, Scope, and Methodology
Page 42 GAO-14-575 Conflict Minerals
conflict-free and those that have supported armed groups. Moreover, none of these data can be generalized or be used to infer the total production or export of conflict minerals from the DRC and the adjoining countries.
In response to a mandate in the Dodd-Frank Wall Street Reform and Consumer Protection Act that GAO submit an annual report that assesses the rate of sexual violence in war-torn areas of the DRC and adjoining countries, we identified and assessed any additional published information available on sexual violence in war-torn eastern DRC, as well as three adjoining countries that border the DRC—Rwanda, Uganda, and Burundi—since our 2013 report on sexual violence in these areas.3 During the course of our review, we interviewed officials from State and USAID and interviewed NGO representatives and researchers to discuss the collection of sexual violence-related data—including population-based surveys and case file data—in the DRC and adjoining countries. Specifically, we followed up with researchers and representatives from those groups we interviewed for our prior review on sexual violence rates in eastern DRC and adjoining countries, including a representative from the Human Rights Center at the University of California, Berkeley, School of Law and others officials. The team also traveled to New York City to meet with officials from the United Nations Population Fund, United Nations High Commissioner for Refugees, and the United Nations Special Representative of the Secretary-General on Sexual Violence in Conflict. We also conducted Internet literature searches to identify new academic articles containing any additional information on sexual violence since our 2013 report.4
We conducted this performance audit from September 2013 to June 2014 in accordance with generally accepted government auditing standards. Those standards require that we plan and perform the audit to obtain sufficient, appropriate evidence to provide a reasonable basis for our findings and conclusions based on our audit objectives. We believe that the evidence obtained provides a reasonable basis for our findings and conclusions based on our audit objectives.
3GAO-13-689. We did not include in our current report information from preliminary studies or reports. 4GAO-13-689.

Appendix II: State Department Map of Armed Groups Present at Mine Sites in the Democratic Republic of the Congo
Page 43 GAO-14-575 Conflict Minerals
Figure 5 depicts the most recent map published by the Department of State. The map focuses on the exploitation of tin, tantalum, tungsten, and gold in the provinces of North and South Kivu and parts of Orientale, Maniema, and Katanga provinces.
Appendix II: State Department Map of Armed Groups Present at Mine Sites in the Democratic Republic of the Congo

Appendix II: State Department Map of Armed Groups Present at Mine Sites in the Democratic Republic of the Congo
Page 44 GAO-14-575 Conflict Minerals
Figure 5: State Department Map of the Presence of Armed Groups at Mine Sites in the Democratic Republic of the Congo, as of February 2014

Appendix III: SEC Flowchart Summary of the Disclosure Process for the Final Conflict Minerals Rule
Page 45 GAO-14-575 Conflict Minerals
When the SEC adopted the conflict minerals rule in August 2012, it published a flowchart summary of the final rule to guide SEC-reporting companies affected by the rule through the disclosure process (see fig 6). In general, the process reflects that an SEC-reporting company needs to (1) determine whether its manufactured products contain conflict minerals, (2) determine whether conflict minerals are necessary to the functionality or production of the product and if it originated in the DRC or an adjoining country, and (3) possibly conduct due diligence and potentially provide a Conflict Minerals Report.
Appendix III: SEC Flowchart Summary of the Disclosure Process for the Final Conflict Minerals Rule

Appendix III: SEC Flowchart Summary of the Disclosure Process for the Final Conflict Minerals Rule
Page 46 GAO-14-575 Conflict Minerals
Figure 6: SEC Flowchart Summary of Conflict Minerals Rule

Appendix III: SEC Flowchart Summary of the Disclosure Process for the Final Conflict Minerals Rule
Page 47 GAO-14-575 Conflict Minerals
Note: SEC indicated that the flowchart is intended to be used as a guide and that issuers should refer to the text in the rule for a more comprehensive description of the rule’s requirements. Further, SEC indicated that, as a result of the appeals court decision, SEC’s stay order, and SEC staff’s guidance, some of the steps outlined in the flowchart have been modified pending further action by SEC or a court.

Appendix IV: Sample Data from the ITRI Supply Chain Initiative
Page 48 GAO-14-575 Conflict Minerals
The ITRI Supply Chain Initiative (iTSCi) publishes qualitative and quantitative information on its projects in the DRC and Rwanda on its website. The information includes production data for minerals that have been mined and traded employing the iTSCi traceability system, audits of iTSCi member companies, and assessments of the political and security situation in various sites in the DRC and Rwanda. The mineral production and export data include minerals mined under the auspices of other stakeholder-led initiatives in the region. Almost all of the initiatives employ the iTSCi traceability system to track the mining and trading of minerals along the supply chain.1
One limitation of the data is that the production data–disaggregated by mineral and mine–are proprietary to iSTCi members. Therefore, it is not possible to quantify the total quantity or value of any of the minerals separately.
2
Tables 2-7 provide iTSCi production in metric tons and mineral sales in thousands of U.S. dollars for tin, tungsten, and tantalum coming from several provinces in the DRC, including Maniema, South Kivu, and Katanga.
Table 2: Production of Minerals from Maniema Covered by iTSCi for Q1 and Q2 of 2013, in Metric Tons
2013 Tin Tin/Tantaluma Tin/Tungstena Tantalum/Tungstena Tungsten Q1 17 11 1 Q2 225 1 17 1 Total 242 1 28 1 1
Source: GAO based on iTSCi data. | GAO-14-575
Note: Empty cells indicate no recorded production. aiTSCi data include traced material that are reported as combinations of more than one mineral.
1Because the data were not used to support findings, conclusions, or recommendations, we did not assess their reliability. 2Detailed data showing production and exports of each of the conflict minerals are proprietary to iTSCi members.
Appendix IV: Sample Data from the ITRI Supply Chain Initiative

Appendix IV: Sample Data from the ITRI Supply Chain Initiative
Page 49 GAO-14-575 Conflict Minerals
Table 3: Sales of Minerals from Maniema Covered by iTSCi for Q1 and Q2 of 2013, in Thousands of U.S. Dollars
2013 Tin Tin/Tantaluma Tin/Tungstena Tantalum/Tungstena Tungsten Q1 $87 $46 $1 Q2 $1,163 $5 $84 $3 Total $1,250 $5 $130 $3 $1
Source: GAO based on iTSCi data. | GAO-14-575
Note: Empty cells indicate no recorded sales. aiTSCi data include traced material that are reported as combinations of more than one mineral.
Table 4: Production of Minerals from South Kivu Covered by iTSCi for Q4 of 2012 through Q2 of 2013, in Metric Tons
Year/Quarter Tin Tin/Tantaluma 2012/Q4 181 2013/Q1 200 2013/Q2 80 1 Total 460 1
Source: GAO based on iTSCi data. | GAO-14-575
Note: Empty cells indicate no recorded production. Totals may not add due to rounding. aiTSCi data include traced material that are reported as combinations of more than one mineral.
Table 5: Sales of Minerals from South Kivu Covered by iTSCi for Q4 of 2012 through Q2 of 2013, in Thousands of U.S. Dollars
Year/Quarter Tin Tin/Tantaluma 2012/Q4 $760 2013/Q1 $800 2013/Q2 $286 $3 Total $1,847 $3
Source: GAO based on iTSCi data. | GAO-14-575
Note: Empty cells indicate no recorded sales. Totals may not add due to rounding. aiTSCi data include traced material that are reported as combinations of more than one mineral.

Appendix IV: Sample Data from the ITRI Supply Chain Initiative
Page 50 GAO-14-575 Conflict Minerals
Table 6: Production of Minerals from Katanga Covered by iTSCi for Q2 of 2011 through Q2 of 2013, in Metric Tons
Year/Quarter Tin Tin/Tantaluma Tin/Tungstena Tantalum Tantalum/Tungstena Tungsten 2011/Q2 796 193 2 54 3 2011/Q3 1,436 234 2 51 16 2011/Q4 779 121 2 128 26 2012/Q1 753 252 15 114 12 2012/Q2 651 275 40 60 2 15 2012/Q3 671 258 18 64 2 40 2012/Q4 497 188 7 45 29 2013/Q1 340 211 7 34 9 2013/Q2 648 441 2 40 0.4 6 Total 6,572 2,172 97 588 3 155
Source: GAO based on iTSCi data. | GAO-14-575
Note: Empty cells indicate no recorded production. Totals may not add due to rounding. aiTSCi data include traced material that are reported as combinations of more than one mineral.
Table 7: Sales of Minerals from Katanga Covered by iTSCi for Q2 of 2011 through Q2 of 2013, in Thousands of U.S. Dollars
Year/Quarter Tin Tin/Tantaluma Tin/Tungstena Tantalum Tantalum/Tungstena Tungsten 2011/Q2 $5,166 $1,290 $14 $1,548 $21 2011/Q3 $9,839 $1,746 $18 $1,733 $122 2011/Q4 $4,072 $718 $40 $4,448 $152 2012/Q1 $4,224 $1,783 $67 $3,758 $70 2012/Q2 $3,701 $1,811 $193 $2,012 $7 $97 2012/Q3 $3,352 $1,720 $172 $2,114 $5 $181 2012/Q4 $2,906 $1,268 $106 $1,571 $105 2013/Q1 $2,112 $1,449 $38 $1,092 $74 2013/Q2 $3,744 $3,583 $11 $1,502 $2 $19 Total $39,117 $15,367 $659 $19,778 $15 $840
Source: GAO based on iTSCi data. | GAO-14-575
Note: Empty cells indicate no recorded sales. Totals may not add due to rounding. aiTSCi data include traced material that are reported as combinations of more than one mineral.
Tables 8 and 9 provide iTSCi production in tons and mineral sales in thousands of U.S. dollars for tin, tungsten and tantalum in Rwanda.
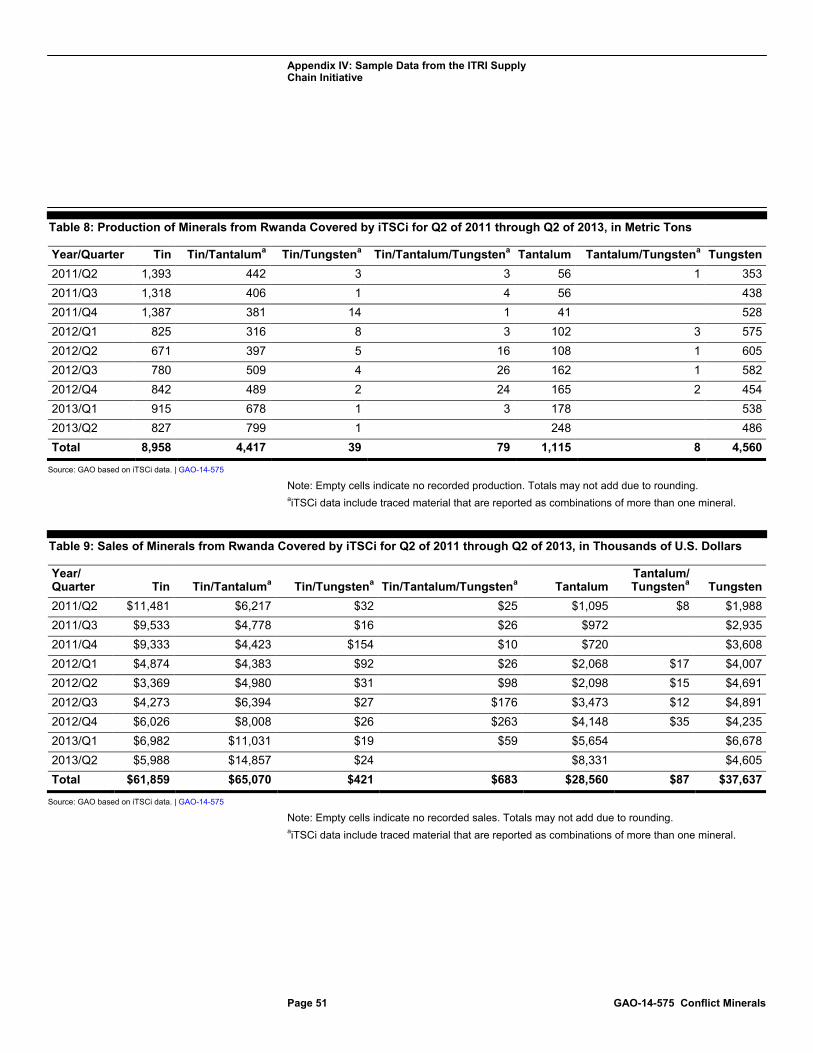
Appendix IV: Sample Data from the ITRI Supply Chain Initiative
Page 51 GAO-14-575 Conflict Minerals
Table 8: Production of Minerals from Rwanda Covered by iTSCi for Q2 of 2011 through Q2 of 2013, in Metric Tons
Year/Quarter Tin Tin/Tantaluma Tin/Tungstena Tin/Tantalum/Tungstena Tantalum Tantalum/Tungstena Tungsten 2011/Q2 1,393 442 3 3 56 1 353 2011/Q3 1,318 406 1 4 56 438 2011/Q4 1,387 381 14 1 41 528 2012/Q1 825 316 8 3 102 3 575 2012/Q2 671 397 5 16 108 1 605 2012/Q3 780 509 4 26 162 1 582 2012/Q4 842 489 2 24 165 2 454 2013/Q1 915 678 1 3 178 538 2013/Q2 827 799 1 248 486 Total 8,958 4,417 39 79 1,115 8 4,560
Source: GAO based on iTSCi data. | GAO-14-575
Note: Empty cells indicate no recorded production. Totals may not add due to rounding. aiTSCi data include traced material that are reported as combinations of more than one mineral.
Table 9: Sales of Minerals from Rwanda Covered by iTSCi for Q2 of 2011 through Q2 of 2013, in Thousands of U.S. Dollars
Year/ Quarter Tin Tin/Tantaluma Tin/Tungstena Tin/Tantalum/Tungstena Tantalum
Tantalum/ Tungstena Tungsten
2011/Q2 $11,481 $6,217 $32 $25 $1,095 $8 $1,988 2011/Q3 $9,533 $4,778 $16 $26 $972 $2,935 2011/Q4 $9,333 $4,423 $154 $10 $720 $3,608 2012/Q1 $4,874 $4,383 $92 $26 $2,068 $17 $4,007 2012/Q2 $3,369 $4,980 $31 $98 $2,098 $15 $4,691 2012/Q3 $4,273 $6,394 $27 $176 $3,473 $12 $4,891 2012/Q4 $6,026 $8,008 $26 $263 $4,148 $35 $4,235 2013/Q1 $6,982 $11,031 $19 $59 $5,654 $6,678 2013/Q2 $5,988 $14,857 $24 $8,331 $4,605 Total $61,859 $65,070 $421 $683 $28,560 $87 $37,637
Source: GAO based on iTSCi data. | GAO-14-575
Note: Empty cells indicate no recorded sales. Totals may not add due to rounding. aiTSCi data include traced material that are reported as combinations of more than one mineral.

Appendix V: Conflict Mineral Production and Export Data as Reported by the DRC and Rwandan Governments
Page 52 GAO-14-575 Conflict Minerals
The DRC Ministry of Mines published data on the volume of production and exports for tin, tantalum, tungsten, and gold for 2003-2012 (see tables 10-13).1
Table 10: Total Volume of Tin Production and Export from DRC for 2003-2012, in Metric Tons
Production Export 2003 2,986 2,986 2004 2,317 2,945 2005 5,171 5,971 2006 5,528 2,388 2007 16,050 14,694 2008 20,013 19,189 2009 16,584 15,512 2010 11,943 13,415 2011 8,921 9,267 2012 7,189 8,018 Total 96,702 94,385
Source: GAO based on DRC Ministry of Mines. | GAO-14-575
1The DRC Ministry of Mines statistics also include production and export data for other minerals. Because the data were not used to support findings, conclusions, or recommendations, we did not assess their reliability.
Appendix V: Conflict Mineral Production and Export Data as Reported by the DRC and Rwandan Governments

Appendix V: Conflict Mineral Production and Export Data as Reported by the DRC and Rwandan Governments
Page 53 GAO-14-575 Conflict Minerals
Table 11: Total Volume of Tantalum Production and Export from DRC for 2003-2012, in Metric Tons
Production Export 2003 47 47 2004 78 32 2005 184 185 2006 31 24 2007 393 393 2008 530 531 2009 509 464 2010 492 440 2011 2,199 536 2012 574 586 Total 5,037 3,238
Source: GAO based on DRC Ministry of Mines. | GAO-14-575
Table 12: Total Volume of Tungsten Production and Export from DRC for 2003-2012, in Metric Tons
Production Export 2003 No data 100 2004 272 190 2005 405 311 2006 1,001 471 2007 1,265 1,194 2008 621 725 2009 458 365 2010 44 45 2011 84 87 2012 197 71 Total 4,347 3,559
Source: GAO based on DRC Ministry of Mines. | GAO-14-575

Appendix V: Conflict Mineral Production and Export Data as Reported by the DRC and Rwandan Governments
Page 54 GAO-14-575 Conflict Minerals
Table 13: Total Volume of Gold Production and Export from DRC for 2003-2012, in Metric Tons
Production Export 2003 No data No data 2004 0.7 0.0 2005 0.6 0.6 2006 0.3 0.1 2007 0.1 0.1 2008 0.1 0.1 2009 0.2 0.2 2010 0.2 0.2 2011 0.3 0.2 2012 2.8 2.4 Total 5.3 3.9
Source: GAO based on DRC Ministry of Mines. | GAO-14-575
The Rwanda Natural Resources Authority published data on the volume and value of tin, tantalum and tungsten exported from Rwanda from January to August of 2013 (see tables 14 and 15).2
Table 14: Total Volume of Tin, Tantalum, and Tungsten Exports from Rwanda January-August 2013, in Metric Tons
Tin Tantalum Tungsten January 421 84 184 February 224 48 130 March 475 284 185 April 510 251 230 May 458 273 157 June 267 212 177 July 396 288 151 August 407 245 164 Total 3,158 1,686 1,378
Source: GAO based on Rwanda Natural Resources Authority. | GAO-14-575
Note: Totals may not add due to rounding.
2Because the data were not used to support findings, conclusions, or recommendations, we did not assess their reliability.

Appendix V: Conflict Mineral Production and Export Data as Reported by the DRC and Rwandan Governments
Page 55 GAO-14-575 Conflict Minerals
Table 15: Total Value of Tin, Tantalum, and Tungsten Exports from Rwanda January-August 2013, in Thousands of U.S. Dollars
Tin Tantalum Tungsten January $5,386 $4,953 $2,178 February $2,803 $3,012 $1,564 March $8,314 $16,379 $2,118 April $6,352 $15,736 $3,915 May $5,365 $16,583 $2,075 June $3,206 $12,373 $2,559 July $4,297 $17,822 $2,103 August $4,509 $15,144 $2,277 Total $40,233 $102,002 $18,789
Source: GAO based on Rwanda Natural Resources Authority. | GAO-14-575
Note: Totals may not add due to rounding.

Appendix VI: Conflict Minerals Data from the International Trade Centre Data on Global Conflict Mineral Imports
Page 56 GAO-14-575 Conflict Minerals
The International Trade Centre (ITC), a joint agency of the World Trade Organization and the United Nations (UN) compiles a Trade Map with data including the global exports in tons and export value of tin, tantalum, tungsten and gold from the DRC and adjoining countries, as available for fiscal years 2009-2013 (see tables 16-31 for ITC data as of June 2014).1
These data do not provide a comprehensive depiction of the flow of conflict minerals exported from the DRC and adjoining countries; rather, they are an estimate based on imports data from reporting partner countries. Furthermore, these data may include imports of conflict minerals that have financed armed groups.
The ITC calculated these data using the UN Commodity Trade Statistics Database, which compiles trade data from UN member countries.
2
In many instances, there are no data listed for a particular mineral or year. There were no data for import volume or value of conflict minerals in the ITC database for the Republic of the Congo (Congo-Brazzaville) or South Sudan.
Table 16: ITC Estimates of Exports of Conflict Minerals from the Democratic Republic of the Congo for Fiscal Years 2009-2013, in Metric Tons
Tin Tantalumb Tungsten Gold FY2009 160a 121a 471a No quantitya FY2010 2,589a 252a 87a 0 a FY2011 510a 101a 10a 0 a FY2012 1,670a 326a 0 a FY2013 2,621a 329a 95a 0 a Total 7,550 1,129 663 0a
Source: GAO analysis of Trade Map data. | GAO-14-575
Note: According to the ITC, if there is no record in the export dataset for a specific mineral and a specific partner country, they consider that the country has not exported the mineral for that year and publish a zero value. “No quantity” means that the country under review has reported a value but no quantity for the product and partner under review. Empty cells indicate that no partner country has reported importation of that mineral from that country.
1The Trade Map (or Market Access Map, Investment Map and Standards Map, respectively), International Trade Centre, www.intracen.org/marketanalysis. 2Because the data were not used to support findings, conclusions, or recommendations, we did not assess their reliability.
Appendix VI: Conflict Minerals Data from the International Trade Centre Data on Global Conflict Mineral Imports

Appendix VI: Conflict Minerals Data from the International Trade Centre Data on Global Conflict Mineral Imports
Page 57 GAO-14-575 Conflict Minerals
aAccording to the ITC, these estimates of exports have been reconstructed on the basis of data reported by importing partner countries, known as mirror statistics. The ITC states that mirror statistics are a “second-best solution” when no data exist but are subject to limitations, including the omission of non-reporting countries, particularly in Africa. bExport data for tantalum ores and concentrates also include exports of niobium and vanadium ores and concentrates.
Table 17: ITC Estimates of Export Value of Conflict Minerals from the DRC for F Fiscal Years 2009-2013, in Thousands of U.S. Dollars
Tin Tantalumb Tungsten Gold FY2009 $1,061a $2,575a $4,357a $1,251a FY2010 $23,045a $5,161a $806a $1,140a FY2011 $8,786a $9,131a $263a $4,426a FY2012 $17,719a $24,006a $1,394a FY2013 $32,628a $22,142a $1,339a $2,729a Total $83,239 $63,015 $6,765 $10,940
Source: GAO analysis of Trade Map data. | GAO-14-575
Note: According to the ITC, empty cells indicate that no partner country has reported importation of that mineral from that country. aAccording to the ITC, these estimates of exports have been reconstructed on the basis of data reported by importing partner countries, known as mirror statistics. The ITC states that mirror statistics are a “second-best solution” when no data exist, but are subject to limitations, including the omission of non-reporting countries, particularly in Africa. bExport data for tantalum ores and concentrates also include exports of niobium and vanadium ores and concentrates.
Table 18: ITC Estimates of Exports of Conflict Minerals from Angola for Fiscal Years 2009-2012, in Metric Tons
Tin Tantalumb Tungsten Gold FY2009 FY2010 FY2011 No quantitya 0 FY2012 19a FY2013 No quantitya 28a Total 47 0
Source: GAO analysis of Trade Map data. | GAO-14-575
Note: According to the ITC, if there is no record in the export dataset for a specific mineral and a specific partner country, they consider that the country has not exported the mineral for that year and publish a zero value. “No quantity” means that the country under review has reported a value but no quantity for the product and partner under review. Empty cells indicate that no partner country has reported importation of that mineral from that country. aAccording to the ITC, these estimates of exports have been reconstructed on the basis of data reported by importing partner countries, known as mirror statistics. The ITC states that mirror

Appendix VI: Conflict Minerals Data from the International Trade Centre Data on Global Conflict Mineral Imports
Page 58 GAO-14-575 Conflict Minerals
statistics are a “second-best solution” when no data exist ,but are subject to limitations, including the omission of non-reporting countries, particularly in Africa. bExport data for tantalum ores and concentrates also include exports of niobium and vanadium ores and concentrates.
Table 19: ITC Estimates of Export Value of Conflict Minerals from Angola for Fiscal Years 2009-2013, in Thousands of U.S. Dollars
Tin Tantalumb Tungsten Gold FY2009 FY2010 FY2011 $0a $90a FY2012 $31a FY2013 $0a $7 Total $0 $38 $0 $90
Source: GAO analysis of Trade Map data. | GAO-14-575
Note: According to the ITC, if there is no record in the export dataset for a specific mineral and a specific partner country, they consider that the country has not exported the mineral for that year and publish a zero value. Empty cells indicate that no partner country has reported importation of that mineral from that country. aAccording to the ITC, these estimates of exports have been reconstructed on the basis of data reported by importing partner countries, known as mirror statistics. The ITC states that mirror statistics are a “second-best solution” when no data exist, but are subject to limitations, including the omission of non-reporting countries, particularly in Africa. bExport data for tantalum ores and concentrates also include exports of niobium and vanadium ores and concentrates.
Table 20: ITC Estimates of Exports of Conflict Minerals from Burundi for Fiscal Years 2009-2012, in Metric Tons
Tin Tantaluma Tungsten Gold FY2009 26 0 264 1 FY2010 32 0 503 0 FY2011 0 17 330 1 FY2012 0 0 32 2 FY2013 No quantity 76 148 3 Total 58 93 1,277 7
Source: GAO analysis of Trade Map data. | GAO-14-575
Note: According to the ITC, if there is no record in the export dataset for a specific mineral and a specific partner country, they consider that the country has not exported the mineral for that year and publish a zero value. “No quantity” means that the country under review has reported a value but no quantity for the product and partner under review. aExport data for tantalum ores and concentrates also include exports of niobium and vanadium ores and concentrates.

Appendix VI: Conflict Minerals Data from the International Trade Centre Data on Global Conflict Mineral Imports
Page 59 GAO-14-575 Conflict Minerals
Table 21: ITC Estimates of Export Value of Conflict Minerals from Burundi for Fiscal Years 2009-2013, in Thousands of U.S. Dollars
Tin Tantaluma Tungsten Gold FY2009 $175 $0 $1,547 $28,979 FY2010 $297 $0 $2,951 $13,003 FY2011 $15 $20 $4,607 $59,047 FY2012 $0 $0 $226 $105,196 FY2013 $0 $2,753 $1,776 $121,470 Total $487 $2,773 $11,107 $327,695
Source: GAO analysis of Trade Map data. | GAO-14-575
Note: According to the ITC, if there is no record in the export dataset for a specific mineral and a specific partner country, they consider that the country has not exported the mineral for that year and publish a zero value. aExport data for tantalum ores and concentrates also include exports of niobium and vanadium ores and concentrates.
Table 22: ITC Estimates of Exports of Conflict Minerals from Central African Republic for Fiscal Years 2009-2012, in Metric Tons
Tin Tantaluma Tungsten Gold FY2009 24 FY2010 49 FY2011 21 FY2012 6 FY2013 691 Total 791
Source: GAO analysis of Trade Map data. | GAO-14-575
Note: According to the ITC, empty cells indicate that no partner country has reported importation of that mineral from that country. aExport data for tantalum ores and concentrates also include exports of niobium and vanadium ores and concentrates.

Appendix VI: Conflict Minerals Data from the International Trade Centre Data on Global Conflict Mineral Imports
Page 60 GAO-14-575 Conflict Minerals
Table 23: ITC Estimates of Export Value of Conflict Minerals from Central African Republic for Fiscal Years 2009-2013, in Thousands of U.S. Dollars
Tin Tantaluma Tungsten Gold FY2009 $473 FY2010 $1,277 FY2011 $2,509 FY2012 $1,367 FY2013 $318 Total $5,944
Source: GAO analysis of Trade Map data. | GAO-14-575
Note: According to the ITC, empty cells indicate that no partner country has reported importation of that mineral from that country. aExport data for tantalum ores and concentrates also include exports of niobium and vanadium ores and concentrates.
Table 24: ITC Estimates of Exports of Conflict Minerals from Rwanda for Fiscal Years 2009-2012, in Metric Tons
Tin Tantaluma Tungsten Gold FY2009 5,224 958 945 0 FY2010 6,477 827 879 0 FY2011 7,314 915 784 0 FY2012 4,658 1,139 1,372 0 FY2013 4,820 2,466 2,119 0 Total 28,493 6,305 6,099 0
Source: GAO analysis of Trade Map data. | GAO-14-575
Note: According to the ITC, if there is no record in the export dataset for a specific mineral and a specific partner country, they consider that the country has not exported the mineral for that year and publish a zero value. aExport data for tantalum ores and concentrates also include exports of niobium and vanadium ores and concentrates.

Appendix VI: Conflict Minerals Data from the International Trade Centre Data on Global Conflict Mineral Imports
Page 61 GAO-14-575 Conflict Minerals
Table 25: ITC Estimates of Export Value of Conflict Minerals from Rwanda for Fiscal Years 2009-2013, in Thousands of U.S. Dollars
Tin Tantaluma Tungsten Gold FY2009 $34,235 $18,082 $6,283 $856 FY2010 $65,834 $20,034 $7,254 $170 FY2011 $101,921 $39,000 $11,677 0 FY2012 $52,912 $56,698 $21,354 0 FY2013 $57,957 $134,575 $28,866 0 Total $312,859 $268,389 $75,434 $1,026
Source: GAO analysis of Trade Map data. | GAO-14-575
Note: According to the ITC, if there is no record in the export dataset for a specific mineral and a specific partner country, they consider that the country has not exported the mineral for that year and publish a zero value. aExport data for tantalum ores and concentrates also include exports of niobium and vanadium ores and concentrates.
Table 26: ITC Estimates of Export of Conflict Minerals from Tanzania for Fiscal Years 2009-2012, in Metric Tons
Tin Tantaluma Tungsten Gold FY2009 0 0 0 402 FY2010 1 0 0 325 FY2011 66 160 0 43 FY2012 71 112 0 319 FY2013 57 No quantity No quantity 140 Total 195 272 0 1,229
Source: GAO analysis of Trade Map data. | GAO-14-575
Note: According to the ITC, if there is no record in the export dataset for a specific mineral and a specific partner country, they consider that the country has not exported the mineral for that year and publish a zero value. “No quantity” means that the country under review has reported a value but no quantity for the product and partner under review. aExport data for tantalum ores and concentrates also include exports of niobium and vanadium ores and concentrates.
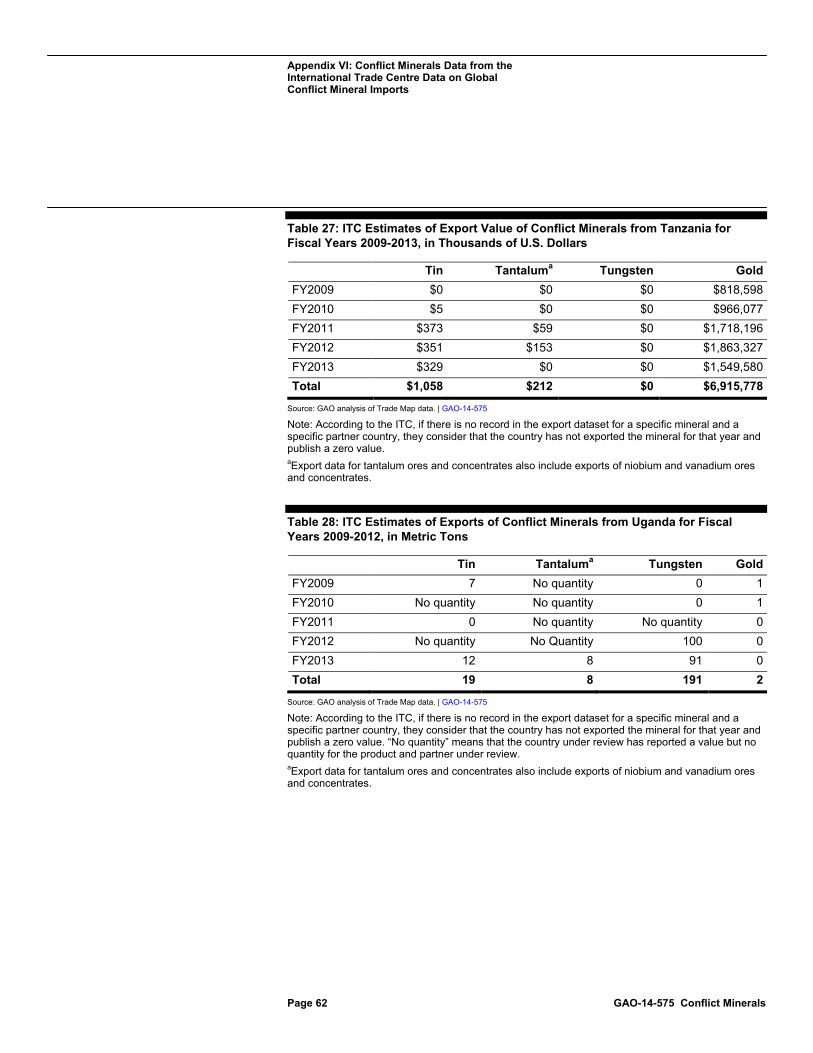
Appendix VI: Conflict Minerals Data from the International Trade Centre Data on Global Conflict Mineral Imports
Page 62 GAO-14-575 Conflict Minerals
Table 27: ITC Estimates of Export Value of Conflict Minerals from Tanzania for Fiscal Years 2009-2013, in Thousands of U.S. Dollars
Tin Tantaluma Tungsten Gold FY2009 $0 $0 $0 $818,598 FY2010 $5 $0 $0 $966,077 FY2011 $373 $59 $0 $1,718,196 FY2012 $351 $153 $0 $1,863,327 FY2013 $329 $0 $0 $1,549,580 Total $1,058 $212 $0 $6,915,778
Source: GAO analysis of Trade Map data. | GAO-14-575
Note: According to the ITC, if there is no record in the export dataset for a specific mineral and a specific partner country, they consider that the country has not exported the mineral for that year and publish a zero value. aExport data for tantalum ores and concentrates also include exports of niobium and vanadium ores and concentrates.
Table 28: ITC Estimates of Exports of Conflict Minerals from Uganda for Fiscal Years 2009-2012, in Metric Tons
Tin Tantaluma Tungsten Gold FY2009 7 No quantity 0 1 FY2010 No quantity No quantity 0 1 FY2011 0 No quantity No quantity 0 FY2012 No quantity No Quantity 100 0 FY2013 12 8 91 0 Total 19 8 191 2
Source: GAO analysis of Trade Map data. | GAO-14-575
Note: According to the ITC, if there is no record in the export dataset for a specific mineral and a specific partner country, they consider that the country has not exported the mineral for that year and publish a zero value. “No quantity” means that the country under review has reported a value but no quantity for the product and partner under review. aExport data for tantalum ores and concentrates also include exports of niobium and vanadium ores and concentrates.

Appendix VI: Conflict Minerals Data from the International Trade Centre Data on Global Conflict Mineral Imports
Page 63 GAO-14-575 Conflict Minerals
Table 29: ITC Estimates of Export Value of Conflict Minerals from Uganda for Fiscal Years 2009-2013, in Thousands of U.S. Dollars
Tin Tantaluma Tungsten Gold FY2009 $2 $0 $0 $13,100 FY2010 $0 $0 $0 $30,072 FY2011 $1 $0 $0 $6,795 FY2012 $0 $0 $979 $9,163 FY2013 $128 $22 $972 $3,128 Total $131 $22 $1,951 $62,258
Source: GAO analysis of Trade Map data. | GAO-14-575
Note: According to the ITC, if there is no record in the export dataset for a specific mineral and a specific partner country, they consider that the country has not exported the mineral for that year and publish a zero value. aExport data for tantalum ores and concentrates also include exports of niobium and vanadium ores and concentrates.
Table 30: ITC Estimates of Exports of Conflict Minerals from Zambia for Fiscal Years 2009-2012, in Metric Tons
Tin Tantaluma Tungsten Gold FY2009 27 No quantity 0 695 FY2010 0 No quantity 23 555 FY2011 28 0 72 2 FY2012 0 No quantity 0 1,492 FY2013 6 0 0 4 Total 61 0 95 2,748
Source: GAO analysis of Trade Map data. | GAO-14-575
Note: According to the ITC, if there is no record in the export dataset for a specific mineral and a specific partner country, they consider that the country has not exported the mineral for that year and publish a zero value. “No quantity” means that the country under review has reported a value but no quantity for the product and partner under review. aExport data for tantalum ores and concentrates also include exports of niobium and vanadium ores and concentrates.

Appendix VI: Conflict Minerals Data from the International Trade Centre Data on Global Conflict Mineral Imports
Page 64 GAO-14-575 Conflict Minerals
Table 31: ITC Estimates of Export Value of Conflict Minerals from Zambia for Fiscal Years 2009-2013, in Thousands of U.S. Dollars
Tin Tantaluma Tungsten Gold FY2009 $77 $0 $0 $19,004 FY2010 $1 $0 $12 $46,411 FY2011 $50 $0 $6 $81,040 FY2012 $0 $0 $0 $140,744 FY2013 $4 $0 $0 $164,079 Total $132 $0 $18 $451,278
Source: GAO analysis of Trade Map data. | GAO-14-575
Note: According to the ITC, if there is no record in the export dataset for a specific mineral and a specific partner country, they consider that the country has not exported the mineral for that year and publish a zero value. aExport data for tantalum ores and concentrates also include exports of niobium and vanadium ores and concentrates.

Appendix VII: Comments from the Department of Commerce
Page 65 GAO-14-575 Conflict Minerals
Appendix VII: Comments from the Department of Commerce

Appendix VII: Comments from the Department of Commerce
Page 66 GAO-14-575 Conflict Minerals

Appendix VIII: GAO Contacts and Staff Acknowledgments
Page 67 GAO-14-575 Conflict Minerals
Kimberly M. Gianopoulos, (202) 512-8612 or [email protected]
In addition to the individual named above, Godwin Agbara (Assistant Director), Russ Burnett, Etana Finkler, Justin Fisher, Julia Jebo Grant, Ernie Jackson, Jill Lacey, Reid Lowe, Andrea Riba Miller, and John O’Trakoun made key contributions to this report.
Appendix VIII: GAO Contacts and Staff Acknowledgments
GAO Contact
Staff Acknowledgments
(320998)

The Government Accountability Office, the audit, evaluation, and investigative arm of Congress, exists to support Congress in meeting its constitutional responsibilities and to help improve the performance and accountability of the federal government for the American people. GAO examines the use of public funds; evaluates federal programs and policies; and provides analyses, recommendations, and other assistance to help Congress make informed oversight, policy, and funding decisions. GAO’s commitment to good government is reflected in its core values of accountability, integrity, and reliability.
The fastest and easiest way to obtain copies of GAO documents at no cost is through GAO’s website (http://www.gao.gov). Each weekday afternoon, GAO posts on its website newly released reports, testimony, and correspondence. To have GAO e-mail you a list of newly posted products, go to http://www.gao.gov and select “E-mail Updates.”
The price of each GAO publication reflects GAO’s actual cost of production and distribution and depends on the number of pages in the publication and whether the publication is printed in color or black and white. Pricing and ordering information is posted on GAO’s website, http://www.gao.gov/ordering.htm.
Place orders by calling (202) 512-6000, toll free (866) 801-7077, or TDD (202) 512-2537.
Orders may be paid for using American Express, Discover Card, MasterCard, Visa, check, or money order. Call for additional information.
Connect with GAO on Facebook, Flickr, Twitter, and YouTube. Subscribe to our RSS Feeds or E-mail Updates. Listen to our Podcasts. Visit GAO on the web at www.gao.gov.
Contact:
Website: http://www.gao.gov/fraudnet/fraudnet.htm E-mail: [email protected] Automated answering system: (800) 424-5454 or (202) 512-7470
Katherine Siggerud, Managing Director, [email protected], (202) 512-4400, U.S. Government Accountability Office, 441 G Street NW, Room 7125, Washington, DC 20548
Chuck Young, Managing Director, [email protected], (202) 512-4800 U.S. Government Accountability Office, 441 G Street NW, Room 7149 Washington, DC 20548
GAO’s Mission
Obtaining Copies of GAO Reports and Testimony
Order by Phone
Connect with GAO
To Report Fraud, Waste, and Abuse in Federal Programs
Congressional Relations
Public Affairs
Please Print on Recycled Paper.