gao report on the us fiscal situation
TRANSCRIPT

GAO-10-653CG
Oversight and Accountability in a Time of Fiscal Stress
Association of Government AccountantsDallas, TexasApril 23, 2010
Gene L. DodaroActing Comptroller General
2GAO-10-653CG
•
Long-Term Fiscal Challenges
•
American Recovery and Reinvestment Act Implementation
•
Emergency Economic Stabilization Act Experience
•
Examples of the Need for Transformation

GAO-10-653CG
Long-Term Fiscal Challenges
4GAO-10-653CG
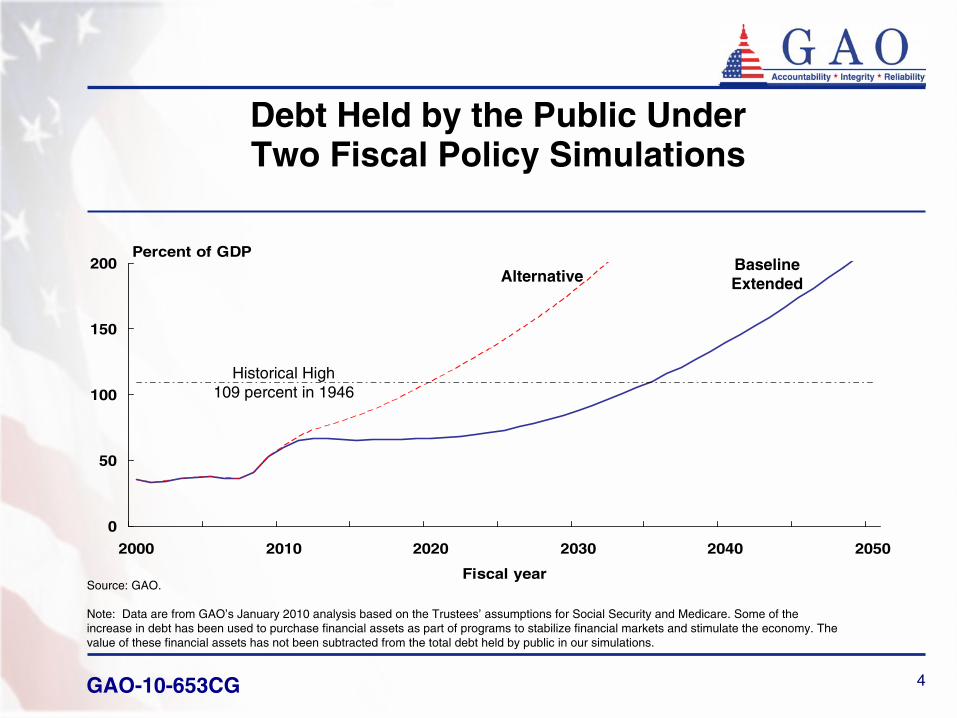
Debt Held by the Public Under Two Fiscal Policy Simulations
0
50
100
150
200
2000 2010 2020 2030 2040 2050
Fiscal year
Percent of GDPBaselineExtended
Source: GAO.
Note: Data are from GAO’s January 2010 analysis based on the Trustees’ assumptions for Social Security and Medicare. Some of the increase in debt has been used to purchase financial assets as part of programs to stabilize financial markets and stimulate the
economy. The value of these financial assets has not been subtracted from the
total debt held by public in our simulations.
Alternative
Historical High
109 percent in 1946

5GAO-10-653CG
0
10
20
30
40
50
2010 2020 2030 2040Fiscal year
Percent of GDP
Net interest Social Security Medicare and Medicaid All other spending
Potential Fiscal Outcomes
Under GAO’s Alternative Simulation:
Revenues and Composition of Spending as Shares of GDP
Revenue
Source: GAO.
Note: Data are from GAO’s January 2010 analysis based on the Trustees’ assumptions for Social Security and Medicare..

6GAO-10-653CG
Pressures on the Federal Budget in the Near Term
Debt held by the public under GAO’s Alternative simulation exceeds the historical high reached in the aftermath of World War II
2020
Medicare HI trust fund exhausted. Income sufficient to pay about
81 percent of benefitsb
2017Social Security begins running consistent annual cash deficits2016
45 percent of Medicare outlays funded by general revenueb2014
Oldest members of the baby-boom generation become eligible for Medicare2011
Social Security runs first cash deficit since 1984a2010
Medicare Hospital Insurance (HI) outlays exceeded cash income2008
Oldest members of the baby-boom generation became eligible for early Social Security retirement benefits
2008
Source: GAO analysis.
Notes:aBased
on CBO’s January 2010 baseline projections.bBased
on 2009 Annual Report of the Boards of Trustees of the Federal Hospital Insurance and Federal Supplementary Medical Insurance Trust Funds
(May 12, 2009).

7GAO-10-653CG
Federal and Combined Federal, State, and Local Deficits as Shares of GDP
-20
-15
-10
-5
0
5
2000 2010 2020 2030 2040 2050
Fiscal year
Percent of GDP
Federal only Federal, state, and localSource: GAO.Note: federal data are from GAO’s Alternative simulation.
Sur
plus
Def
icit

8GAO-10-653CG
Not Just a U.S. Challenge
•
Financial market stress in other major industrial nations
•
Public debt levels in other major industrial countries have also
increased dramatically.
•
Projections show many countries on a path of rising debt to GDP ratios.

9GAO-10-653CG
Moving Forward
•
Budget Controls
•
Creation of Commission
•
Continued Public Education, Discussion, and Debate

GAO-10-653CG
American Recovery and Reinvestment Act Implementation

11GAO-10-653CG
American Recovery & Reinvestment Act
•
Signed February 17, 2009
•
Purpose:
•
Preserve/create jobs and promote recovery
•
Assist those most hurt by the recession
•
Invest in infrastructure
•
Stabilize state and local government budgets
•
Total cost (tax and spending): $862 billion, including over $626 billion in additional spending (CBO Estimate)

12GAO-10-653CG
Projected Versus Actual Federal Outlays to States and Localities Under the Recovery Act
Source: GAO analysis of data from CBO, Recovery.gov and Federal Funds Information for States.
0
20
40
60
80
100
120
2009 2010 2011 2012 2013 2014 2015 2016F iscal year
Estimated
$103.8 Billion in Actual Federal Outlays,as of March 31, 2010
Outlays in billions of dollars

13GAO-10-653CG
GAO’s Monitoring of Selected States
1. Arizona2. California3. Colorado4. Florida5. Georgia6. Illinois7. Iowa8. Massachusetts9. Michigan
10. Mississippi11. New Jersey12. New York13. North Carolina14. Ohio15. Pennsylvania16. Texas17. Washington, D.C.
14GAO-10-653CG
Recovery Act: GAO’s Reporting Objectives
GAO’s reports on states and localities focus on:
•
Use of funds
•
Safeguards and internal controls
•
The impact of funds
GAO also comments on jobs created and retained as reported by recipients.

15GAO-10-653CG
Recovery Act Challenges for Officials at All Levels of Government
•
Expectations for transparency and accountability
•
Qualified personnel need to implement proper accountability
•
Close and ongoing coordination needed
16GAO-10-653CG
GAO Recommendations
•
GAO has made 28 recommendations to 5 federal agencies (DOT, HUD, Education, DOL, and OMB) regarding:
•
Accountability and Transparency
•
Reporting on Impact and Guidance
•
Resource Allocation and Capacity

17GAO-10-653CG
Single Audit: GAO Recommendations
Leverage Single Audit as an effective oversight tool
Move to earlier reporting on internal controls Focus on Recovery Act programs Give relief for low-risk programsFund more timely, effective Single Audits

18GAO-10-653CG
Single Audits: GAO Matter for Congressional Consideration
•
amending the Single Audit Act or enact new legislation that provides for more timely internal control reporting, as well as audit coverage for smaller Recovery Act programs with high risk.
•
create mechanisms to provide additional resources to support those charged with carrying out the Single Audit and related audits.
19GAO-10-653CG
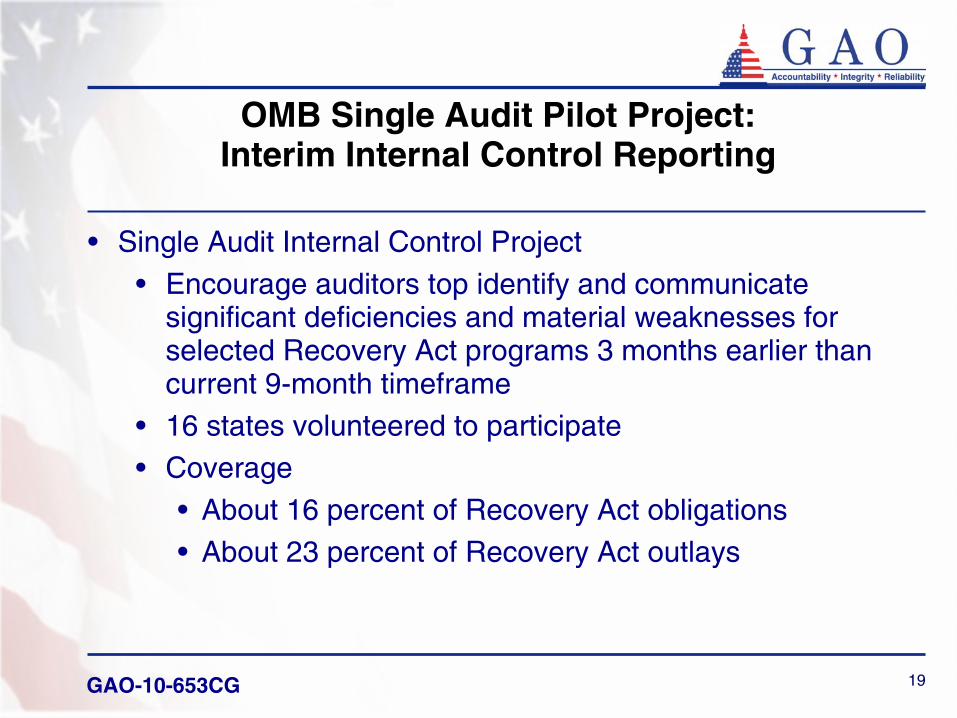
OMB Single Audit Pilot Project: Interim Internal Control Reporting
•
Single Audit Internal Control Project
•
Encourage auditors top identify and communicate significant deficiencies and material weaknesses for selected Recovery Act programs 3 months earlier than current 9-month timeframe
•
16 states volunteered to participate
•
Coverage •
About 16 percent of Recovery Act obligations
•
About 23 percent of Recovery Act outlays

GAO-10-653CG
EMERGENCY ECONOMIC STABILIZATION EXPERIENCE

21GAO-10-653CG
Troubled Asset Relief Program (TARP)
•
Emergency Economic Stabilization Act of 2008 created $700 billion TARP in October 2008
•
GAO given statutory oversight role
•
GAO’s TARP reports’ recommendations follow 3 themes:
•
Monitoring the use of funds to meet the Act’s objectives
•
Articulating a better communication strategy
•
Ensuring effective Treasury management

22GAO-10-653CG
Status of Troubled Asset Relief Program
Outstanding Balances
22
Program Gross Outstanding Balance
Capital Purchase Program $66.7
AIG 47.5
Targeted Investment Program 0.0Consumer & Business Lending Initiative:
Term Asset-backed Securities Loan Facility & Small Business and Community Lending Initiative 0.1
Automotive Industry Financing Program 75.1
Public-Private Investment Program 8.2
Totals $197.6
•As of April 9, 2010, Treasury had disbursed about $381 billion of the almost $700 billion in program funds, and had received repayments of about $181 billion. •A total of about $198 billion remains outstanding (see table below).
Status of TARP Funds as of April 9, 2010 (dollars in billions)
*
* Amount outstanding for CPP excludes about $2.3 billion which Treasury has written off.

23GAO-10-653CG
Status of U.S. Government
Ownership of Selected Companies
9.9%
27.1%
56.0%
60.8%
79.8%
0.0% 20.0% 40.0% 60.0% 80.0%
Chrysler
Citigroup
GMAC
GM
AIG
U.S. Government Ownership (Common Equity) Percentages
U.S. GovernmentOwnership (CommonEquity) Percentages
AIG, GM, and Chrysler –
As of Sept. 30, 2009; GMAC and Citigroup –
As of Dec. 31, 2009.All percentages relate to TARP, except for AIG which relates to the U.S. Government’s beneficial interest in a trust. Also, the percentages only represent common equity and do not reflect additional financial instruments held by the U.S. Government in these entities (e.g., preferred stock, warrants, and direct loans).
24GAO-10-653CG
GAO’s Ongoing and Future Monitoring Efforts
•
Capital Purchase Program,
•
Home Affordable Modification Program,
•
Automobile Industry Financing Program,
•
AIG,
•
Small Business Lending Initiatives,
•
Stress tests, and
•
Decision to Extend TARP

25GAO-10-653CG
Examples of Need for Transformation
•
Financial Regulation
•
Postal Service
26GAO-10-653CG
Modernizing The U.S. Financial Regulatory System
Financial Regulation: A Framework for Crafting and Assessing Proposals to Modernize the Outdated U.S. Financial Regulatory System
•
Explains the origins of the current financial regulatory system
•
Describes market developments and changes that pose challenges to the current system
•
Presents an evaluation framework that Congress and others can use to craft or evaluate potential regulatory reform efforts
(GAO-09-216, Jan. 8, 2009)

27GAO-10-653CG
Financial Regulatory System Outdated
Risks posed by:
•
Emergence of large, complex, and interconnected financial conglomerates
•
Less-regulated entities are playing increasingly critical roles in the financial system
•
New and complex products pose challenges to system stability and consumer protection

28GAO-10-653CG
Crafting or Assessing Regulatory Reform Proposals:
GAO Framework—9 Essential Characteristics
•
Clearly defined regulatory goals in statute
•
Appropriately comprehensive
•
Systemwide
focus
•
Flexible and adaptable
•
Efficient and effective
•
Consistent consumer and investor protections
•
Regulators provided with independence, prominence, authority, and accountability
•
Consistent financial oversight
•
Minimal taxpayer exposure

29GAO-10-653CG
U.S. Postal Service Financial Viability
•
The Postal Service’s business model is not viable due to its inability to reduce costs sufficiently in response to continuing mail volume and revenue declines.
•
Mail volume is projected to decline by about 27 billion pieces over the next decade, while revenues will stagnate, and costs will rise.
•
Given its financial problems and outlook, the Postal Service cannot support its current level of service and operations.
Billions of pieces
Source: USPS.
Fiscal year
0
50
100
150
200
250
202020102000199019801971
Projected fiscal year 2020 volume: about 150 billion pieces, the lowest level
since fiscal year 1986.
Actual and Projected Total Mail Volume, Fiscal Years 1971 through 2020
30GAO-10-653CG
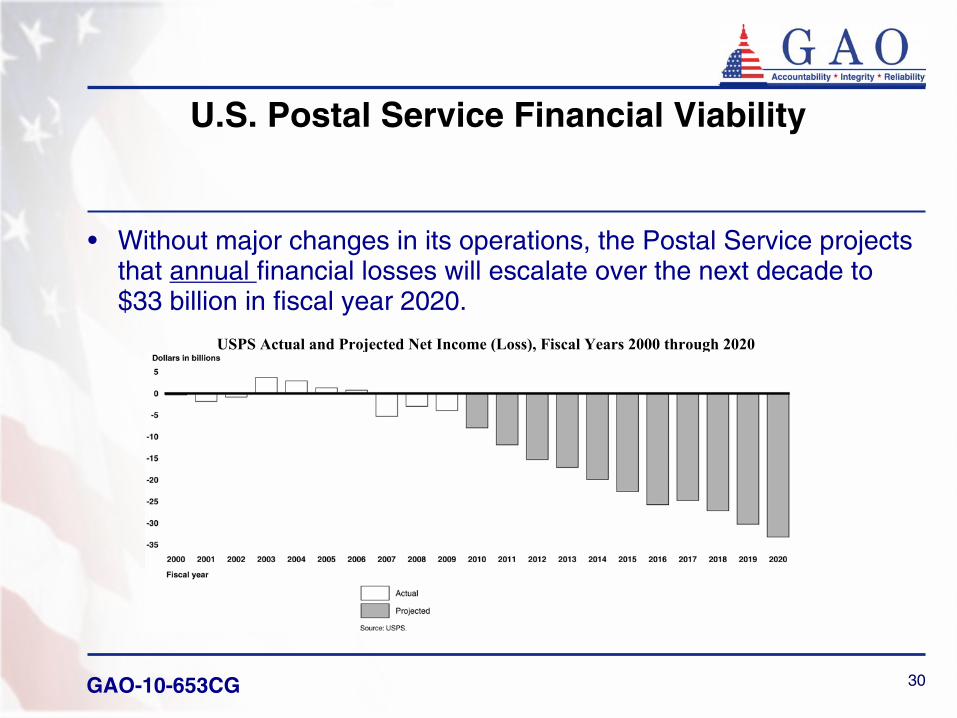
U.S. Postal Service Financial Viability
•
Without major changes in its operations, the Postal Service projects that annual financial losses will escalate over the next decade to $33 billion in fiscal year 2020.
USPS Actual and Projected Net Income (Loss), Fiscal Years 2000 through 2020

31GAO-10-653CG
U.S. Postal Service Financial Viability
Action by Congress and the Postal Service urgently needed to facilitate progress:
(1) more aggressive action needed to realign Postal Service operations and its workforce while increasing revenues within its current authority, using the collective bargaining process to address wages, benefits, and workforce flexibility; and
(2) Congress needs to address legal restrictions and resistance to broader changes in the postal network and workforce.
The longer it takes for Congress and the Postal Service to address these challenges, the more difficult they will be to overcome.

32GAO-10-653CG
On the WebWeb site: www.gao.gov/cghome.htm
ContactChuck Young, Managing Director, Public Affairs
(202) 512-4800 U.S. Government Accountability Office
441 G Street NW, Room 7149
Washington, D.C. 20548
CopyrightThis is a work of the U.S. government and is not subject to copyright protection in the United States. The published product may be reproduced and distributed in its entirety without further permission from GAO. However, because this work may contain copyrighted images or other material, permission from the copyright holder may be necessary if you wish to reproduce this material separately.