gasday 2016 · 2nd jetty at zeebrugge lng terminal reception of lng carriers with capacity from 2...
TRANSCRIPT

Gasday 2016
Nancy Mahieu
Director General Energy at FPS Economy

The Belgian Energy Policy & the Role of Gas

1. Challenges of the Belgian Energy Sector
2. Policy actions to overcome these challenges
3. The role of gas
Overview

1. CHALLENGES OF THE BELGIAN ENERGY SECTOR

Security of supply in the electricity sector under pressure;
Inadequate market signals to attract the necessary investments in energy infrastructure (production, transport, distribution, storage, …);
Constant vigilance on the evolution of energy prices and the impact on the competitiveness of our industry and affordability for households
Guaranteeing the safety of energy infrastructure and products;
Preparing the transition towards a low-carbon energy system;
Defining a holistic, long-term interfederal energy vision
Challenges of the Belgian energy sector

2. POLICY ACTIONS TO OVERCOME THESE CHALLENGES
http://economie.fgov.be

Security of supply
Adaptation of nuclear calendar
Introduction of strategic reserve
Analysis of generation adequacy and flexibility needs and socio-economic optimal importation level
Operational risk preparedness policy
Active exchange of information and coordination with neighbouring countries

Market design
Continued efforts to improve market integration (Flow-
based Market Coupling, BeLux)
Electricity package:
Improvements to the energy-only markets and strategic reserve
Unlock the full flexibility potential
Steps towards the intruduction of a CRM

Affordability
Revision of offshore support system;
Foreseen introduction of an Energy Norm;
Anchor the Consumer Agreement in legislation;
Analysis of Social Tariff for electricity and gas;

Safety
Restructuring and updating of “RGIE” through quick-wins
Revision of legislation on safety of transport through
pipelines and distribution of natural gas
Enhanced screening of pure biofuels and continuation of
E10-campagn
Start safety screenings of critical infrastructure

Sustainability
Publication national plan on alternative transport fuels;
Drafting national integrated energy and climate plan
Finalizing national energy efficiency plan
Implementation new framework regulation energy labelling
Creation and operationalizing energy transition fund

Towards a holistic energy pact
Development of an energy vision on regional and federal level;
Federal reflections based on: Generation adequacy and flexibility study (Elia)
Welfare study and analysis socio-economic optimal importation level
Objective to come to an interfederal energy pact in 2017;

3. THE ROLE OF GAS
http://economie.fgov.be

World energy outlook 2016
Gas consumption increases almost everywhere
More flexible global market More competitive and flexible arrangement (including greater reliance on prices set by gas to gas competition)
increasing availability of footloose US LNG cargos
Arrival of new exporters in the 2020s
Floating storage and regasifaction units unlock new and smaller LNG markets
Uncertainty on the direction commercial transition could delay decisions new upstream and transportation projects

Primary energy consumption (Mtoe)
http://economie.fgov.be
0
10
20
30
40
50
60
7020
05
20
06
20
07
20
08
20
09
20
10
20
11
20
12
20
13
20
14
Other energy
Renewableenergy and wasteNuclear energy
Solid fossil fuels
Natural gas
Oil and oilproducts

Future opportunities for natural gas
Belgium as a gas roundabout for North-West Europe;
Flexible back-up fuel for renewable energy sources;
Natural gas in transport;

Market integration
Solid and modern internal gas infrastructure (network, LNG, storage) and participation in strategic projects abroad
BeLux market integration:
Increased liquidity and security of supply;
Efforts ongoing on compliance programme;
Looking beyond?

L-gas conversion
Conversion programme:
Proposal on indicative planning;
Discussion on roles, responsibilities and financing;
Elaboration of a communication strategy;
Need to replace the Dutch volumes

Illustration of some partnership domains between DG Energy and ARGB/KVBG
Product safety : selected laboratory (via procurement) compliant with ISO 17025 – Make tests on gas appliances in the context of product safety campaign initiated by DG Energy (i.e. control of products to see if they complies with the applicable regulations)
Product efficiency (or performance evaluation) : idem but in the context of the Energy Labeling Regulation
Gas Quality Harmonization : designated by DG Energy to conduct the related BE task force
…
Conclusion : very constructive collaboration between the experts with complementary know-how


Arno Büx
Chief Commercial Officer at Fluxys

FLOWS AND
RESERVES
Arno Büx | Chief Commercial Officer Fluxys

NATURAL GAS IMPORTS IN EUROPE
2016 12 13 24
Africa
Russia
Middle East
Norway
Pipe gas 87%
LNG 13%
Breakdown of imports (72% of consumption)
Russia 41,0%
Norway 34,7%
Algeria 10,4%
Qatar 8,6%
Nigeria 2,3%
Others 3,0%
[BP Statistical Review of World Energy June 2016]

BELGIUM: EXCEPTIONAL GAS SUPPLY DIVERSIFICATION
• Connected to all sources available to Europe
• Highly interconnected with all neighbouring grids and systems
• Bidirectional flows with all neighbouring markets
2016 12 13 25
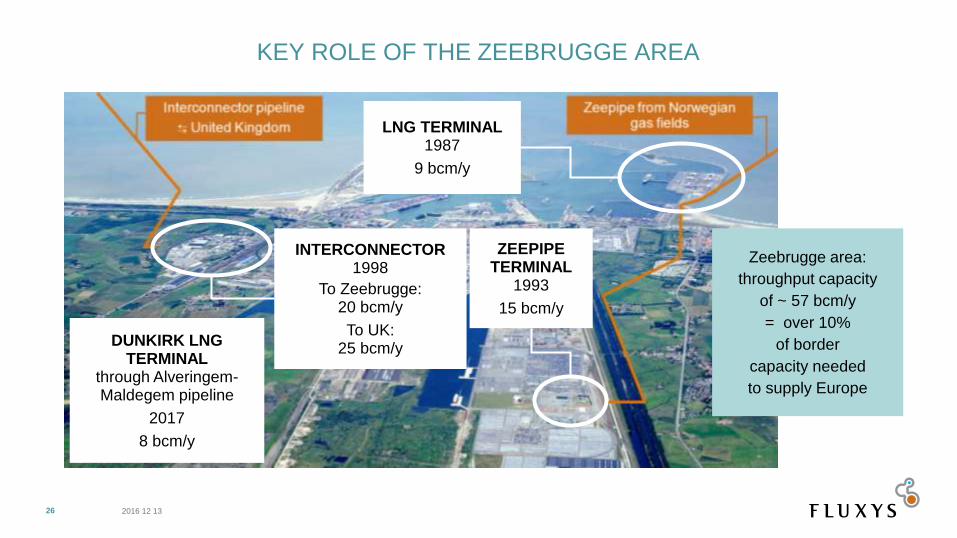
KEY ROLE OF THE ZEEBRUGGE AREA
2016 12 13 26
INTERCONNECTOR 1998
To Zeebrugge: 20 bcm/y
To UK: 25 bcm/y
LNG TERMINAL 1987
9 bcm/y
ZEEPIPE TERMINAL
1993
15 bcm/y
Zeebrugge area:
throughput capacity
of ~ 57 bcm/y
= over 10%
of border
capacity needed
to supply Europe
DUNKIRK LNG TERMINAL
through Alveringem-Maldegem pipeline
2017
8 bcm/y

INCREASING THE OPTIONS UPSTREAM
2016 12 13 27
Additional supply route for Russian gas since 2012: 20 bcm/y
• New LNG entry point to be commissioned shortly: 13 bcm/y
• New pipeline connecting Dunkirk to Zeebrugge area: 8 bcm/y
Supply from Azerbaijan and potentially other sources from 2020: 10 bcm/y (expandable to 20 bcm/y)

… AND DOWNSTREAM
2016 12 13 28
LNG truck loading at Zeebrugge LNG terminal
Remote industry, LNG-filling stations and bunkering of LNG- fuelled ships
Investment in second loading bay
2nd jetty at Zeebrugge LNG terminal
Reception of LNG carriers with capacity from 2 000 m3 LNG up to 217 000 m3 LNG
Load LNG bunkering ships
Fluxys partner in LNG bunkering ship with home port Zeebrugge
0
500
1000
1500
2000
2010 2011 2012 2013 2014 2015 2016
Number of truck loadings

BELGIAN GAS TRADING PLACES OFFER
AN ARRAY OF OPTIONS FOR SHIPPERS AND TRADERS
2016 12 13 29
0
500
1.000
1.500
2.000
2.500
3.000
1/jan 1/feb 1/mrt 1/apr 1/mei 1/jun 1/jul 1/aug 1/sep 1/okt 1/nov 1/dec
ZTP 2015 ZTP 2016 ZeeBeach 2016GW
h

THE CASE FOR GAS IN CLIMATE ACTION
• Key message COP21-22: climate change does not wait and requires immediate action
• Gas & gas technology available today to deliver instant results:
Partners of renewable energy in power generation
Heat & heating
Mobility
• Policy and standards need to keep the options open: ideology does not help the planet or its citizens
2016 12 13 30

2.3
Investment
plan
2015-24
3.7
176
80
88
53
43
27
45
0
20
40
60
80
100
120
140
160
180
200
Gasconsumption
RAB gastransmission
Powerconsumption
(incl. decentralproduction of
18 TWh)
RAB powertransmission
Households & SMEs Industry Power generation
Consumption in
TWh (2015)
10
8
6
4
2
0
RAB in
bn €
3.9
2.3
CHALLENGE: KEEPING THE
OVERALL ENERGY SYSTEM
COST AFFORDABLE
Energy transmission in Belgium: gas system is far more cost efficient than power
system
2015: 10 times cheaper
2024: 20 times cheaper
+ 244 export
+ 3 export
31 2016 12 13

WRAP-UP
• Belgium exceptional gas supply diversification
• Climate action: gas & gas technology deliver immediate carbon reduction while keeping overall energy system cost affordable
• For gas & gas technology to deliver: policy and standards need to keep options open
2016 12 13 32

Daan Curvers
COGEN Vlaanderen

Voor kwaliteitsvolle Warmte-krachtkoppeling
COGENERATION in industry
a general overview

Outline
About COGEN
General introduction
What is CHP?
Increased efficiency
A short history
Technologies
Current climate
Opportunities

Outline
About COGEN
General introduction
What is CHP?
Increased efficiency
A short history
Technologies
Current climate
Opportunities

About COGEN
Non-profit, member organisation (± 170)
CHP users
CHP constructors
Energy suppliers
Engineering firms / consultancy
Universities and research
Grid operators
‘Sister’-organisations

About COGEN
Committed towards supporting the development of high efficiency CHP
Primary energy savings are key
Independent and objective point of view
Reduction of consumption, reuse … first

Outline
About COGEN
General introduction
What is CHP?
Increased efficiency
A short history
Technologies
Current climate
Opportunities

General introduction
Niveau 1
Primary and secondary energy
Niveau 3
Energy for end use
Niveau 4
Products and services
Niveau 2
Transformation
CHP

General introduction
Trias energetica
Don’t waste energy 1
If you do need energy, try to use as much
renewables as possible 2
If you do need fossile energy, use it as efficiently
as possible
3

General introduction
Energy ≠ energy
First law of Thermodynamics:
“Conservation of energy”
There is actually no “energy”-problem!
Second law of Thermodynamics:
Irreversibility, quality loss, Limits on transformation
Amount of ‘transformable’ energy (available work, EXERGY) is limited
1 kWh electricity 1 kWh heat
1 kWh electricity 1 kWh heat
??

General introduction
Exergy content electricity: 100%
Exergy content fuel / gas: ≈100%
Exergy content heat: function(T)
h
lhF
T
TTQ
)( CTl 0

General introduction
Efficiency electricity generation from fuel:
Energy: 55%
Exergy: 55%
Efficiency low-temp heat generation (30°C) from fuel:
Energy: ≈ 100%
Exergy: 10%

Outline
About COGEN
General introduction
What is CHP?
Increased efficiency
A short history
Technologies
Current climate
Opportunities

What is CHP?
Combined Heat and Power
Combined generation of Heat and Power (or work) in one process
Heat at high temperature is converted into work/power, remaining energy at lower temperature is used for heating purposes

Increased efficiency
CHP delivers substantial primary energy savings
Typically up to 30%
Less emissions
Decentralised production of electricity: less distribution losses
PE savings example:
Warmte: 50 Elektriciteit: 40

Increased efficiency
Heat: 50
Electricity: 40
10 40 50
100
Heat: 50
Electricity: 40
50 5
55
40 40
80 135
PE Savings: 35/135 = 26 %
Conventional: power plant & boiler CHP
50% 90% 40% 50%

Outline
About COGEN
General introduction
What is CHP?
Increased efficiency
A short history
Technologies
Current climate
Opportunities

A short history
Pearl street station (1882)

A short history
Industries early 1900’s
E.g. sugar industry in ‘campaign’: large need for both power and heat
Ghent: “centrale Ham”
District heating in 1958

A short history
More recently:
Flanders

A short history
Early 90’s
Steam turbines
- Direct drive and electricity
- Large (petrochemical) industry

A short history
Second half 90’s
Growth of gas turbines in industry
Gas turbine
CCGT
Most installations by incumbent operator

A short history
Early 2000
Cool down
Market liberalisation

A short history
2005 onwards
Growth
Support mechanism
Large growth of ICE in greenhouses
Gas replacing coal and HFO
A short history
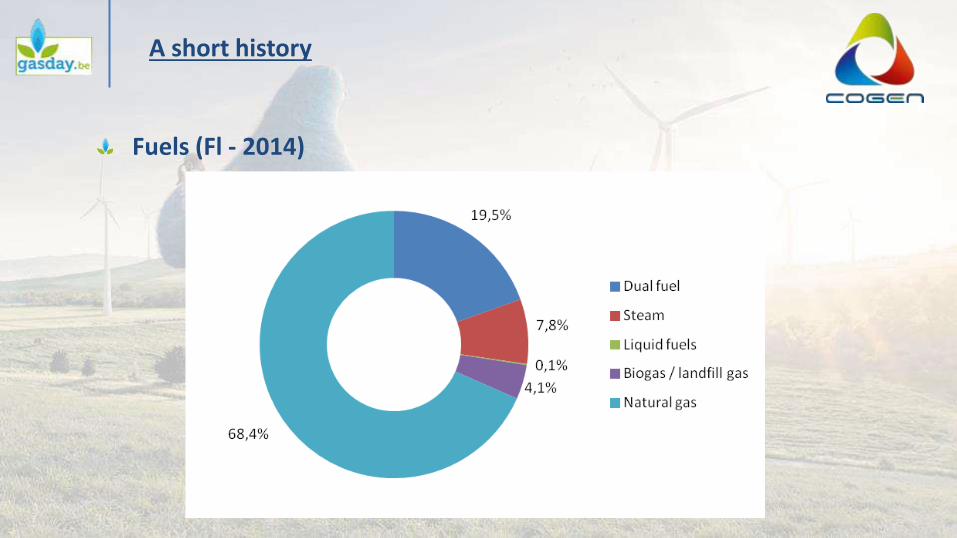
Fuels (Fl - 2014)

A short history
More recently:
Wallonia

CHP in Belgium
Bilan énergetique de la Wallonie 2014
Wallonia:

Outline
About COGEN
General introduction
What is CHP?
Increased efficiency
A short history
Technologies
Current climate
Opportunities

Technologies
Main technologies:
Turbine technologies (industrial)
Gas turbine (500 MW FL)
Steam turbine (360 MW FL)
CCGT (800 MW FL)
Combustion engine
Green houses (400+ MW FL)
Tertiary sector (hospitals, senior housing …)
Industry

Technologies
New technologies:
Stirling engine
Residential – renovation market
No market uptake – too late?
Fuel cell
Promising technology
Very high efficiency (measurement campaign)
Cost reduction necessary (a.o. European projects ene.field & PACE)

63
1 kW 10 kW 100 kW
1 MW
10 MW
Micro-CHP Small scale CHP Conv. CHP
50 kW
Residential
Appartment buildings
Offices
Sport infrastructure
Industry
District heating
Green houses
Hospitals
Swimming pools
Technologies

Outline
About COGEN
General introduction
What is CHP?
Increased efficiency
A short history
Technologies
Current climate
Opportunities

Current climate
Support:
EU:
CHP Directive (2004/8/EC)
Energy efficiency directive (2012/27/EU)
Federal:
Increased tax reduction for investment
Tax exemption natural gas for CHP (‘accijnsvrijstelling’)
Regional
Certificate mechanisms, based on PES:
CHP certificates in Flanders
Green certificates in Brussels and Wallonia

Current climate
Need for clear(er) business proposition:
Implementation Network Codes
Impact?
Connection with flexible access (DG)
Impact?
Capacity tariffs (DG)
Impact?
Need for better ‘image’ for clean gas solutions as a transition measure

Outline
About COGEN
General introduction
What is CHP?
Increased efficiency
A short history
Technologies
Current climate
Opportunities

Opportunities
Large need for clean, sustainable and dispatchable power generation

Opportunities
Large need for clean, sustainable and dispatchable power generation

Opportunities
Large need for clean, sustainable and dispatchable power generation
District heating

Opportunities
Large need for clean, sustainable and dispatchable power generation
District heating
New technologies
Fuel cell
Very high efficiencies demonstrated
Theoretically reversible
Combination with power to heat
Industrial solutions possible

Sources
Inventaris warmte-krachtkoppeling Vlaanderen 2014 (2015); Wouter Wetzels, Kristien Aernouts, Kaat Jespers
Bilan provisoire 2014 de production électrique et de transformation, de la cogénération et des renouvelables (2016); ICEDD
Cogeneration's 20-year history in Flanders (2013); Erwin Cornelis & Kaat Jespers
The power of transformation (2014); IEA

Jean Blondeau
Blondeau Industrial Heating

GAS APPLICATIONS
in the industry

Process Heating
Gas applications in the industry

Gas applications in the industry

Gas applications in the industry
Burners for all industries : Metal industry (all heat treatments, annealing, galvanizing, ..) – glass industry – all kind of industrial drying (paper, textile, gypsum, printing, painting, ...) – food – automotive – finishing – incineration – petrochemical – ceramics – plastics - …
Process Heating

Gas applications in the industry
All installations in conformity with EC 746-2 (gas) and EC 60204-1 (electrical)

Gas applications in the industry
Drying applications :
Duct burners
Burners from 100 kW till …
Low emissions
Modular constructions
Large Control range
Fresh air or recirculating
79

Gas applications in the industry
Drying applications :
Gun burners
Low emissions
Large Control range
80

Gas applications in the industry
Furnaces:
High or medium velocity burners
Direct or indirect heating (tubes)
Uniform temperatures
Possibilityr for oxydising or reducing atmosphere
81

Gas applications in the industry
Volume Heating

Gas applications in the industry
Air Heating

Gas applications in the industry
Gas fired condensing unit heaters =
Modulating burners between 30 and 100% of capacity
Efficienty of 98% full stage - 108% in low stage
Low Nox burners – EU class 5 : 70 mg/kWh
All heaters are EC approved and in cornformity with the new ERP rules being introduced in 2017.
84

Gas applications in the industry
Unit Heating
Unit heaters Condensing unit heaters

Gas applications in the industry
Radiant Heating
Gas applications in the industry
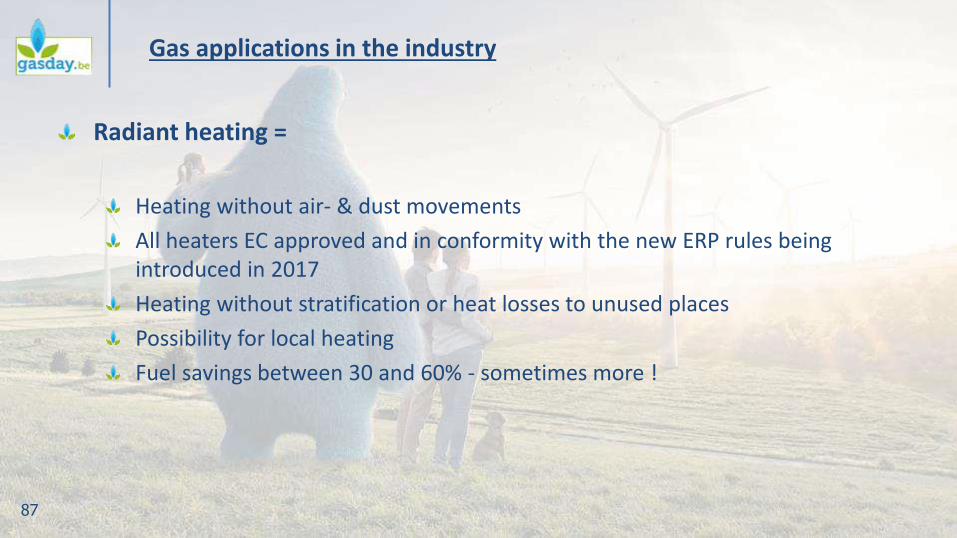
Radiant heating =
Heating without air- & dust movements
All heaters EC approved and in conformity with the new ERP rules being introduced in 2017
Heating without stratification or heat losses to unused places
Possibility for local heating
Fuel savings between 30 and 60% - sometimes more !
87

Gas applications in the industry
Tube heater Radiant strip Tube heater in network
Infra Red heater

Gas applications in the industry

Caterpillar Gosselies
40 make up air systems
106 tube heaters
12 unit heaters
Gas applications in the industry

Caterpillar
Gas applications in the industry

Caterpillar
Gas applications in the industry

Gas applications in the industry
Stork Antwerpen
155 x gasfired tube heaters of 47 kW
10 x heaters of 20,5 kW
Total investment 2012 : € 625.000
Fuel saving / year : € 300.000
Winter 2012 – 2013 : External t°C :-12°C – inside confort temperature +17°C

Stork
Gas applications in the industry

Gas applications in the industry
Stork

Stork
Gas applications in the industry

https://youtu.be/Cht9kTSuONI
http://www.aardgas.be/nl/ondernemingen/home
Stork
Gas applications in the industry

Natural is actual - and will remain for years - the most flexible and economical fuel for industrial heating !

Juan Vazquez
General Manager KVBG - ARGB

Waarom het hebben over nieuwe toepassingen?
100
Totaal elektriciteitsverbruik
BE 80 TWh1
Gas- en olieverbruik voor verwarming
BE 130 TWh1
Totaal elektriciteitsverbruik
BE 120 TWh
traje
ct naar 1
00 %
hern
ieuw
baar
traje
ct naar 1
00 %
hern
ieuw
baar
met enkel el. WP en SPF van 3,5
Hoogefficiënte gastoepassingen voor verwarming (+ elek.)

101
Vergelijking van kost-efficiëntie van verschillende gastoepassingen
€/kWh aardgas € 0,0428
€/kWh elektriciteit € 0,2355
SPF 20.000 kWh/jaar €/jaarLevensduur kost
15 jaar
Elektrische Warmtepomp
(Lucht-Water)3 6.666 € 1.569,84 € 42.748
Aardgas Warmtepomp 1,35 14.815 € 634,07 € 27.136
Aardgas condensatieketel 0,93 21.505 € 920,43 € 20.256
Hybride condensatieketel -
Warmtepomp0,93 - 3 12.895 € 1.297,36 € 31.260
*Aankoop, installatie, Verbruik en onderhoud

Patrick O
General Manager Viessmann
ATTB

Lower carbon with condensing – Patrick O
1. Energy-slaves: energy is much too cheap
2. CO2 problem
3. Challenge 2020-2030-2050 (regulation)
4. Inventory of the heating market + quick wins
5. Technical solutions according to Efficiency
6. Closing

1. Energy is (too) cheap. We do not use it in a sustainable way
What is watt?
Cyclist Fabian Cancelara and Tom Boonen produce up to 750 Watt when they are climbing
880 kWh

2. CO2 problem

2. CO2 problem

2. CO2 problem
Low or zero carbon economy
CO2 problem
1,5-2-3 °C

2. CO2 is a problem
3. Regulation: COP 21 – Paris // COP 22 – Marakesh // COP 23 Bonn
188 Countries
Fixed calendar (Europe)
2020 - 30 %
2030 – 40 %
2050 – 80 %
Big budgets for sustainable energy solutions
109

4. The number of boilers has more than doubled in 25 years: from 93.700 to 250.000 units
0
50000
100000
150000
200000
250000
3000001
98
9
19
90
19
91
19
92
19
93
19
94
19
95
19
96
19
97
19
98
19
99
20
00
20
01
20
02
20
03
20
04
20
05
20
06
20
07
20
08
20
09
20
10
20
11
20
12
20
13
20
14
20
15
Number of boilers in Belgium (Source: Gasgemeenschap/ Cedicol)

4. The market increased with the introduction of a new technology, condensation,
0
50000
100000
150000
200000
250000
3000001
98
9
19
90
19
91
19
92
19
93
19
94
19
95
19
96
19
97
19
98
19
99
20
00
20
01
20
02
20
03
20
04
20
05
20
06
20
07
20
08
20
09
20
10
20
11
20
12
20
13
20
14
20
15
Condensing boilers vs. non-condensing boilers (Source: Gasgemeenschap/Cedicol)
Niet cond. Cond.

4. The number of oil boilers was reduced to 50% compared to 1989 The market share of oil is around 10% since 2012
0
50000
100000
150000
200000
250000
3000001
98
9
19
90
19
91
19
92
19
93
19
94
19
95
19
96
19
97
19
98
19
99
20
00
20
01
20
02
20
03
20
04
20
05
20
06
20
07
20
08
20
09
20
10
20
11
20
12
20
13
20
14
20
15
Split oil-gas boilers (Source: Gasgemeenschap/Cedicol)
GAS OLIE

5. Large potential for energy savings in family homes
Trias Energetica
Existing buildings offer the largest potential, not new construction
1,5 mio condensing boilers / 3,7 mio housing units
21%
53%
16-30%
58 %
2,2 mio LT boilers should be replaced.

The potential for energy savings is important
Energy prices do not support a change towards a more efficient and renewable heating
Legislation for automobiles is much stricter than for boilers
5. Potential

5. Potential
1. Replace low temperatur boilers with condensing boilers From 1989 => 60 % are LT boilers or 2,9 mio (27 years)
2,2 mio LT Boilers
Min savings 16 % but > 25-30 %

5. Potential
2, Gas heat pumps = zeolith (adsorption) Extra 25-30 % (in combination with geothermal probe or solar thermal)

5. Potential
3, Fuel cells = saving of 39 % in primary energy use versus condensation

Reformer
Brandstofcel eenheid
Omvormer
Aardgas waterstof,
CO2 & warmte
Waterstof & zuurstof VDC, warmte &
water
VDC/VAC + Netbewaking.
Gas (2 kW*)
Warmte (1 kW*)
Stroom (0,75 kW*)
* Berekend op Hi
5. Potential – Brandstofcel – Vitovalor-P Opbouw en Componenten

Werkingsprincipe Brandstofcel:
0,75 kWh EL. (netto)
1 kWh TH
Max 21,5h / dag
Opstartfase = 1h
Verbruikt 500 Wh
Maximale opbrengst:
16,4 kWh EL/dag
5970 kWh EL / jaar.
PACE: 2500 FC
5. Potential – Brandstofcel – Vitovalor-P Rendement

5. Potential
4, Biogas - Biomethane

5. Potential
121
Green heat
District heating
Warmte@vlaanderen

6. Conclusions
2,2 mio LT boilers can be modernised
Change is needed
Cheap fossile energy prices are no motor for change
A new generation of heating solutions is ready
Important increase in demand for electricity – large investments
Decentral electricity production through CHP/ fuel cells
Natural gas can play an important role in the transition toward green energy
District heating of the 4th or 5th generation in combination with deep geothermal solutions and Biogas/ methane are ready to be deployed

Jos Dehaeseleer
Secretary General Marcogaz

Who is Marcogaz?
MAR-16-56 (D506)

Missions and Objectives of MARCOGAZ – Vision 2025
Members’ expertise and knowledge
Sust
ain
abili
ty
Technical support to the EU Institutions
Knowledge transfer
Uti
lisat
ion
Infr
astr
uct
ure
“MARCOGAZ is the competent and credible technical voice for natural and renewable gases in the field of infrastructure, utilisation and sustainability.
The EU sees MARCOGAZ as a trusted partner for a safe and reliable role of gas in the future energy mix.
MARCOGAZ supports strong cooperation between all gas organizations in Europe aiming to speak as one industry.”

126
Why the need for New Technologies in Residential Gas
Utilisations?

The share of gas in the global demand
Coal 29%
Oil 31% Gas
21%
Nuclear 5%
Renewables 14%
2040 (15 197 Mtoe)
450 Scenario
2013 (13 579 Mtoe)
Source: IEA - WEO 2015
Coal 16%
Oil 22%
Gas 22%
Nuclear 11%
Renewables 29%
MAR-16-56 (D506)

Change in natural gas demand by region (bcm)
-100
-50
0
50
100
150
China Middle East United States India EU Korea and Japan
bcm
2009-15 2015-21
Source: IEA - MTGMR 2016

EU 28 Gross Inland Consumption
%
Source: PRIMES –EU Reference Scenario 2016 – energy, transport and GHG emissions trends to 2050

Final energy demand in the residental sector
Source: PRIMES – EU Reference Scenario 2016 – energy, transport and GHG emissions trends to 2050

COP 21 – GHG emissions Energy policies Investments Free circulation Smartness
Challenges for the use of Natural Gas

Natural gas seen as a fossil fuel. However: Gas is the cleanest one Gas can contribute to enable a cost-effective decarbonization of the heating and cooling sector
Efficiency – e.g. replacing Europe’s traditional gas boilers with gas-condensing boilers could reduce GHGs by 7% in one year alone.
Gas can facilitate the entry of renewable energy sources in the system
Biomethane, H2 mixture (P2G), Syngas…
Hybrid systems
CCS
COP 21 - GHG emissions Target of limiting global warming to below 2°C

The Commission proposes a binding EU-wide target of 30% for energy efficiency by 2030
Energy Efficiency Directive (EED) Improving energy efficiency
Energy Performance of Buildings Directive (EPBD) Improving energy efficiency in buildings
EcoDesign Directive Improving the energy performance of products
Energy Labelling Directive Informing consumers
Renewable Energy Directive (RED)
Policies – Legislation (Winter Package)

Investments, research, developments… in the gas industry in Europe are at a low level
a lack of future perspective
Multinationals are moving their investments looking for a stable investment climate and regulated investments
to new gas markets other energies
Gas industry should react
Foster the image of gas Building confidence in gas as a valid partner in the future energy mix in Europe
Investements

Gas Quality EN 16726:2015 ‘Gas infrastructure – Gas Quality Group H’ No agreement yet on Wobbe Index range and Wobbe Index variation
Injection of renewable gases:
Biomethane H2
Syngas LNG
Free circulation of appliances
Free circulation in Europe

Consumers are the drivers of the energy transition Focus on the end-customer Empowering and informing consumers
Smart Appliances Hybrid Dual fuel CHP Sensors
sensors seem to offer solutions to a number of challenges that gas quality variation will bring gas quality sensing and control into individual appliances, especially boilers and waters heaters is an ambition that has so far only been realized in very small numbers http://www.marcogaz.be/index.php/news-documents
Smartness

Promotion of new gas technologies for heating
Mat
uri
ty
Aff
ord
abili
ty
Pu
blic
A
cce
pta
nce
Effi
cie
ncy
Mar
ket
Off
er
Hybrid technologies
Gas heat pumps
Micro CHP engine based
Fuel cells

Boilers combined with renewable technologies heat pump, thermal solar …
They are becoming competitive on the market
Hybrid boilers

Heat pump technology in a chemical process driven by thermal energy
Energy sources can be gas, solar thermal energy or waste heat
This technology can achieve a primary energy efficiency of 125-140%
Also cooling and hot tap water options
Perfectly suitable for larger buildings
Gas Absorption Heat Pumps (GAHP)

A combined heat and power unit Stirling engine Provides synergy that improves efficiency Also available on a small scale for residential and commercial usage Electricity from CHP can be produced when it is mostly needed
e.g. during cold and dark winter days and nights – a good match with intermittent RES
Micro CHP engine based

A combined heat and power unit Combining hydrogen (from CH4) and oxygen from the air to produce dc power, water, and heat Ene.field project
http://enefield.eu/
Micro FC-CHP

Stephen Harkin
Delta Energy & Environment

Delta Energy & Environment Ltd
Registered in Scotland: No SC259964
Registered Office: Floor F, Argyle House, 3 Lady Lawson Street, Edinburgh, EH3 9DR, UK
Evolution of gas demand in the domestic
sector in Belgium to 2030
Delta Energy & Environment Ltd
Registered in Scotland: No SC259964
Registered Office:
Highlights from a Delta-ee study for ARGB
Gasday 2016, Brussels
Contact:
[email protected], +44 131 625 1005

144
Experts in heat and distributed energy
Agenda
About Delta-ee
Scope of the study for ARGB
What will drive a change in heating appliance uptake?
Forecasted sales of heating appliances in Belgium
What does this mean for gas demand? What could influence this?
Conclusions

145
Experts in heat and distributed energy
Agenda
About Delta-ee
Scope of the study for ARGB
What will drive a change in heating appliance uptake?
Forecasted sales of heating appliances in Belgium
What does this mean for gas demand? What could influence this?
Conclusions

146
Experts in heat and distributed energy
Helping clients navigate the transformation of the energy system
Delta-ee helps utilities, product manufacturers and policy makers across Europe navigate the transformation to a more
distributed, customer centric, service-orientated energy future.
www.delta-ee.com
Delta-ee brings:
Customer insight
Technology & service expertise (customer side of the meter)
Policy & regulation
Detailed market insights & forecasts
Business model innovation
Selected clients:
KVBG | ARGB

147
Experts in heat and distributed energy
What Delta-ee offers to clients
Digital & Services Innovation
Connected Home Service
Customer Data Analytics
Energy Services Innovation
Distributed Generation & Demand Side Flexibility
Energy Storage Service
Distributed Power Service
Demand Response
Heat
Microgen Insight Service
Heat Pump Research Service
Roadmap Service and Pathways® Tool
Micro-CHP Service
Research Services And Studies Market analysis and forecasts
Strategy
Propositions and customer research
Technology and product
Policy & regulation
Demand forecasts and profiles
Consultancy
European ‘Connected Homes and Energy’
Energy Services
Micro-CHP
Heat Pumps & Utilities
Summits

148
Experts in heat and distributed energy
Agenda
About Delta-ee
Scope of the study for ARGB
What will drive a change in heating appliance uptake?
Forecasted sales of heating appliances in Belgium
What does this mean for gas demand? What could influence this?
Conclusions

149
Experts in heat and distributed energy
Project scope
A more granular & evidence-based forecast for gas demand evolution in Belgium
Provide a detailed investigation of the drivers of future gas demand in terms of technology, regulations &
policies.
Develop scenarios and quantify how overall gas demand (volume), peak gas demand & the number of gas
connections will change in Belgium under the different scenarios.
Understand the sensitivities and tipping points between these scenarios
A regionalised approach – considering Brussels, Wallonia & Flanders separately
BRUSSELS
(0.45 million
dwellings) FLANDERS
(2.85 million
dwellings)
WALLONIA
(1.6 million
dwellings)

150
Experts in heat and distributed energy
Agenda
About Delta-ee
Scope of the study for ARGB
What will drive a change in heating appliance uptake?
Forecasted sales of heating appliances in Belgium
What does this mean for gas demand? What could influence this?
Conclusions

151
Experts in heat and distributed energy
What will drive a change in heating appliance uptake?
More options for customers…
Technology costs
Policy & regulations Manufacturer push
Installer attitudes
Housing stock
…….
Technology performance Energy prices

152
Experts in heat and distributed energy
The residential heating market is changing…
More efficient gas appliances
Condensing gas boilers
Gas driven heat pumps
Micro-CHP / fuel cell
‘Boiler plus’ options
Better controls
Electrification of heat
Heat pumps (air source & ground source)
Hybrid gas boiler with electric heat pump
Energy efficiency
Insulation
New build regulations

153
Experts in heat and distributed energy
Current Residential Gas HPs – Low Availability, High Costs (1/2)
Source: Delta-ee Heat Pump Research Service
Adsorption Heat Pump
Can use solar thermal or ground
as heat source
Seasonal efficiency (on gas):
110-125%*
Adsorption Heat Pump
Can only use solar thermal as
heat source
Seasonal efficiency (on gas):
110-125%*
*Delta-ee’s view
Absorption Heat Pump
Can use air or ground as
heat source
Availability in 2015/2016
Expected seasonal
efficiency (on gas): 130-
145%*

154
Experts in heat and distributed energy
Current Residential Gas HPs (2/2)
Source: Delta-ee Heat Pump Research Service
Field-test successfully
finished
Being commercialised
Expected seasonal
efficiency (on gas): 130-
145%*
Field-test in 2015-2016
Commercialisation in
2017?
Expected seasonal
efficiency (on gas): >150-
160%*
Field-test expected in
2016-2017
Expected seasonal
efficiency (on gas):
>150-160%*
*Delta-ee’s view

155
Experts in heat and distributed energy
Hybrid heat pump availability
Source: Delta-ee Heat Pump Research Service
Integrated /
monobloc
Integrated / split
Un-integrated /
monobloc
Un-integrated / split
Hydraulic unit

156
Experts in heat and distributed energy
Fully installed costs of residential heating technologies
0
5.000
10.000
15.000
20.000
25.000
Fully
insta
lled p
rice (
€)
Typical fully installed prices (€) for heating appliances in Belgium in 2015
Alternatives to
gas boilers are
currently >€5,000
more expensive.
+ €5k
+ €15k
Technology costs…. will strongly influence customer decision making

157
Experts in heat and distributed energy
Gas boiler dominates today…
Lower carbon appliances account for a few % to ~35% of appliance sales in different European countries
0
500.000
1.000.000
1.500.000
2.000.000
Belgium Germany UK France Netherlands Italy
Other
Electric heating
Oil boiler
Gas boiler
Belgium – a
relatively small
market, dominated
by gas.
Hea
tin
g a
pp
lia
nce
sa
les
Current heating market structure varies across Europe

158
Experts in heat and distributed energy
Housing stock varies significantly across the 3 Belgian regions
FLANDERS
0% 20% 40% 60% 80% 100%
Natural Gas Fuel Oil CoalLPG Electricity Wood
0
2
Pre-1970 1970-1990 1991-2006 2006-2014
million
75%
25%
Multi family
homes: 0.7 million
dwellings
Single family homes:
2.2 million dwellings
61%
Mainly single family homes
60% on gas
More modern dwellings
Dwellings by main fuel type
Dwellings by age
BRUSSELS
0% 20% 40% 60% 80% 100%
Natural Gas Fuel Oil CoalLPG Electricity Wood
0
0,2
0,4
Pre-1970 1970-1990 1991-2006 2006-2014
million
33%
67% Multi family
homes: 0.3 million
dwellings
Single family homes:
0.2 million dwellings
77%
Two thirds flats
Three quarters on gas
>70% very old
Dwellings by main fuel type
Dwellings by age

159
Experts in heat and distributed energy
Agenda
About Delta-ee
Scope of the study for ARGB
What will drive a change in heating appliance uptake?
Forecasted sales of heating appliances in Belgium
What does this mean for gas demand? What could influence this?
Conclusions

160
Experts in heat and distributed energy
Step 3: Techno – economic modelling in
different housing segments.
Step 2: Segmentation of the Belgian
housing stock.
Forecasting heating appliance uptake in Belgium
Summary of forecasting approach:
Step 1: Scenario development &
assumptions.
Step 4: Customer ‘soft’ factor analysis
to generate uptake %s
Step 5:
Apply uptake %s for each
appliance to the addressable
market in each housing segment
% u
pta
ke
Economics Physical fit Soft factors
1
2
3
Annual replacements in one segment
Customer familiarity/trust
Government commitment
Market Push
Installer attitude
Customer awareness
Customer
appeal

161
Experts in heat and distributed energy
Forecast for annual sales of heating appliances: FLANDERS
-
20.000
40.000
60.000
80.000
100.000
120.000
140.000
160.000
180.000
200.000
2014 2015 2016 2017 2018 2019 2020 2021 2022 2023 2024 2025 2026 2027 2028 2029 2030
Annual sale
s o
f heating a
pplia
nces
Annual sales of heating appliances by appliance type in Flanders
Other
Electric
Oil boilers
Lower carbon gas appliances
Gas boilers
Gas boilers
‘Lower carbon’ gas appliances
Installed base of boilers today:
~30% non-condensing
~70% condensing

162
Experts in heat and distributed energy
Forecast for annual sales of heating appliances: FLANDERS
-
20.000
40.000
60.000
80.000
100.000
120.000
140.000
160.000
180.000
200.000
2014 2015 2016 2017 2018 2019 2020 2021 2022 2023 2024 2025 2026 2027 2028 2029 2030
An
nu
al sa
les
Annual sales of heating appliances in Flanders
Biomass
GSHP
ASHP
Electric storage heater
Hybrid heat pump oil boiler
Oil boiler plus solar
Oil boiler standard efficiency
Oil boiler high efficiency
Fuel cell
Micro-CHP engine
Gas heat pump
Hybrid heat pump gas boiler
Gas boiler plus solar
Gas boiler standard efficiency
Gas boiler high efficiency

163
Experts in heat and distributed energy
0
500.000
1.000.000
1.500.000
2.000.000
2.500.000
3.000.000
3.500.000
2014 2015 2016 2017 2018 2019 2020 2021 2022 2023 2024 2025 2026 2027 2028 2029 2030
Insta
lled b
ase o
f heating a
pplia
nces
Evolution of the installed base of heating appliances in Flanders
Biomass
GSHP
ASHP
Electric storage heater
Hybrid heat pump oil boiler
Oil boiler plus solar
Oil boiler standard efficiency
Oil boiler high efficiency
Fuel cell
Micro-CHP engine
Gas heat pump
Hybrid heat pump gas boiler
Gas boiler plus solar
Gas boiler standard efficiency
Gas boiler high efficiency
Forecast for installed base of heating appliances: FLANDERS
The installed base of
gas appliances grows
to ~2 million by 2030

164
Experts in heat and distributed energy
Forecast for annual sales of heating appliances: WALLONIA
-
10.000
20.000
30.000
40.000
50.000
60.000
70.000
80.000
2014 2015 2016 2017 2018 2019 2020 2021 2022 2023 2024 2025 2026 2027 2028 2029 2030
Annual sale
s o
f heating a
pplia
nces
Annual sales of heating appliances by appliance type in Wallonia
Other
Electric
Oil boilers
Lower carbon gas appliances
Gas boilers
Gas boilers
‘Lower carbon’ gas appliances
ASHPs
Installed base of boilers today:
~50% non-condensing
~50% condensing

165
Experts in heat and distributed energy
Forecast for annual sales of heating appliances: BRUSSELS
-
5.000
10.000
15.000
20.000
25.000
30.000
2014 2015 2016 2017 2018 2019 2020 2021 2022 2023 2024 2025 2026 2027 2028 2029 2030
Annual sale
s o
f heating a
pplia
nces
Annual sales of heating appliances by appliance type in Brussels
Other
Electric
Oil boilers
Lower carbon gas appliances
Gas boilersGas boilers
‘Lower carbon’ gas appliances
Installed base of boilers today:
~55% non-condensing
~45% condensing

166
Experts in heat and distributed energy
Similar trend across Europe… a big shift towards low carbon
-
2.500.000
5.000.000
2013 2015 2020 2025
An
nu
al sa
les a
cro
ss f
ive
m
ark
ets
Gas boiler Oil boiler Electric heating Other
Gas boiler only 22%,
Oil boiler 44%
Electric 36%
Lower carbon
solutions 290%
One of our scenarios for the heating market across 5 markets

167
Experts in heat and distributed energy
Agenda
About Delta-ee
Scope of the study for ARGB
What will drive a change in heating appliance uptake?
Forecasted sales of heating appliances in Belgium
What does this mean for gas demand? What could influence this?
Conclusions

168
Experts in heat and distributed energy
Annual gas demand evolution to 2030
-
5.000
10.000
15.000
20.000
25.000
30.000
35.000
40.000
45.000
50.000
2014 2015 2016 2017 2018 2019 2020 2021 2022 2023 2024 2025 2026 2027 2028 2029 2030
An
nu
al g
as d
em
an
d (
GW
h)
Evolution of annual gas demand in the residential sector in Belgium
Brussels
Wallonia
Flanders
Region Annual gas demand – today Annual gas demand – 2030 % reduction in gas volume by 2030
Flanders 30,640 GWh 27,780 GWh 9 – 10%
Wallonia 11,660 GWh 10,180 GWh 12 – 13%
Brussels 5,100 GWh 4,440 GWh 13%
Annual gas
demand falls by
10.5% in Belgium
by 2030.

169
Experts in heat and distributed energy
Key levers affecting gas demand: FLANDERS
Key ‘lever’ Changes considered in the sensitivity analysis Overall impact of ‘lever’
on gas demand
Insulation of existing dwellings 1. No insulation of existing buildings occurs.
2. Acceleration in the insulation rate of existing dwellings occurs.
WEAK
WEAK
Energy prices 3. Electricity price increases more quickly post 2025.
4. Gas price increases more quickly from 2016.
5. Heat pump electricity tariff has been removed.
WEAK
MODEST
WEAK
Electric heat pump uptake
(‘Electrification of heat’)
6. Fully installed price of ASHPs & hybrids falls more quickly.
7. Heat pump electricity tariff becomes more attractive from 2017.
8. Both of the above occurs.
STRONG
MODEST
STRONG
Lower carbon gas appliance
uptake
9. Fully installed price of the lower carbon gas technologies falls more quickly. WEAK
Building regulations 10. Building regulations for new build dwellings are also applied to existing stock from
2020.
VERY STRONG
Economic outlook 11. A weakening of the economic outlook means customers are less willing to invest in
lower carbon appliances.
WEAK
FL
AN
DE
RS

170
Experts in heat and distributed energy
Impact of key ‘levers’ on future gas demand
0
5.000
10.000
15.000
20.000
25.000
30.000
35.000
40.000
45.000
50.000
2013Annual
gasdemand
Referenceforecast
Noinsulation
No HP*tariff
Low costlower
carbongas
Higherelectricity
price
Economicoutlook
weakens
Increasedinsulation
CheaperHP* tariff
Highergas price
Low costHPs*
Low costHPs* &cheaperHP* tariff
Buildingregs onexisitingdwellings
Annual gas demand in 2030
An
nu
al g
as d
em
an
d (
GW
h)
Variations in our annual gas demand forecast in Belgium under different sensitivities
Lower gas
demand
Higher gas
demand
Some levers will slow the rate of
reduction in gas demand to 2030
Some levers, if
influenced strongly,
could see gas demand
falling by 30% by 2030

171
Experts in heat and distributed energy
Agenda
About Delta-ee
Scope of the study for ARGB
What will drive a change in heating appliance uptake?
Forecasted sales of heating appliances in Belgium
What does this mean for gas demand? What could influence this?
Conclusions
Gas boilers dominate the heating market today
Many new options are becoming available to
customers – electric heat pumps, gas heat pumps,
hybrids, micro CHP, …
Policy is developing that supports these newer &
more efficient appliances.
Annual gas demand in Belgium could fall by 10%
by 2030… with variations happening across the 3
Belgian regions.
Annual gas demand could fall further if certain
policy ‘levers’ are pulled.

Matthias Maedge
NGVA Europe

Lowering transport emissions – the role of gas in the EU mix
Gasday, Brussels 13 december 2016
Matthias Maedge Secretary General

174
NGVA Europe Board of Directors
N G V A E u r o p e
Strategy on low emission mobility
175
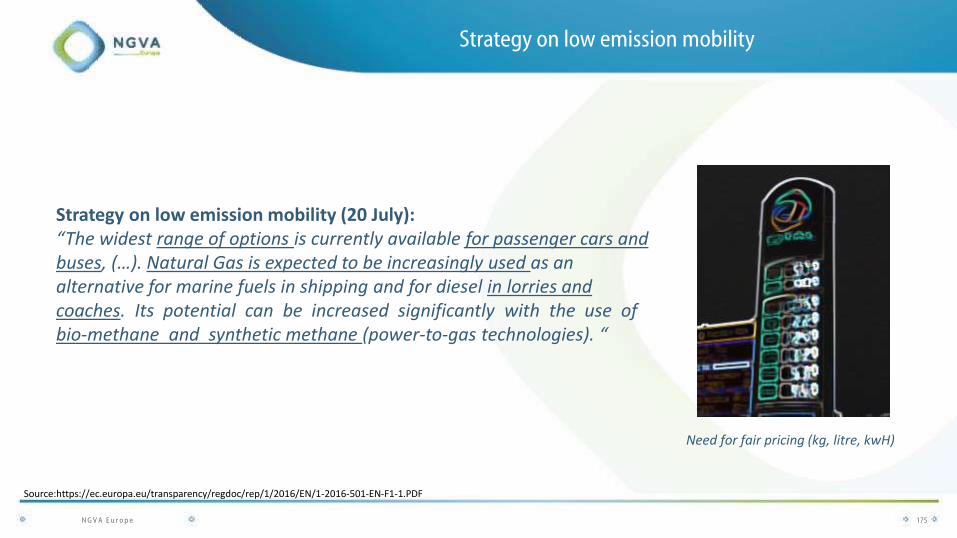
Strategy on low emission mobility (20 July): “The widest range of options is currently available for passenger cars and buses, (…). Natural Gas is expected to be increasingly used as an alternative for marine fuels in shipping and for diesel in lorries and coaches. Its potential can be increased significantly with the use of bio-methane and synthetic methane (power-to-gas technologies). “
Need for fair pricing (kg, litre, kwH)
Source:https://ec.europa.eu/transparency/regdoc/rep/1/2016/EN/1-2016-501-EN-F1-1.PDF
N G V A E u r o p e

Why gas in transport?
176
CNG
LNG
• Reduced GHG emissions (up to 100% when blended with renewable gas) • Up to 95% less particulates and up to 70% Nox vs EUR VI/Euro 6 limits • 50% less noise exposure vs conventional technologies • CNG and LNG offer a solution for all vehicles and transport modes (vehicles and ships)
immediate solution to air quality problem, mitigate climate change & diversify energy supply
…but only 0,5 % EU market share
N G V A E u r o p e

177
Best practice examples
N G V A E u r o p e
- 920 CNG stations - 100,000 NGVs
- Strongest NGV growth - Czech Post runs CNG
- LNG leader in Europe - Garbage trucks 100% on CNG in Madrid
- Biomethane champion - 20% market for CNG buses
- Biggest HDV fleet in Europe, over 4,000 trucks and buses
- 75% of EU NGV market - 3,000 NGV stations by 2025

Fact check electricity, H2 and CNG
Tesla Model S 70D (BEV) Range**: 280 km Fuel costs*: €7,25/100 km CO2 emissions*: 135g CO2/km Price*: €88,200 * based on German energy mix and prices (2016) * * real driving tests
Toyota Mirai (H2) Range: 500 km Fuel costs: €9,50/100 km CO2 emissions: 365g CO2/km Price: €78,600
Mercedes Benz 200c (CNG) Range: 700 km Fuel costs: €5,50/100 km CO2 emissions***: 92g CO2/km Price*: €32,900 * * * incl. 20% biomethahne in CNG mix

179
Synthetic Natural Gas (SNG)
Source: Audi
N G V A E u r o p e

Emissions from Natural Gas in Transport: Analysis 180 Brussels, 12 December
2016
Continuous improvement of CNG engines TT
W C
O2
eq
uiv
alen
t
Time
100
123
1st gen Naturally aspirated
bifuel engines
2nd gen Turbocharged bifuel engines
3rd gen TC DI dedicated
CNG engines
- 15%
- 30%
2000 Current > 2020
CNG
GASOLINE

Real Driving Emissions (RDE)
181 181
European Parliament confirms RDE tests:
• First step, NOx “conformity factor” of 2.1 (110%) for new models by
September 2017 and for new vehicles by 2019.
• Second step, down to a factor of 1.5 (50%), by 2020 for all new
models and by 2021 for all new cars.
• SCR systems on new diesel models will lead to higher costs, several mass market models will not be offered as diesel versions. CNG will play strong
role to bring down
CO2 emissions
N G V A E u r o p e

182
Source: AFGNV, own pictures
N G V A E u r o p e
Operational Planned
UK
32
Spain 20 5
Netherlands 17 9
Sweden 7
Portugal 4 3
Italy 3 4
Poland 2
Belgium 2 1
France 3 4
Norway 1
Germany 2 5
Finland 0 1
Lithuania 0 1
Europe 85 32
LNG Blue Corridor

NGVA Europe 183
Source: LNG Blue Corridor
29,6 liter 26,9 kg
Diesel
735 g CO2/km
22,9 kg 15% less CO2
LNG
623 g CO2/km N G V A E u r o p e
Real live trial (NinaTrans, BE)

Emissions from Natural Gas in Transport: Analysis 184 Brussels, 12 December
2016
CNG-LNG vs diesel trucks
λ = 1 Lean burn HPDI
Euro VI / EPA‘10 o o o
Efficiency - - o
CO2 + +/++ ++
Engine complexity + ++ -
ATS complexity ++ + o
Power/torque + o o
Technological risk o o -
Overall assessment
++ significantly better than Diesel
+ better than Diesel
o similar to Diesel
- worse than Diesel
Conclusion: CNG-LNG always superior vs diesel (most cost-effective solution to reduce emissions)
HDGas
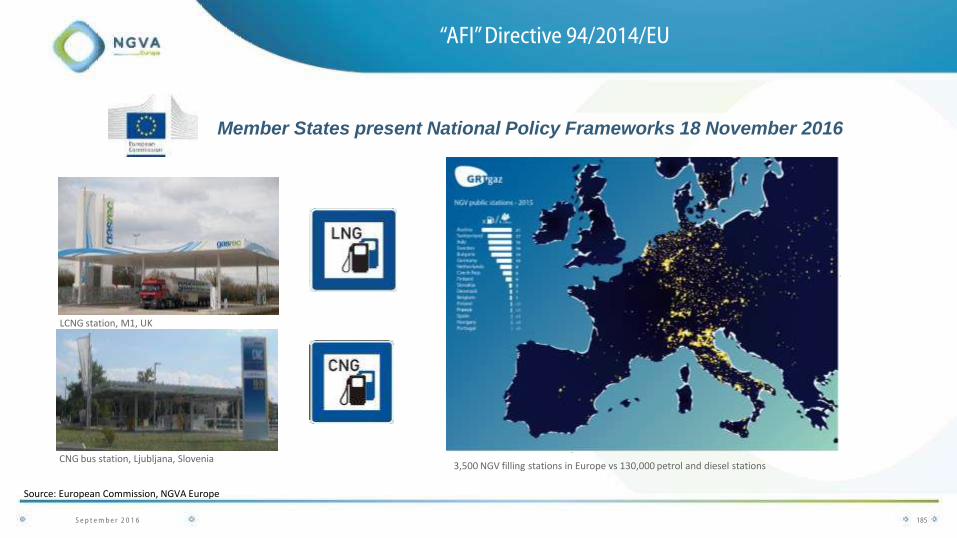
“AFI” Directive 94/2014/EU
185
Member States present National Policy Frameworks 18 November 2016
LCNG station, M1, UK
CNG bus station, Ljubljana, Slovenia
Source: European Commission, NGVA Europe
S e p t e m b e r 2 0 1 6
3,500 NGV filling stations in Europe vs 130,000 petrol and diesel stations

186
Source: AFGNV, own pictures
Clean Fuel station Grenoble (electricity, CNG, H2)
Fleet champion – 2,700 buses and 1,400 trucks
N G V A E u r o p e
Public NGV infrastructure France

Country
Austria
Belgium
Croatia
Czech Republic
Denmark
Sweden
Finland
France
Germany
187
Country
Greece
Hungary
Ireland
Italy
Portugal
Netherlands
Poland
Spain
United Kingdom
Source: NGVA Europe
N G V A E u r o p e
National Policy Frameworks (indicative ambition)

188
Price differential for CNG/ LNG vs petrol & diesel
55%
65%
57%
22%
62%
33%
54%
43%
35%
48%
62%
31%
56%
35%
40%
61%
57%
49%
60%
56%
46% 47%
16%
46%
57%
31%
50% 48%
13%
55%
9%
47%
25%
13%
28%
46%
22%
41%
18% 21%
48%
34% 37%
43%
48%
29% 29%
0%
31%
38%
CNG/LNG price differential vs petrol (%) CNG/LNG price differential vs diesel (%)
N G V A E u r o p e

189
CNG trend Czech Republic CNG trend Belgium
Source: ngva.be, cng4you.cz, Blue Fuel news
S e p t e m b e r 2 0 1 6
NGV forerunners Belgium & Czech Rep.
NGVA Europe 190
Source: NGVA Europe
S e p t e m b e r 2 0 1 6
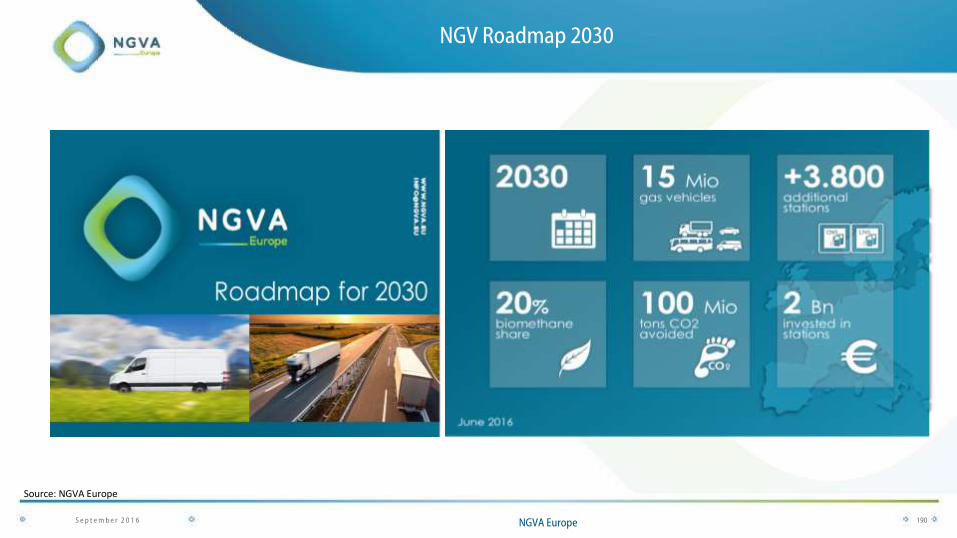
NGV Roadmap 2030

191
0
2.000.000
4.000.000
6.000.000
8.000.000
10.000.000
12.000.000
14.000.000
16.000.000Total number of vehicles
0
2.000.000
4.000.000
6.000.000
8.000.000
10.000.000
12.000.000
14.000.000
16.000.000
Total number of vehicles
Source: NGVA Europe
N G V A E u r o p e
20% of new sales NGV

Maarten Van Houdenhove
Communication & PR Manager at
DATS 24 - Colruyt Group

Our deliberate choice for CNG (and EV’s and FCEV)

Why CNG? ‘Alternatives’ in our corporate
fleet What’s next?

Why CNG?
CNG
'Together, we create sustainable added value
through value-driven craftsmanship
in retail.'


towards zero emission !

H2 next 10 to 15 years
transition

‘Alternatives’ in our corporate fleet

39 8 1 6 952
65
+/- 25% of our corporate fleet is an ‘alternative’
320 pk
H2
1
1

Audi A3 and Seat Leon:
2018/2020
400 pk 1/2
+/- 25% of our corporate fleet is an ‘alternative’

Economic gains
Additional cost NGV: -500€ > +2.000€
-525 € -581 €
Passenger car 15.000 km/y
Company car 25.000 km/y
Van 35.000 km/y
-335 €
detailed calculation on request

What’s next?

today

2017

2018

Spring 2017: green hydrogen integrated next to CNG, diesel and gasoline

do drive along http://dats24.be

Raphaël De Winter
Deputy Director at Fluxys

Fluxys SA
Raphaël De Winter
Head of Corporate Commercial & Innovation
Gasday – 13 December 2016 211
Future Trends

Forecasting the future… a difficult exercise…
“Television won't be able to hold on to any market it captures after the first six months. People will soon get tired of staring at a plywood box every night.”
1946, Darryl F. Zanuck (Twentieth Century-Fox)
Gasday – 13 December 2016 212

Environment & Innovation
KNOWN
KNOWNS
• The energy mix is transforming
• Technology becomes evermore available
• Change is now a global trend driven by innovation and politics
• Digital is a key element
European commitment regarding GHG emissions
• decarbonisation 2030: 40% of 1990
• Renewable energy 2030: 27% of the energy mix in 2030
• Energy efficiency 2030: - 27% from 1990
• New heating and cooling regulation
• Import dependency concerns

Gasday – 13 December 2016
214
Share of renewables in gross final energy consumption
Fig. GTM research 2015
KNOWN
KNOWNS
Increasing share of Renewable Energy
Sources
Renewable technology cost decreases with
innovation and economy of scale
Electric vehicles batteries at 20% cost of 2010
Tesla « Giga-factory » will produce more than the current production volume
214

Power generation:
Existing centralised power is the obvious first step!
Gasday – 13 December 2016 215 Fig. Aurora Energy Research
ACTUALS 2015 utilisation of existing
CCGT fleet is only 36%
Base load utilisation (84%
load factor) could reduce
power emissions by 30%
KNOWN
KNOWNS

216 3 November 2016 For information purpose only
LNG as a fuel: high energy density per kg and per liter KNOWN
KNOWNS

217
GLE + Fluxys
0.2 MTPA LNG is delivered to
industry via trucks
0.5 MTPA LNG is delivered to industry
via small LNG carriers
and trucks
0.8 MTPA is delivered via LNG
trucks to remote gas
grids, which supply
industry, power plants
and households
LNG as a fuel for industry in 2015:
1.5 MTPA
Gasday – 13 December 2016
KNOWN
UNKNOWNS

Small Scale LNG for ships: a rising market
Gasday – 13 December 2016 218
KNOWN
UNKNOWNS

Small Scale LNG: World-wide regulation favours LNG
Gasday – 13 December 2016 219
KNOWN
UNKNOWNS
SECA: Sulphur Emission Control Areas

Small Scale LNG for trucks: a developing market
Gasday – 13 December 2016 220
KNOWN
UNKNOWNS
Gasday – 13 December 2016 221
KNOWN
UNKNOWNS
Heavy Fuel Oil 53 mtpa
LPG 27 mtpa
Gasoline 80 mtpa
Chem feed -naphta 49 mtpa
other 50 mtpa
Refinery losses 29 mtpa
Jet-kerosene 54 mtpa
Diesel ≈ gasoil 270 mtpa
Trucks, vans,
cars 200 mtpa
Ships 7 mtpa
Heating oil
Cars
Industry
Ships
Petrochemical
Air-
planes
Small Scale LNG : A niche market today, BUT WE ARE
FISHING IN A SEA WITH LARGE POTENTIAL
[Fuels Europe.eu]
430 mtpa market
Small-scale LNG: 1.7 mtpa
• Industry: 1.5 mtpa
• Ships: 0.2 mtpa
• Trucks: 0.02 mtpa

Innovation:
Application of new technologies to drive future gas demand
KNOWN
UNKNOWNS
Analyzing the
potential of
large storage
in the energy
system: linking
power, gas and
heat
Higher
efficiency
Improve
technology,
economics and
environmental
impact
Market entry of
gas heat
pumps
Commercial
production and
feed-in of bio
methane
Lift the
potential of gas
mobility
Fig. EOn

Innovation : new business models
Gasday – 13 December 2016 223
KNOWN
UNKNOWNS
II. Energy-as-a-Service: The Next Big As-a-Service Play
I. Digitalisation of the domestic heating installation market
Control in the hands of the energy user.
• How energy is generated and the environmental impact of that generation
• Who owns those energy generation assets (the user or the supplier or a 3rd
party)
• The degree of redundancy and resiliency built into their energy capabilities
• The pricing and payment mechanisms

Internet of things
Gasday – 13 December 2016 224
KNOWN
UNKNOWNS

Conclusion : future energy system is highly complex and will
have implications through all businesses
Gasday – 13 December 2016 225
KNOWN
UNKNOWNS
Fig. EOn
Jan-Jaap Aué
Entrance

EnTranCe: Centre of Expertise Energy
“Why innovation Eco-Systems are important”
Dr. Ir. Jan-jaap Aué, Dean Centre of Expertise Energy
Hanze University of Applied Sciences

Hanze University of Applied Sciences, Groningen
• Established in 1798
• Policy plan 2012-2016 rated “Excellent” by ministery:
extra governmental funding.
• Professionally oriented higher education
• 50+ Bachelor programmes, 20 Master programmes;
• 18 Schools with each their own atmosphere;
• 3 focal areas: Energy, Healthy Ageing, Entrepeneurship
• Partner in the Energy Academy Europe
• 28,500 students choose our university;
10% international, 72 nationalities
Background
Hanze University of Applied Sciences Groningen

Innovation paradox of the Gas Industry
• WorldWide the gas industry has a comfortable seat.
– Gas sells itself and it will always do
– New Fields, so shortage is not to be expected in our lifetime
– New gas products and gas markets will always emerge
– The Gas Industry is convinced that they have a superior product
“The problem is customers do not always understand”
• Times they are a changin’ , No need to innovate ?
If we want things to stay as they are, things will have to change


Speeding up innovations
• Inter-disciplinary • Multi-Level • Co-ownership • Young People • ‘Just do it’ • Show options and
their impact • Stakeholders
Dialogue
Challenges: • Ecosystem
• Open Innovation Chains • Co-Creation • Methods

Starts with
• People in Power
• Bottom up
• More than one dimension
• growing need for innovation, changing circumstances
And means
• Paradigm shift
• Innovation: sharing knowledge
• Education
• balancing of energy-sources
Energy transition @EnTranCe

How? Educational Programs
Facilities Partners
Applied research

Example: Hybrid Energy System

Example: The (possible) role of natural gas in energy transition second life (2030-2050)


Characteristics Gas 2.0
• Sustainable value chains
• Succesfull Innovation Eco System is key
• Sharing knowledge is crucial
• Heading for open innovation
EnTranCe is being developed to facilitate, do you
want to join ?

Thank you for your attention
Gas.be