gc inlets an introduction - jsb · 4 introduction to gc inlets preface “if the column is...
TRANSCRIPT

GC Inlets An Introduction
Agilent Technologies

Notices© Agilent Technologies, Inc. 2005
No part of this manual may be reproduced in any form or by any means (including elec-tronic storage and retrieval or translation into a foreign language) without prior agree-ment and written consent from Agilent Technologies, Inc. as governed by United States and international copyright laws.
Manual Part Number5958-9468
EditionSecond edition, July 2005 First edition, July 1991
Printed in USA
Agilent Technologies, Inc. 2850 Centerville Road
WarrantyThe material contained in this docu-ment is provided “as is,” and is sub-ject to being changed, without notice, in future editions. Further, to the max-imum extent permitted by applicable law, Agilent disclaims all warranties, either express or implied, with regard to this manual and any information contained herein, including but not limited to the implied warranties of merchantability and fitness for a par-ticular purpose. Agilent shall not be liable for errors or for incidental or consequential damages in connec-tion with the furnishing, use, or per-formance of this document or of any information contained herein. Should Agilent and the user have a separate written agreement with warranty terms covering the material in this document that conflict with these terms, the warranty terms in the sep-arate agreement shall control.
Safety Notices
CAUTION
A CAUTION notice denotes a haz-ard. It calls attention to an operat-ing procedure, practice, or the like that, if not correctly performed or adhered to, could result in damage to the product or loss of important data. Do not proceed beyond a CAUTION notice until the indicated conditions are fully understood and met.
WARNING
A WARNING notice denotes a hazard. It calls attention to an operating procedure, practice, or the like that, if not correctly per-formed or adhered to, could result in personal injury or death. Do not proceed beyond a WARNING notice until the indicated condi-tions are fully understood and met.
Wilmington, DE 19808-1610 USA
Introduction to GC Inlets

Acknowledgements
Introduction to GC I
I would like to acknowledge the efforts of several colleagues and cohorts who went to considerable lengths to beat me into literary fluency. Key among these is Beverly Bruns, technical editor, who—after developing the outline for this book and spending an untold number of hours editing, including trying to limit the size of my sentences (some of which exceeded the bounds of most paragraphs)—finally succeeded in getting her point across; however, this was not until Chapter 13 was in the works, at which point my retention of any new information was relegated to short-term memory (which accounts for this sentence, I am sure) and which will probably have to be relearned at the time of my next writing effort, but only after this acknowledgement, which she has vowed not to edit, has been completed.
My thanks to Cindy Haigh, Fred Reese, Charlotte Mastin, and the rest of the Publications Department for their contributions to making this a readable text. Special thanks go to Pat Sandra and Dale Snyder for input on technical precision accuracy.
Matthew Klee
nlets 3

Preface
4
“If the column is described as the heart of chromatography, then sample introduction may, with some justification, be referred to as the Achilles heel.”* This sentiment reflects the reality of gas chromatography (GC): inlets and other sampling devices are often the quality-limiting components of gas chromatography.
Over the past few years, the accuracy and precision of sample introduction have been greatly improved by advances in inlet and sampling technology. Improvements in the capabilities of inlets, such as temperature programming, coupled with addition of new techniques, such as cool on-column injection and headspace sampling, have expanded the range of samples that can be analyzed by gas chromatography and have improved the quality of results.
Certainly, the developments of GC sample introduction have kept pace with the developments in capillary columns, detectors, and automation. Every hurdle that is surmounted in sample introduction points to weaknesses in column and detector technology; these are improved and point to further weaknesses in sample introduction, and so on. Each iteration leads to a better chromatographic system and a better tool for solving analytical problems.
Recent column and liner developments allow the use of packed column inlets with wide-bore capillary columns, yielding faster, higher resolution analyses.
Advances in cool on-column inlets have helped to solve many of the problems associated with vaporizing inlets. With cool on-column inlets, sample degradation and discrimination have been virtually eliminated.
Programmed-temperature inlets permit tailoring of inlet conditions to the sample and analysis needs.
Auxiliary sample introduction devices (valves, purge and trap samplers, thermal desorbers, pyrolyzers, and headspace auto samplers) have also expanded the types of samples and matrices that can be analyzed by GC.
This introduction to GC inlets is intended to present clearly the individual capabilities, strengths, and weaknesses of the many inlets and auxiliary sample introduction devices currently available.
Matthew S. Klee, Agilent Technologies, Inc., Wilmington, DE Pat Sandra, State University of Ghent, Belgium
* V. Pretorius and W. Bertsch, HRC & CC, 6 (1983) 64
Introduction to GC Inlets

Contents
1 Introduction
2 Types of Inlets
Introduction to GC Inlets
Overview 16
Packed-Column Inlets 17
Capillary-Column Inlets 17
Capillary direct 17Split/Splitless 17Programmed temperature vaporizer (PTV) 18Cool on-column 18
Auxiliary Sampling Devices 18
Valves 18Headspace autosamplers 19Purge and trap automatic samplers 19Thermal desorbers 19Pyrolyzers 19
3 Inlet Selection
Overview 22
Inlet Variables 22
Peak Broadening 24
Focusing Techniques 25
Stationary phase focusing 25Solvent focusing 25Thermal focusing 26
Retention Gap 28
Sample Introduction 29
Cool on-column injection 29
5

6
Flash vaporization 29Fast autoinjection 30Manual injection 31
Septa 34
Column Selection 35
Solute retention 35Phase ratio 35Column efficiency 35Column capacity 36Column temperature 37
Inlet Liners 37
4 Packed-Column Inlets
Overview 40Inlet Design 41
Sample Considerations 44
Inserts/Liners 44
Temperature 44
Flow Rates 45
Troubleshooting 46Decomposition 46Flashback 46Leaks 46
Summary 47
5 Capillary Direct Inlets
Overview 50
Inlet Design 52
Sample Considerations 53
Liners 53
Introduction to GC Inlets

Introduction to GC Inlets
Temperature 54
Flow Rates 54
Troubleshooting 55Flashback 55Band broadening in time 55Band broadening in space 55
Summary 56
6 Split Inlets
Overview 60
Inlet Design 61
Sample Considerations 62
Liners 65
Temperature 67
Flow Rates 67
Troubleshooting 68
Needle discrimination 68Inlet discrimination 68Sample decomposition 69
Summary 70
7 Splitless Inlets
Overview 74
Inlet Design 74
Sample Considerations 76
Liners 78
Temperature 79
Flow Rates 79
Determining Purge Delay Time 80
7

8
Troubleshooting 82
Summary 84
8 Cool On-Column Inlets
Overview 88
Inlet Design 89
Secondary cooling 92
Sample Considerations 92
Retention Gaps 94
Temperature 95
Flow Rates 95
Troubleshooting 96Summary 97
9 Programmed- Temperature Vaporizer (PTV) Inlets
Overview 100
Operating Modes 100
Cold split injection 100Cold splitless injection 101Solvent elimination split/splitless injection 102
Inlet Design 105
Sample Considerations 107
Liners 109
Temperature 109
Flow Rates 110
Troubleshooting 112Summary 113
Introduction to GC Inlets

10 Valves
Introduction to GC Inlets
Overview 118
Valve Types 118
Rotary valves 118Slider valves 118
Valve Design 119
Rotary gas sampling valves 119Rotary liquid sampling valves 120Slider valves 120Valve connection to packed columns 121Valve connection to capillary split inlets 123
Sample Considerations 123
Selecting Sample Loop Volume 124
Temperature 124
Gas valves 125Liquid sampling valves 125Transfer lines 125Columns 125
Flow Rates 125
Troubleshooting 127Peak broadening and tailing 127Baseline shifts 127Variation in peak area and retention time 127
Summary 129
11 Headspace Autosamplers
Overview 132
Design 133
Sample Considerations 137
9

10
Temperature 137
Flow Rates 138
Troubleshooting 140Summary 141
12 Thermal Desorbers
Overview 144
Design 144
Sample Considerations 146
Air sampling 146Volatiles in solids 147Desorption temperature 147Flow rates 147
Troubleshooting 148
Summary 149
13 Purge and Trap Samplers
Overview 152
Design 153
Sample Considerations 154
Temperature 154
Flow Rates 155
Troubleshooting 156Summary 158
14 Analytical Pyrolyzers
Overview 162
Design 164
Resistively heated pyrolyzers 164Curie-Point pyrolyzers 166
Introduction to GC Inlets

Introduction to GC Inlets
Microfurnace pyrolyzers 167
Sample Considerations 168
Temperature 169
Flow Rates 169
Troubleshooting 170Summary 171
A Gas Volumes of Solvents
B Head Pressures for Capillary Columns
C Determining Split Ratio
Calculating Split Ratio 177
Calculating Sample Reaching the Column 179
11

12
Introduction to GC Inlets
GC Inlets An Introduction
1Introduction
Analytical gas chromatography methods involve a series of steps:
• Sample collection (sampling, transport, storage)
• Sample preparation (grinding, extraction, dissolution, derivatization)
• Sample introduction into the chromatographic system
• Chromatographic separation into individual components
• Detection of the components
• Data acquisition and reduction (integration, reporting)
For each step, the analyst must make appropriate choices among accepted procedures and available instrumentation.Improper selection of the gas chromatograph sample introduction system can dramatically limit performance of the chromatography system and, therefore, the ultimate performance of the analytical method.
Because of the great variety of columns and the diversity of samples that can be analyzed with modern gas chromatography, several injection modes are used; no single inlet can satisfy all analytical requirements.
This text provides a simple, concise introduction to the selection and use of gas chromatography sample introduction devices.
13Agilent Technologies

14
1 Introduction
Introduction to GC Inlets

GC Inlets An Introduction
2Types of Inlets
Overview 16
Packed-Column Inlets 17
Capillary-Column Inlets 17
Capillary direct 17
Split/Splitless 17
Programmed temperature vaporizer (PTV) 18
Cool on-column 18
Auxiliary Sampling Devices 18
Valves 18
Headspace autosamplers 19
Purge and trap automatic samplers 19
Thermal desorbers 19
Pyrolyzers 19
15Agilent Technologies

2 Types of Inlets
Overview
16
The main function of gas chromatograph (GC) inlets is to provide accurate, reproducible, and predictable introduction of sample into the column. Usually, the sample is a liquid that is injected into the inlet using a syringe, but samples can also be introduced to the analytical column by auxiliary devices, such as headspace automatic samplers and valves.
Introduction to GC Inlets

Types of Inlets 2
Packed-Column Inlets
Introduction to GC I
Inlets are usually divided into two major categories—packed-column inlets and capillary-column inlets. The most widely used type of GC inlet is one used with packed columns. The packed-column inlet is simple (all flow goes to the column), can protect the column from nonvolatile sample components, and works with metal or glass columns. Packed-column inlets are most frequently used for general analyses.
Capillary-Column Inlets
Types of capillary-column inlets include:
• Capillary Direct (vaporizing)
• Split/Splitless (vaporizing)
• Programmed Temperature Vaporizer (vaporizing)
• Cool On-Column (nonvaporizing)
Capillary direct
Packed-column inlets can be adapted to work with some capillary columns for direct injections. Capillary direct inlets are used with wide-bore capillary columns (id ≥0.5 mm) and are made by substituting a special insert inside a packed-column inlet. They have essentially the same benefits and pitfalls as packed-column direct inlets. Capillary direct inlets are vaporizing inlets and are usually used as a transition between packed column and high-efficiency capillary column analysis.
Split/Splitless
The first type of inlet designed for capillary analysis was the split inlet, which is most commonly available now as a combination inlet for both split and splitless injections. This is a vaporizing inlet which vents most of the sample in the split mode and transfers most of it to the column in the splitless mode. Because it is a vaporizing inlet, it is column protecting but can cause solute discrimination and decomposition. Split injection is used for general analysis, whereas, splitless injection is most frequently used for trace analysis.
nlets 17

2 Types of Inlets
Programmed temperature vaporizer (PTV)
18
The programmed temperature vaporizer (PTV) inlet offers a mixture of injection possibilities, including cool sample introduction, split or splitless modes, sample concentration (solvent elimination mode); and it is column protecting. Due to this flexibility, PTV inlets are good inlets for both general analysis and trace analysis.
Cool on-column
Cool on-column inlets give high accuracy and reproducibility, are sample protecting, have the least solute discrimination among all the inlets, and work by depositing the sample directly into the column. Unlike the other vaporizing or “hot” sample introduction techniques, the sample is not exposed to high temperatures during injection or transfer to the column. Cool on-column inlets are used for the analysis of samples with a wide boiling-point range or those that are thermally sensitive, and for trace analysis.
Auxiliary Sampling Devices
In addition to the inlets just described, there are also sample introduction devices that introduce samples into the chromatographic column when syringe injection is inappropriate (for example, with solid samples):
• Gas and liquid sampling valves
• Headspace autosamplers
• Thermal desorbers
• Purge and trap samplers
• Pyrolyzers
Depending on the sampling device and the GC column used, auxiliary sampling devices can be connected directly to the column or to an existing inlet.
Valves
Valves give very reproducible introduction of fixed volumes of gas or liquid samples and are simple to automate. Valves are frequently used for sampling gases and liquids in moving streams (process and online monitoring).
Introduction to GC Inlets

Types of Inlets 2
Headspace autosamplers
Introduction to GC I
Headspace autosamplers are used to determine volatiles in liquids, solids, or complex matrixes. Headspace autosamplers inject a portion of the gas that is in equilibrium with a sample in a thermostatted, sealed vial. Headspace analysis is used for the analysis of residual solvents, fragrances, and volatile pollutants in soil and water.
Purge and trap automatic samplers
Purge and trap is a combination of dynamic headspace, trapping, and then thermal desorption. Volatile components are continuously purged out of a water sample (dynamic headspace), trapped on an adsorbent, and then desorbed quickly for introduction into the GC (thermal desorption). This is used mainly for analysis of environmental pollutants in water and for analysis of volatiles in beverages.
Thermal desorbers
Thermal desorbers are used in environmental sampling, and are complementary to headspace analysis and analytical pyrolysis. Volatile sample components, which are contained in a solid sample or which have been adsorbed onto a solid adsorbent, are thermally liberated in the sampler in a stream of carrier gas and carried to the column. This technique is used for monitoring hazardous gases in the workplace and for environmental air analysis.
Pyrolyzers
Pyrolyzers are used to thermally cleave nonvolatile samples into volatile fragments that can then be analyzed by gas chromatography. Temperatures in the 500 to 1000 °C range are normally used for the analysis of polymers, fibers, microorganisms, and geological samples.
nlets 19

20
2 Types of Inlets
Introduction to GC Inlets

GC Inlets An Introduction
3Inlet Selection
Overview 22
Inlet Variables 22
Peak Broadening 24
Focusing Techniques 25
Stationary phase focusing 25
Solvent focusing 25
Thermal focusing 26
Retention Gap 28
Sample Introduction 29
Cool on-column injection 29
Flash vaporization 29
Fast autoinjection 30
Manual injection 31
Septa 34
Column Selection 35
Solute retention 35
Phase ratio 35
Column efficiency 35
Column capacity 36
Column temperature 37
Inlet Liners 37
21Agilent Technologies

3 Inlet Selection
Overview
22
Inlets must be selected carefully for each analysis and used to optimal benefit to maximize chromatographic efficiency, analytical accuracy, and the reproducibility of results. Because capillary columns have higher efficiency and lower sample capacity than packed columns, inlet selection and inlet performance are much more vital to obtaining accurate results than they are with packed column systems.
Once an inlet has been selected based on sample, column type, and analysis goals, all inlet variables must be set appropriately to achieve optimal results. It is possible to come close to the optimum mix of inlet conditions before injecting the first sample.
Inlet Variables
The type of analysis to be done and the composition of the sample itself are the primary factors that must be considered when setting or determining the following interrelated variables:
• Injection technique
• Injection volume
• Inlet temperature
• Column selection
• Column temperature
• Liner selection
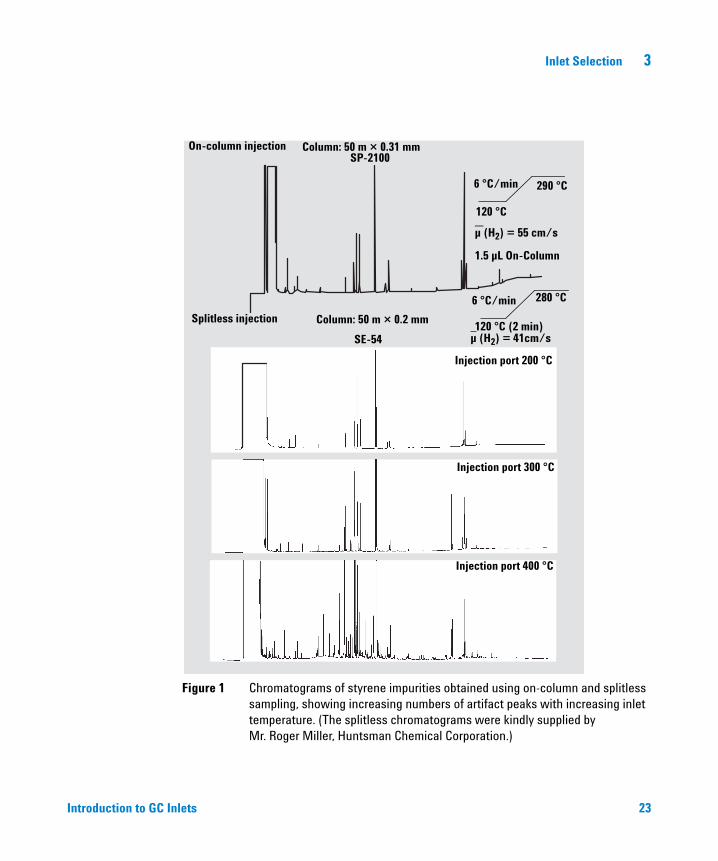
One example of a variable affecting vaporizing inlets is inlet temperature. One of the pitfalls of vaporizing inlets is that they can cause sample degradation. Labile sample components can degrade when exposed to heat or catalytic surfaces. Figure 1 shows chromatograms for on-column (reference) and splitless injections at several inlet temperatures. Higher splitless temperatures result in a higher percentage of degradation and more peaks.
Low inlet temperatures or cool on-column injection, deactivation of the inlet and/or liner, and high split-vent flows are all techniques used to reduce the potential for sample degradation. See Figure 1.
Introduction to GC Inlets
Inlet Selection 3
Introduction to GC I
Figure 1 Chromatograms of styrene impurities obtained using on-column and splitless sampling, showing increasing numbers of artifact peaks with increasing inlet temperature. (The splitless chromatograms were kindly supplied by Mr. Roger Miller, Huntsman Chemical Corporation.)
On-column injection Column: 50 m × 0.31 mmSP-2100
120 °C
6 °C/min 290 °C
µ (H2) = 55 cm/s
1.5 µL On-Column
Splitless injection Column: 50 m × 0.2 mm
SE-54
Injection port 200 °C
120 °C (2 min)
6 °C/min 280 °C
Injection port 300 °C
Injection port 400 °C
µ (H2) = 41cm/s
nlets 23
3 Inlet Selection
Peak Broadening
24
A basic functional requirement of GC inlets is that they introduce the sample into the column as a narrow band having a composition that is identical to the original sample. The inlet should not produce peaks that are wider than the peak width that will result from the column band broadening process. Peak broadening in the column is a function of column efficiency. More efficient columns require narrower initial peak widths. This can be accomplished by using inlets that generate narrow peaks initially, or by using subsequent focusing techniques.
Initial bandwidths are broadened by two mechanisms:
• Band (peak) broadening in time
• Band (peak) broadening in space
Band broadening in time and space are characteristics of particular inlet types and injection techniques. Band broadening in time is caused by the slow transfer of sample vapor from the inlet to the column. The initial peak width is equal to the time it takes for the sample to be transferred to the column.
Band broadening in space is a direct consequence of migration and spreading of liquid sample within the column, either after cool on-column injection of sample into the column or after recondensation of sample in the column (for example, after vaporizing injection such as splitless injection). The condensed liquid, which starts by occupying only a few centimeters of column, becomes too thick to be stable and spreads over a longer length. The carrier gas pushes the plug farther into the column, creating a “flooded zone.” The solute material is spread over the full length of the flooded zone, creating an initial peak width that equals the length of the flooded zone.
When recondensed sample is not compatible with the stationary phase, it beads up in the column (like water on a newly waxed car). The beads then separate and spread out over a longer flooded zone, concentrating solutes unevenly. This increases the length of the flooded zone, creates split peaks, and increases peak widths.
Three focusing techniques are used to narrow peaks broadened by time and space:
• Stationary phase focusing
• Solvent focusing
• Thermal focusing
Introduction to GC Inlets
Inlet Selection 3
Focusing Techniques
Stationary phase focusing
Introduction to GC I
Stationary phase focusing is the most frequently used focusing technique and is possible only in temperature-programmedanalysis. In gas chromatography, retention of solutes is an exponential function of temperature; so, as the initial temperature of the column is lowered, the speed at which solutes travel down the column slows dramatically. As vaporized sample moves from the inlet to the column, it comes in contact with the stationary phase and is trapped in a narrow zone. The lower the temperature, the more effective the focusing.
Solvent focusing
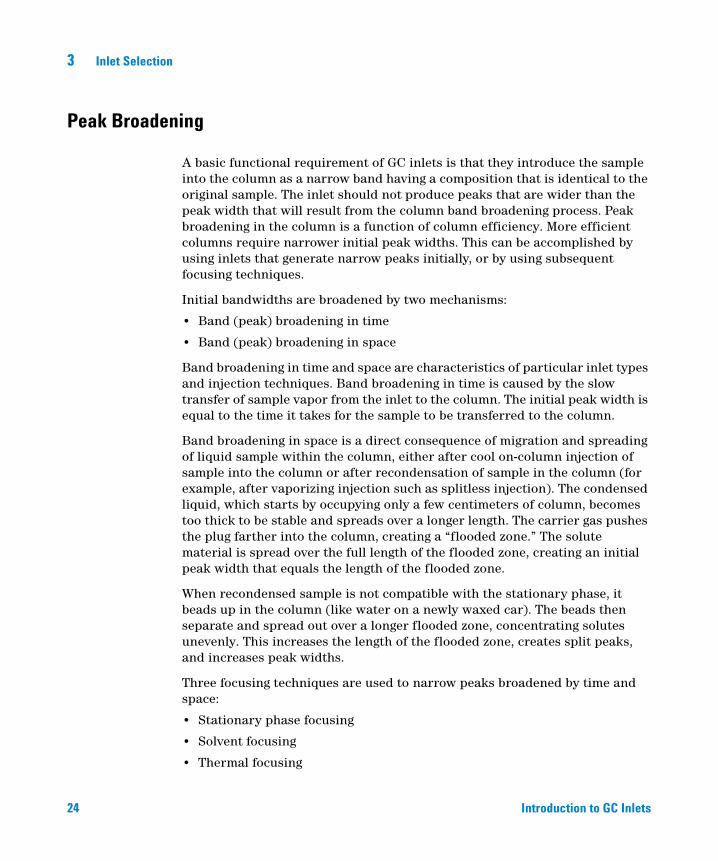
As condensed solvent starts to evaporate, solutes with volatility similar to that of the solvent tend to concentrate and focus on the solvent tail. This solvent focusing, or the “solvent effect,” yields very narrow peaks for these early eluting compounds and is shown in Figure 2.
Figure 2 The solvent effect
High-volatility soluteLow-volatility solute
Needle
Capillary column
Carrier gas Injection
Flooded zone develops
High-volatility solute focused by solvent
nlets 25

26
3 Inlet Selection
Figure 3 compares splitless injections for a sample dissolved in two solvents. No solvent focusing occurs in the first case, because the starting oven temperature is above the boiling point of the solvent hexane. Solvent focusing does occur in the second, when octane is used, because the boiling point of octane is above the initial column temperature. Early peaks on the solvent tail are clearly evident, and the peaks for C11and C12 are considerably sharper.
Figure 3 No solvent on the left due to inappropriate selection of solvent versus starting temperature. Right combination is okay and shows sharpened peaks on the solvent tail and for C11 and C12.
0 10 20 0 10 20
n-hexanebp 68 °C
n-octanebp 125 °C
n-C11 n-C12
n-C11
n-C12
Time, min
OV-101 Glass WCOT columnIsothermal 15 °C2 µL injected100 ng C11 and C12Helium carrier 0.9 atm(0.8 mL/min
Thermal focusing
Thermal focusing is the thermal condensation of gases in a tube or at the head of the column. Peaks narrow as solute volume is reduced during condensation. Solutes will not migrate into the chromatographic system until the temperature is raised and they are vaporized again. Sometimes cryogenic temperatures (cryogenic focusing) are used to focus peaks from inlets or auxiliary sampling devices that generate peaks broadened in time.
Thermal focusing narrows bandwidths effectively only when the column temperature is approximately 150 °C below the boiling points of the solutes. In this sense, thermal focusing does not rely on chromatographic processes. It only requires a surface on which vapors can condense. Thermal focusing in chromatographic columns is often accompanied by stationary phase focusing.
Introduction to GC Inlets

Inlet Selection 3
Introduction to GC I
An example of thermal and stationary phase focusing is shown in Figure 4. The top chromatogram was generated by split injection which, initially, generates very narrow peaks. The bottom chromatogram was generated by splitless injection of the same sample and shows broad initial peaks. Most of the peaks eluting after 100 °C, however, were focused and yielded as peaks just about as narrow as is possible with split injection.
Figure 4 Thermal and stationary-phase focusing during a temperature-programmed run. Split yields narrow peaks from injection; splitless has focused peaks after ~100 °C. (Reproduced from K. Grob, Jr., Classical Split and Splitless Injection in Capillary GC, Huthig, Heidelburg (1986), with permission.)
175°C 150°C 125°C 100°C 75°C 50°C
Column: 13 m × 0.30 mm × 0.5 µm SE-52Temperature: 50 °C↑ 5 °C/min↑ 180 °C
A. Split injection
B. Splitless injection (pentane solvent , no solvent recondensation)
nlets 27
3 Inlet Selection
Retention Gap
28
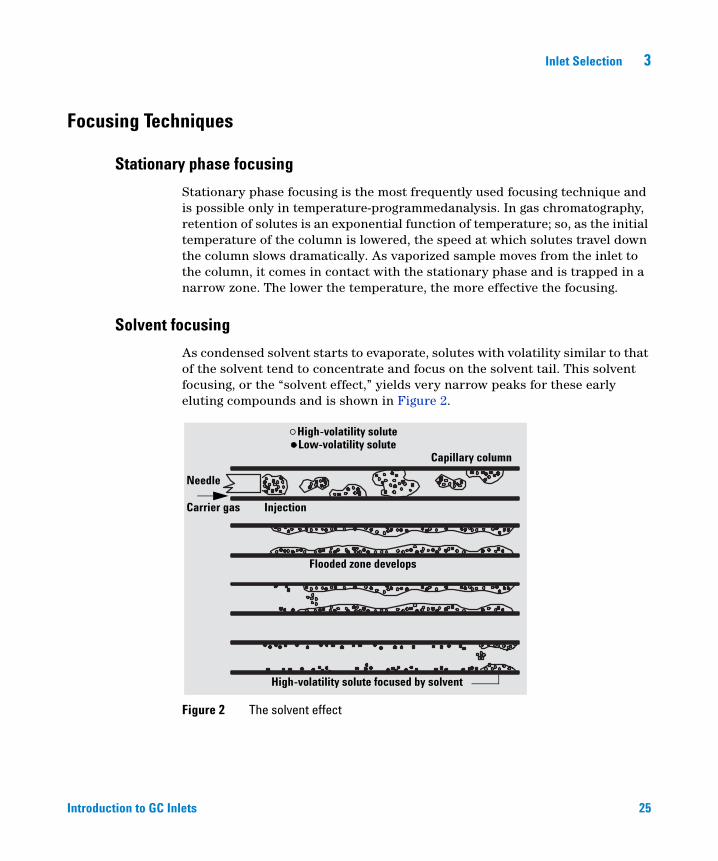
A retention gap is an empty piece of column that accommodates the condensed sample but does not retain solvent or solutes once they have been vaporized. The primary function of retention gaps is to reduce the length of the flooded zone created whenever solvent is condensed in the column. An equally important function is to protect the column from nonvolatile sample components, especially when doing cool on-column injection.
When peak broadening and splitting phenomena are observed, a retention gap is usually required. As the solvent evaporates, all solutes move freely at carrier gas velocity to the head of the analytical column where they are focused by the solvent effect and/or the stationary phase (Figure 5). In general, peaks with k´ <5 are focused by the solvent effect, while solutes with k´ >5 are focused by the stationary phase.
The retention gap must be deactivated properly to minimize the length of the initial flooded zone and the possibility of peak tailing or degradation. Nonpolar solvents (for example, hexane, isooctane) require nonpolar deactivated retention gaps. Polar solvents (for example, methanol, water) require polar deactivated retention gaps.
Figure 5 Visual representation of on-column injection into a retention gap. Both solvent and stationary phase focusing occur.
Solvent evaporates
Volatiles focused by solvent
High-boilers focused by stationary phase
Stationary phase
Introduction to GC Inlets

Inlet Selection 3
Sample Introduction
Introduction to GC I
Inlets introduce liquid samples to the column in one of two ways—either by vaporization in the inlet or by cool on-column injection. All capillary inlets are vaporizing, including on-column direct injection, except for cool on-column injection which deposits condensed sample directly into the column.
Cool on-column injection
Cool on-column injection is a technique in which the liquid sample is introduced directly into the column. The inlet is constantly cooled by cold air and/or circulated water. Cool on-column injection systems include programmed heating that permits complete independence of the inlet temperature and the column oven temperature.
Cool on-column injection has extended capillary GC use to many applications that were initially not practical. Advantages of cool on-column injection include:
• Elimination of needle discrimination
• Reduction of sample decomposition
• High analytical precision
Problems associated with cool on-column injection include band broadening in space, column overload, and column contamination.
Flash vaporization
The classic means of introducing a liquid sample into a chromatographic system is to inject it by syringe into a hot inlet where it is quickly vaporized (flash vaporization). Benefits of flash vaporization include: transfer of the liquid sample to a gas so separation can proceed, quick transfer of sample into the column, and protection of the column from nonvolatile sample components which stay behind in the inlet.
Problems associated with vaporizing inlets include band broadening in time and space (splitless injection), needle discrimination, inlet discrimination, and sample decomposition. Soon after a syringe needle passes through the septum of a hot inlet, the needle heats up to the same temperature as the inlet. The sample immediately starts to evaporate inside the needle, selectively
nlets 29

30
3 Inlet Selection
concentrating higher boiling solutes and initiating decomposition reactions. These problems are exacerbated by high inlet temperatures and low-boiling solvents.
Fast autoinjection
Fast autoinjectors reduce the dwell time of the syringe needle in the inlet, thereby preventing significant needle heating and associated needle discrimination problems. Figure 6 shows the relationship of discrimination and needle dwell time. Fast autoinjection with dwell times under 500 ms is clearly more accurate than the slower techniques. What could be considered a “fast” manual injection takes 1 to 2 seconds, which still is not fast enough to prevent needle discrimination.
Figure 6 Effect of needle dwell time on needle discrimination
1.3
1.2
1.1
1.0
0.9
0.8
0.710 14 16 20 25 30 32 34 36 40
Column: 10 m × 0.53 mm, HP-1Temperature: 60 °C (2 min)↑ 15 °C/min↑ 310 °C (5 min)Packed port injection at 350 °C, HP5880A GC7673A Automatic InjectorSample: 1 µL, C10 to C40 in n-hexane
250 ms500 ms
1000 ms
2000 ms
C-number of n-alkanes
Are
a ra
tio C
x/C
20
Introduction to GC Inlets

Inlet Selection 3
Introduction to GC I
Other benefits of fast autoinjection include increased precision and accuracy. Problems associated with fast autoinjection include higher pressure pulse accompanying injection and an increased risk of flashback.
Manual injection
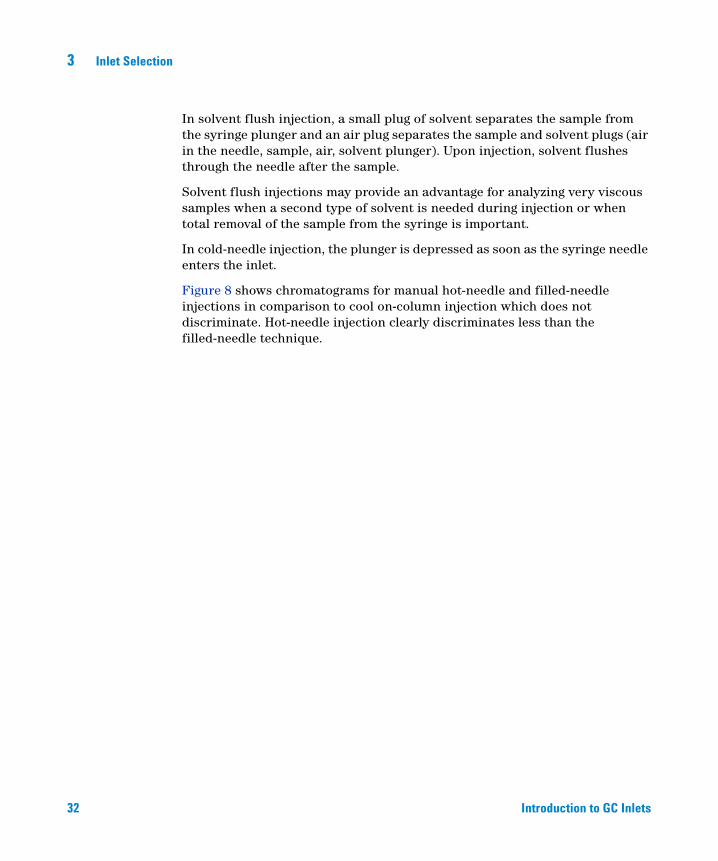
The most reproducible manual injection technique is the “hot needle” technique, but it still has significant discrimination compared with fast autoinjection. Figure 7 shows discrimination with the manual hot-needle technique in comparison to other injection techniques.
With manual hot-needle injection, the sample is taken into the syringe barrel without leaving an air plug between sample and plunger. The sample is withdrawn so that there is air in the needle (“filled needle” includes sample in the needle). After insertion into the injection zone, the needle is allowed to heat up for 3 to 5 s. This is sufficient for the needle to reach the inlet temperature. The sample is then injected rapidly by pushing down the plunger and the needle is withdrawn quickly from the inlet within 1 s.
Figure 7 Discrimination of alkanes with different injection techniques. (Reprinted from K. Grob, Jr. and H. P. Neukom, J HRC&CC, 2 (1979) 15–21, with permission.)
25
50
75
100
9 12 16 20 26 32 36 40 44
Peak area normalizedto C9 (= 100)
C-number of n-alkanes
On-column
Hot needle
Cold needleSolvent flush
Filled needle
Injection 1 µL corresponding to the needlevolume, 1: 15 split injection at 350 °C; peakareas normalized to the nonane peak.
For comparison: on-column injectionwithout significant discrimination
nlets 31
32
3 Inlet Selection
In solvent flush injection, a small plug of solvent separates the sample from the syringe plunger and an air plug separates the sample and solvent plugs (air in the needle, sample, air, solvent plunger). Upon injection, solvent flushes through the needle after the sample.
Solvent flush injections may provide an advantage for analyzing very viscous samples when a second type of solvent is needed during injection or when total removal of the sample from the syringe is important.
In cold-needle injection, the plunger is depressed as soon as the syringe needle enters the inlet.
Figure 8 shows chromatograms for manual hot-needle and filled-needle injections in comparison to cool on-column injection which does not discriminate. Hot-needle injection clearly discriminates less than the filled-needle technique.
Introduction to GC Inlets

Inlet Selection 3
Introduction to GC I
Figure 8 Discrimination of n-alkanes depending on the injection technique. (Reproduced from K. Grob and G.Grob, J HRC&CC, 2 (1979) 109–117, with permission.)
Filled needle
Hot needle
Cold on-column injection
Needle discrimination for filled needle and hot needle split injectionscompared to cool on-column.
Sample: n-alkane in n-hexane, split ratio 1:40
nlets 33

3 Inlet Selection
Septa
34
Another key component of sample introduction is the inlet septum. All columns must have carrier gas head pressure to establish flow through the column. Septa maintain the leak -free seal and exclude air from the inlet. They come in many different sizes and are made from many different types of material specific to inlet type and analysis needs.
Septa are usually available according to their recommended upper temperature limits. Lower temperature septa are usually softer, they seal better, and they can withstand more punctures (injections) than their high-temperature counterparts. If used above their recommended temperatures, however, they can leak or decompose. This causes sample losses, lower column flow, and ghosting.
Ghosting can also occur when sample components adsorb to the inlet side of the septum. Septum contaminants are then released randomly throughout the chromatographic run or on injection of subsequent samples, creating artifact peaks unrelated to sample (ghost peaks).
Ghosting can be reduced or eliminated using several combined techniques including:
• An inlet with septum purge which continuously sweeps the exposed surface of the septum to remove potential contaminants
• Septa which are designed to minimize ghosting (preconditioned, low bleed)
• Sample volumes and solvents consistent with inlet volume, temperature, and injection technique
Smaller sample sizes, lower inlet temperatures, and larger liners all decrease the potential for ghosting. High temperature silicones, alternate polymer materials, and layered composites of different polymers extend septum utility to temperatures up to 350 °C. Prepunched septa prevent coring during injection, and can withstand many times as many injections as standard septa before leaking.
Introduction to GC Inlets

Inlet Selection 3
Column Selection
Solute retention
Introduction to GC I
When solutes (liquids or gases) are retained at the head of the analytical column, stationary phase focusing occurs. This is a chromatographic process that is a function of column temperature, stationary phase type, and phase ratio.
Phase ratio
The phase ratio reflects the ability of a column to retain solutes. Once vaporized, sample transfers to the head of the column where it is retained by the stationary phase. As the phase ratio increases, the column retention power, sample capacity, and capability to focus solutes at the inlet decrease.
Knowing the phase ratio is useful for selecting a column that will sufficiently focus solutes; a column with a lower phase ratio is needed to retain and focus lower boiling compounds. A column with a phase ratio that is too low will have excessive run times and lower efficiency. A general-purpose capillary column has a phase ratio of approximately 250.
The equation used to determine phase ratio (β) of WCOT (wall-coated open tubular) columns is:
(1)β r2df------- radius of the column
2 stationary phase film thickness×-----------------------------------------------------------------------------------= =
Column efficiency
The type of inlet and how it will be used is limited to a certain degree by the efficiency of the column to be used. The more efficient the column, the narrower the peaks from the inlet must be, or the more effective the focusing techniques. Improperly selected inlet conditions can virtually eliminate the inherent benefits of using high-resolution columns.
nlets 35

3 Inlet Selection
Column capacity
36
GC columns can be overloaded with sample, depending on the inlet used, the amount of sample injected, and the concentration of the sample. Stationary phases are solvents for sample solutes, and each solute has a finite solubility in the stationary phase.
When the solubility limit of a sample component in the stationary phase is approached, solutes begin to overload the column. This causes chromatographic peaks to broaden and the efficiency of the column to decrease (Figure 9). The first few peaks in Figure 9 have not overloaded the column significantly at 10 ng; however, at 60 ng, the later eluting compounds have overloaded the column and produce wider, distorted peaks.
Small diameter columns with thin stationary-phase films have low capacity and restrict the maximum sample amounts which should reach each column. Low capacity columns require either split injection techniques, small injection volumes, or sample dilution prior to injection.
Figure 9 Early peaks are not overloaded and are symmetrical. Late-eluting peaks overload the column at 60 ng and are skewed.
7.0E+6
6.0E+6
5.0E+6
4.0E+6
3.0E+6
2.0E+6
1.0E+6
6 8 10 12 14 16 18 20
Abu
ndan
ce
10 ng
60 ng
Column: 25 m × 0.20 mm × 0.11 mL Ultra-2Injection: 1 µL splitless
Introduction to GC Inlets

Inlet Selection 3
Column temperature
Introduction to GC I
The initial column temperature is critical to solute focusing. Stationary phase focusing is exponentially related to column temperature. Solvent focusing requires low enough column temperature for condensation of the solvent quickly at the head of the column. This is usually 20 °C or more below the boiling point of the solvent. Thermal focusing requires even lower initial temperatures (150 °C below the boiling point of the solute, for example).
Inlet Liners
Inlet liners also have a direct effect on analysis results. When dirty samples are analyzed routinely, replaceable inlet liners (usually glass) are used to simplify cleaning of the inlet and to minimize influence of contaminants on subsequent analyses. These liners are replaced or cleaned as soon as any loss in performance is noted.
Figure 10 shows the effect a dirty liner can have on peak shape. Distorted peaks, lower sample recovery (sensitivity), change in response factor, and lower reproducibility are all characteristic of a contaminated liner.
Figure 10 Influence of a dirty vaporizing inlet (200 °C). (Reproduced from K. Grob and G. Grob, J HRC&CC, 2 (1979) 109–117, with permission.)
Temperature-programmed analysisSplit injectionCompounds: 10—n-decane, ol—1-octanol, p—2,6-dimethylphenol,
A. Dirty inlet liner B. Clean inlet liner
S—ethylhexanoic acid, A—2,6-dimethylaniline,12—n-dodecane
10
10
ol
ol
P
P
S S
A
A
12
12
nlets 37

38
3 Inlet Selection
The volume, type, and activity of the liner are the most important variables to consider when selecting a liner. Each type of inlet works best with a certain type of liner. Splitless inlets may require straight liners with no packing, whereas PTV inlets require baffled liners or packed liners to retain liquid sample during cold sample introduction.
The volume of the liner must be at least as large as the volume of the sample, or flashback and sample loss will occur. Appendix A can be used to estimate the minimum liner volume based on the gas volume of several common solvents under typical inlet conditions.
Most liners require deactivation to minimize degradation of labile solutes. Deactivation usually involves a silanization procedure and may only be effective for a few days, after which the liner must be cleaned and redeactivated.
Introduction to GC Inlets

GC Inlets An Introduction
4Packed-Column Inlets
Overview 40
Inlet Design 41
Sample Considerations 44
Inserts/Liners 44
Temperature 44
Flow Rates 45
Troubleshooting 46
Decomposition 46
Flashback 46
Leaks 46
Summary 47
39Agilent Technologies

4 Packed-Column Inlets
Overview
40
Packed-column direct inlets are very popular. Packed-column analysis is frequently done when high efficiency separations are not needed or when gases are analyzed by gas-solid chromatography. Packed column inlets are simple in both design and use. Few parameters need to be set, and all carrier gas flow flushes through the inlet into the column in the standard configuration.
Packed-column inlets are vaporizing, so they can protect columns from nonvolatile sample components; however, these inlets can also cause sample degradation, needle discrimination, and adsorption of polar solutes.
Introduction to GC Inlets

Packed-Column Inlets 4
Inlet Design
Introduction to GC I
Figure 11 shows the typical configuration of a packed-column inlet with a glass column installed, as well as several inserts that substitute for the column head in the inlet. Carrier gas enters the side of the inlet body and heats to inlet temperature as it flows up between the inlet body and the outside of the column (or insert). Once at the top, hot carrier gas moves down to carry vaporized sample to the column. Different inserts are used depending on the type of column used.
nlets 41

42
4 Packed-Column Inlets
Figures 12 and 13 are flow diagrams for standard packed-column inlets and septum-purged packed column inlets. Typical packed-column inlets use mass-flow controllers (differential-pressure controllers) to maintain a constant flow rate of carrier gas through the column during temperature
Figure 11 Typical packed column inlet with glass column installed for on-column direct injection
SeptumSeptum retainer nut
Heater block
Carrier gas
Glass wool plug
Graphite ferrule
1/4-inch packedglass column
Glassliner
Glassliner
Glassliner
Wide-borecapillaryinsert
1/8-inchSS
1/4-inchcolumninsertcolumn
insert
Introduction to GC Inlets

Packed-Column Inlets 4
Introduction to GC I
programming. A pressure gauge is usually provided to monitor pressure at the head of the column. This is helpful for diagnosing leaks and column degradation (increasing restriction). Septum purges reduce ghosting and baseline perturbations caused by flashback and septum bleed.
Figure 12 Flow diagram, packed column inlet
Figure 13 Flow diagram, septum-purged packed column inlet
Carriergas
Trap(s)
Externalplumbing
Internalplumbing
Mass flowcontroller
Pressuregauge
Packed columninlet
Electronicflow sensor(optional)
Column
Todetector
Carriergas
Trap(s)
Externalplumbing
Internalplumbing
Mass flowcontroller
Pressuregauge
Electronicflow sensor(optional)
Column
Todetector
Septumpurge vent
Fixedrestrictor
Out In
Forwardpressureregulator
Septum purgedpacked columninlet
nlets 43

4 Packed-Column Inlets
Sample Considerations
44
Thermally labile compounds are most effectively analyzed by intracolumn (on-column) direct injection with glass packed columns. Packing should be removed from the inlet section so that activity in the hot inlet is minimized, and the packing material does not get contaminated quickly.
On-column direct injection is done by inserting the column (usually glass) through the inlet (as in Figure 11) so the syringe enters the empty head of the column during injection.
With this technique, the sample is exposed to reduced activity in the heated zone, and the problems associated with hot injection into stainless steel inlets are eliminated. Nonvolatile sample components are more apt to affect subsequent analyses with on-column direct injection, since they can reach the column packing and degrade chromatographic performance.
Dirty samples are most effectively introduced by extra-column injection into inserts with replaceable glass liners.
Inserts/Liners
Variables used to select packed-column inserts include column dimensions and sample composition. Figure 11 shows 1/8-inch and 1/4-inch od inserts, which are inserted into the inlet in place of the 1/4-inch od glass column. These inserts are stainless steel and are available with or without glass liners. The column attaches to the base of the insert.
Inserts with glass liners are always preferred because they shield the sample from the hot stainless steel surface which increases the adsorption of polar sample components and promotes sample decomposition. Replaceable glass liners also facilitate cleaning of the inlet if separation efficiency starts to degrade because of inlet contamination.
Temperature
The inlet temperature should be at or above the boiling point of the solvent, or major solutes of interest, to guarantee that they are efficiently transported from the inlet zone into the column. Problems caused by excessive inlet
Introduction to GC Inlets
Packed-Column Inlets 4
Introduction to GC I
temperatures include sample degradation, flashback, and increased syringe discrimination. If degradation is possible, the inlet should be set at the lowest temperature that does not broaden the peak or reduce the area of the highest-boiling component.
If later eluting peaks are distorted or show less area than expected, the sample is probably not evaporating completely or fast enough. Increase the inlet temperature by 50 degrees and try again. If there is evidence of sample degradation or flashback, then the inlet temperature could be too high. Reduce the inlet temperature by 50 degrees and try again.
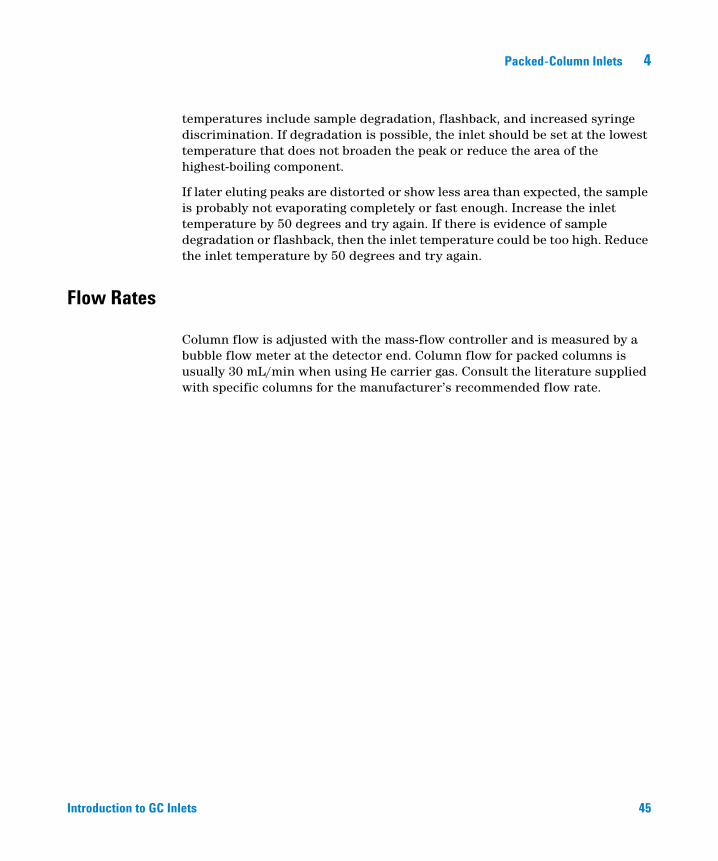
Flow Rates
Column flow is adjusted with the mass-flow controller and is measured by a bubble flow meter at the detector end. Column flow for packed columns is usually 30 mL/min when using He carrier gas. Consult the literature supplied with specific columns for the manufacturer’s recommended flow rate.
nlets 45

4 Packed-Column Inlets
Troubleshooting
46
Most problems with packed-column inlets involve sample decomposition, flashback, or leaks.
Decomposition
Since packed-column inlets are active, especially if glass liners are not used, polar sample components will often tail or degrade in the inlet. Sample decomposition caused by the inlet is easily diagnosed; the decomposition products will have peaks at the same retention times as standards for the decomposition product.
When inlet-caused decomposition is suspected, try intracolumn direct injection, deactivated glass liners, or lower inlet temperatures, and remove any column packing in the inlet zone.
The inherent activity of packed-column inlets is somewhat mediated by the fact that they usually have low internal volume. When this is coupled with the relatively fast flow rates used with packed columns, the residence time of sample in the inlet is short and decomposition is reduced in comparison to the decomposition that occurs with some capillary inlets (for example, splitless inlets).
Flashback
The negative side of low inlet volume, however, means that excessively large sample injections will easily exceed the capacity of the liner and will flash back into gas supply lines and onto the septum. This can cause several maladies, including ghost peaks, sample losses, irreproducible peak areas, and decomposition.
Leaks
Since packed-column inlets are usually flow controlled, septum and column leaks will have a direct impact on retention times and peak areas. Sample can be lost through the leak holes, and air can diffuse back into the inlet to cause column degradation. Change the septum on a regular basis and check column connections at the first sign of problems. To prevent stationary phase decomposition, make sure that the oven and inlet are at room temperature when not in use and when changing the septum.
Introduction to GC Inlets

Packed-Column Inlets 4
Summary
Introduction to GC I
Table 1 Standard packed column inlet procedures and practicesParameters Selection/Setting Rationale
Inlet temperature BP of solvent +50 °C Ensures flash vaporization
BP of major solute(s) Use for neat samples
Insert type 1/8-inch stainless steel For stainless steel columns only
1/4-inch stainless steel Inserts permit use of columns up to 1/4-inch od
Liner Glass Use to lower activity (replaceable)
Initial column temperature Temperature programming Sharpen peaks and reduce runtime
Column type 1/8-inch packed stainless Will not break
1/4-inch packed glass Better for polar or labile compounds
Carrier gas flow 20 to 40 mL/min Use with nitrogen carrier gas
30 to 60 mL/min Use with helium or hydrogen
nlets 47

48
4 Packed-Column Inlets
Table 2 Factors affecting packed column inlet accuracy and reproducibility
Symptom Possible cause Solution
Sample degradation Temperature too high Reduce inlet temperature
Inlet dirty Replace the liner
Contact with metal Use glass columns and liners
Residence time too high Increase the flow rate
Compounds too labile Derivatize sampleUse cool on-column injection
Peak tailing Activity in inlet Use glass linerDeactivate the linerUse glass columns
Temperature too low Increase inlet temperature
System voids Check column installation
Area irreproducibility Injection technique Use autoinjectorUse hot-needle injection
Septum leak Replace the septum
Sample flashback Reduce injection volumeUse larger volume linerLower inlet temperatureIncrease the flow rate
Retention time irreproducibility Septum leak Replace the septum
Broad peaks Insufficient focusing Lower the initial oven temperature
Carrier flow too high or too low Measure the flow and correct rate
Ghost peaks rolling baseline Sample flashback Reduce injection volumeUse larger volume liner
Septum degradation Lower the inlet temperatureChange to high-temperature septumReplace septumReduce inlet temperature
Introduction to GC Inlets

GC Inlets An Introduction
5Capillary Direct Inlets
Overview 50
Inlet Design 52
Liners 53
Sample Considerations 53
Temperature 54
Flow Rates 54
Troubleshooting 55
Flashback 55
Band broadening in time 55
Band broadening in space 55
Summary 56
49Agilent Technologies

5 Capillary Direct Inlets
Overview
50
Packed-column inlets can be modified easily for use with wide-bore capillary columns by using appropriate inserts. Packed column inlets were designed for use with packed columns at flow rates around 30 mL/min; however, wide-bore capillary columns can be used successfully at packed-column flow rates with only minor modification of the inlet. Figure 14 compares wide- and narrow-bore capillary column analyses of an essential oil and demonstrates the capabilities of a wide-bore column and direct injection.
Introduction to GC Inlets

Capillary Direct Inlets 5
Introduction to GC I
Capillary-column direct injection is often confused or even identified with “on-column” injection. Just like packed-column direct injection, capillary direct injection relies on flash vaporization, so sample decomposition and
Figure 14 Chromatogram of the oxygenated fraction of the essential oil of hops on a narrow-bore (A) and wide-bore (B) capillary.
A
B
Column: 25 m × 0.25 mm idPEG-HMWTemperature-programmed70 to 190 °C at 2 °C/minInjection in an all-glassinlet splitter (1:20)
Column: 50 m × 0.5 mm idPEG-HMWTemperature-programmed70 to 190 °C at 2 °C/minDirect injection
nlets 51

52
5 Capillary Direct Inlets
needle discrimination can still be a problem. Cool on-column injection is done with the inlet temperature below the boiling point of the solvent, so these problems are prevented. The injection speed (fast-slow), the boiling point and nature of the solvent, the injector temperature, and the oven temperature must be carefully selected for each application that uses direct injection.
Inlet Design
A capillary direct inlet is basically a packed column inlet with a different type of liner or inlet base (column connection), as is shown in Figure 15. All carrier gas flow travels to the capillary direct column just as it does for packed columns.
Figure 15 Glass liners for capillary direct injection
A B C D
A Open liner with septum purgeB Tapered liner with expansion volumeC Liner oriented for direct injectionD Liner oriented for on-column direct injection
A Pressure regulation onlyB, C, D Pressure or flow regulation
Introduction to GC Inlets

Capillary Direct Inlets 5
Sample Considerations
Introduction to GC I
Analyses of labile samples are usually more accurate using intracolumn injection, since the sample is exposed to a less active surface in the column than it would be in an inlet liner. For intracolumn direct injection into capillary columns, keep injection volumes as small as possible (<1 µL) and flow rates as high as possible to prevent overloading the column and to reduce flashback. Injecting slowly (over 1 to 2 s) will also reduce flashback, decrease peak widths, and improve resolution of early eluting components.
Dirty samples are best analyzed using extra-column injection so that nonvolatile sample components are trapped in the liner and do not degrade column performance. Again, low injection volumes and slow injection speeds are preferred, especially if early eluting peaks are of interest.
Liners
For capillary column direct injection, the volume of the liner should be at least as large as the volume of sample vapors resulting from injection. Refer to Appendix A to find the approximate gas volume per microliter injected sample.
In addition to the inlet and liner design shown in Figure 11 on page 42, several others are shown in Figure 15 on page 52. The configuration with a straight glass liner (Figure 11 and Figure 15A) is effective for many analyses at high column flow rates, but it is susceptible to sample flashback caused by low internal volume.
Figure 15B shows a larger volume liner (in comparison to straight glass) with a taper at the top and the bottom, which is also used for extra-column direct injections. The tapers may help contain sample vapors and reduce flashback.
Some liners can be used for either extra- or intracolumn injections, depending on the orientation of the liner in the inlet. When the liner is installed so the large expansion volume is at the top of the inlet and the column is installed at the bottom (Figure 15C), extra-column injection will occur. When the liner is flipped so the column extends to the top of the inlet (Figure 15D) and is sealed against the taper, the syringe needle enters into the hot column during injection and intracolumn (or on-column) direct injection occurs.
nlets 53

5 Capillary Direct Inlets
Temperature
54
For direct injections, the inlet temperature must be high enough to flash-vaporize the sample. With most samples this is dependent on the boiling point of the solvent and/or major components and should be set 10 to 25 °C above those values. Excessively high inlet temperatures should be avoided due to the possibility of flashback and sample degradation.
Flow Rates
Since capillary direct inlets are usually converted packed-column inlets, column flow rate is usually set by adjusting a mass-flow controller; however, packed column flow controllers are usually configured to stabilize at flow rates greater than 15 mL/min, which is near the upper usable flow range for wide-bore capillary columns. When flow rates closer to 3.5 mL/min (optimum for 0.53-mm capillary columns) are required, a flow restrictor (manufacturer supplied) should be added to the GC pneumatics to increase flow stability.
Introduction to GC Inlets

Capillary Direct Inlets 5
Troubleshooting
Introduction to GC I
Most of the problems associated with capillary-direct inlets relate to flashback and band broadening in time or space.
Flashback
Capillary-direct inlet liners can easily be overloaded by: injecting excessive sample volumes (>1 µL), using solvents with low boiling points, injecting too quickly, using excessive inlet temperatures, and/or using low column flow rates. Flashback is more of a problem with capillary direct inlets than it is with packed columns, since large-bore capillary columns are usually used at lower flow rates to maximize separation efficiency.
Flashback is of greatest concern when doing intracolumn injections, because the volume of the analytical column is even smaller than that of the inlet liners.
Band broadening in time
Band broadening in time can be a problem because of the lower flow rates with capillary columns compared with packed columns. Stationary phase focusing can help to narrow broad peaks, provided the initial oven temperature is low enough.
Solvent focusing can be used with capillary direct injection and yields an analysis similar to that of splitless injection without an inlet purge.
Band broadening in space
When using solvent focusing, column temperature must be set low enough to ensure recondensation of the solvent (more than 25 °C below the boiling point of the solvent). Band broadening in space can be a problem, however, if injection volumes are too large and/or if the solvent is not compatible with the stationary phase. Should broad or split peaks be observed in this mode, a retention gap could be used to help recombine and focus the peaks.
nlets 55

5 Capillary Direct Inlets
Summary
56
Table 3 Standard capillary direct procedures and practicedParameter Typical choice Rationale
Inlet temperature BP of solvent + 50 °C Ensure flash vaporization
BP of major solute(s) Use for neat samples
Liner type Straight glass Readily available, inert
Expanded volume Decreased flashback problems
Tapered end(s) Flexible: down for extra-column injection, up for intra-column injection
Initial column temperature Initially low, then program up for analysis Focuses solutes and reduces runtime
BP of solvent –25 °C Use for solvent focusing
Column type >0.5 mm id Can use column flow rate and injection parameters close to those for packed columns
Carrier gas flow 10 to 20 mL/min Produces results similar to packed columns
3 to 10 mL/min Provides higher efficiency and better separation
Introduction to GC Inlets

Capillary Direct Inlets 5
Introduction to GC I
Table 4 Factors affecting capillary direct inlet accuracy and reproducibility
Symptom Possible cause Solution
Low peak areas, lost peaks, generation of new peaks
Temperature too high Reduce inlet temperature by 50 °C, reevaluate
Dirty inlet Clean or replace liner
Contact with metal Use glass columns and liners
Residence time too high Increase flow rate
Compounds too labile Derivitize sample, use cool on-column injection
Peak tailing Activity in inlet Use glass liner and columnDeactivate liner
Improper carrier flow Check and correct
Temperature too low Increase temperature by 50 °C, retry
Temperature too high Reduce temperature by 50 °C, retry
System voids Check column installation
Area irreproducibility Poor injection technique Use autoinjectorUse hot needle slow injection
Septum leak Replace septum
Sample flashback Inject lessUse larger volume linerReduce temperatureIncrease flow rate
Retention time irreproducibility Septum leak Replace septum
Broad peaks Incorrect column flow Correct column flow
Insufficient focusing Lower oven starting temperature
Ghost peaks rolling baseline Sample flashback Inject lessUse larger volume linerReduce inlet temperature
Septum degradation Change septum typeReplace septumReduce inlet temperature
nlets 57

58
5 Capillary Direct Inlets
Introduction to GC Inlets

GC Inlets An Introduction
6Split Inlets
Overview 60
Inlet Design 61
Sample Considerations 62
Liners 65
Temperature 67
Flow Rates 67
Troubleshooting 68
Needle discrimination 68
Inlet discrimination 68
Sample decomposition 69
Summary 70
59Agilent Technologies

6 Split Inlets
Overview
60
The combined “split/splitless” inlet is the most popular inlet for capillary column gas chromatography. Because it can be used in either split or splitless mode, it provides a very effective combination that can cover most analysis requirements. Split and splitless injection techniques have been studied exhaustively, and several deficiencies have been identified for each. Since the proper use of inlet temperature, liner type, oven temperature, injection technique, and purge events are different for these two techniques, they will be discussed separately.
The split inlet was the first sample introduction system developed for capillary gas chromatography. In split injection, liquid sample is introduced with a syringe into the hot inlet where it is vaporized immediately. A small fraction of the resulting vapor enters the column while the major portion is vented out an open fitting on the GC. Split injection guarantees narrow inlet bands because there is a high gas flow through the inlet, and sample is removed quickly.
Introduction to GC Inlets

Split Inlets 6
Inlet Design
Introduction to GC I
A schematic diagram of a split inlet is shown in Figure 16.
Figure 16 Flow diagram for a split inlet. This example shows a 1:100 split ratio (100 mL/min split flow, 1 mL/min column flow).
Total flowcontroller
Septum purgeflow controller
Purge vent
Split vent
Purge controlsolenoid Column head
pressure control(back-pressureregulator)
104 mL/min 3 mL/min septum purge flow 3 mL/min
100 mL/min
100
mL/
min
1 mL/min
101
mL/
min
To detector
Carrier gas, controlled by a pressure regulator or a combination of a flow controller and a back -pressure regulator, enters the injector at the top. The flow is divided into three streams:
• One stream of carrier gas purges the septum to minimize ghosting and is controlled by a needle valve or flow controller.
• The other stream of carrier gas enters the vaporization chamber, which has a glass or quartz liner, and is mixed with vaporized sample.
• The mixed stream is split between the column inlet and the split vent.
nlets 61

62
6 Split Inlets
In Figure 16, a back -pressure regulator controls the column head pressure and, therefore, the flow through the column. The remainder of the total flow is vented out the split vent.
Sample Considerations
Split injection is required for samples that:
• Are very volatile
• Cannot be diluted for analysis (for example, solvents)
• Are gases that cannot be focused, or that have long injection times (valve injections)
• Have important minor peaks eluting directly before the solvent peak (as in solvent analysis).
Split injection is also good for screening samples of which little is known or for those that have widely differing concentrations, since the split ratio can be adjusted easily.
Figure 17 shows a chromatogram of impurities in styrene. Split injection was used to guarantee a narrow peak for the main component, styrene. If the analysis had been run using splitless injection, the early eluting peaks would have been obscured by the much broader styrene peak.
Introduction to GC Inlets

Split Inlets 6
Introduction to GC I
Split inlets are also a good choice for dirty samples, provided the liner is cleaned or replaced at the onset of loss of performance (see Figure 10 on page 37). This is because much of the sample is vented out of the split vent during the vaporization process; and, over time, high-boiling sample residues slowly leach out the split vent rather than onto the column.
Very complex samples are often analyzed with ultra-high resolution capillary columns. These columns require very narrow initial peak widths and, therefore, split injection. Figure 18 shows an ultra-high resolution chromatogram of diesel oil obtained using a 100-µm capillary column and split injection with a 300:1 split ratio.
Figure 17 Analysis of styrene monomer. (Courtesy of R. Miller, Huntsman Chemical Corporation.)
1
2
3
4
5
6
78
9
10
11
12
13
14
Column: 20 m × 0.25 mm, FSOT, DB Wax, d = 1 µmTemperature: 40 °C↑ 2 °C/min↑ 150 °CCarrier gas: Hydrogen, 35 cm/sSample: 1 µL styrene monomer, split 1:170Peaks:
1. ethylbenzene2. p-xylene3. m-xylene4. cumene5. o-xylene
6. n-propylbenzene 7. p-ethyltoluene8. m-ethyltoluene9. o-ethyltoluene
10. α-methylstyrene
11. p+m-methylstyrene12. phenylacetylene13. trans -β-methylstyrene14. benzalaldehyde
styrene
nlets 63

64
6 Split Inlets
Figure 18 Ultra-high resolution (n = 106) analysis of diesel oil
0 60 120 180 240 300 360 420
780 840 900 960 1020 1080 1140
420 480 540 600 660 720 780
11200
Column: 100 m × 100 µm, OV-1, d 0.2 µmTemperature: 60 °C, 0.1 °C/min, 185 °CCarrier gas: Hydrogen, 10 atmSplit ratio 300:1, 0.1 µL injected
C9 C10 C11 C12
C13 C14
C15 C16
C17C18
C19
C18
C20C21
C22 C23
norp
rist
aan
pris
taan
phyt
aan
phyt
aan
Introduction to GC Inlets

Split Inlets 6
Liners
Introduction to GC I
Figure 19 shows several types of liners that can be used with split inlets. Frits, cups, baffles, glass beads, and glass wool are used to trap particulates and nonvolatile sample components. These also increase reproducibility and decrease discrimination by ensuring complete vaporization of the sample before it reaches the column entrance.
Glass wool is the most active of the liner packings; it increases the possibility of adsorption and decomposition of the sample, so it should not be used when analyzing polar or degradable samples. For these samples, deactivated glass beads or baffled liners usually give better results.
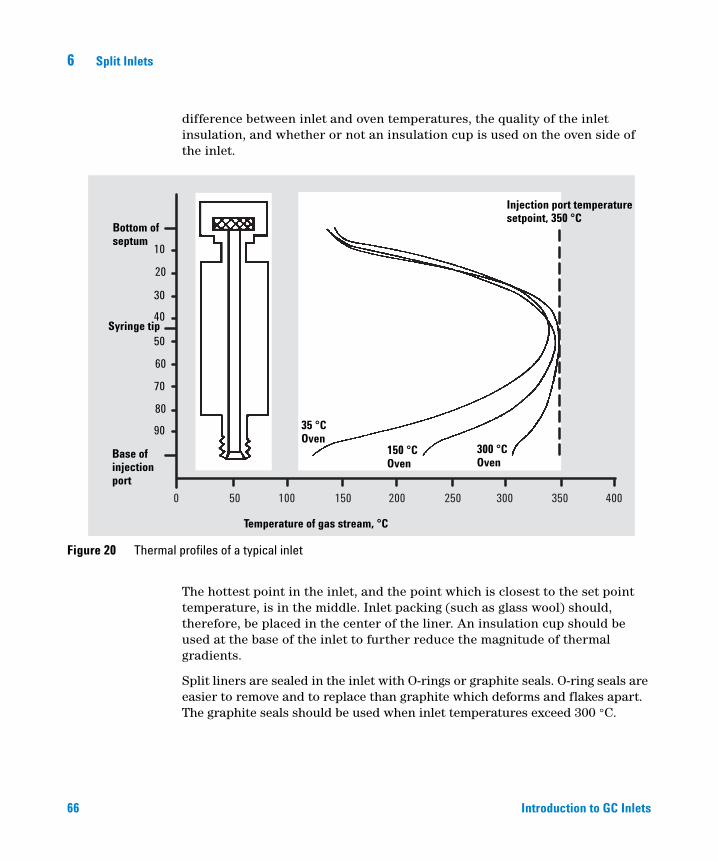
Correct placement of packing in the liner is critical for optimal results. There is always a temperature gradient down the length of the inlet, as shown in Figure 20. The magnitude of the gradient depends on inlet design, the
Figure 19 Several liners used with split inlets
nlets 65
66
6 Split Inlets
difference between inlet and oven temperatures, the quality of the inlet insulation, and whether or not an insulation cup is used on the oven side of the inlet.
Figure 20 Thermal profiles of a typical inlet
10
20
30
40
60
70
80
90
50
0 50 100 150 200 250 350300 400
Syringe tip
Base ofinjectionport
Temperature of gas stream, °C
Bottom ofseptum
Injection port temperaturesetpoint, 350 °C
35 °COven
150 °COven
300 °COven
The hottest point in the inlet, and the point which is closest to the set point temperature, is in the middle. Inlet packing (such as glass wool) should, therefore, be placed in the center of the liner. An insulation cup should be used at the base of the inlet to further reduce the magnitude of thermal gradients.
Split liners are sealed in the inlet with O-rings or graphite seals. O-ring seals are easier to remove and to replace than graphite which deforms and flakes apart. The graphite seals should be used when inlet temperatures exceed 300 °C.
Introduction to GC Inlets

Split Inlets 6
Temperature
Introduction to GC I
Complete evaporation of the sample is necessary to minimize discrimination and to maximize the accuracy and reproducibility of split injections. For a new sample, inlet temperature should be set close to but above the expected boiling point of the highest-boiling major sample component (often the solvent). This temperature can then be adjusted up or down in response to analysis deficiencies such as decomposition and discrimination.
Flow Rates
After the column head pressure is set by adjusting the pressure controller (see appendix B for starting points), the split and septum purge flows should be set and measured. The septum purge is usually set between 3 and 5 mL/min and is measured by a flow meter at the purge vent fitting on the GC. The split flow is also measured at a union on the outside of the GC and is adjusted according to desired split ratio. The split ratio is the ratio of the column flow relative to the split vent flow.
Split ratio = column flow (mL/min) : split vent flow (mL/min)
For the most accurate calculation of split ratio, both values must be corrected to the same temperature and pressure (see appendix C). For most analyses, split ratios in the range of 1:50 to 1:500 should be used for conventional capillary columns (0.20 to 0.32 mm id). Lower split ratios (1:5 to 1:15) can be used with dilute samples, gaseous samples, and wide-bore columns, but the resulting decrease in total inlet flow yields wider initial peak widths. Therefore, focusing may be required for acceptable results.
Very high split ratios are used with high-speed capillary gas chromatography (using 50 to 100-µm id columns), where split ratios in excess of 1:1000 may be required to minimize initial peak widths. High split ratios are also used with low capacity columns and with very concentrated samples. Inlet discrimination is increased at high split ratios, whereas sample decomposition is reduced.
nlets 67

6 Split Inlets
Troubleshooting
68
Split inlets are spared from most band-broadening phenomena, since narrow peaks are generated as part of the splitting process. Therefore, any peak broadening or tailing observed with split injection is usually due to improper column installation, low split flow, or low inlet temperature. If you suspect that the inlet temperature may be too low, increase it by 50 °C and compare the results to the lower temperature analysis. Repeat if results are positive until no further improvement is seen.
A majority of the problems encountered with split inlets are related to discrimination and decomposition. Both analytical accuracy and reproducibility decrease with the increases in discrimination and decomposition. Split inlets suffer from both needle discrimination and inlet discrimination.
Needle discrimination
Loss of high-boiling solutes or a decrease in areas of late eluters relative to early eluters are symptoms of needle discrimination.
Needle discrimination can be reduced by using fast autoinjectors, by minimizing inlet temperature, by injecting larger volumes, and/or by using a solvent with higher boiling point.
Inlet discrimination
The different mechanisms that can cause split inlet discrimination are:
• Different diffusion speeds of the sample components from point of injection to column inlet.
• Incomplete evaporation of some sample components.
Inlet discrimination of high boilers can be reduced by increasing inlet temperature, by injecting less sample (the reverse of the actions taken to counteract needle discrimination), by switching liner type, or by lowering the split ratio (thereby increasing residence time in the inlet).
Inlet discrimination with low boilers occurs less frequently than discrimination with high boilers and can be more difficult to isolate. Loss of low boilers is influenced by liner design, flashback, sample loss via inlet leaks,
Introduction to GC Inlets

Split Inlets 6
Introduction to GC I
and the pressure pulse following injection. Lower inlet temperature, lower injection volume, and a change to higherboiling solvent may help reduce the problem.
Sample decomposition
Sample decomposition is indicated by lost or misshapen peaks, and/or by the generation of new ones. Decomposition is exacerbated by high inlet temperature, long residence time of the sample in the inlet (low split flow, large sample sizes), and activity in the inlet (high surface-area liners, active/unsilanized packings).
nlets 69

6 Split Inlets
Summary
70
Table 5 Standard split procedures and practicesParameter Typical choice Rationale
Inlet temperature BP of last eluting compound Ensures flash vaporizationMinimize inlet discrimination
Inlet liner Large volume, deactivated Minimize flashback and degradation
Inlet packing Silanized glass wool Retains nonvolatiles, stops flow of droplets
Glass beads or frit Less active than wool
None Least active
Injection volume 0.5 to 3 µL liquid Split easily adjusted
0.1 to 10 mL gas Split adjusted accordingly
Injection technique Fast autoinjection Less needle discrimination
Hot needle fast manual injection Reproducible discrimination
Split ratio 50:1 to 500:1 Depends on sample and injection volume
Initial column temperature Not critical Narrow initial peaks
Septum purge 3 to 5 mL/min Minimizes ghosting
Introduction to GC Inlets

Split Inlets 6
Introduction to GC I
Table 6 Factors affecting split accuracy and reproducibility
Symptom Possible cause Solution
Low peaks, lost peaks, generation of new peaks
Inlet too hot Reduce temperature 50 °C
Dirty inlet Clean or replace liner
Contact with metal Use glass columns and liners
Compounds too labile Derivitize sampleUse cool on-column injection
Active packing Remove packing
Active liner Change liner typeDeactivate liner
Residence time too long Increase split flowIncrease column flow
Low area for late eluters Solvent BP too low Use higher-boiling solvent
Needle discrimination Inlet temperature too low Increase inlet temperature 50 °C
Needle dwell time too long Use fast autoinjector
Inlet discrimination Inlet temperature too high Decrease by 50 °C
Inlet dwell time too short Reduce split flow
No glass wool or in wrong place Center in the liner
Split flow too high Decrease split flow
Injection volume too big Decrease injection volume
Wide peaks Split flow too low Increase split flow
Adsorption in inlet Change linerRemove packingIncrease temperature
Column overloaded Increase the split flow
Area irreproducibility Fluctuation in split ratio Check the flow controllersCheck for leaks (septum, liner, column)
nlets 71

6 Split Inlets
Sample flashback Reduce the sample sizeReduce the inlet temperatureUse a larger liner
Variable injection volume Check the injection techniqueUse an autoinjector
Decomposition Remove liner packingDecrease liner temperature
Retention time reproducibility Overload Increase split ratioInject less
Column degradation Cut 0.5 m of inlet endReplace column
Table 6 Factors affecting split accuracy and reproducibility (continued)
Symptom Possible cause Solution
72
Introduction to GC Inlets
GC Inlets An Introduction
7Splitless Inlets
Overview 74
Inlet Design 74
Sample Considerations 76
Liners 78
Temperature 79
Flow Rates 79
Determining Purge Delay Time 80
Troubleshooting 82
Summary 84
For splitless injection, a conventional split injector is operated in a nonsplitting mode by closing the split valve during injection. The sample is flash-vaporized in the liner, and sample vapors are carried into the column by the carrier gas where they are recondensed at temperatures below the boiling point of the solvent. After most of the sample has been transferred into the column, vapors remaining in the liner are cleared by opening the split vent which remains open for the duration of the run.
73Agilent Technologies

7 Splitless Inlets
Overview
74
The most important benefit of splitless injection is that a majority of the injected sample is introduced into the column; this results in much higher sensitivity than that achieved using split injection.
Splitless injection is routinely used in areas such as environmental analysis, pesticide monitoring of foods, and drug screening. In these applications, sample preparation requirements are significant, and it is not always possible or economically justifiable to clean up a sample extensively. So column protection becomes as important as sensitivity. Also, samples with trace quantities of important solutes that elute on the solvent tail may be focused by the solvent to yield more sensitive analyses.
Inlet Design
A schematic for a purged splitless inlet is shown in Figure 21. The pneumatic configuration is usually the same as that for split injectors. The septum is continuously purged (approximately 3 mL/min) to maintain a contamination-free system, while a flow of 30 to 60 mL/min is vented via the split vent.
Prior to injection, a solenoid valve is activated so that the split flow is either closed off or diverted to the top of the inlet with the septum purge flow (top diagram). After injection of liquid sample into the liner, the sample vaporizes and is transferred into the column very slowly (at the column flow rate). After 30 to 80 seconds, the solenoid valve is deactivated, and residual vapors in the inlet are vented to waste via the purge vent (or split vent) as shown in the bottom diagram of Figure 21.
Introduction to GC Inlets

Splitless Inlets 7
Introduction to GC I
Figure 21 Flow diagram for splitless inlet during injection (PURGE OFF) and after sample transfer (PURGE ON).
PURGE OFF
PURGE ON
Total flowcontrol
Septum purgecontrol
Purge vent
Split vent
Column headpressurecontrol
Purge controlsolenoid
54 mL/min 53 mL/min 3 mL/min 3 mL/min
50 mL/min purge flow 50 mL/min
1 m
L/m
in
1 mL/min
1 mL/min
To detector
Total flowcontrol
Septum purgecontrol
Purge vent
Split vent
Column headpressurecontrol
3 mL/min
50 mL/min
Purge controlsolenoid
54 mL/min 3 mL/min septum purge flow
50 mL/min inlet purge flow
51 mL/m
in
50 m
L/m
in
1 mL/min
1 mL/min
To detector
nlets 75
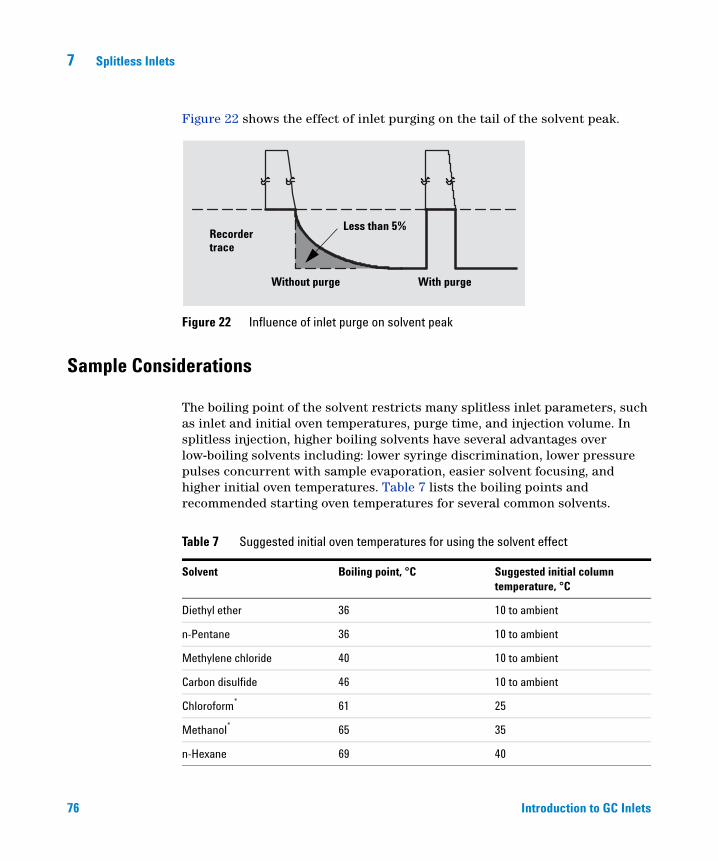
76
7 Splitless Inlets
Figure 22 shows the effect of inlet purging on the tail of the solvent peak.
Figure 22 Influence of inlet purge on solvent peak
Recordertrace
Less than 5%
Without purge With purge
Sample Considerations
The boiling point of the solvent restricts many splitless inlet parameters, such as inlet and initial oven temperatures, purge time, and injection volume. In splitless injection, higher boiling solvents have several advantages over low-boiling solvents including: lower syringe discrimination, lower pressure pulses concurrent with sample evaporation, easier solvent focusing, and higher initial oven temperatures. Table 7 lists the boiling points and recommended starting oven temperatures for several common solvents.
Table 7 Suggested initial oven temperatures for using the solvent effect
Solvent Boiling point, °C Suggested initial columntemperature, °C
Diethyl ether 36 10 to ambient
n-Pentane 36 10 to ambient
Methylene chloride 40 10 to ambient
Carbon disulfide 46 10 to ambient
Chloroform* 61 25
Methanol* 65 35
n-Hexane 69 40
Introduction to GC Inlets

Splitless Inlets 7
Introduction to GC I
Solvent selection must complement sample polarity. In addition, solvents must not elute after sample components of interest or they will be obscured by the large solvent peak. Polar solvents are usually required to dissolve polar solutes; nonpolar solvents are used to dissolve nonpolar solutes. Since the solvent is recondensed in the column during solvent focusing, solvent compatibility with the column is important to minimize the length of the flooded zone (peak broadening and splitting), or a retention gap must be used.
When analyzing only high-boiling sample components, splitless analyses are independent of solvent boiling point. Figure 23 illustrates the splitless analysis of a sample with high-boiling solutes. Even though the starting oven temperature is above the boiling point of the solvents, the peak widths are all narrow because stationary phase focusing predominates. In this case, conditions conducive to solvent focusing are unnecessary and would lead to longer run times. Analysis and recycle times, therefore, can be reduced by starting at a higher initial oven temperature while still achieving high sensitivity from splitless injection.
Ethyl acetate* 77 45
Acetonitrile 82 50
n-Heptane 98 70
iso-Octane 99 70
Toluene 111 80
* Should be used ONLY with crosslinked stationary phases
Table 7 Suggested initial oven temperatures for using the solvent effect (continued)
Solvent Boiling point, °C Suggested initial columntemperature, °C
nlets 77

78
7 Splitless Inlets
To find a good initial column temperature for samples with only late eluting peaks, increase the initial temperature by 25 °C increments until peak broadening is seen for the earliest eluting peaks of interest, then lower that temperature by 15 to 20 °C.
Figure 23 Stationary phase focusing with splitless injection and temperature programmed analysis
Initial column temperature 100 °C
iso-
octa
ne, b
p 99
°C
met
hyle
ne c
hlor
ide,
bp
41 °
C
diet
hyl e
ther
, bp
35 °
C
C14
C15
C16
C17 C14
C15
C16C17
C14
C15
C16C17
Liners
An important factor in the effective use of a splitless inlet is the size of the vaporizing chamber. Liners with internal volumes between 0.25 mL and 1 mL are common. Long and narrow inserts are preferred to obtain minimal sample dilution during slow manual injection. Larger-volume liners are required for autoinjection because the sample is injected and vaporized much more quickly. See Appendix A for appropriate liner volumes based on solvent and inlet temperature. When in doubt it is better to use oversized rather than undersized liners.
Since the contact time between the sample and the liner is very long in splitless injections, liner activity can cause decomposition of labile compounds. Liners and packing material should be deactivated (for example,
Introduction to GC Inlets

Splitless Inlets 7
Introduction to GC I
silanized). Even deactivated liners and packings will become more active with time and use. So cleaning, redeactivation, or replacement of the liner on a regular basis is highly recommended.
Splitless liners can be used without packing for manual injection. Some glass wool is required when doing fast autoinjection to maximize reproducibility. When dirty samples are analyzed, deactivated glass wool or glass beads help to retain nonvolatile sample components.
Temperature
Inlet temperature must be high enough to completely vaporize the sample and minimize its residence time in the inlet. However, the lowest temperature that accomplishes this is preferred because it will reduce sample decomposition and minimize flashback. In comparison to split injection, lower inlet temperatures can be used because sample transfer to the column is slower. Slow evaporation of the sample is compensated for by focusing techniques (solvent and stationary phase focusing).
An inlet temperature that is too low will prevent higher-boiling solutes from reaching the column, and inlet discrimination will occur. The proportion of high-boiling solutes reaching the column will decrease as a function of their boiling points. Peak areas for late eluting peaks will be progressively smaller than expected. In this case, a higher inlet temperature must be used, and a new optimal purge delay time must be determined at the new temperature.
Flow Rates
In comparison to split injection, faster column flows are generally preferred with splitless injection since this decreases the time that the sample is in the inlet. Column flow is set by adjusting column head pressure, just as is done with split injection. See Appendix B for flow rate versus column head pressure examples.
Purge flow (measured at the split vent) is typically 30 to 60 mL/min. Since the purge flow is turned off or diverted automatically during the initial injection period (purge delay time), it does not affect sampling unless purge time is set too short or flashback occurs (Figure 24).
nlets 79

80
7 Splitless Inlets
Figure 24 The quantitative recovery of n-C11 is a function of the septum purge flow rate
because of flashback with sample volumes larger than 1.7 µL.
16000
14000
12000
10000
8000
6000
4000
2000
2 4 6 8 10 20 30
Normalized area
Liner overloaded
Septum purge flow rate, mL/min
2.7 µL injected4.7 µL injected
0.7, 1.7 µL injected ±2.7%
Determining Purge Delay Time
Appropriate purge delay time is a compromise between the amount of sample transferred to the column and the sharpness of the tail of the solvent peak. Optimal purge time is dependent on all other injection variables and corresponds to transfer of 95% to 99% of the sample to the column. Figure 22 on page 76 shows the sharpening achieved by optimal purging of the inlet. Purging is only important when there are peaks of interest eluting near the solvent tail, because these peaks would be hidden under the tail
The relationship of purge delay and the amount of sample reaching the column is shown in Figure 25. The shape of the curves in Figure 25 is a function of the of solvent and solutes, the volume of the vaporizing chamber, the sample size, the injection speed, and the carrier gas velocity.
Introduction to GC Inlets

Splitless Inlets 7
Introduction to GC I
Purge delay time should be determined after all other inlet parameters have been set. A simple empirical approach is as follows:
1 Start by injecting a sample using a long purge time (90 to 120 s) and measure the area of a solute that elutes at ki´>5. This should correspond to 100% of the solute reaching the column.
2 Next, reduce the purge time in large decrements (for example, by 30 s, 20 s, etc.) and reinject the sample until a lower peak area results.
3 Compare the areas for the solute peak and adjust the purge time up or down in smaller increments until the area is between 95% and 99% of the original area.
For analyses of solutes eluting on the solvent tail, it is better to err in favor of the short purge delays to ensure sufficient sharpening of the solvent tail. For analyses of late eluting compounds, it is better to err in favor of long purge delay times to maximize analytical sensitivity. Unnecessarily long purge delays, however, will increase the amounts of contaminants transferring from the liner to the column and will increase total run time. (Usually, the oven temperature ramp does not start until after the purge delay time.)
Figure 25 Effect of iinlet purge activation time on area counts
10 20 30 40 50 60
Area counts
±1.2% deviation
±1.2% deviation
~20 ppm n-C14 (stationary phase focused)
~10 ppm n-C11 (solvent effect)Solvent: isooctaneColumn: 16.5 m × 0.25 mm SE-5480 °C (0.5 min) →170 °C @ 15 °C/minSample size: 1.3 µL, (manual injection)Injection rate: 0.1 µL/sPurge flows: 5 mL/min septum, 60 mL/min inlet
Purge activation time, s
nlets 81

7 Splitless Inlets
Troubleshooting
82
Most problems encountered with splitless injection are related to incorrect purge time, degradation, improper focusing, and flashback.
Solvent compatibility with the stationary phase is important to avoid peak distortion and splitting. Figure 26D shows peak distortion due to incompatibility of solvent and stationary phase. Retention gaps should always be considered when peak distortion occurs.
Appropriate initial column temperature is critical for effective solvent focusing.
Figure 26B shows the result of proper solvent focusing with an initial oven temperature of 25 °C. There are many narrow peaks on the solvent tail, and the peaks after the solvent tail are sharp. In contrast, the early peaks in fFigure 26C are hidden by the solvent and are broader because the initial column temperature of 60 °C prevented recondensation of the solvent and solvent focusing.
Sample vapors can be lost through the septum purge line if the insert is overfilled with sample vapor (either too large injection volume or too small liner volume). This leads to irreproducibility and nonlinearity of peak areas. Match inlet temperature, liner volume, and injection volume carefully.
Decomposition, as indicated by loss of peak area or generation of new peaks, can sometimes be dramatically reduced by changing liner type or by deactivating the liner and inlet with silanizing reagents. Removing or reducing the amount of liner packing can also decrease inlet activity.
Introduction to GC Inlets

Splitless Inlets 7
Introduction to GC I
Figure 26 Band broadening in space (C and D) in splitless injection. (Reproduced with permission from K. Grob, Jr., Journal of Chromatography, 324 (1985) 251–259).
1816
15 14 12 10 86
A
B
C
D
Split (reference)
Splitless with hexane recondensation
Splitless without hexane recondensation
Methanol - solvent
210 °C
210 °C
210 °C
210 °C 40 °C
40 °C
40 °C
60 °C
7 °C/min
7 °C/min
7 °C/min
7 °C/min
25 °C
25 °C
25 °C
nlets 83

7 Splitless Inlets
Summary
84
Table 8 Standard splitless practices and procedures
Parameter Selection/Setting Rationale
Inlet temperature 200 to 280 °C Ensure flash vaporizationReduce if degradation occursUse higher for dirty samples and higher-boiling solutes
Inlet liner Large volume, >0.8 mL Use with autoinjectors
Small volume, <0.7 mL Use only for slow manual injections
Inlet packing None Use only with slow manual injectionsDecreases degradation
Silanized glass wool Use for fast autoinjection and dirty samples
Injection volume 0.5 to 3 µL liquid Depends on solvent, liner, and conditionsRefer to Appendix A
Injection technique Fast autoinjection Most reproducibleLess needle discrimination
Hot needle slow manual Inject 1 to 2 µL/s if narrow liner used and >1 µL injection
Hot needle fast manual Use for <1 µL injections
Purge flow 20 to 50 mL/min Not critical
Purge delay time 20 to 80 s Adjust according to inlet and sample conditions
Oven temperature BP solvent –25 °C Necessary for solvent focusingSee Table 7 on page 76
Column flow > 2 mL/min when possible
Clears inlet fastReduces backflash and decomposition
Septum purge 1 to 5 mL/min Reduce ghosting
Quantification Internal standard Maximizes reproducibility
Standard addition Use only with constant injection volume
Retention gap 1 to 3 m, deactivated Reduces peak distortion
(1 to 2 m per µL injected) Promotes solvent and stationary phase focusing
Introduction to GC Inlets

Splitless Inlets 7
Introduction to GC I
Table 9 Factors affecting splitless accuracy and reproducibilitySymptom Possible cause Solution
Lost peaks, Skewed peaks, Artifact peaks (degradation)
Inlet too hot Reduce temperature 50 °C
Active packing Remove or minimize packing
Active liner Change linerDeactivate liner
Liner too small Use larger volume liner
Long residence time Increase column flow rate
Wide peaks No solvent effect Reduce oven temperatureUse higher-boiling solvent
No stationary phase focusing Reduce initial oven temperature
Split peaks Solvent/column not compatible Use different solventUse retention gap
Area reproducibility Flashback Reduce injection volumeUse higher-boiling solventUse larger liner
Purge time or flow variability Check purge on/off times
Retention time reproducibility Inaccurate purge delay Check and correct
Incompatible solvent Use retention gap
nlets 85

86
7 Splitless Inlets
Introduction to GC Inlets

GC Inlets An Introduction
8Cool On-Column Inlets
Overview 88
Inlet Design 89
Sample Considerations 92
Secondary cooling 92
Retention Gaps 94
Temperature 95
Flow Rates 95
Troubleshooting 96
Summary 97
87Agilent Technologies

8 Cool On-Column Inlets
Overview
88
Cool on-column injection is superior in many ways to other sample introduction techniques. Its advantages can be summarized as follows:
• Elimination of sample discrimination
• Elimination of sample alteration
• Solvent focusing of early eluting solutes
• High analytical precision
If done properly, cool on-column injection provides the most accurate and precise results of the available inlets. Syringe discrimination is completely eliminated. Moreover, inlet-related discrimination does not occur, since the liquid is introduced directly into the column. Automated on-column injection provides even higher analytical precision. Add to this the elimination of thermal decomposition and rearrangement reactions, and it becomes apparent that cool on-column injection should be considered whenever high precision and accurate results are required.
Even though cool on-column inlets offer very precise and accurate sample introduction there are several important restrictions associated with this technique:
• Maximum sample volumes are smaller compared with other inlets.
• Solute peaks eluting just before the solvent cannot be focused and are difficult to determine.
• Capillary columns (especially those with a large phase ratio or small inner diameter) can easily be overloaded with sample.
• Parameters such as initial column temperature, solvent nature, and injection rate must often be optimized.
In addition, since the sample is directly deposited into the column, nonvolatile sample components can accumulate at the head of the column and will degrade efficiency and/or interact with subsequent injections. Another disadvantage of on-column injection is the potential awkwardness of sample introduction (varies with inlet design).
Introduction to GC Inlets

Cool On-Column Inlets 8
Inlet Design
Introduction to GC I
Cool on-column injection may be done manually into most capillary columns with internal diameters greater than 0.2 mm, or automatically into wide-bore (>0.3 mm id) capillary columns. Inlet selection and use depend, therefore, on whether automatic injection is required.
For manual injections, a syringe with a fused-silica needle (essentially a narrow od capillary column) is used to introduce the sample into the analytical column. The basic requirements of a manual cool on-column inlet are that it guide the delicate needle into the capillary column, provide a pressure seal around the needle during injection, and have good thermal control for heating and cooling.
A simple manual on-column inlet design is shown in Figure 27. The inlet has a low thermal mass which facilitates cooling and heating. A duckbill valve provides the pneumatic seal, and septum purge minimizes ghosting. The duckbill valve, made of a soft elastomer, is a passive element that consists of two surfaces pressed together and sealed by the column inlet pressure (Figure 28).
nlets 89

90
8 Cool On-Column Inlets
Figure 27 Cross-section of cool on-column injector applying a duckbill valve. For auto-mated injections the duckbill valve is replaced by a disc septum and septum nut.
Septum
Cool towerneedle guide
Septum purge out
Duckbill valve(isolation valve)
Cryogenic cooling(optional)
Carrier in
Column
Heater block
Insert
Spring
GC
Introduction to GC Inlets

Cool On-Column Inlets 8
Introduction to GC I
To inject a sample manually with the inlet shown in Figure 27, the required amount of sample is withdrawn from a sample vial using a syringe equipped with a fused silica needle (105 mm long, 0.14 mm od). Excess sample is wiped from the outside of the needle prior to injection. A needle guide is depressed and parts the surfaces of the duckbill valve, preventing contact between the fused-silica needle and the valve. The needle is then pushed through the needle guide and into the column. The needle guide prevents contamination of the duckbill valve by the syringe.
Once the needle is well into the column, the needle guide is released; this withdraws the needle guide from the duckbill valve and tightens the valve against the syringe needle. The syringe plunger is then rapidly depressed, injecting sample, and the syringe is immediately withdrawn. For several seconds after injection, the liquid migrates and forms a stable film (flooded zone). Then the inlet and oven temperatures are increased to initiate chromatography.
When automatic cool on-column injection is required (multiple samples, higher precision), an autoinjector and a standard syringe (stainless steel needle) are used. Injection into wide-bore capillaries (id >0.5 mm) can be done easily with a 26-gauge syringe needle, whereas injection into a 0.3-mm column requires a 32-gauge needle. The narrower needles are more sensitive to injector alignment and may require special sample-vial septa and inlet septa to prevent bending.
Figure 28 A cross-section of a “duckbill” valve used to isolate the chromatographic system. The arrows show how the inlet pressure serves to seal the valve.
nlets 91
92
8 Cool On-Column Inlets
For automatic injection with the inlet shown in Figure 27, the duckbill valve is replaced by a septum and nut. The required pressure seal is maintained by the septum, as with other septum-equipped inlets. The sequence of events for automated cool on-column injection is autosampler dependent but usually is the same as with other inlet techniques. Autoinjection into narrow-bore columns is accomplished by using wide-bore retention gaps which are butt-connected to the narrow columns with reducing unions.
Secondary cooling
An alternative cool on-column inlet design to the one shown in Figure 27 extends cooling of the column outside the inlet into the GC oven. To accomplish this, the first 30 to 100 cm of the analytical column run through a metal sleeve through which cool gas is purged (secondary cooling). The sample is injected manually through the inlet into the cooled portion of the column. Immediately following injection, secondary cooling is shut off automatically and the column heats to oven temperature.
With secondary cooling, a higher oven temperature can be maintained than with other inlet designs. As long as the sample flooded zone does not extend into the hot portion of the column, oven temperature can be maintained above the boiling point of the solvent. This capability decreases analysis time and increases sample throughput for appropriate applications because temperature programs and instrument cool-down periods are decreased. This benefit, however, becomes less significant as the variance diminishes between the boiling point of the solvent and the elution temperature for the first peak of interest.
Sample Considerations
Sample preparation is important for on-column injection because of the potential for column overload, column contamination, incompatibility of the solvent with the stationary phase, and the dependence of the initial column temperature on the boiling point of the solvent. Many of the problems associated with these variables can be resolved by using a retention gap ahead of the analytical column.
Introduction to GC Inlets

Cool On-Column Inlets 8
Introduction to GC I
Cool on-column injection is restricted to small sample sizes in the range of 0.5 to 2 µL. The ideal volume depends on the column id, the compatibility of the sample solvent and the stationary phase, sample concentration, stationary phase film thickness, and column flow rate. Usually the smaller the sample the better, providing that sensitivity requirements are met.
To introduce sample properly by cool on-column injection, the syringe plunger should be pressed as fast as possible to prevent sample from adhering to the needle (Figure 29). With fast injection (most effectively accomplished using fast autoinjectors), the sample is sprayed into the column, away from the needle, so reproducibility is increased and no discrimination or loss occurs.
If injection volume is too large, or if the column flow rate is too slow, sample may back out of the column and be lost through septum purge lines or around the syringe needle. Excessive sample volume can also lead to peak distortion or splitting (Figure 30). This can sometimes be corrected by using a retention gap.
Figure 29 This diagram shows that by rapidly injecting the sample, the possibility of sample “coating” the outside of the needle is eliminated. The sample is condensed on the column at a point well away from the needle.
Slow injection Fast injection
Needle
Oven wall
Column
nlets 93

94
8 Cool On-Column Inlets
Figure 30 Peak width as a function of injection volume showing the effects of band broadening in space. The solute is dodecane and the solvent hexane. Column: 25 m × 0.31 mm SE-54. Hydrogen carrier gas at 44 cm/s. Oven profile: 60 to 320 °C at 15 °C/min.
Volume, µL
Peak width, s
0.5 1 2 4 8
1.26 1.20 1.50 – –
Retention Gaps
There are no liners for cool on-column inlets because the sample is deposited directly into the column. However, when coupled with on-column injection, retention gaps serve many useful functions, including:
• Protection of the column from nonvolatile or reactive sample components
• Peak narrowing by containment of the flooded zone
• Serving as an interface for coupling narrow-bore capillary columns to automated on-column injectors
• Serving as an interface for multidimensional chromatographs (LC/GC)
Retention gaps should be deactivated to reduce decomposition and peak broadening. The length of the retention gap is dependent on the type and volume of the solvent being injected. The more compatible the solvent and retention gap, the shorter the retention gap can be (for example, a 30-cm gap may be required per µL of injected hexane versus a 2-m gap per µL of injected methanol).
Introduction to GC Inlets

Cool On-Column Inlets 8
Temperature
Introduction to GC I
Selection of the appropriate temperature program for cool on-column inlets is important for obtaining good results. The inlet temperature during injection should be at or below the boiling point of the solvent and/or major sample components. Since the sample will be dispersed in a flooded zone, which can extend into the column oven zone, the temperature of the analytical column (or the initial portion of the column) should be equal to or below the starting inlet temperature.
After the time necessary to create a stable flooded zone, the inlet temperature should be raised, at least as fast as the oven temperature, to ensure that the sample is transferred out of the inlet zone to the oven zone in a narrow band. In some cases, a faster inlet temperature program may be used to narrow high-boiling components by quickly moving them from the inlet to the cooler column where stationary phase focusing can occur. With cool on-column injection, there is no benefit to inlet temperature programs that lag oven temperature.
Flow Rates
Column flow is set by adjusting column head pressure. High flow velocities (30 to 50 cm/s) are recommended with cool on-column injections to ensure that the sample is quickly carried away from the syringe into the column.
There is no split (the inlet purge) flow to be set; however, in septum-equipped inlets, there may be an adjustable septum purge that should be set between 5 and 10 mL/min.
nlets 95

8 Cool On-Column Inlets
Troubleshooting
96
The major problems found with cool on-column injection are associated with column overload, solvent/stationary phase incompatibility, and column contamination.
If the flooded zone after injection is too long (large injections, poor wettability), peaks will be broad or split. A retention gap usually will resolve this problem.
Loss of column efficiency with on-column injection usually is caused by contamination or degradation of the stationary phase at the head of the column. Only columns with an immobilized stationary phase should be used with cool on-column injection to prevent displacement of the stationary phase by solvents.
Immobilized stationary phases can be washed to remove contaminants and renew performance. The column should be removed from the GC and backwashed with a series of solvents, finishing with a volatile solvent like pentane. If column performance does not improve after washing, cut 0.5 m off the inlet side of the column. If that does not return column performance, the column must be replaced and a retention gap should be used for all further injections of dirty samples.
Sample degradation can occur with cool on-column injection if column or retention gap activity is high. Use only well-deactivated retention gaps and good quality capillary columns.
Introduction to GC Inlets

Cool On-Column Inlets 8
Summary
Introduction to GC I
Table 10 Standard cool on-column practice and procedures
Parameter Selection/Setting Rationale
Initial inlet temperature ≤ BP of the solvent Ensures liquid injection
Initial time 0.1 min Allows formation of a stable film
Initial inlet temperature ramp
Same as oven (oven track) Simple and effective
Faster than oven Narrows initial peak width
Injection volume 0.1 to 2.0 µL liquid Use smaller injection for small id columnsDepends on column capacity
Injection technique Fast autoinjection Projects droplets away from syringe tip
Fused-silica needle Use for manual injection into small id columns
Oven temperature Inlet temperature or slightly lower Prevent backflash
Column flow 50 to 80 cm/s Use for hydrogen carrier gas
30 to 50 cm/s Use for helium carrier gas
Septum purge 5 to 10 mL/min Use if installed to prevent ghosting
Quantification All methods Inherently reproducible techniqueLack of discrimination
Retention gap requirements 1 to 3 m, deactivated Corrects peak distortionProtects column from nonvolatile componentsPermits autoinjection with narrow-bore columns
nlets 97

98
8 Cool On-Column Inlets
Introduction to GC Inlets

GC Inlets An Introduction
9Programmed- Temperature Vaporizer (PTV) Inlets
Overview 100
Operating Modes 100
Cold split injection 100
Cold splitless injection 101
Solvent elimination split/splitless injection 102
Inlet Design 105
Sample Considerations 107
Liners 109
Temperature 109
Flow Rates 110
Troubleshooting 112
Summary 113
99Agilent Technologies

9 Programmed- Temperature Vaporizer (PTV) Inlets
Overview
100
PTV inlets combine the benefits of split, splitless, and on-column inlets. The sample is usually injected into a cool liner, so no syringe needle discrimination can occur. Then the inlet temperature is increased to vaporize the sample. The user programs vent times and temperatures to achieve the equivalent of split or splitless transfer of sample vapors to the column. PTV injection is considered the most universal sample introduction system because of its flexibility. Depending on the mode of injection, PTV advantages include:
• No syringe-needle discrimination
• Minimal inlet discrimination
• No special syringe needed
• Use of large injection volumes
• Removal of solvent and low boiling components
• Trapping of nonvolatile components in liner
• Split or splitless operation
• Retention time and area reproducibilities approaching cool on-column injection
• Cold trapping of gas injections (for example, from valves, headspace, and purge and trap autosamplers)
Operating Modes
The three most important modes of PTV operation are cold split injection, cold splitless injection, and solvent elimination injection.
Cold split injection
Cold split injection is useful for general analysis and sample screening. In cold split injection, the liquid plug is introduced into a cold vaporizing chamber. This prevents syringe fractionation (discrimination), and the sample volume can be more reproducibly introduced than in classical split injection.
After the syringe is withdrawn, the split vent is opened and the inlet is heated. All sample vapors are then split between vent and column flow paths in a manner similar to that which occurs with conventional split inlets with one
Introduction to GC Inlets

Programmed- Temperature Vaporizer (PTV) Inlets 9
Introduction to GC I
exception. The sample is not vaporized instantaneously; evaporation of solvent and solutes occurs in the order of their boiling points. Therefore, sample components reach the column sequentially and the amount of sample at the head of the column directly after injection is smaller than the amount found with flash vaporization inlets. This permits the injection of larger sample volumes before loss in column efficiency is experienced. It also provides more accurate and reproducible sample splitting since there is minimum pressure and flow perturbation within the inlet during sample transfer.
Cold splitless injection
Cold PTV splitless injection is used for trace analysis, as is conventional splitless injection, but it has the advantage of lower sample discrimination and decomposition. In cold splitless injection, the split vent is closed during injection of the sample into the cool inlet liner. The inlet is then heated and the sample is transferred to the column, which is maintained at a low temperature (analogous to conventional splitless injection), to recondense the solvent for solvent focusing. After a preselected time (30 to 90 s), the split line is activated to vent residual vapors from the glass liner as is done with conventional splitless inlets.
In general, larger sample volumes can be introduced with PTV splitless inlets compared with conventional splitless inlets with similar liner volumes. During the progressive evaporation of the sample, vapors are removed efficiently from the liner, minimizing flashback.
nlets 101

102
9 Programmed- Temperature Vaporizer (PTV) Inlets
Figure 31 compares the chromatograms obtained using cold splitless and cold split PTV injections of the same sample. The relative peak heights are the same for the two PTV modes, demonstrating that there is negligible discrimination with these injection techniques.
Solvent elimination split/splitless injection
Figure 31 Chromatogram of a Grob test in diethyl ether and cyclohexane with and without splitting, Courtesy of Gerstel GmbH.
Example 1Gas Chromatogram of a Grob Testin Diethyl Ether and Cyclohexane
Example 2Gas Chromatogram of a Grob Testin Diethyl Ether and Cyclohexane
25 m of OV 1701 glass, 0.6 bars of N2Oven: 40 to 180 °C at 10 °C/minInjector: 10 to 220 °C in 33 sDetector: 260 °Cwithout splitting
25 m of OV 1701 glass, 0.6 bars of N2Oven: 40 to 180 °C, 10 °C/minInjector: 10 to 220 °C in 33 sDetector: 260 °CSplitting ratio: 1:35
Solvent elimination injection is used to selectively remove solvent from the sample to allow injection of larger sample volumes or to concentrate dilute samples for higher sensitivity. Liquid sample sizes in excess of 200 µL have been injected with this technique with good analytical precision. The procedure is equally effective using a single large injection or several smaller injections. The maximum permissible sample volume is a function of liner volume, inlet temperature, and flow rates.
For solvent elimination injection, the sample is introduced into the inlet under the following conditions:
Introduction to GC Inlets

Programmed- Temperature Vaporizer (PTV) Inlets 9
Introduction to GC I
• The split vent (plus solvent vent line, if present) is off.
• The inlet temperature is close to, but below, the boiling point of the solvent.
• The syringe plunger is depressed slowly to prevent flashback.
After injection, vent flows are turned on. Total vent flow rate is high (up to 1000 mL/min) to remove solvent vapors efficiently. Inlet temperature can be increased slightly to aid in solvent evaporation. After most of the solvent vapors have vented through the split line, the split line can be closed (solvent elimination splitless mode) or open (solvent elimination split mode) as the inlet temperature is raised.
Solvent-elimination splitless mode improves analytical sensitivity by maximizing the amount of higher-boiling solutes reaching the column while minimizing the initial sample load on the column.
Solvent-elimination split mode permits injection of larger sample volumes and removal of solvent and low boiling sample components. However, this mode is rarely used since the benefit of sample concentration by solvent elimination is negated by splitting of the sample during inlet heat-up.
There is a significant pitfall to solvent elimination injection—loss of volatile sample components that are vented with the solvent. The applicability of the technique is usually restricted, therefore, to the analysis of compounds with low volatility.
Figure 32 illustrates the loss of volatile sample components with the solvent during solvent venting. In this example, the solvent was vented after six 1-µL injections of a mixture of C13to C20 alkanes in hexane (concentration 5 ppm). The resulting chromatogram shows that significant amounts of C13 through C16 are lost with the solvent, while negligible loss is observed for the later eluting compounds.
nlets 103

104
9 Programmed- Temperature Vaporizer (PTV) Inlets
Figure 32 The multiple injection technique allows concenmtration of the compounds above C16 uniformly without distortion.
25 m Ultra2, FSOven
No. of injectionsbefore heat-upHeat-up only takes place after last injectionInjectorSolvent ventingDetectorSplit ratio
0.7 bar helium40 °C constant 0.5 min40 to 250 °C at 50 °C/min250 to 330 °C at 15 °C/min330 °C constant 1.5 min
6
10 to 330 °C at 12 °C/s30 sFID, 300 °Cx:30, 30 ssplitless
The analysis of compounds with medium volatility is feasible but requires packing of the insert with adsorbents such as Tenax, activated charcoal, or a porous polymer. With adsorbents, however, the temperatures required to desorb the sample to the column after solvent elimination can be very high (300 to 350 °C). At these temperatures, decomposition has been observed, limiting the applicability of this approach.
Introduction to GC Inlets

Programmed- Temperature Vaporizer (PTV) Inlets 9
Introduction to GC I
Excellent results already have been demonstrated using the various PTV modes, but more investigation is necessary to establish the full range of possibilities for this technique. Its power lies mainly in the capability to “program” the injection port temperature in conjunction with liner selection and split vent timing.
Inlet Design
Different configurations of PTV inlets are commercially available and offer varying degrees of flexibility in injection modes and use.
Figure 33 is a schematic of one PTV injector that looks very similar to a conventional split/splitless inlet. In comparison to a conventional split/splitless inlet, the PTV has:
• Lower thermal mass
• Rapid heating and cooling capabilities
• Lower internal volume
nlets 105

106
9 Programmed- Temperature Vaporizer (PTV) Inlets
• Multiple timing of split-vent and inlet heating cycles
The inlet diagrammed in Figure 33 consists of a 5 to 8 cm-long, 0.2 cm od, 0.15-cm id glass liner, packed with silanized glass wool. The carrier gas flow into the inlet and around the liner is similar to that of a conventional split inlet (Chapter 6).
PTV inlets are actively cooled before and during injection by Peltier devices or by forced gases (air, liquid N2, or liquid CO2). Cryogenic cooling of the inlet can reduce inlet temperature enough to thermally focus gas injections from other sampling devices in the liner. This is a distinct advantage of using PTV inlets in comparison to conventional inlets for coupling auxiliary sampling devices to capillary columns.
Figure 33 Schematic diagram of a PTV injector
Septum
Septum purge
Carrier gas
Cooling device
Capillary column
Seal
Heating coil
Glass wool
Insert(vaporization chamber)
Split line
Introduction to GC Inlets

Programmed- Temperature Vaporizer (PTV) Inlets 9
Introduction to GC I
Postinjection, PTV inlets are heated using electrical heaters or preheated compressed air. Depending on design, inlet temperature ramps are either ballistic (ramped to the maximum temperature at an uncontrolled maximum rate) or programmable.
Sample Considerations
Sample screening and general analyses are best done using cold split PTV injection.
Trace analysis is best done by cold splitless PTV injection, unless only late eluting compounds are important. In that case, solvent elimination splitless injection may be useful since larger sample volumes can be injected without overloading the column. Solvent elimination modes should not be considered for samples that have early-eluting peaks of interest, since they will be vented with the solvent.
PTV sampling techniques are very useful for analyzing dirty samples. Cold injection prevents needle discrimination, the PTV liner protects the column from nonvolatile sample components, and more analyses can be done before loss in performance is seen than with conventional split, splitless, or cool on-column techniques.
Figure 34 compares repeated analyses of a milk extract by conventional splitless and cold PTV splitless inlets. The PTV analysis still shows good peak shape and sensitivity for the peak of interest (nitrenedipine) after 50 injections (Figure 34D); however, using the conventional splitless inlet (Figure 34B), the peak height is significantly reduced after only five injections.
The applicability of PTV techniques to analyze thermally labile samples is somewhere between that of vaporizing and cool on-column inlets. Since the sample is introduced at low temperatures and then heated to a maximum value, few sample components are exposed to the high ending temperature,
nlets 107

108
9 Programmed- Temperature Vaporizer (PTV) Inlets
and decomposition is reduced. However, PTV inlets are still more active than capillary columns, so the very sensitive samples should be analyzed by cool on-column injection.
Figure 34 Comparison of repeated injections of a milk extract by conventional splitless (A, B) and cold PTV splitless (C, D) inlets. Peak X is nitrenedipine. Courtesy of Gerstel GmbH.
Conventional splitless injection
Cold splitless PTV injection
A B
C D
Injection 1
Injection 1 Injection 5
Injection 50
X
X X
X
Introduction to GC Inlets

Programmed- Temperature Vaporizer (PTV) Inlets 9
Liners
Introduction to GC I
There are few choices in liner design for PTV inlets. However, liner volume and activity are still key issues to be considered when selecting among the few available PTV liners. PTV liners require packing or a modified surface to hold the liquid sample in place before and during the vaporizing process. For labile samples where glass wool may cause sample degradation, a baffled liner (as shown in Figure 35) should be used to minimize activity. Deactivation of the liner may also be required.
Liners should be cleaned or replaced on a regular basis and whenever a loss in performance is seen.
The volume of liners for PTV inlets does not have to be as large as that for conventional vaporizing inlets for the same volume of injected sample, since the sample is not flash vaporized. Liner volume, however, is related to the maximum volume of liquid that can be introduced and the speed of liquid sample introduction during solvent-elimination injection.
Figure 35 PTV inlet tube with deformation of the cross-section
(Courtesy Gerstel GmbH)
Temperature
PTV inlet temperature is dependent upon the mode of injection. Cold split/splitless injection requires that the inlet temperature be below the boiling point of the solvent. Inlet temperature during solvent elimination injection should be set nearer to the boiling point of the solvent so that solvent is selectively evaporated.
After injection of the sample into the liner, the inlet temperature program should be fast enough to transfer sharp peaks to the column and should end at a temperature high enough to evaporate all sample components of interest.
nlets 109

110
9 Programmed- Temperature Vaporizer (PTV) Inlets
The inlet temperature should always be above the column temperature. Excessively fast inlet temperature ramp rates, however, can lead to flashback or column overload if the sample volume is large.
Flow Rates
The mode of PTV injection also dictates inlet timing and flow rates. During cold split and splitless injection, the split flow is off when sample is injected into the liner. For split injection, the split vent is then turned on and the inlet is heated. Split flow is adjusted to give the desired split ratio, just as it is for conventional split injection.
For cold splitless injection, the split flow remains off until all the sample has been transferred to the column. This can take longer than it does with conventional splitless injection, because it is necessary to wait until the inlet reaches its final temperature. If a fast inlet temperature ramp is used, sample transfer can also take less time than it does with conventional splitless injection, since PTV liners have smaller volumes and are cleared of sample vapors quickly.
When important sample components elute near the solvent tail, purge delay should be optimized in a conventional manner (see Chapter 7). This will ensure that 95% to 99% of the sample is transferred to the column and that the solvent tail is sharp.
In PTV solvent elimination mode, the split vent is on during the sample introduction step. The split flow should be high enough to clear the inlet of solvent vapors (up to 1000 mL/min) but should be optimized with respect to solvent boiling point and inlet temperature to prevent excessive loss of sample components.
Table 11 summarizes the typical inlet temperature and flow conditions for the various modes of PTV sampling.
Introduction to GC Inlets

Programmed- Temperature Vaporizer (PTV) Inlets 9
Introduction to GC I
Table 11 Inlet conditions for PTV injection modes
PTV inlet mode Cold split Cold splitless Solvent elimination split
Solvent elimination splitless
Inlet condition during injection
• Liner temperature << Solvent BP << Solvent BP < Solvent BP (vapor pressure dependent)
< Solvent BP (vapor pressure dependent)
• Purge/Split flow OFF OFF 100 to 1000 mL/min 100 to 1000 mL/min
• Delay before inlet heating NONE NONE 5 to 30 s 5 to 30 s
Inlet conditions during inlet heating
• Liner temperature program Maximum rate To max temp in <80 s
Maximum rate To max temp in <80 s
• Column temperature Solute dependent < Solvent BP Solute dependent < Solvent BP
• Purge/Split flow Split ratio dependent
Off until final inlet temp reached
Split ratio dependent Off until final inlet temp reached
nlets 111

9 Programmed- Temperature Vaporizer (PTV) Inlets
Troubleshooting
112
Most problems with PTV inlets involve improper setting of inlet temperature and/or flow parameters, and sample decomposition. The selection of liner, and the setting of inlet temperatures and purge timing, are all critical for optimal use of an inlet. Liner configuration (volume, packing, style) and extent of deactivation have a major effect on sample decomposition.
In cold split PTV injection, large sample volumes and slow inlet heating will cause slow transfer of sample from the inlet to the column and will result in broad peak widths. However, sample degradation is more likely as the temperature ramp rate is increased, so optimization of inlet conditions becomes more important with labile samples.
In cold splitless PTV injection, sample degradation is more likely to occur than with cold split injection because the sample is in contact with the liner and liner packing material for a longer time. Therefore, high column flow rates, slower temperature ramp rates, and deactivated liners should be used when analyzing labile samples.
Loss of volatile sample components and flashback are the two most common problems with solvent elimination modes of PTV injection. The solvent can be eliminated efficiently even when the inlet temperature is below the boiling point of the solvent. The solvent still has significant vapor pressure and is removed slowly, preventing flash vaporization. Injecting sample slowly (1 to 2 µL/s) also reduces flashback and loss of volatiles.
All PTV injection modes can yield wide initial peak widths, so solvent and/or stationary phase focusing is usually required. Retention gaps should also be used to prevent peak splitting and distortion in splitless PTV injection modes.
Introduction to GC Inlets

Programmed- Temperature Vaporizer (PTV) Inlets 9
Summary
Introduction to GC I
Table 12 Standard PTV practice and procedures (Cold split/splitless modes)
Parameter Selection/Setting Rationale
Injection mode Cold split For general use and sample screening
Cold splitless For trace analysis
Inlet temperature ramp rate Adjustable (2 to 12 °C/s) Use slower ramp rates for labile, complex, or large volume samplesUse faster ramp rates for most samplesUse faster ramp rates to shorten splitless purge delay time
Ballistic Simple, less expensive instrumentation
Inlet liner Straight with silanized wool For general use
Baffled For labile samples
Packed with an adsorbent For focusing gaseous injections from auxiliary sampling devices
Injection volume 0.1 to 1.5 µL Use lower volumes for volatile solvents and fast ramp ratesUse volumes >1.5 µL only in solvent-elimination mode
Sample injection technique Autosampler, manual, fast or slow
Not critical for cold split or splitless modes
Oven temperature BP solvent – 25 °C For proper solvent effect in splitless mode
Sample dependent For split mode
Column flow 30 to 50 cm/s Vlears inlet fasterLess backflash
Septum purge 1 to 5 mL/min Minimize ghosting
Quantification Any method Inherently reproducibleLow discrimination in cold injection modes
Retention gap 1 to 3 m, deactivated Compensates for extended flooded zone and solvent-column incompatibility
nlets 113

114
9 Programmed- Temperature Vaporizer (PTV) Inlets
Table 13 Standard PTV practice and procedures (Solvent-elimination split/splitless modes)Parameter Selection/Setting Rationale
Injection mode Split Accomodates large sample volumesEliminates low boilers
Splitless For trace analysis where large sample volumes are necessary
Inlet liner Straight with silanized wool For general use
Packed with adsorbent For retaining medium volatility solutes during solvent venting
Injection volume 5 to 250 µL Large sample volumes require repeat injections of smaller individual volumesLargest volumes inlet and liner dependent
Sample injection technique Slow manual Minimize flashback
Inlet temperature Below solvent BP Ensure gentle evaporationMinimize loss of medium volatility solutes
Ramp delay 5 to 30 s after last injection Depends on solvent volume and inlet temperature
Inlet temperature ramp rate 12 °C/s For most samples
Ballistic Simpler, less expensive instrumentation
Introduction to GC Inlets
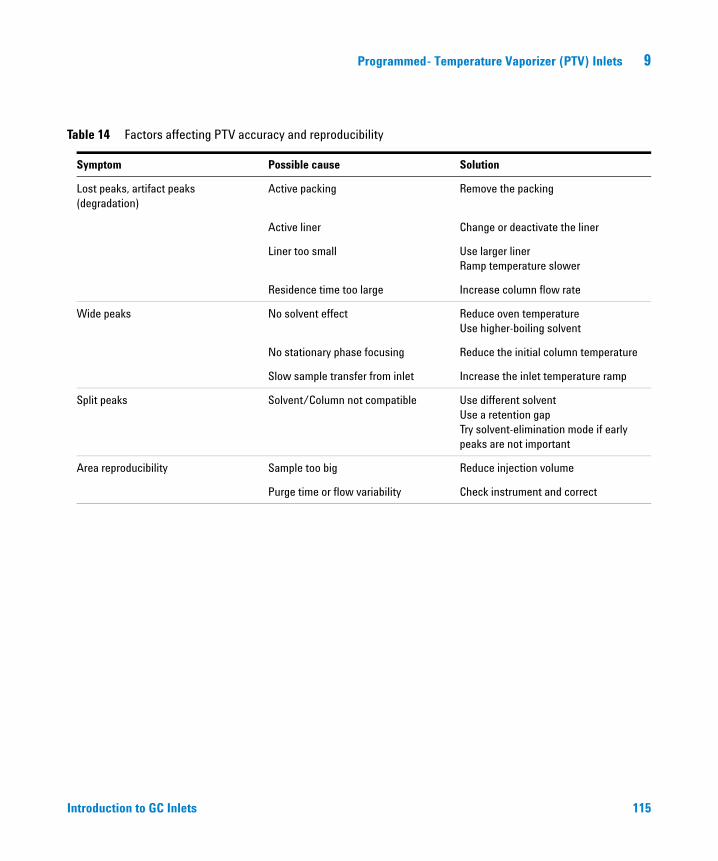
Programmed- Temperature Vaporizer (PTV) Inlets 9
Introduction to GC I
Table 14 Factors affecting PTV accuracy and reproducibility
Symptom Possible cause Solution
Lost peaks, artifact peaks (degradation)
Active packing Remove the packing
Active liner Change or deactivate the liner
Liner too small Use larger linerRamp temperature slower
Residence time too large Increase column flow rate
Wide peaks No solvent effect Reduce oven temperatureUse higher-boiling solvent
No stationary phase focusing Reduce the initial column temperature
Slow sample transfer from inlet Increase the inlet temperature ramp
Split peaks Solvent/Column not compatible Use different solventUse a retention gapTry solvent-elimination mode if early peaks are not important
Area reproducibility Sample too big Reduce injection volume
Purge time or flow variability Check instrument and correct
nlets 115

116
9 Programmed- Temperature Vaporizer (PTV) Inlets
Introduction to GC Inlets
GC Inlets An Introduction
10Valves
Overview 118
Valve Types 118
Rotary valves 118
Slider valves 118
Valve Design 119
Rotary gas sampling valves 119
Rotary liquid sampling valves 120
Slider valves 120
Valve connection to packed columns 121
Valve connection to capillary split inlets 123
Sample Considerations 123
Selecting Sample Loop Volume 124
Temperature 124
Gas valves 125
Liquid sampling valves 125
Transfer lines 125
Columns 125
Flow Rates 125
Troubleshooting 127
Summary 129
117Agilent Technologies

10 Valves
Overview
118
Sampling valves are simple mechanical devices that introduce a sample of fixed size into the carrier gas stream. Sampling valves are most frequently used to sample gases or liquids in constant-flowing streams such as those in chemical reactors, chemical transfer lines, high-pressure liquid natural gas processing, waste effluent streams, fermenters, and petroleum distillation towers. Valves can be coupled directly to the chromatographic column or in series with a packed-column direct inlet or a capillary split inlet.
Gas sampling valves must be appropriately thermostated to achieve accurate and reproducible injection volumes and to prevent condensation of gas samples. For thermostating, heated valve ovens or “boxes” are used; or the valve can be positioned inside the GC oven with the column.
Liquid sampling valves have lower sample volumes than gas sampling valves and require that the sample:
• Remain a liquid while filling the sample loop
• Expand quickly into a gas when switched into the carrier gas stream
Valve Types
Rotary valves
Rotary valves are the type of sampling valves used most frequently for gas and liquid sampling. They rotate in one direction to load the sample and then in the opposite direction to inject the sample. Rotary valves are very robust and can withstand high pressures and temperatures. These valves are rotated by hand, air-pressure, or electric actuators. The actuators are activated by an electrical signal from a timing device such as an integrator, a data system, a timer, or the GC itself.
Slider valves
Another type of valve frequently used for gas sampling is the slider (diaphram) valve, which tends to switch faster than the rotary valve, has lower internal volume, and may have longer lifetime. These features are desirable for high-resolution capillary chro- matography; however, use of slider valves is somewhat limited because they cannot be used reliably above 150 °C.
Introduction to GC Inlets

Valves 10
Valve Design
Introduction to GC I
With sampling valves, the sample is contained in a “loop,” which is either an attached length of tubing (gas sampling valves) or an etched groove in the valve rotor itself (liquid sampling valves).
Rotary gas sampling valves
Figure 36A is a diagram of a rotary gas sampling valve in the load position. Gaseous sample flows through the inlet line into the valve, through the sample loop, and out again through the sample drain line.
For injection (Figure 36B), the valve rotor is turned and the sample becomes part of the carrier gas stream flowing into the column.
To vary the sample volume, the sample loop is replaced with tubing of appropriate volume (achieved by varying tubing id and length). Typical gas sample volumes are between 0.25 and 1.0 mL.
Figure 36 Rotary gas sampling valve
54 3
2
16
54
32
16
A B
Carrier
Loop
Sample inDrain
Load
Columnor2nd valve
Columnor2nd valve
Carrier
Inject
nlets 119

10 Valves
Rotary liquid sampling valves
120
Figure 37A is a diagram of a rotary liquid sampling valve in the load position. In a manner analogous to gas sampling valves, liquid sample flows through the sample inlet line into the valve and out through the drain line. The liquid sample volume is usually less than 5 µL. In contrast to gas sampling valves, however, the sample is contained in a groove in the valve rotor (internal loop); and a restrictor is attached to the sample drain line. The restrictor keeps the sample liquified within the valve. When the valve is rotated (Figure 37B), the compressed liquid expands into a gas and is swept into the column by carrier gas.
Slider valves
Figure 37 Rotary liquid sampling valve
WS P
C WS P
C
A B
Load Inject
Carrier CarrierColumn Column
Sample in
DrainRestrictor
Slider (diaphram) valves provide the same function and generally operate in the same manner as rotary sample valves; however, they are designed to give narrower initial peak widths and faster switching times than rotary valves. There are fewer slider valves in use than rotary valves because they have not been available as long and cannot be used at temperatures and pressures as high as rotary valves can.
Slider sampling valves operate on the same principle as rotary valves, except the active hardware component slides instead of turns. The distance the slider travels is usually small compared with rotary valves, and the energy required to move the slider from one position to the other is low, so that these valves switch very quickly. In addition, slider valves have lower internal volumes
Introduction to GC Inlets
Valves 10
Introduction to GC I
than rotary valves, so that injected peaks are not broadened while passing through channels in the valve. The combination of fast switching speed and low internal volume makes slider valves more suitable for high-resolution analyses than rotary valves.
Valve connection to packed columns
Valves can be connected directly to packed columns or connected via an intermediate transfer line. The carrier gas flow to the valve comes from a mass flow controller or from a packed-column direct inlet. The main benefit of connecting valves in series with GC inlets is that the analyst can use both the inlets and the valves without replumbing the chromatographic system.
Figure 38A illustrates a typical series-type connection of a gas sampling valve to a packed column direct inlet. The connection of a liquid sampling valve would be the same except that the valve would not be mounted in a heated valve box. Carrier gas is diverted from the base of the inlet to the valve with small id empty tubing. Another piece of empty tubing connects the outlet of the valve to the column in the GC oven. This tubing should either be traced with heating tape or enclosed in a larger piece of aluminum tubing (to conduct heat from the valve box) to prevent condensation of sample on cold spots between the valve and the GC oven.
nlets 121

122
10 Valves
Figure 38 In-series connection of gas sampling valves and inlets to packed column inlet (A) and split inlet (B).
A
B
Carrier in,30 mL/min
Sample
Drain30 mL/min
GC ovenHeated valve box
Sample
Drain
Heated valve box
GC oven
30 mL/min
Capillary inlet
30 mL/min
Septum purge,3 mL/min
Split vent,25 mL/min
2 mL/min
Capillary column
Packed column
carrier
Introduction to GC Inlets

Valves 10
Valve connection to capillary split inlets
Introduction to GC I
When connecting valves to capillary columns (Figure 38B), a split inlet must be used to keep initial peak widths narrow. In this configuration, carrier gas flows to the valve first and then to the split inlet. There are several advantages to this:
• Liquid samples can be injected directly into the inlet without going through the valve and transfer lines.
• A high total flow rate (split flow + column flow) from the valve is maintained so that initial peak widths are narrow.
• The sample is split to avoid capillary column overload.
• The split ratio can be adjusted easily in response to sample load, column changes, and sensitivity requirements.
The transfer line from the valve to the inlet should be heated to prevent sample condensation and ghosting.
Sample Considerations
The physical state of a sample dictates whether a liquid or a gas sampling valve should be used. If a gas stream is to be monitored, a gas sampling valve is used, and all transfer lines and the valve are heated as required to prevent condensation or adsorption of the sample on the tubing.
If the stream to be sampled is a liquid, a liquid sampling valve is frequently used, and valve temperature and outlet restrictor are selected to maintain the sample in the liquid state while loading the sample loop. A prerequisite for the use of liquid sampling valves is that all sample components are quickly vaporized when the valve rotates and the loop pressure drops to the column head pressure. Sample components that do not flash vaporize will flood transfer lines, will cause ghosting, and will interfere with subsequent injections.
If the liquid sample does not vaporize quickly when reduced to column pressure, the sample should be vaporized before reaching the valve. In this case, a gas sampling valve is used. The valve and transfer lines (in and out) are heated enough to evaporate the liquid sample before it reaches the valve and to keep it gaseous all the way to the column.
nlets 123
124
10 Valves
Higher boiling or very polar solutes (acidic or basic) may stick to sample lines and valve rotor (polyimide) surfaces. For those samples, nickel or Hastelloy connecting tubing should be used and the sample lines heated to reduce tailing of solutes. Also, it would be helpful to use either a valve with a PTFE rotor (low temperature valve), which is less adsorptive, or a slider valve, which has low surface area exposed to the sample.
Selecting Sample Loop Volume
One microliter of liquid expands several hundred times when evaporated. Therefore, gas sample volumes are typically 200 to 1000 times the volume used for liquid injections. Sample volumes are usually 250 µL for gases and 0.25 µL for liquids when using a split inlet and capillary columns. For packed columns, a 1-mL gas sample or 1-µL liquid sample size is typical.
Changing sample loops (or rotors, in the case of liquid sampling valves) is time consuming, so initial experiments are usually done to determine the required sample volume for the column, inlet, and sample being used. After the sample size has been fixed, the split ratio or loop pressure can be adjusted to alter sample amount as analysis requirements change.
Temperature
Elevated valve temperature is important to guarantee total transfer of the sample to the column, to minimize adsorption of sample to transfer lines and valve components, and to maximize reproducibility.
Rotary gas sampling valves are available in both low- and high-temperature versions (175 °C versus 325 °C), depending on the temperature necessary for the sample. The rotors of low-temperature valves are primarily PTFE; they rotate freely and have low adsorptivity toward polar compounds but will leak and ghost at high temperatures. The rotors in high-temperature valves are usually polyimide or graphite/polyimide and can withstand higher temperatures. However, they are more adsorptive toward polar compounds and may leak or seize at temperatures below 150 °C.
Liquid sampling valves are designed to operate below 75 °C.
Slider valves usually have PTFE sliders (the counterpart to rotors) and are, therefore, limited to temperatures below 175 °C.
Introduction to GC Inlets
Valves 10
Gas valves
Introduction to GC I
Heated gas sampling valves are usually placed in valve boxes (compartments) outside the GC oven so that they can be independently thermostated. Valve temperature should be high enough to ensure rapid and complete transfer of sample to the column or inlet, but not so high that sample decomposition occurs.
The amount of sample contained in the sample loop is inversely proportional to the valve temperature. As the temperature increases, the sample amount decreases, as does sample load on the column and analysis sensitivity. This is why thermostating of the valve is so important for reproducible analysis.
Liquid sampling valves
Liquid sampling valves are usually mounted on the outside of the GC and are not thermostated. If there is problem with sample vaporization, liquid sampling valves can also be mounted in a heated valve box.
Transfer lines
Sample lines going in and out of the valve should be heated above the boiling point of the highest boiling sample component to prevent sample loss, adsorption, and ghosting.
Columns
The initial peak widths from valve injections are often broad, and they are difficult to focus because the compounds are volatile. To get appropriate focusing of these volatile solutes, both stationary phase focusing, using low phase ratio columns and low initial column temperature, and thermal focusing are used.
Flow Rates
Peak broadening increases with increases in the following:
• Sample volume
• Volume of the connecting tubing
• Inlet volume
nlets 125

126
10 Valves
The larger the volume between the valve and the column, the more the sample will be diluted and the wider the initial peak width. This phenomenon becomes less important as the carrier gas flow through the valve increases. Most rotary valves are designed to transfer sample to the column efficiently if carrier flow rate is above 20 mL/min, which is why sampling valves work so well for packed-column analyses.
For maximum efficiency using capillary columns, the sampling valve should be coupled to a split inlet so that a high carrier gas flow rate can be maintained through the valve while providing the reduced flow rate required by capillary columns. The total flow through the valve should be at least 20 mL/min, which is then split between column, split vent, and septum purge flow paths in the split inlet.
Depending on the chromatographic column used, split ratio will change as the column flow rate changes. When using wide-bore columns, most of the flow from the valve will go to the column (column flows of 10 to 15 mL/min), and when using narrow-bore columns (0.2 mm), most of the flow will be vented out the split vent.
Whenever sampling valves are coupled through inlets, it is helpful to use inlet liners with the smallest internal volume. This minimizes peak broadening caused by dilution of the sample as it passes through the inlet. Remember, however, that these inlets are then prone to flashback if liquid samples are introduced by syringe.
Introduction to GC Inlets

Valves 10
Troubleshooting
Introduction to GC I
Most of the problems associated with sampling valves are related to peak broadening in transfer lines and inlets, sample adsorption to the valve or transfer lines, leaks, and perturbations in the baseline.
Peak broadening and tailing
Voids in the flow system (valve and connecting tubing) cause tailing and peak broadening. Use inlets and liners with small internal diameters and connect the valve to the inlet or column with short lengths of connecting tubing of narrow inner diameter.
If the width of early-eluting peaks is too broad, stationary phase or thermal focusing effects should be used with packed-column ports or increased split flow when capillary split inlets are used. Inlets should be equipped with narrow inner diameter liners, and narrow-bore connecting tubing should be used between the valve and inlet.
Baseline shifts
Baseline perturbations are caused by changes in column flow as the valve is rotated and as the sample loop equilibrates to system pressure. Slow valve rotation momentarily stops carrier gas flow; and when the valve stops rotating, a sudden increase in flow occurs which slowly returns to the set point. Check actuator pressure (usually 40 to 75 psi), valve rotor tension, and valve temperature to ensure that the valve rotates as quickly as possible. A restrictor or backpressure regulator can be added to the sample vent line to maintain the sample loop at system pressure. This will reduce the time it takes for the flow to stabilize after the valve is switched.
Variation in peak area and retention time
The amount of sample contained in the loop and, therefore, the amount injected onto the column is proportional to loop pressure and temperature. Variations in pressure and temperature leads to variability in peak areas. Flow restrictors or back -pressure regulators help to maintain constant loop pressure, and valve boxes help maintain temperature.
nlets 127

128
10 Valves
Leaks can occur in the valve itself or at any of the connecting points with transfer lines. Leaks usually cause area irreproducibility, retention time changes, and increases in the area of air peaks (with thermal conductivity detectors). Leaks in rotors can sometimes be fixed by tightening the nuts holding the rotor in the valve body. Leaks in connections are usually found with an electronic leak detector or with a liquid leak detection fluid such as Snoop.
Introduction to GC Inlets

Valves 10
Summary
Introduction to GC I
Table 15 Standard valve practice and procedures
Parameter Selection/Setting Rationale
Gas sample volume 0.25 to 1 mL Use larger loops for larger columns
Liquid sample volume 0.25 to 5 µL Use larger volumes for larger columns
Actuator pressure 45 psi, air Depends on valve design
Valve rotor PTFE Use for temperatures <150 °C
Graphite/Polyimide Use for temperatures 150 to 325 °C
Valve temperature BP of sample + 50 °C Prevent condensation and tailing of gas samples
> BP of heavy component Ensures vaporization of liquid samples
Valve connection to column After inlet Use for packed columns (use small liner)
Through split inlet Use for capillary and PLOT columns
Direct to column Use for packed columnsUse with small internal volumes (microvalves) or capillary columns
nlets 129

130
10 Valves
Table 16 Factors affecting valve accuracy and reproducibility
Symptom Possible cause Solution
Lost peaks (degradation) Valve or transfer line too hot Reduce temperature 50 °C, reevaluate
Transfer line reactivity Use nickel or Hastalloy tubing
Lost or tailing peaks Valve or transfer line too cold Increase temperature 50 °C, reevaluate
Baseline perturbation Valve rotation slow Increase actuator pressure
Rotor distorted Replace rotor
Sample/Column pressure too different Add back-pressure regulator to sample drain
Peak tailing broad peaks Column overload Use smaller sample loopIncrease split flow
Flow too slow Increase column and/or split flow
System voids Check connectionsReduce volume of connecting tubing
Introduction to GC Inlets

GC Inlets An Introduction
11Headspace Autosamplers
Overview 132
Design 133
Sample Considerations 137
Temperature 137
Flow Rates 138
Troubleshooting 140
Summary 141
131Agilent Technologies

11 Headspace Autosamplers
Overview
132
Headspace autosamplers are used in gas chromatography to inject a portion of the gas (headspace) which is in equilibrium with a sample in a sealed, thermostated vial. Headspace sampling is useful for analyzing volatiles in dirty samples, solid samples, samples that contain high boilers that are not of interest, and samples with high water content. These types of samples are encountered in most analytical fields including environmental (volatiles in soil or water), polymer (monomers and residual solvents), foods and flavors (aromas in foods and beverages), and pharmaceutical (residual solvents in precursors and formulations).
Headspace analysis is a valid substitute for many of the analyses currently being done by purge and trap autosamplers. Advantages of headspace sampling in comparison with purge and trap include:
• Headspace instruments are less complex.
• High concentration of water in samples does not affect analyses as much.
• Adsorbent traps are not required.
• There is no chance of breakthrough (loss) of volatile sample components.
• Samples can be heated to increase the volatility of analytes.
• Repeated sampling can be done.
The basic advantage of purge and trap in comparison to headspace analysis is slightly higher sensitivity; purgeables are quantitatively removed from the sample during purging.
The objective in headspace (HS) analysis is to drive the desirable sample components into the headspace for sampling while leaving the undesirable components behind in the vial. Temperature, valve switching times, and sample treatment are manipulated to get as close as possible to this goal.
A qualitative HS technique which makes use of repeated sampling of the same vial is called “multiple headspace extraction.” This technique can compensate for some of the matrix effects encountered with HS analysis and circumvents the need to have a standard in the same matrix as the sample.
Repeated sampling of a single vial can give added information on the relative volatility of sample components. The first sampling of a vial will be high in the most volatile components (early eluting peaks). As these are removed, the distribution of components in the sample changes, and the chromatograms for
Introduction to GC Inlets

Headspace Autosamplers 11
Introduction to GC I
subsequent samplings of the same vial will shift toward late eluting components. Overall sample concentration will be lower with each repeated sampling. This limits the number of times sampling can be repeated. However, concentration decrease is inversely proportional to sample component solubility (the more soluble the sample component, the smaller the decrease in concentration per sampling). This phenomenon can be used to help differentiate polar and nonpolar solutes in a sample.
When using a headspace autosampler with packed columns or with wide bore capillaries and packed column inlets, the headspace sampling valve and most of the system voids are cleared quickly with column flow rates above 10 mL/min, and the initial widths of peaks are narrow. When using columns at flow rates less than 10 mL/min, the HS unit is coupled to the column through a split inlet so that the flow through the HS is greater than 10 mL/min.
Since most of the compounds determined by headspace analysis are very volatile, packed columns, or thick -film capillary columns are usually required to achieve stationary-phase focusing. If stationary-phase focusing is not possible, and the sensitivity requirements of the analysis prevent higher flows from the headspace unit, thermal focusing is required (cryogenic cooling).
Design
Vial temperature, equilibration time, vial pressure, pressurization time, vent time to the sampling valve, and flow rate influence the concentration and distribution of volatile sample components that will reach the GC. For this reason, quantitative headspace analyzers must provide automated control of all of these variables. Autosamplers are usually controlled by a dedicated control module, although control through the GC or data system is sometimes possible.
The usual procedure for quantitative static headspace analysis is to weigh or measure a sample, and often an internal standard, and seal it in a vial. The vial is then:
1 Thermostated
2 Pressurized with inert gas
3 Vented through the sample loop of a gas sampling valve
nlets 133

134
11 Headspace Autosamplers
The gas-sampling valve is activated to inject the sample into the carrier gas stream and into the GC column. The time at each step is programmed by the user before the start of sampling.
Figures 39 through 42 show flow diagrams of the headspace autosampling process. Figure 39 shows that carrier gas flow is split between a bypass to the column and the sample loop through the probe needle. Sample equilibrates in the vial at a preset temperature and time during this first stage of the process. After the sample has equilibrated, the probe needle enters the vial and the vial is pressurized up to 4 bar (Figure 40). This usually takes less than 30 s.
Figure 39 Standby mode—A small flow of carrier gas is purging the loop
Carriergas Loop
Vent
Introduction to GC Inlets

Headspace Autosamplers 11
Introduction to GC I
Figure 40 Pressurixation mode—The probe is down and the vial is pressurized to about 1.3 bar
Figure 41 Vent mode—Headspace vapor flows through the sample loop as the vial is depressurized to atmosphere (operator-selected timing)
Carriergas Loop
Vent
Carriergas Loop
Vent
nlets 135

136
11 Headspace Autosamplers
As shown in Figure 41, when two valves are simultaneously switched under automatic control, the pressurized headspace sample flows out of the vial through the probe, the sample loop, and the vent. The loop-filling (vent) time should be long enough so the loop is filled with sample vapors but not so long that the vapors diffuse out of the loop. Typical vent times are between two and ten seconds. To inject sample, flows are switched again with valves so that all of the carrier gas flow goes through the sample loop to the column.
Headspace autosamplers can either be stand-alone units, which are physically separate from the GC, or units integrated with the GC. In stand-alone headspace autosamplers, the sample usually flows from the headspace unit to the GC through a heated transfer line with a syringe needle at the end. The syringe needle is inserted into the GC inlet just as liquid sample syringes are, although it remains in the inlet throughout the full sampling process.
With headspace units that are integrated with the GC, the transfer line from the sample valve can be coupled directly with packed columns. It also can be coupled indirectly to capillary columns via a splitting device in the GC oven.
Figure 42 Injection mode—The loop contents are swept into the GC injection port. After a preselected time, the system returns to the standby mode (Figure 39)
Carriergas Loop
Vent
Introduction to GC Inlets

Headspace Autosamplers 11
Sample Considerations
Introduction to GC I
To achieve the most reproducible headspace data, sample amount (volume or mass) must be measured accurately and reproducibly and sample matrix effects (varying amounts of water, presence or absence of other components in the sample) must be minimized. Matrix effects may be reduced by:
• Grinding solid samples
• Adjusting pH
• Saturating the water sample with salt
• Saturating an organic or solid sample with water
Sample pretreatment can often help increase the sensitivity of analysis also. Increasing the exposed surface area of solids increases diffusion of volatiles out of the matrix. Saturating a water sample with a salt such as Na2SO4 reduces the solubility of organics in the water and increases their concentration in the headspace. This is sometimes called “salting out.” Changing sample pH can neutralize organic acids or bases in the sample and drive them into the headspace for easier analysis. Saturating organics with water can also drive some components into the headspace. Wetting solids, such as soils, with water or aqueous acids or bases can decrease adsorption interactions and increase the concentration of volatiles into the headspace.
Temperature
Temperature stability and reproducibility are critical for reproducible analyses. Headspace analyzers control vial temperatures by a constant temperature bath (oil, water) or an oven.
The concentration of volatile sample components in the headspace is directly related to the temperature of the sample. Increasing the sample temperature drives more volatiles into the headspace and increases sensitivity; however, excessive temperature can increase interferences and can cause sample degradation. When little is known about a sample a priori, it is best to set the initial vial temperature low (for example, 40 °C) and run a test chromatogram. If sensitivity is a problem, increase vial temperature by 25 °C and try again.
Transfer line and valve temperatures should be higher than the boiling point of the highest boiling headspace component to prevent adsorption or condensation between the autosampler and the GC.
nlets 137

11 Headspace Autosamplers
Flow Rates
138
When adjusting the flows of gases to the headspace unit and columns, some flow comes from the HS unit and some from the GC. As is illustrated in Figure 43A, for a 0.53-mm id column and packed-column direct inlet at 20 mL/min total flow, 10 to 15 mL/min should come from the HS unit and 5 to 10 mL/min from the GC flow controller (set the GC flow with the standard mass flow controller first, then add headspace autosampler flow).
When using narrow-bore columns and split inlets, a total flow rate of 20 mL/min is typical, with 10 mL/min coming from the headspace unit and 10 mL/min from the GC (Figure 43B). The split ratio is adjusted to change sample load on the column in response to sample and analysis requirements.
Introduction to GC Inlets

Headspace Autosamplers 11
Introduction to GC I
Figure 43 Flow paths for connection of a headspace autosampler to a packed column direct inlet (A) and a split inlet (B)
A
B
Controller
15 mL/min
5 mL/min
20 mL/min
10 mL/min
10 mL/min
2 mL/min
Septum 3 mL/min
Split 15 mL/min
Controller
nlets 139

11 Headspace Autosamplers
Troubleshooting
140
The main problems with headspace sampling involve irreproducibility, lack of sensitivity, and decomposition. Peak broadening is not much of a problem with headspace analysis, because it can be prevented by properly setting flow rates and using solute focusing techniques.
Since the timing of each of the sampling events in headspace analysis affects the quantity of sample reaching the column, appropriate selection of conditions is critical for maximum sensitivity and reproducibility. If the vial equilibration time is too short, the concentration of volatiles in the headspace is decreased, and sensitivity and reproducibility decrease.
If the vial pressurization time is too short, there will not be enough force to move the sample to the valve, and sensitivity and reproducibility decrease. Short vent times do not permit the sample to move from the vial to the sample loop. Vent times that are too long permit sample to diffuse out of the sample loop, reducing sensitivity and reproducibility. Injection times that are too short result in partial injections and in lower sensitivity and reproducibility.
Ghosting and baseline perturbations can result from contamination of septum or autosampler flow lines and from carryover of liquid sample into the sampling needle. Transfer lines should be clean and heated sufficiently to prevent condensation or adsorption of sample components. Samples should not occupy more than 75% of the vial volume to prevent contact with the autosampler needle.
Sample contamination can occur if the sample is exposed to room (laboratory) air. Ambient air contains many organics that will adsorb/partition in samples and will be present in the vial headspace. Compare results for samples that were exposed for different times to test for presence of contaminants and run a “blank” sample of room air in a sealed vial to determined contributions from ambient air. To prevent contamination, minimize the time that the sample is exposed to room air and/or blanket the sample with argon before sealing the vial. Contamination is also minimized by using a purged sample preparation enclosure for preparation, weighing, and sealing the sample in the sample vial.
Introduction to GC Inlets

Headspace Autosamplers 11
Summary
Introduction to GC I
Table 17 Standard headspace practice and procedures
Parameter Selection/Setting Rationale
Connection to GC Through split inlet For capillary columns
Through direct inlet For large-bore capillary and packed columns
Direct to column For wide-bore packed columns
Packed-column flows
Headspace flow rate 20 to 35 mL/min Clears sample lines
GC flow 5 to 10 mL/min Sweep inlet of vapors
Capillary split flows
Headspace flow 10 to 20 mL/min Clears sample linesLower flow yields less split flow
GC flow 5 to 10 mL/min Sweeps inlet
Split flow 10 to 25 mL/min For wide-bore capillary (5 to 10 mL/min column flow)
10 to 30 mL/min For small-bore capillary (1 to 5 mL/min column flow)
Injection parameters
Vial temperature Depends on sample
Valve temperature Bath temperature + (5 to 10 °C) Prevents condensation
Vial equilibration time 10 to 45 min Depends on sample type and amountLong time for solids
Vial pressurization time 20 s Prepares vial for venting
Vial pressure 1.2 to 1.4 bar Higher pressure dilutes sample
Vent time 2 to 10 s Vents vial to sample valve
Injection time 10 to 30 s Use longer times with slower HS flow
nlets 141

142
11 Headspace Autosamplers
ffecting headspace accuracy and reproducibility
Table 18 Factors aSymptom Possible cause Solution
Sample degradation Transfer lines too hot Reduce temperature
Vial temperature too hot Reduce bath temperature
Baseline perturbations Valve resetting during run Increase inject time
System contamination Bake out valve and transfer lineClean or replace sampling needle
Peak tailing, broad peaks System flow too slow Increase headspace flowDecrease GC flowIncrease split flow
System voids Check connectionsReduce liner volume (id)Reduce volume of connecting tubing
Insufficient focusing Use column with lower ßLower initial column temperature
Peak areas too small Equilibration time too short Increase time
Vial temperature too low Increase 20 °C, evaluate
Vent time too short or too long Adjust
Vial cap leak Use new sampleReseal vial
Leaking inlet septum Replace or tighten septum
Leaking connections Inspect and reseal connections
Split flow too high Reduce split and/or GC flow
Sample contamination Sample exposed too long before sealing Seal immediatelyMinimize transfer times
Ambient air contaminants Purge vial with argon before sealing
Sample carryover Clean sampling needleSample vial too full
Leaching from GC septum Choose different septum type
Introduction to GC Inlets

GC Inlets An Introduction
12Thermal Desorbers
Overview 144
Design 144
Sample Considerations 146
Air sampling 146
Volatiles in solids 147
Desorption temperature 147
Flow rates 147
Troubleshooting 148
Summary 149
143Agilent Technologies

12 Thermal Desorbers
Overview
144
Thermal desorption units provide a quick, reproducible means of liberating volatile analytes from solid samples or adsorbents. The types of samples for which thermal desorption is often used include adsorbent tubes for environmental air sampling, geological samples (dirt, rocks), and polymers. Thermal desorption is an integral part of purge and trap sampling; volatile compounds are concentrated on an adsorbent and then thermally desorbed to the GC for analysis.
Thermal desorption is done by isolating the sample in a flowing stream of carrier gas and rapidly increasing the temperature for a set period of time. This can be accomplished using a dedicated instrument, an analytical pyrolyzer, or a purge and trap sampler.
The time required for complete desorption of analytes is a function of sample matrix, sample size, strength of the interaction between adsorbed analytes and the solid, desorption temperature, and diffusion time of the analytes out of the sample. Thermal desorption is a slow process and usually generates broad peaks, for which solute focusing is required.
Design
Two typical thermal desorber designs are shown in Figure 44. They consist of desorption and control modules. The desorption modules consist of a heater, which rapidly heats the sample from room temperature to temperatures up to 400 °C, and carrier gas flow control. The control modules control the upper desorption temperature and time, and sometimes, the temperature ramp profile.
The ease of connecting sample tubes (or containers) to the desorber depends on the design; however, all designs must provide a leak -free seal to prevent sample loss and exposure to air.
In Figure 44A, a heated transfer line connects the desorption unit to a standard inlet on the GC. The sample line must be heated to prevent loss of sample and peak broadening. As with headspace autosamplers, connection of
Introduction to GC Inlets

Thermal Desorbers 12
Introduction to GC I
the thermal desorber should be done through a split inlet for capillary analyses. This helps minimize peak broadening and accommodates the high flow rates necessary for efficient thermal desorption.
In Figure 44B, the desorption unit connects to the GC, and the analytical column feeds directly into the desorber. With this design, a cryogenic trap is provided to thermally focus the broad desorption peak under high flow rate. The cryogenic trap is then heated rapidly to transfer the sample to the column at normal column flow rates.
Figure 44 Typical thermal desorption system connected to GC
GC
GC
Sampletube
Heater
Remote desorptionmodule
Carrier gasController
Heated transfer lineA
B Carrier gas
Thermal desorber
Cryogenic coolant
Desorption vent
Cryogenic trap
Controller
nlets 145

12 Thermal Desorbers
Sample Considerations
Air sampling
146
For environmental air sampling and ambient air monitoring in the work place, the thermal desorption “sample” is actually a tube packed with a known amount of adsorbent (carbon, Tenax, silica gel, or mixture), as shown in Figure 45. A known amount of air is drawn through the tube using a calibrated vacuum pump. Analytes of interest adsorb and concentrate on the adsorbent. In some cases, several hundred liters of air must pass through the adsorbent tube to concentrate analytes enough to be quantified. The tube is then sealed and transported to the laboratory where it is installed in the thermal desorption unit.
The sample can be contaminated or may decompose between the time it is collected (adsorbed) and the time it is desorbed for analysis. Adsorbent tubes should be sealed to prevent contamination and kept cool to reduce sample loss.
Some air samples may contain components that are very hard to desorb due to high polarity, activity, or reactivity (for example, some sulfur, nitrogen, hydroxy- or carboxy-containing compounds); however, these analytes are often even more difficult to sample by other means due to low analyte concentration or high lability. In these cases, it is sometimes helpful to use a sampling tube that contains a chemical that will selectively react with the compound of
Figure 45 Typical configurations of adsorption tubes for thermal desorption
Single adsorbent
Mixed adsorbent
Solid sample
Glasswool
Glasswool
Introduction to GC Inlets

Thermal Desorbers 12
Introduction to GC I
interest to form a more stable product. The adsorbed reaction product can then be desorbed and analyzed; however, this approach requires considerable development time and effort.
Volatiles in solids
Solid samples, such as polymers, in which residual solvents and monomers are to be determined, may have to be ground up to increase surface area. This also increases the diffusion rate of analytes out of the solid matrix and provides a representative sample.
Solid sample size requirements depend on the instrument being used, concentration of volatiles, and the type of gas chromatographic column used. Small sample sizes are preferred because desorption speed is faster and initial peak width is narrower compared with initial peak width for large sample sizes. The minimum sample size is restricted by analytical sensitivity and sample-handling requirements.
Desorption temperature
The key to successful thermal desorption is a fast, reproducible desorption temperature ramp. The higher the ramp rate and the final temperature are, the faster the desorption of analytes from the solid, and the narrower the initial peak widths are; however, upper temperature is limited by sample and adsorbent lability. Many of the common polymer adsorbents used for air sampling degrade at temperatures above 300 °C. For most air analyses, however, desorption temperatures do not need to exceed 200 °C.
Multiple temperature ramps can be used for selective or sequential desorption of the solutes of interest. This is useful for samples that have very volatile solutes on the surface of the solid (solvents), and less volatile material in the bulk (plasticizers).
Flow rates
During the desorption process, flow rate through the desorber should be fast enough to transfer sample efficiently to the GC inlet or column. When desorbers with transfer lines are used, packed column flow rates (for example, 30 mL/min) are usually required to sweep sample through this extra connection volume. When using a split inlet, most of this flow should be split out the vent, as is done with headspace analyzers.
nlets 147

148
12 Thermal Desorbers
With desorbers that have cryogenic traps between the desorption zone and the column, high flow rates can be used during desorption into the trap. Capillary column flow rates are then used during vaporization of the focused peak from the trap to the column.
Troubleshooting
Most of the problems associated with thermal desorption relate to peak broadening, incomplete sample desorption, or sample decomposition. Reproducible desorption from air sampling tubes requires that the appropriate adsorbent be selected for the analytes of interest, and that the maximum recommended temperature limit of the adsorbent not be exceeded. Appropriate adsorbents trap analytes efficiently and then thermally desorb them quickly and quantitatively.
Degradation during thermal desorption leads to ghosting and interference with subsequent analyses (system contamination). Degradation decreases with decreases in desorption temperature and time.
Peak broadening can be minimized by reducing sample size, and by increasing desorption temperature and ramp rate. The length and volume of the connecting tubing and fittings should be as small as possible to prevent additional peak broadening.
Introduction to GC Inlets

Thermal Desorbers 12
Summary
Introduction to GC I
Table 19 Factors affecting thermal desorption accuracy and reproducibility
Symptom Possible cause Solution
Sample degradation Desorption too hot Reduce desorption temperature
Baseline System contamination Clean transfer linesBake out system
Peak tailing, broad peaks System flow too slow Increase system flow
System voids Check connectionsReduce liner volumeReduce volume of connecting tubing
Desorption speed too slow Increase temperature rampDecrease sample sizeIncrease flow rate
Column overload Reduce sample sizeIncrease split flow
Peak areas too small Leaking connections Inspect and reseal connections
Desorption temperature too low Increase temperature and/or time
Sample contamination Sample exposed too long before sealing Seal immediatelyMinimize transfer times
nlets 149

150
12 Thermal Desorbers
Introduction to GC Inlets

GC Inlets An Introduction
13Purge and Trap Samplers
Overview 152
Design 153
Sample Considerations 154
Temperature 154
Flow Rates 155
Troubleshooting 156
Summary 158
151Agilent Technologies

13 Purge and Trap Samplers
Overview
152
Purge and trap samplers are designed for the environmental analysis of volatile components in water. They can be used for other samples if the minor sample components are more volatile than the major component (for example, fragrances in beverages). The system uses a combination of dynamic headspace, adsorbent trapping, and thermal desorption.
In most purge and trap analyses, helium is purged through the sample in a sealed system and the volatiles are continuously swept through an adsorbent trap to concentrate and focus the purgeables. After a set time, the sample purging is stopped, carrier gas is directed through the trap, and the trap is rapidly heated to desorb sample to the gas chromatograph.
As is the case with thermal desorption, thermal and/or stationary phase focusing is sometimes necessary with purge and trap analyses to achieve chromatographic resolution of early eluting solutes due to the wide initial peak widths.
Many of the volatile compounds analyzed by purge and trap methods also can be analyzed using headspace analysis; however, in comparison to headspace analyses, purge and trap sampling has several advantages, including:
• High sensitivity (purgeables are quantitatively removed from the sample and concentrated on the trap)
• Well-established and widely used methods for environmental analysis
Since most samples analyzed by purge and trap units are aqueous, a large quantity of water is collected on the adsorbent trap along with the volatiles of interest. The water is liberated during thermal desorption and condenses in the chromatographic column. Because water can reduce significantly the accurate quantification of important sample components, silica gel is often added to other adsorbents in the trap. Because silica gel has a much higher affinity for water than it does for the sample components of interest, it reduces the amount of water reaching the column while passing the important analytes.
Placement of drying tubes or water-selective adsorbents in the flow path between the purge and trap sampler and the GC column is more effective for water removal than adding silica gel to the trap; however, it is more complicated and expensive.
Introduction to GC Inlets

Purge and Trap Samplers 13
Design
Introduction to GC I
Figure 46 shows the flow diagram for a typical purge and trap system. A water sample (5 to 20 mL) is injected into the sample tube and is equally distributed (seeks a level) between the sample tube and reservoir. A purge gas valve then is actuated to purge volatile sample components from the sample and carry them to the adsorbent trap. The trap is typically a 30 cm × 3 mm stainless steel tube filled with a mixture of Tenax, silica gel, and charcoal. During the purge process, all the sample moves into the sample tube above the glass frit. The purge gas (usually helium) is dispersed into small bubbles as it passes through the frit.
Figure 46 Flow diagram for a typical purge and trap autosampler
Purge gasinlet
Sampletube
Glassfrit
Adsorbenttrap
To vent
Reservoir
6-portvalve
GC carriergas
GC
To detector
Optionalwaterremoverand/orcryogenictrap
nlets 153
154
13 Purge and Trap Samplers
After a preselected purge time (10 to 15 min) the purge valve is closed, and a 6-port sampling valve is rotated to direct carrier gas through the trap in the reverse direction. The trap then is heated rapidly (200 to 800 °C/min) to desorb sample to the GC inlet or column. Purge and trap autosamplers usually are connected to the GC via heated transfer lines.
A cryogenic trap can be placed between the purge and trap sample and the GC to focus the sample peak. Also a water trap can be placed between the sampler and the GC to reduce the amount of water reaching the column.
Sample Considerations
Samples may lose volatile components between the times of collection and analysis, or they may be contaminated during handling; therefore, proper sealing, cooling, and handling of samples is important for reproducible analyses.
Standard addition or internal standard methods are preferred for quantitative analyses to reduce the influence of variability in time, temperature, flow, and effectiveness of the adsorbent.
Temperature
Sample purging is usually done at room temperature. Thermostating is not considered important as long as the purge time exceeds the time necessary to remove purgeables quantitatively from the sample.
The adsorbent trap is usually maintained at room temperature during purging. The trap is heated rapidly (200 to 800 °C/min) to desorb analytes to the GC. The temperature required to desorb analytes depends on the type of adsorbent and analytes, but it is below 200 °C for standard environmental analyses.
The transfer line should be heated to prevent adsorption or condensation of analytes. A transfer line temperature of 80 °C is typical for environmental analyses.
Introduction to GC Inlets

Purge and Trap Samplers 13
Flow Rates
Introduction to GC I
Purge flow rates depend on sample type and analyte concentration, as well as on the strength of interaction between the trap and the purgeables. Typical purge flow rates range from 20 to 60 mL/min for helium. Even though nitrogen can be used for purging samples, helium is better because it is less soluble in water and displaces volatiles more efficiently.
The flow rate for carrier gas through the trap during desorption is from 5 to 10 mL/min for wide-bore capillary columns, and from 30 to 40 mL/min for packed column analyses.
nlets 155
13 Purge and Trap Samplers
Troubleshooting
156
Variability in purge and trap data can come from several sources:
• Temperature or time variation during purging
• Flow variation during purging
• Breakthrough of sample from the adsorbent trap
• Contamination of the trap
• Degradation of sample on the trap
• Slow desorption from the trap
• Influence of water on chromatographic peak shape and retention
Accuracy and reproducibility are improved significantly by using internal standards which correct for variability in ambient conditions and flow rates.
Even when traps with silica gel adsorbents are used, water can still be desorbed to the GC, causing peak distortion and shifting retention times. Water traps (condensation tubes, semipermeable membranes) are very effective for reducing the amount of water reaching the column.
Peak broadening due to slow desorption can be narrowed by optimizing adsorbent type and amount, desorption temperature, and desorption flow rate. Increasing stationary-phase focusing and adding a cryogenic trap between the sampler and the GC are also helpful for minimizing peak broadening.
Peak broadening also can be caused by diffusion, adsorption, and/or condensation in connecting tubing and transfer lines. To mediate these sources of peak broadening, the amount of connecting tubing should be minimized, and all transfer lines between the trap and the GC should be heated.
Since the trap is fixed in the purge and trap unit, it can be reused. If a sample contaminates the trap, it will affect all subsequent samples by reducing trap capacity (increasing breakthrough), changing desorption characteristics, and/or by creating ghost peaks. Contaminated traps must be replaced.
All adsorbent traps lose capacity with use. As adsorbent capacity decreases, the probability of sample breakthrough increases. Breakthrough is manifested by decreased sensitivity and reproducibility. For this reason, most traps are replaced on a regular basis.
Introduction to GC Inlets

Purge and Trap Samplers 13
Introduction to GC I
Sample degradation is a function of analyte, trap activity, transfer line temperature, and desorption temperature. Sensitivity, reproducibility, and accuracy decrease as degradation increases. Degradation can be minimized by using trap adsorbents which have weaker interaction with the solute and by lowering desorption and transfer line temperatures.
nlets 157

13 Purge and Trap Samplers
Summary
158
Table 20 Standard purge and trap practice and procedures
Parameter Selection/Setting Rationale
Sample size 5 to 25 mL Depends on sample
Sample purge rate 20 to 60 mL/min helium Depends on sample and adsorbent type
Purge time 10 to 15 min Required to remove all purgeables
Purge temperature Ambient Does not usually require thermostatting
Solute trap 24 to 30 cm × 3 mm Depends on instrument
Trap adsorbent Tenax, charcoal, silica gel Depends on sample
Transfer line temperature 80 °C Prevents sample loss
Desorption ramp rate Ballistic (200 to 800 °C/min) Faster rates = narower initial peak width
Final desorption temperature 180 °C for 4 minutes Depends on sample and adsorbent
Trap desorption flow 5 to 10 mL/min Use for wide-bore capillaries
30 to 40 mL/min Use for packed columns
Connection to GC Packed column inlet Use for large-bore or packed columns
Introduction to GC Inlets

Purge and Trap Samplers 13
Introduction to GC I
Table 21 Factors affecting purge and trap accuracy and reproducibility
Symptom Possible cause Solution
Baseline perturbations System contamination Clean transfer lines
High water background Use a different trapUse a water-removal devicePurge sample for a shorter time
Peak tailing, broad peaks Desorption flow too slow Increase desorption flowDecrease GC flow to inlet
Slow desorption Reduce amount of adsorbentUse a different adsorbentIncrease ramp rate
System voids Check connectionsReduce inlet liner volumeReduce volume of connecting tubing
Interference from water Use a different trapUse a water-removal devicePurge sample for a shorter time
Transfer line temperature low Increase line temperature
Peak areas too small Sampling time too short Increase purge time
Adsorbent not working Replace adsorbent tube
Leaking connections Inspect and reseal connections
Sample contamination Sample exposed too long before sealing Seal vial immediatelyMinimize transfer times
Sample carryover Clean sampling linesReplace trap
nlets 159

160
13 Purge and Trap Samplers
Introduction to GC Inlets

GC Inlets An Introduction
14Analytical Pyrolyzers
Overview 162
Design 164
Resistively heated pyrolyzers 164
Curie-Point pyrolyzers 166
Microfurnace pyrolyzers 167
Sample Considerations 168
Temperature 169
Flow Rates 169
Troubleshooting 170
Summary 171
161Agilent Technologies
14 Analytical Pyrolyzers
Overview
162
Pyrolysis is useful for analyzing samples such as polymers (plastics, paints, fibers), biological samples (bacteria, viruses, biopolymers), and geological samples (coal, rocks). The primary disciplines that routinely use analytical pyrolysis are polymer and forensic laboratories.
Analytical pyrolysis involves the thermal cleavage of large molecules into smaller molecules (usually above 400 °C). A measured sample is heated in an inert atmosphere to temperatures that cause thermal degradation. The resulting fragments (pyrolysates) are more volatile than the starting sample and can be separated by gas chromatography, yielding characteristic “fingerprints” (pyrograms). The types and quantities of the pyrolysates are related to the original sample components.
The higher the pyrolysis temperature, the greater the degree of fragmentation and rearrangement reactions. This leads to more complex pyrograms with more early eluting peaks. Figure 47 compares pyrograms of polyethylene at 700 and 1000 °C. The 1000 °C pyrolysis has a much larger proportion of small molecular weight pyrolysates and a lower proportion of high molecular weight pyrolysates compared to the 700 °C pyrolysis.
Introduction to GC Inlets

Analytical Pyrolyzers 14
Introduction to GC I
The combined use of selective detectors (for example, mass-selective, atomic emission, and infrared detectors) can often simplify data analysis considerably. If selective detection is not used, standards of known molecular structure are required to correlate fragmentation pattern to the original molecular structure.
Because pyrograms can be very complex, mathematical techniques (pattern recognition) are useful to help identify key pyrolysates that differentiate sample types. Often only a small subset of the several hundred peaks in the pyrogram is important to identify unequivocally an unknown within a class of compounds. Once these peaks have been identified, an analytical method may be developed to focus on them (by optimizing the chromatography or by using selective detectors) and to simplify the analysis.
In those fields where it is necessary to characterize combustion products from a sample, analogous information can be gained more simply by pyrolyzing the sample in an oxidizing or reducing atmosphere (air or H2). The substitute
Figure 47 Total ion chromatograms (mass spectral) for the pyrolysis of 0.35 mg of polyethylene at 1000 °C (A) and 0.45 mg at 700 °C (B). Numbers above the clusters indicate the length of the carbon chain of the hydrocarbons in the cluster.
A
B
C2
C3C4
C5
C6
C7
C8C9
C10
C22
nlets 163

164
14 Analytical Pyrolyzers
atmosphere is plumbed to the pyrolysis interface and flows only during the pyrolysis. Inert carrier gas is then used during the chromatographic analysis of pyrolysates.
Design
There are several types of pyrolyzers available for analytical pyrolysis. All pyrolyzers provide the same function—high temperature pyrolysis of samples—but they achieve it in different ways. Three of the most common types are:
• Platinum resistively heated
• Curie point
• Microfurnace
The important features that differentiate pyrolyzers are their ease of use, flexibility in temperature program and range, and cost. In general, the more flexible and easier to use a pyrolyzer is, the more expensive it will be.
Resistively heated pyrolyzers
Resistively heated pyrolyzers use sample probes with platinum ribbons or coils to heat the sample (Figure 48). These pyrolyzers are very flexible but can be expensive relative to other styles. With resistance-heated devices, the maximum pyrolysis temperature can be adjusted continuously up to 1400 °C and ramped at rates up to 20 °C/ms.
Introduction to GC Inlets

Analytical Pyrolyzers 14
Introduction to GC I
Liquid samples are aliquoted by syringe onto a ribbon probe. Solvent is then flash vaporized at a temperature just above its boiling point. Solid sample is placed in a quartz tube between plugs of quartz wool. The tube is then inserted within the coil of a coil probe.
Before pyrolysis, the probe containing sample can be:
• Inserted directly into a packed column inlet (this usually requires horizontal inlet orientation)
• Inserted into a heated interface that is coupled to the GC inlet through a syringe needle assembly or with a special seal that replaces the septum cap of the inlet
• Inserted into a stand-alone unit that has trapping and focusing capabilities. These units are coupled to the GC with a transfer line as is done with some headspace autosamplers.
A unique advantage of resistance pyrolyzers is that thermal desorption of volatiles can be done at a low temperature prior to pyrolysis of the bulk solid. This is useful in profiling solvents, dissolved gases, or residual monomers in a polymer sample.
Figure 48 Example of a resistively-heated pyrolyzer
Platinum coil
Liquidsample
Heated interface
Platinum ribbonGC
Inlet
Column
Carriergas
Solid sample
Glass wool
nlets 165

14 Analytical Pyrolyzers
Curie-Point pyrolyzers
166
Curie-point pyrolyzers provide very fast temperature ramp rates and very reproducible final temperatures. Curie-point pyrolyzers are usually less expensive than resistively heated pyrolyzers; however, they are not nearly as flexible.
Curie-point pyrolyzers work by ferromagnetic heating of a wire or foil to its Curie point. The specific blend of metals comprising the wire or foil dictates its Curie point and, therefore, the final sample temperature and extent of pyrolysis.
A typical Curie-point pyrolyzer design is shown in Figure 49. Heating takes place ballistically in an interface that couples radio frequency (RF) energy to the ferromagnetic alloy. Each alloy has only one possible final temperature. A variety of alloys must, therefore, be kept on hand when developing methods or analyzing different sample types.
For Curie-point pyrolysis, liquid samples are placed onto a wire (the wire is dipped into sample, or sample is aliquoted onto the wire with a syringe). Solid samples are wrapped in pyrolysis foil. The sample wire or foil is placed into a quartz tube which is then inserted into the pyrolysis interface.
Figure 49 Example of a Curie-point pyrolyzer
Solid sample
Foil
Wire
Liquid sample
Sample tube
Carrier gas
GCInlet
Column
Introduction to GC Inlets
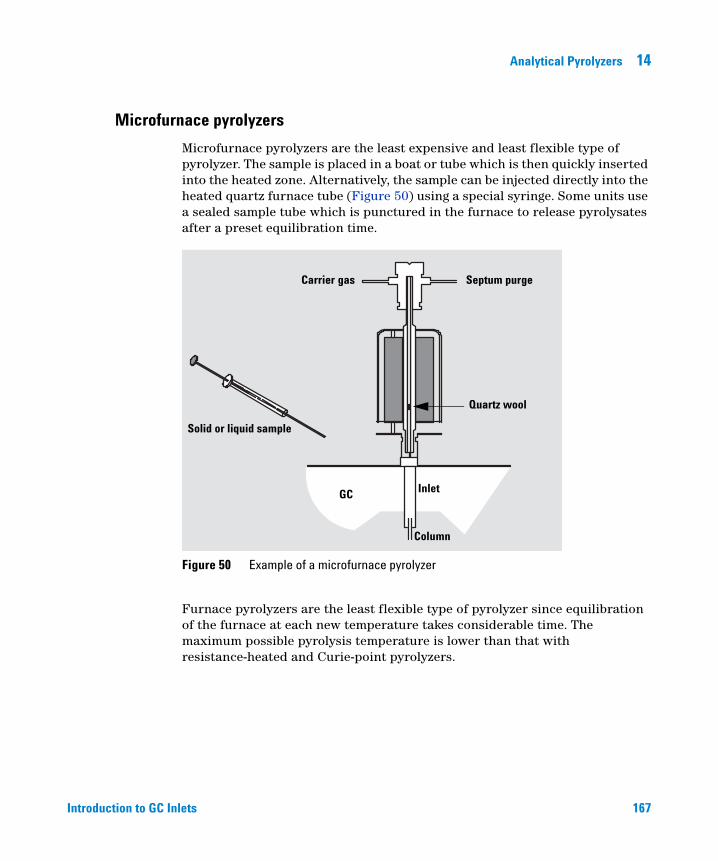
Analytical Pyrolyzers 14
Microfurnace pyrolyzers
Introduction to GC I
Microfurnace pyrolyzers are the least expensive and least flexible type of pyrolyzer. The sample is placed in a boat or tube which is then quickly inserted into the heated zone. Alternatively, the sample can be injected directly into the heated quartz furnace tube (Figure 50) using a special syringe. Some units use a sealed sample tube which is punctured in the furnace to release pyrolysates after a preset equilibration time.
Furnace pyrolyzers are the least flexible type of pyrolyzer since equilibration of the furnace at each new temperature takes considerable time. The maximum possible pyrolysis temperature is lower than that with resistance-heated and Curie-point pyrolyzers.
Figure 50 Example of a microfurnace pyrolyzer
Solid or liquid sample
Carrier gas Septum purge
Quartz wool
GC Inlet
Column
nlets 167

14 Analytical Pyrolyzers
Sample Considerations
168
Samples selected for pyrolysis should be representative of the bulk sample. Solid samples have a higher probability of being inhomogeneous than do liquid and gas samples. Some form of sample treatment may be necessary to get an accurate pyrogram.
If the sample is soluble or suspendable in a solvent (sonication helps), then homogenizing becomes easier and the sample can be reproducibly aliquoted directly onto a pyrolysis wire or foil. Afterward, the solvent can be evaporated actively or passively, leaving a small representative solid sample stuck to the foil.
Solid samples that cannot be suspended in solvent, or that will not stick to the foil when the solvent is evaporated, must be placed within a quartz tube bracketed by quartz wool (resistively heated pyrolyzers), sealed within pyrolysis furnace boats (furnace pyrolyzers), or folded inside Curie-point pyrolysis foil.
Sample sizes should be less than 50 mg, the smaller the better. Large samples yield irreproducible results because of inconsistent secondary reactions, problems with thermal gradients within the sample, and slow diffusion of pyrolysates out of the sample. The minimum solid sample size that can be used practically is often dictated by the analyst’s ability to prepare and weigh the sample.
Small sample sizes are easier to measure if the sample is dissolved. A syringe can then be used to deposit the dilute sample onto a wire or ribbon. When the solvent is evaporated, a very small, reproducible amount of sample remains. Concentration of dilute samples can be achieved by repeating the sample deposition process.
Care must be taken when handling samples for pyrolysis; finger oils, lab bench particulates, and other contaminates can cause spurious peaks in the pyrogram. For maximum reducibility samples must be placed in sample tubes, on wires, and on ribbons because there are temperature gradients over the heated zone. Centering samples in the middle of the zone is best, because that is usually the hottest part.
Introduction to GC Inlets

Analytical Pyrolyzers 14
Temperature
Introduction to GC I
Reproducible pyrolysis temperature is important. This is dependent on reproducibility in sample amount, location of sample in the hot zone, temperature ramp rate, ending temperature, and final hold time. Some pyrolyzers incorporate a feedback mechanism which adjusts heating power during the pyrolysis to compensate for differences in sample conditions.
The appropriate pyrolysis temperature depends on the sample and analytical requirements. Higher pyrolysis temperatures cause more complex pyrograms, stressing lower molecular weight fragments and increasing overall sensitivity. Lower pyrolysis temperatures reduce secondary reactions and rearrangements and stress higher molecular weight fragments that can be important for identifying original molecular structures.
The minimum temperature required for pyrolysis depends on the sample and matrix. Excessive pyrolysis temperature fragments the sample into such small molecules that they do not provide the information necessary to identify the original sample or to differentiate it from similar samples.
The usual procedure to determine a suitable pyrolysis temperature is to screen replicate samples at several temperatures (for example, 450 °C, 600 °C, 800 °C) and then compare pyrograms. Selective detectors are very useful during the screening process to help track secondary pyrolysis and to relate pyrolysates to original sample components.
Flow Rates
Carrier gas flows over the sample during pyrolysis transferring pyrolysates to the column and limiting the contact time of gaseous components in the high-temperature zone. Most pyrolyzers are efficiently swept with packed column flow rates (for example, 30 mL/ min). When capillary columns are used for analysis, the pyrolyzer should be interfaced to the GC through a split inlet, with a majority of the flow being vented (split ratio from 1:10 to 1:50).
When traps (cryogenic and/or adsorbent) are used to focus pyrolysates between the pyrolyzer and the GC, higher flows can be used during the pyrolysis and trapping. When desorbing sample from the trap to the GC, carrier gas flows that are consistent with column requirements should be used.
nlets 169

14 Analytical Pyrolyzers
Troubleshooting
170
Irreproducibility and peak broadening are the major sources of trouble with analytical pyrolysis. The smaller the sample, the more reproducible is the pyrolysis and the narrower the initial peak width.
Contamination of the pyrolysis interface can lead to ghosting and loss of pyrolysates. Glass or quartz interface liners and fused silica transfer lines help reduce adsorption and catalytic degradation of pyrolysates.
Catalytic activity of pyrolysis wires and foils, or of the lining of the interface, can affect pyrolysis fragmentation reactions and the profile of the resulting pyrogram. Consistency in the alloys and pyrolysis temperatures will increase analytical reproducibility.
Peak tailing can result from adsorption in transfer lines and peak dilution in interfaces and connections. Heating transfer lines and minimizing the volume of connecting tubing and interfaces help to minimize tailing.
Introduction to GC Inlets
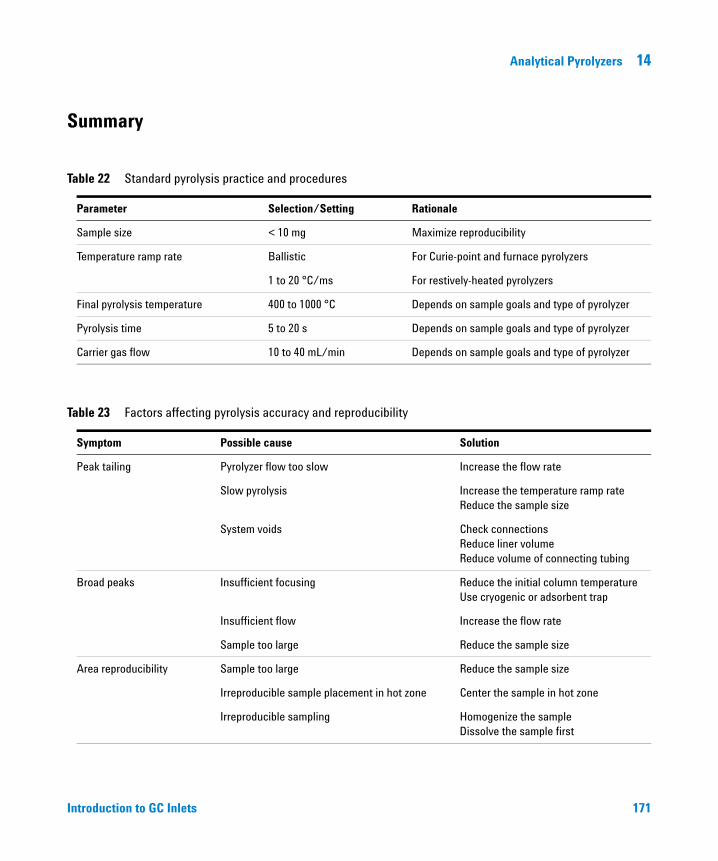
Analytical Pyrolyzers 14
Summary
Introduction to GC I
Table 22 Standard pyrolysis practice and procedures
Parameter Selection/Setting Rationale
Sample size < 10 mg Maximize reproducibility
Temperature ramp rate Ballistic For Curie-point and furnace pyrolyzers
1 to 20 °C/ms For restively-heated pyrolyzers
Final pyrolysis temperature 400 to 1000 °C Depends on sample goals and type of pyrolyzer
Pyrolysis time 5 to 20 s Depends on sample goals and type of pyrolyzer
Carrier gas flow 10 to 40 mL/min Depends on sample goals and type of pyrolyzer
Table 23 Factors affecting pyrolysis accuracy and reproducibility
Symptom Possible cause Solution
Peak tailing Pyrolyzer flow too slow Increase the flow rate
Slow pyrolysis Increase the temperature ramp rateReduce the sample size
System voids Check connectionsReduce liner volumeReduce volume of connecting tubing
Broad peaks Insufficient focusing Reduce the initial column temperatureUse cryogenic or adsorbent trap
Insufficient flow Increase the flow rate
Sample too large Reduce the sample size
Area reproducibility Sample too large Reduce the sample size
Irreproducible sample placement in hot zone Center the sample in hot zone
Irreproducible sampling Homogenize the sampleDissolve the sample first
nlets 171

172
14 Analytical Pyrolyzers
Introduction to GC Inlets

GC Inlets An Introduction
AGas Volumes of Solvents
Table 24 Approximate gas volumes of common solvents per 1 µL injected at several inlet temperatures and pressures
Head Pressure, Inlet temperature, °C
Solvent kPa 100 200 300
Ethyl acetate 69 (10 psig)138 (20 psig)207 (30 psig)
186133103
236168131
286203158
Hexane 69138207
13910077
17712698
214152119
Isooctane 69138207
1107961
1409978
17012194
Methanol 69138207
460329255
584415324
708503392
Methylene chloride 69138207
284203158
360256200
437311242
Methyl t-butyl ether 69138207
15310985
194138108
235167130
Water 69138207
1010 722 561
1282 910 710
15541105 860
173Agilent Technologies

174
A Gas Volumes of Solvents
These values were calculated using the equation:
(2)
where Vg = the resulting gas volume (µL) ‘ V1 = the liquid volume injected (µL)
D = the density of the liquid (g/mL) MW = the molecular weight of the solvent T = the temperature of the inlet (°C) Pi = the inlet pressure P0 = atmospheric pressure.
Vg 2.24 104×V1 D⋅MW
---------------× T 273+273
------------------×Po
Po Pi+------------------×=
Introduction to GC Inlets

GC Inlets An Introduction
BHead Pressures for Capillary Columns
Table 25 Suggested initial head pressures for capillary columns
Helium head pressure Hydrogen head pressure
Column id, mm Column length, m kPa psi kPa psi
0.200.200.20
122550
85–140145–235235–360
12–2121–3434–52
48–8487–145145–230
7–1213–2121–34
0.320.320.32
122550
29–5355–9595–160
4.2–7.77.9–1414–23
17–3233–6060–105
2.5–4.74.8–8.78.7–15
0.530.53
1030
8.5–1624–44
1.2–2.43.5–6.3
5.0–9.714–27
0.7 –1.42.1–3.9
The lower pressures in each range are based on average linear velocities of approximately 30 cm/s for He and 40 cm/s for H2. This yields higher column efficienciescies for late-eluting compounds but longer analysis times compared with the higher pressures.
The high pressures in each range are recommended as a starting point for most analyses and yield a good compromise between efficiency and the speed of analysis over a broad k range.
175Agilent Technologies

176
B Head Pressures for Capillary Columns
Introduction to GC Inlets

GC Inlets An Introduction
CDetermining Split Ratio
Split ratio is the relationship of column flow to split vent flow. This can be column flow relative to split flow (for example, 1:100), or split flow relative to column flow (such as 100:1). The larger number is always assumed to be that for the split vent flow. Knowing the split ratio is necessary for:
• Documenting the analysis so that it can be repeated
• Calculating the amount of sample reaching the column
Calculating Split Ratio
To calculate the split ratio, both split flow and column flow need to be determined accurately. The split flow is measured with a bubble flow meter at the split vent, which is usually accessible at the front or top of the instrument. The column flow can be measured at the detector with a bubble flow meter if using wide-bore capillary columns at high flow rates (above 5 mL/min).
Two phenomena reduce the accuracy of the flow measured by bubble flow meters:
• The diffusion of carrier gas through the bubble (decreases the apparent flow rate)
• The vapor pressure of water (increases the apparent flow rate)
Both of these influences can be reduced or corrected to yield a corrected split ratio (CSR):
(3)
Errors introduced by diffusion of carrier gas through the soap bubble can be reduced by filling the bubble flow meter with carrier gas and bubbles prior to and during flow measurement. This decreases the concentration gradient of
CSR Corrected split flow : Corrected column flow=
177Agilent Technologies

178
C Determining Split Ratio
gas across the last bubble and, therefore, the net flow of carrier gas through the bubble to the low concentration side. For measurement of very low flow rates, use a large-volume connecting tube that is well purged with air prior to flow measurement.
To correct flow rates mathematically for the influence of water vapor pressure on the measurement from a soap bubble flow meter, the following equations are used:
(4)
and
(5)
where SF = Corrected split vent flow CF = Corrected column flow SFa = Split vent flow determined by bubble flow meter (mL/min) CFa= Column flow rate determined by bubble flow meter (mL/min) pa = Ambient pressure (approximately 100 kPa; 1 atm = 760 mm Hg =
14.7 psi = 101 kPa) pw = Vapor pressure of water ( = 2.4 kPa @ 20 °C, 3.2 kPa @ 25 °C,
4.3 kPa @ 30 °C
For small inner diameter columns and low flow rates, column flow rate is more accurately determined by measuring the retention time of a solute that is not retained by the column (t0). Air injections are useful for measuring t0 with thermal conductivity detectors. Methane injections are useful for measuring t0 with flame ionization detectors. Once t0 is known, the volumetric flow rate can be calculated using the column dimensions and the ratio of inlet and outlet pressures:
(6)
SF SFa pa pw–( )⋅
pa-------------------------------------=
CF CFa pa pw–( )⋅
pa--------------------------------------=
CFc 3.14 r2 L⋅ ⋅t0
--------------------------- 2 P3 1–( )⋅3 P2 1–( )⋅---------------------------×=
Introduction to GC Inlets

Determining Split Ratio C
Introduction to GC I
where CFc = Column flow at column temperature r = Column radius (cm) L = Length of the column (cm) P = (Absolute inlet pressure)/(Absolute outlet pressure) t0 = Retention time of the nonretained peak (min)
The column flow rate should then be corrected to room temperature for direct comparison with the split vent flow rate, which was measured at room temperature:
(7)
where CF = Corrected column flow at room temperature CFc = Column flow at column temperature Ta = Ambient temperature, °C Tc = Column temperature at which to was measured, °C
CF CFc 273 Ta+
273 Tc+---------------------×=
Calculating Sample Reaching the Column
Once CSR has been determined, the amount of sample reaching the column after splitting (Amt) can be calculated. For this to be an accurate value, no inlet or needle discrimination must occur during injection.
(8)Amt Amount of sample or solute injectedCSR 1+
---------------------------------------------------------------------------------------=
nlets 179

C Determining Split Ratio
180 Introduction to GC Inlets


Agilent Technologies
© Agilent Technologies, Inc.
Printed in USA, July 2005
5958-9468