gdl and csl integrity testing for cast in place drilled...
TRANSCRIPT

GDL and CSL Integrity Testing for
Cast in Place Drilled ShaftsWhat Do I Do With the Results?

2
Geophysics – Proven Record of Integrity
Testing of Drilled Shafts
Flaws found using GDL
technology in late 1980’s

3
Construction of Drilled Cast in Place
Concrete Shaft Foundations
Drill shaft to specified depth
Insert reinforcing steel
Fill hole with concrete

4
Completed Foundation Shaft
All is Well?

5
Problems with Drilled Shafts?
Can’t See What’s Happening Down Below

6
Latent Defects in Shafts

7
Latent Defects in Shafts

8
Tools Used for Testing
Gamma Density Equipment
Cross-hole Sonic Equipment
9
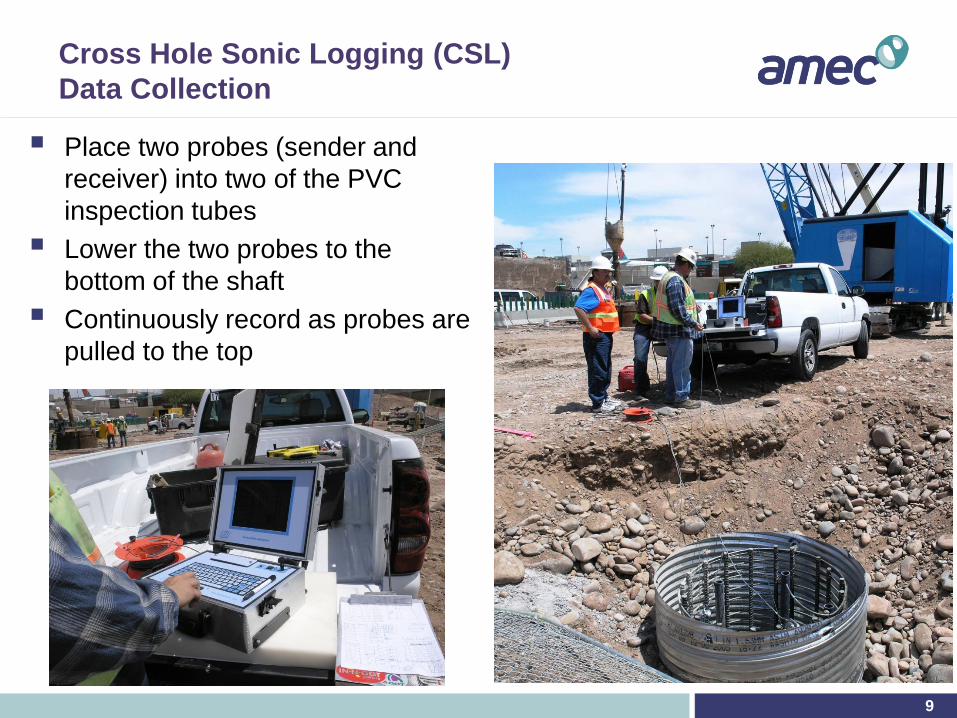
Cross Hole Sonic Logging (CSL)
Data Collection
Place two probes (sender and
receiver) into two of the PVC
inspection tubes
Lower the two probes to the
bottom of the shaft
Continuously record as probes are
pulled to the top

10
Speed of Sound – Rules of Thumb
Speed of Sound in Different Materials
(ft/sec) (km/sec)
Air 1,100 0.3
Water 4,800 1.5
Normal Concrete 12,000 3.7

11
Historical Data – Velocity vs Strength
6000
8000
10000
12000
14000
16000
0 1000 2000 3000 4000 5000 6000 7000 8000Concrete Unconfined Compressive Strength (UCS), psi
Ult
raso
nic
P-w
ave V
elo
city
, f/
s
110
120
130
140
150
160
Con
crete
Den
sity
or U
nit
Weig
ht,
pcf
.
Samples from Cotton Lane
Bridge core data at 14 day
breaks (AMEC files)
Example P-wave velocity vs UCS for
one batch of one mix design at 12-hr to
7 day breaks (Pessiki and Carrino, 1988)
12-hr breaks
3 day breaks
7 day breaks
1 day breaks
Samples of design mix at 14 day break -
P-wave velocity from laboratory bench
sonic impact echo impulse test on an
I-10 project (AMEC files)
(modified from Rucker and others, 2008)
12
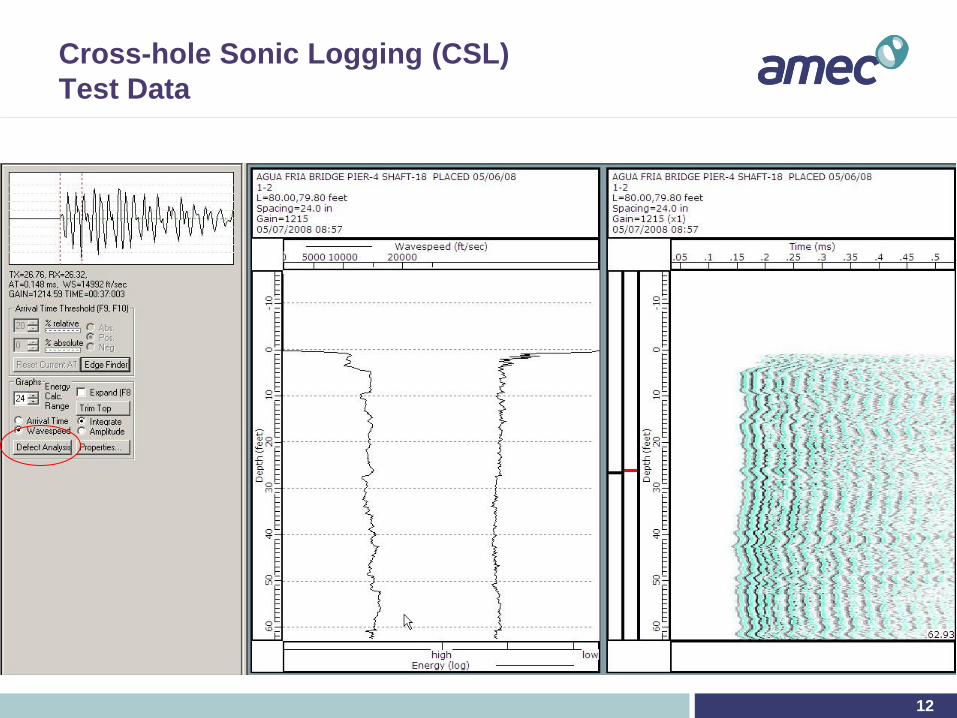
Cross-hole Sonic Logging (CSL)
Test Data

13
Multiple Tube Combinations
1
5
4 3
2
5 Tubes
10 Possible Tube Combinations
4 + 3 + 2 + 1 = 10

14
Cross-Hole Sonic Logging (CSL)
Test Data – 3 Pairs of Tubes

15
CSL Test Results - 3 D Tomography

16
Strength Gain of Concrete Over Time
0
1000
2000
3000
4000
5000
6000
0 5 10 15 20 25 30 35 40
Co
mp
ressiv
e S
tren
gth
, p
si
Age, Days
Compressive Strength Gain Curve
Average Strengths-AMEC 6X12 Cylinders (DS35B) Strength Vs Age Curve-AMEC 6X12 Cylinders (DS35B)
Average Strengths-City of Phoenix Data (DS34A, DS34B, DS35A, DS35B) Strength Vs Age Curve-City of Phoenix Data (DS34A, DS34B, DS35A, DS35B)
Average Strengths-Hypothetical 4000 psi Mix based on City of Phoenix's Data Strength Vs Age Curve-Hypothetical 4000 psi Mix based on City of Phoenix's Data

17
Threshold Wave speeds
Rough Order of Magnitude Correlation of Sonic
Wave speed to Compressive Strength of
Concrete
Wave speed
(ft/sec)
Wave speed to achieve 5,300 psi at 28 days 12,400
Wave speed to achieve 4,000 psi at 28 days 11,400
Wave speed to achieve 1,000 psi at 28 days 8,800
Wave speed in Water – 0 psi 4,800
Wave speed in Air – 0 psi 1,100

18
Project Blue Sky Harbor – Depth of 15 Feet
Low Compressive Strength,
but not Water or Soil

19
Project Blue Sky Harbor – 3D Tomography
It Means This Shaft is Bad at 9 Feet!

20
Gamma Density –
Calibration Test Barrels

21
0
0.5
1
1.5
2
2.5
3
3.5
4
120 130 140 150 160
Density, pcf
Dep
th,
ft
Black pipe "dry"
Black pipe "wet"
Galv pipe "dry"
Galv pipe "wet"
PVC pipe "dry"
PVC pIpe "wet"
Wall thickness:
Galv pipe 0.276 in
Black pipe 0.120 in
concrete
ABC
air
Barrel Bottom
GDL Test Barrel Results

22
What Access Tubes Must Endure
23
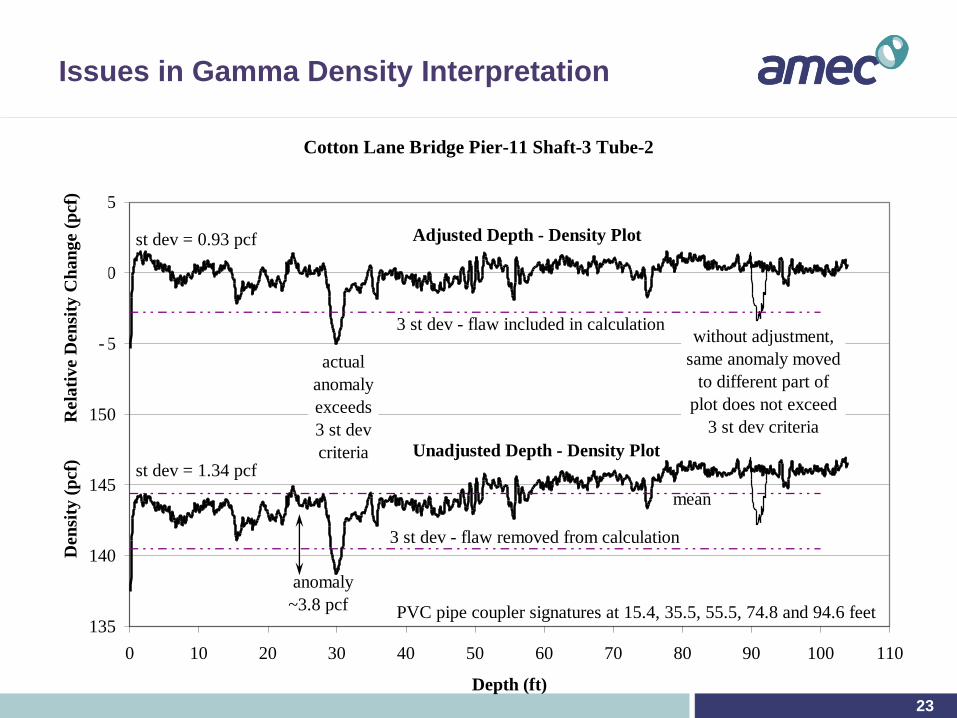
Issues in Gamma Density Interpretation
Cotton Lane Bridge Pier-11 Shaft-3 Tube-2
135
140
145
150
155
160
165
0 10 20 30 40 50 60 70 80 90 100 110
Depth (ft)
Den
sity
(p
cf)
Rela
tive
Den
sity
Ch
an
ge (
pcf)
anomaly
~3.8 pcf
-3 st dev - flaw included in calculation
3 st dev - flaw removed from calculation
mean
st dev = 0.93 pcf
st dev = 1.34 pcf
PVC pipe coupler signatures at 15.4, 35.5, 55.5, 74.8 and 94.6 feet
actual
anomaly
exceeds
3 st dev
criteria
without adjustment,
same anomaly moved
to different part of
plot does not exceed
3 st dev criteria
Unadjusted Depth - Density Plot
Adjusted Depth - Density Plot

24
What Happens With Non Conformances
Non Compliant results typically do not
have a clear cut resolution
Similar to finding out the concrete
strength is insufficient 28 days after it
is placed, only worse
Structural engineers and Owners
struggle to understand the results and
will often under- or over-react to them
Contractors seek conclusive evidence
before they undertake expensive
repairs or replacement

25
Solution
Combine CSL and GDL methods to
give better meaning to structural
engineers, owners and contractors
Utilize other test methods such as
Low Strain Integrity, 3D Tomography
and Coring if more clarity is needed
The testing engineer must work in
conjunction with the structural
engineer and the geotechnical
engineer to assess the load carrying
capacity of the shaft

26
Cotton Lane Bridge –
Test Inclusions & Real Anomalies
Tube 1 – foam plug
Tube 2 – 1L bottle
Tube 1 Tube 2

27
Pier 11 Shaft 2
Sandbag anomaly installed
between Tubes 4 & 5 @ 90’
No CSL or GDL response

28
contamination @ 29’
end of core run @31’
soft bottom?
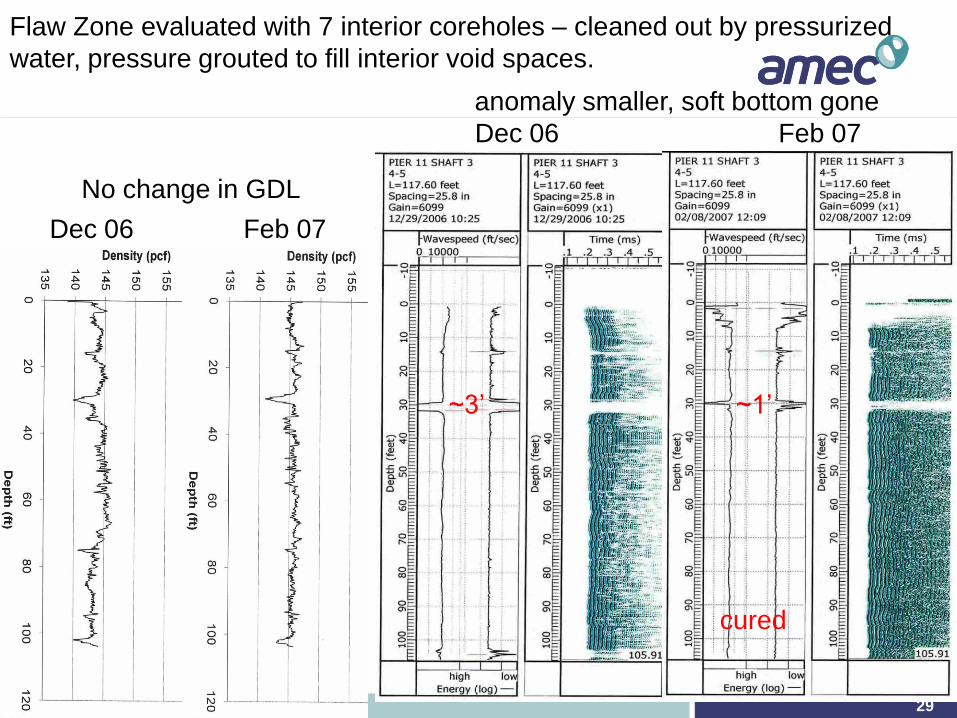
A real anomaly in Pier 11 Shaft 3 –
Initial logging done over holidays after only 1 day cure
29
Dec 06 Feb 07
Dec 06 Feb 07
Flaw Zone evaluated with 7 interior coreholes – cleaned out by pressurized
water, pressure grouted to fill interior void spaces.
No change in GDL
anomaly smaller, soft bottom gone
~3’ ~1’
cured

30
Cutting Tool Uses High Pressure Water

31
Demonstration of Cutting Tool

32
Cutting PVC Inspection Tubes at 30’ Depth

33
Bridge Over Salt River, Phoenix, AZ
pervasive ‘blow in’
core runs to top of ‘blow in’
Anomaly identified throughout CSL & GDL data
Six coreholes verified extent
34
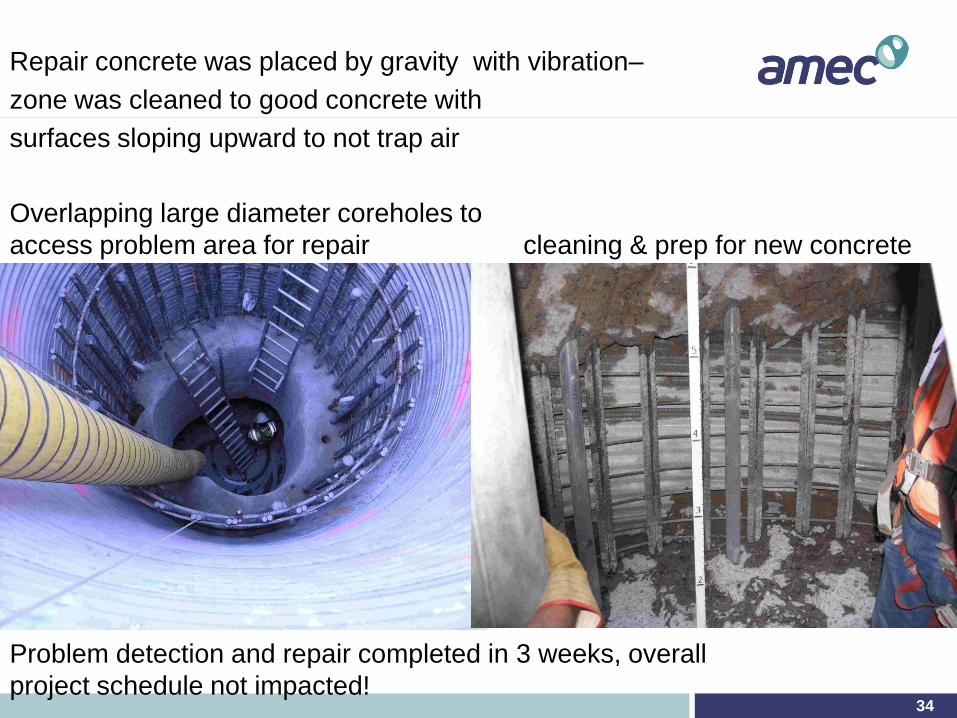
Problem detection and repair completed in 3 weeks, overall
project schedule not impacted!
cleaning & prep for new concrete
Overlapping large diameter coreholes to
access problem area for repair
Repair concrete was placed by gravity with vibration–
zone was cleaned to good concrete with
surfaces sloping upward to not trap air

35
End Slide Show
Questions?