gear shaft fault detection using the … · gear shaft fault detection using the wavelet analys is...
TRANSCRIPT

International Journal of Automobile Engineering Research and Development (IJAuERD) ISSN 2277-4785 Vol. 3, Issue 2, Jun 2013, 21-38 © TJPRC Pvt. Ltd.
GEAR SHAFT FAULT DETECTION USING THE WAVELET ANALYS ISONWUKA
ONWUKA ONYEBUCHI
Department of Mechanical Engineering, College of Engineering, Michael Okpara University of Agriculture,
Umudike--Abia State, Nigeria
ABSTRACT
The diagnosis of fault detection in gear transmission systems have attracted considerable attention in recent years,
however the need to decrease the downtime on production machinery and to reduce the extent of the secondary damage
caused by failures. However, little research has been done to develop gear shaft and planetary gear crack detection methods
based on vibration signal analysis. In this article, an approach to gear shaft and planetary gear fault detection based on the
application of the wavelet transform to both the time synchronously averaged (TSA) signal and residual signal is presented.
Wavelet approaches themselves are sometimes inefficient for picking up the fault signal characteristic under the presence
of strong noise. In this thesis, the auto covariance of maximal energy wavelet coefficients is first proposed to evaluate the
gear shaft and planetary gear fault advancement quantitatively. For a comparison, the advantages and disadvantages of
some approaches such as using variance, kurtosis, the application of the Kolmogorov-Smirnov test (K-S test), root mean
square (RMS) , and crest factor as fault indicators with continuous wavelet transform (CWT) and discrete wavelet
transform (DWT) for residual signal, are discussed. It is demonstrated using real vibration data that the early faults in gear
shafts and planetary gear can be detected and identified successfully using wavelet transforms combined with the
approaches mentioned.
KEYWORDS: Gear Transmission Systems, Time Synchronously Averaged (TSA) Signal, Kolmogorov-Smirnov Test
(K-S Test)
INTRODUCTION
Fault detection and diagnosis of gear transmission systems have attracted considerable attention in recent years,
due to the need to decrease the downtime on production machinery and to reduce the extent of the secondary damage
caused by failures. Much work has been done using vibration data analysis and modeling to detect and diagnose tooth
faults in the gears, especially fatigue crack due to cyclic loading, but there are very few papers dealing with the early
detection of shaft cracks, which can also cause catastrophic breakdown. Vibration behaviour induced by shaft cracks is
different from that induced by tooth cracks. Hence, fault indicators used for the detection of tooth faults may not be
effective in detecting shaft cracks.
There has been extensive research on the vibration behaviour of cracked shafts and crack identification in rotating
shafts [18-20]. However, all the papers have focused on the crack identification in a non-gear shaft, specifically in a rotor
shaft. As summarized by Hamidi et al. [21], several publications have proposed a number of techniques such as the use of
natural frequencies, mode shapes and frequency response functions for the damage detection of rotor shafts. However, the
method of crack detection in a gear shaft is different from that in a non-gear shaft. Little research has been done to develop
gear shaft crack detection methods based on vibration signal analysis. An autoregressive model-based technique to detect
the occurrence and advancement of gear shaft cracks was proposed by Wang and Makis [22].
Recently, wavelet transform (WT), which is capable of providing both the time- domain and frequency-domain
information simultaneously, has been successfully used in non-stationary vibration signal processing and fault diagnosis

22 Onwuka Onyebuchi
[23-26]. Wavelet approaches themselves are sometimes inefficient for picking up the fault signal characteristic under the
presence of strong noise. In this chapter, the autocovariance of maximal energy coefficients combined with wavelet
transform approaches is firstly proposed for gear shaft crack detection. The results reveal that the method can enhance the
capability of feature extraction and fault diagnosis for gear shaft. The time synchronous averaging (TSA) and residual
signal are used as the source signal, and some wavelet transform approaches such as continuous wavelet transform (CWT)
and discrete wavelet transform (DWT) are considered. Measures such as standard deviation, kurtosis and the K-S test are
used as fault indicators.
The Parallel Gear Transmission System
The scheme of a gear transmission system is shown in Figure2.1. The system consists of a pinion gear and a
driven gear. The pinion gear has a smaller number of teeth than the driven gear. Normally, a gear transmission system is
designed to reduce the angular velocity in order to increase the output torque. In such a speed reduction gear transmission
system, the pinion is connected with an input shaft, and the driven gear is connected with an output shaft.
Figure 1: The Parallel Gear Transmission System
Residual Signal Based on Time Synchronous Averaging (TSA)
TSA technique [27] is widely accepted as a powerful tool in the fault detection and diagnosis of rotating systems.
The technique attempts to isolate the raw vibration signal from the gearbox by reducing the effects of noises. Noises can be
from the external environment or be from other gears in the same gearbox. Suppose that there is a discrete time series x(n)
n = 0,1,…, N-1, which covers a number of revolutions of the gear. Then, the TSA signal is calculated using the formula;
where y(n) is the TSA signal, L is the number of revolutions to be averaged, and K is the number of sampling
points per revolution.
We can extract different TSA signals based on the different values of K, which are dependent on the different
gears and their shafts. In this chapter, only the signals from the pinion gear shaft were extracted by the TSA method.
Residual signal is obtained by eliminating from the FFT spectrum of the TSA signal the fundamental and

Gear Shaft Fault Detection Using the Wavelet Analysis 23
harmonics of the tooth-meshing frequency, subsequently applying the inverse Fourier transform and then reconstructing
the remaining signal in the time-domain. The residual signal can hence be expressed as:
z (n) = y (n) –g(n) -----------2.0
Wavelet Methodology [13-17]
Wavelet transform is a powerful method for studying how the frequency content changes with time and
consequently is able to detect and localize short-duration phenomena. The basic idea is to choose a wavelet function whose
shape is similar to the vibration signal caused by the mechanical fault. When a fault occurs, the vibration signal of the
machine which includes periodic impulses is well described by the wavelet behaviour, which has been widely used in fault
diagnosis. In this section, we first give a brief introduction of the CWT and then summarize the theory of DWT.
Continuous Wavelet Transform (CWT)
The wavelet transform is a linear transform which uses a series of oscillating functions with different frequencies
as window functions, ( ψ α ,β t ), to scan, and translate the signal x(t), whereα is the dilation parameter for changing the
oscillating frequency and β is the translation parameter. At high frequencies, the wavelet reaches a high time resolution but
a low frequency resolution, whereas at low frequencies a low time resolution and a high frequency resolution is achieved,
which makes these transformations suitable for non-stationary signal analysis. The basis function for the wavelet transform
is given in terms of a translation parameter β and a dilation parameter α with the mother wavelet represented as:
Suppose that all signals x(t) satisfy the condition
Which implies that x(t) decays to zero.
The wavelet transform,CWT (α ,β ) , of a time signal x(t) can be defined as
Where ψ (t ) is an analyzing wavelet and ψ � (t) is the complex conjugate ofψ (t) . There are a number of different
real and complex valued functions that can be used as analyzing wavelets.
Discrete Wavelet Transform (DWT)
In practice, calculating wavelet coefficients at every possible scale is a fair amount of work and generates a lot of
redundant data. It turns out that, if we limit the choice of α and β to discrete numbers, then our analysis will be sufficiently
accurate.
24 Onwuka Onyebuchi
By choosing fixed values we obtain for the
DWT
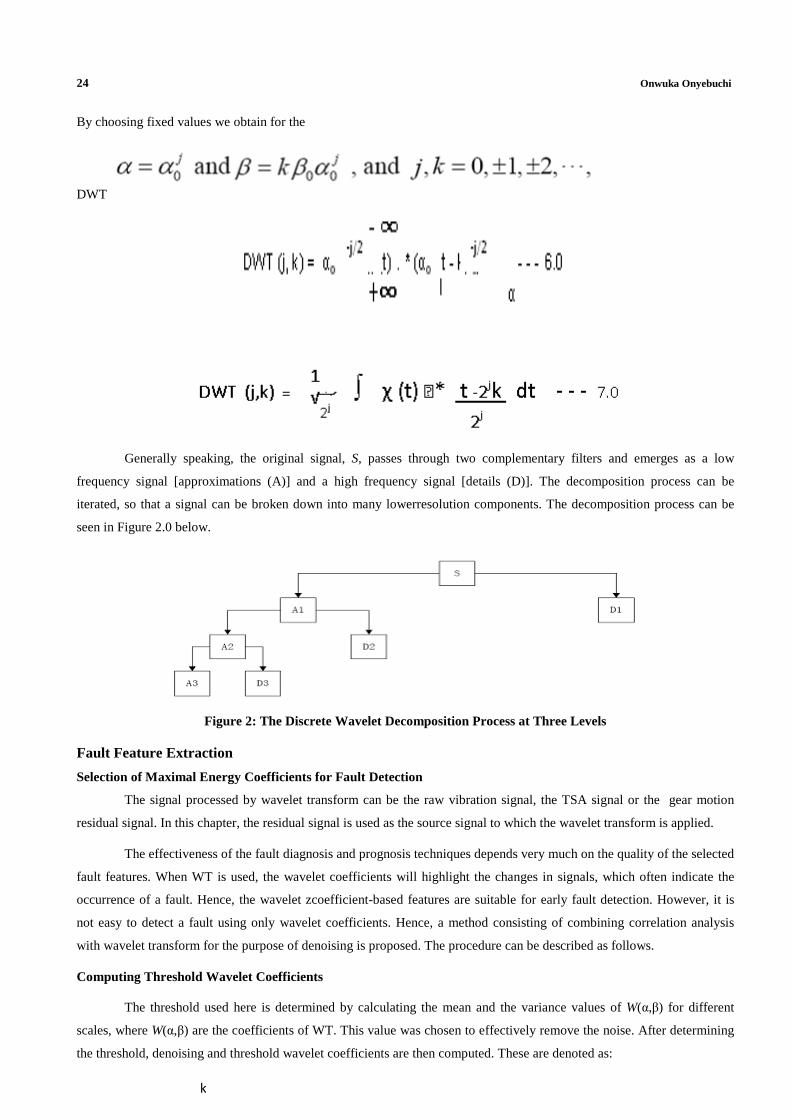
Generally speaking, the original signal, S, passes through two complementary filters and emerges as a low
frequency signal [approximations (A)] and a high frequency signal [details (D)]. The decomposition process can be
iterated, so that a signal can be broken down into many lowerresolution components. The decomposition process can be
seen in Figure 2.0 below.
Figure 2: The Discrete Wavelet Decomposition Process at Three Levels
Fault Feature Extraction
Selection of Maximal Energy Coefficients for Fault Detection
The signal processed by wavelet transform can be the raw vibration signal, the TSA signal or the gear motion
residual signal. In this chapter, the residual signal is used as the source signal to which the wavelet transform is applied.
The effectiveness of the fault diagnosis and prognosis techniques depends very much on the quality of the selected
fault features. When WT is used, the wavelet coefficients will highlight the changes in signals, which often indicate the
occurrence of a fault. Hence, the wavelet zcoefficient-based features are suitable for early fault detection. However, it is
not easy to detect a fault using only wavelet coefficients. Hence, a method consisting of combining correlation analysis
with wavelet transform for the purpose of denoising is proposed. The procedure can be described as follows.
Computing Threshold Wavelet Coefficients
The threshold used here is determined by calculating the mean and the variance values of W(α,β) for different
scales, where W(α,β) are the coefficients of WT. This value was chosen to effectively remove the noise. After determining
the threshold, denoising and threshold wavelet coefficients are then computed. These are denoted as:
k

Gear Shaft Fault Detection Using the Wavelet Analysis 25
M (α i) = 1 ∑ W (αi , βj)
K j=1
σ (αi ) I ∑ [w (αj , βj ) - M ( αi )2 1/2
k j=1
Thr (αi ) = M (αi) = σ (αi )
W = (αi , βj) { (W(αi , βj) * (W(αi , βj) – Thr (αi) │W(αi , βj)│ ≥ Thr (αi) _ _ _ 8.0
│W(αi , βj)│ ≥ Thr (αi)
where K is the number of sampling points, M (αi) is the mean, ( )i σ α is the variance, ˆ( , ) i j W α βrepresent
coefficients after denoising, sign is the signum function where signum(x) is -1 when xis negative, 0 when x is 0, and 1
when x is positive.
Computing Autocovariance of Maximal Energy Coefficients
First, we find the maximal energy coefficients at a special scale max α defined below, and then
autocovariance of the special scale series using the following formulas:
Ê (αi) = ∑ ( Ŵ (αi , βj)2
j=I
[ Ê (αmax) ] = max [Ê (αi) ]
αi – αN
ȒȒȒȒ ŴŴ (M) = ∑ Ŵ (αmax ,βj) Ŵ (αmaxβj (j + m))
j=i
P (i) = ȒȒȒȒ 2ŴŴ (i) - - - - - - - - - - - 9.0
K-S Test and Some Measures for Wavelet Transform
In statistics, the K-S test is used to determine whether two underlying probability distributions differ, or whether
an underlying probability distribution differs from a hypothesized distribution [30]. Recently, the K-S test has been found
to be an extremely powerful tool in the condition monitoring of rotating machinery [31]. The K-S test - based signal
processing technique compares two signals and tests the hypothesis that the two signals have the same probability
distribution. Using this technique, it is possible to determine whether the two signals are similar or not. Note that the
application of this test for condition monitoring assumes that the fault is strong enough to cause a change in the cumulative
distribution function of the original vibration signature, which is the case of fatigue cracks and many other gear mechanical
faults. More specifically, the K-S test considers the null hypothesis that the cumulative distribution function (CDF) of the
target distribution, denoted byF(x), is the same as the cumulative distribution function of a reference distribution, R(x). The
K-S statistic K is then the maximum difference between the two distribution functions, which can be used as the fault
indicator. In this chapter, the coefficients of wavelet transform in the healthy state are chosen to represent the reference
k
k
m-m

26 Onwuka Onyebuchi
distribution, and the K-S test is performed to compare coefficients of the wavelet transform of other data files with the
reference file. In order to compare the effectiveness to indicate fault occurrence, other statistical measures such as kurtosis
which is a statistical parameter commonly used to assess the peakedness of a signal, and standard deviation are also
considered in the following sections.
Experimental Set-up
Typically, vibration data are collected from accelerometers located on the transmission housing. The vibration
data used in this chapter were obtained from the mechanical diagnostics test-bed (MDTB) in the Applied Research
Laboratory at Pennsylvania State University [32-33]. It is functionally a motor-drive train-generator test stand. The
gearbox is driven at a set input speed using a 22.38kW, 1750 rpm AC drive motor, and the torque is applied by a 55.95kW,
1750 rpm AC absorption motor. The MDTB is highly efficient because the electrical power generated by the absorber is
fed back to the driver motor. The gearboxes are nominally in the 3.73~14.92kW range with ratios from about 1.2:1 to 6:1.
The system can be seen in Figure 3
Figure 3: Mechanical Diagnostic Test Bed (MDTB)
Each data file was collected in a 10s window which covers 200000 sampling points in total. The time interval
between every two adjacent data files is 30 minutes. The sampling frequency is 20 kHz. The signals of the MDTB
accelerometers are all converted to digital data format with the highest resolution. Among all accelerometers located in the
MDTB, the single axis shear piezoelectric accelerometer data A03 for axial direction presents the best quality data for the
state diagnosis of the gearbox. Therefore, the data recorded by this accelerometer is selected in this study. In this chapter,
we have only extracted and analyzed the signals of the input gear shaft with period K = 686 (sampling frequency*60/gear
speed = 20000*60/1750 = 686).
RESULTS AND DISCUSSIONS
Several data files (194~195,197,199~206,208~212,214, 217~218, 223, 225, and 228~231) of A03 from the test
run #13 have been randomly selected to investigate the gear shaft (21 teeth pinion gear) fault. The gear shaft ran from the

Gear Shaft Fault Detection Using the Wavelet Analysis 27
healthy state to the completely broken state (See Figure 2.4) at 300% output torque (188.14 Nm). The duration of the
whole experiment was 15.5 hours. The gear shaft states were unknown during the running period when the data files were
collected. The shaft was inspected after completing the experiment. There are a number of different real and complex
valued functions that can be used in analyzing wavelets. After a thorough investigation and analysis of the results, we have
found that the Daubechies wavelet with order 4 is most effective for processing the vibration data considered in this
chapter.
Figure 4: Broken Gear Shaft in Test Run #13 [32]
CWT for Gear Shaft Crack Detection
CWT Based on the TSA Signal and Residual Signal
CWT is often graphically represented in a time-scale plane. However, using the relationship between frequency
and scale, and by transforming the time of one wheel revolution to 360 degrees of wheel angular location, the results of
CWT amplitude maps can be displayed in the angle-frequency plane.
We have investigated all selected files of Test Run #13 with CWT applied to the corresponding
TSA and residual signals
(a) (b)
Figure 5: CWT Based on TSA Signal (a) and Residual Signal (b) for File 194
28 Onwuka Onyebuchi
(a) (b)
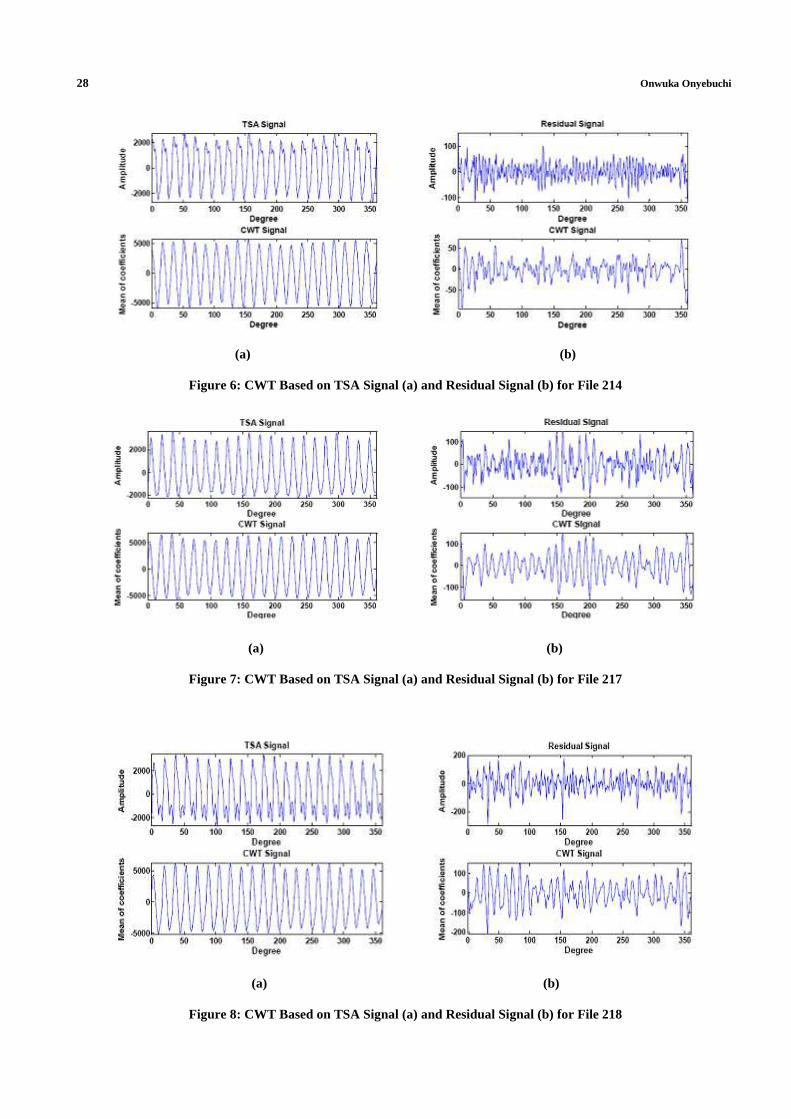
Figure 6: CWT Based on TSA Signal (a) and Residual Signal (b) for File 214
(a) (b)
Figure 7: CWT Based on TSA Signal (a) and Residual Signal (b) for File 217
(a) (b)
Figure 8: CWT Based on TSA Signal (a) and Residual Signal (b) for File 218

Gear Shaft Fault Detection Using the Wavelet Analysis 29
(a) (b)
Figure 9: CWT Based on TSA Signal (a) and Residual Signal (b) for File 229
(a) (b)
Figure 10: CWT Based on TSA Signal (a) and Residual Signal (b) for File 231 the Following Results Can be
Observed from the Plots
• In the healthy state of the gear shaft (Figures 2.5-2.7), the TSA signatures vary very regularly, oscillating along
the center line. There are 21 signature periods in one revolution, corresponding to 21 teeth.
• In the broken state of the gear shaft (Figure 2.10), there is a very large variation in the whole waveform of the
TSA signal. The TSA signal fluctuation induced by the gear shaft crack does not show a sharp impulse, but a
hump in the shape of the waveform. Also, the curve deviates far from the center line which is induced by the shaft
eccentricity due to shaft crack. However, as there is no peak impulse in the curve, which is often induced by tooth
fault, we can identify the fault as a gear shaft fault rather than a gear tooth fault or some other fault.
• In the corresponding CWT plots, the waveform of the mean amplitude of the CWT based on TSA signal behaves
just like the waveform of the TSA amplitude. In the healthy states, there is little fluctuation in the waveform,
which is expected and it is due to small imperfections in the gear shaft. However, there are evident amplitude
fluctuations in the gear faulty states (Figure 2.10), and this can be explained by the bigger impact caused by faulty
states (broken shaft).
30 Onwuka Onyebuchi
• In the residual signal, most of the vibration energy generated by the gear meshing action has been removed, so the
amplitude values of residual signal are relatively small. The residual 21 signals and CWT based on residual
signals appear unorderly, and no special symptoms can be found in the maps of healthy states and small fault
states. Thus, these maps cannot be used to indicate and to prognosticate the gear shaft fault advancement
quantitatively.
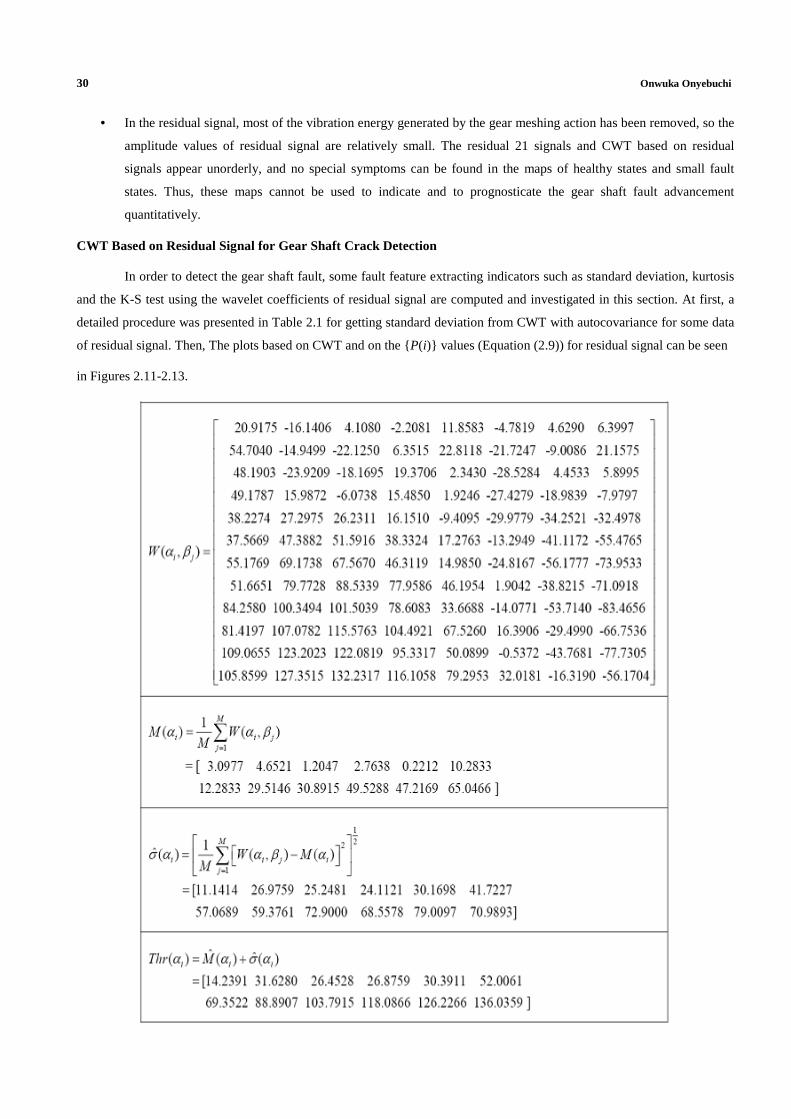
CWT Based on Residual Signal for Gear Shaft Crack Detection
In order to detect the gear shaft fault, some fault feature extracting indicators such as standard deviation, kurtosis
and the K-S test using the wavelet coefficients of residual signal are computed and investigated in this section. At first, a
detailed procedure was presented in Table 2.1 for getting standard deviation from CWT with autocovariance for some data
of residual signal. Then, The plots based on CWT and on the {P(i)} values (Equation (2.9)) for residual signal can be seen
in Figures 2.11-2.13.

Gear Shaft Fault Detection Using the Wavelet Analysis 31

32 Onwuka Onyebuchi
(a) (b)
Figure 11: Std of CWT (a) and Std of {P(i)} Values (b) for Residual Signal
(a) (b)
Figure 12: Kurtosis of CWT (a) and Kurtosis Based on {P(I)} Values (b) for Residual Signal
(a) (b)
Figure 13: K of CWT (a) and K Based on {P(I)} Values (b) for Residual Signal
The behavior of the standard deviation, kurtosis and K-S test of the amplitude of the CWT maps over the gear
shaft’s full lifetime are shown in Figures 2.11-2.13, respectively. The following results can be drawn from the plots:
• Both plots in Figure 2.11 based on the std present the same trend, but there are evident differences. First, the
values of standard deviation based on {P(i)}are far larger than those of CWT, since {P(i)} calculations are carried

Gear Shaft Fault Detection Using the Wavelet Analysis 33
out using the square of a sum of squares. Also, starting from Data File 194 to File 217 (Figure 2.11a), the values
of std oscillate with a
• decreasing trend, followed by a dramatic increase for file 218 which is caused by an early gear shaft fault (small
crack). After Data File 218, the values show a gradual increase with fluctuation. The values of std in Figure 2.11b
remain constant with little fluctuation between Data Files 194 and 217, but a sudden increase occurred in Data
File 218, indicating the first stage of the fault development. After that, the values tend to decrease, then increase
again until the occurrence of the catastrophic fault when gear shaft is broken (data files 230 to 231). We can
conclude that std based on {P(i)} values is a better indicator of fault presence than the std of CWT.
• The values of kurtosis based on both CWT and {P(i)} values over the full gearbox lifetime are plotted in Figure
12a and 12b, respectively. Kurtosis is used in engineering for the detection of fault symptoms because it is
sensitive to impulses in signals. Obviously, the sharper the impulse in a signal, the greater the value of the
kurtosis. However, from Figure 2.12, we can 26 observe that the values of kurtosis oscillate irregularly. The
kurtosis value of the residual signal is not proportional to the advancement of the gear fault, particularly when the
gear shaft is involved in a fault. Thus, kurtosis values based on residual signal are unable to diagnose early gear
shaft fault.
• For a comparison, the K-S test is also considered for the gear shaft fault detection. Data File 194 was used as the
reference signal. The results are shown in Figure 2.13. Although the values have an increasing trend, the K-S test
applied to CWT based on residual signal cannot diagnose early gear fault. There is no obvious jump or sudden
increase of K value.
DWT for Gear Shaft Crack Detection
DWT Based on TSA and Residual Signal
In discrete wavelet analysis, the details which give the identity of the signal are the low-scale, high-frequency
components, and the approximations which indicate the overall behavior are the high-scale, low-frequency components.
Since the process is iterative, it can be continued indefinitely in theory. In practice, we select a suitable number of levels
based on the nature of the signal. In this chapter, we consider three levels of decomposition. The DWT coefficients for
some typical files based on the TSA and residual signals are shown in Figures 2.14-2.19 considering the lowest level of
DWT decomposition.
(a) (b)
Figure 14: DWT Based on TSA Signal (a) and Residual Signal (b) for File 194

34 Onwuka Onyebuchi
(a) (b)
Figure 15: DWT Based on TSA Signal (a) and Residual Signal (b) for File 214
(a) (b)
Figure 16: DWT Based on TSA Signal (a) and Residual Signal (b) for File 217
(a) (b)
Figure 17: DWT Based on TSA Signal (a) and Residual Signal (b) for File 218
Gear Shaft Fault Detection Using the Wavelet Analysis 35
(a) (b)
Figure 18: DWT Based on TSA Signal (a) and Residual Signal (b) for File 229
From Figures 14-18, we obtain the following results:
• The amplitude values of the coefficients of DWT for the healthy state are little smaller than those for the
unhealthy state, but there is no evident difference for different data files.
• Like CWT, these maps of DWT cannot be used to identify the early gear shaft fault. They must be combined with
fault feature extracting indicators such as standard deviation, kurtosis and the K-S test.
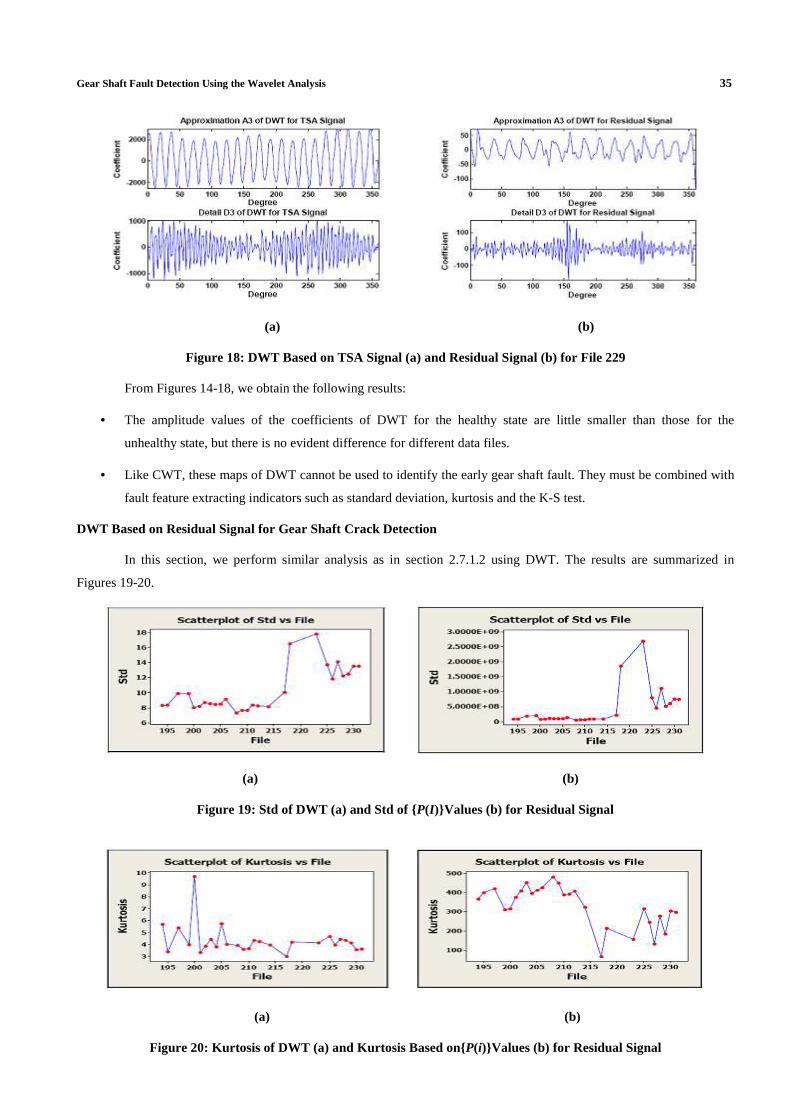
DWT Based on Residual Signal for Gear Shaft Crack Detection
In this section, we perform similar analysis as in section 2.7.1.2 using DWT. The results are summarized in
Figures 19-20.
(a) (b)
Figure 19: Std of DWT (a) and Std of {P(I)}Values (b) for Residual Signal
(a) (b)
Figure 20: Kurtosis of DWT (a) and Kurtosis Based on{P(i)}Values (b) for Residual Signal

36 Onwuka Onyebuchi
The following results can be obtained from Figures 2.20-2.22:
• The values of the std of DWT (Figure 2.20a) oscillate with a slightly decreasing trend before Data File 218, but a
sharp jump occurs in File 218, revealing that the gear shaft crack may have occurred at that time. After Data File
218, the values increase gradually, then fluctuate with a slightly decreasing trend. However, the trend of Figure
2.20 is different from that of Figure 2.11, which shows the development of the gear shaft crack until the shaft is
broken, since DWT requires a far smaller amount of work compared to CWT. Nevertheless, by using std for DWT
based on residual signal, it can still be detected that an early fault occurred in the gear shaft starting with Data File
218. The values of std in Figure 2.20b remain almost constant with limited fluctuation between Data Files 194 and
217, then an abrupt change occurs in Data File 218, and after that, the process shows the same behaviour as the
process in Figure 2.20a.
• Using the residual signal, the values and waveform of kurtosis show obvious differences for DWT when
compared to CWT, but the same conclusion can still be obtained that kurtosis based on residual signal is unable to
diagnose early gear fault.
• We can observe that the trend of the K-S test value K (Figure 2.22) is similar to that for the std (Figure 2.20),
which is a clear indication of the fault presence. Therefore, we can conclude that the K-S test applied to DWT
based on residual signal can indicate the occurrence of an early fault in the gear shaft. 32
CONCLUSIONS
In this chapter, the approach using the autocovariance of the maximal energy coefficients combined with wavelet
transform has been proposed for gear shaft fault detection using gear shaft vibration signal data. Several indicators such as
std, kurtosis and the value of the K-S test statistic have been calculated and analyzed in detail. The main results can be
summarized as follows:
• For both CWT and DWT, the statistical measure kurtosis is unable to reveal the occurrence and advancement of
gear shaft cracks.
• The standard deviation of the residual signal as an indicator over the full gear shaft lifetime is able to diagnose
early gear fault and fault advancement. We have also found that the std based on {P(i)} values is a good indicator
of the presence of faults. Considering the amount of work required for CWT, DWT also proves to be an efficient
method.
• With the DWT based on residual signals, the K-S test statistic K is able to detect the gear shaft crack occurrence,
its advancement, and the faulty state effectively. However, it has been shown that for the CWT based on the
residual signal, the K value is incapable of revealing the occurrence of the gear shaft crack clearly.
• It can be concluded from the analysis that the gear shaft was in a healthy state during Data Files 194 to 217, there
is an indication of a crack occurrence in Data File 218, and the gear shaft can be diagnosed as being in the faulty
state after Data File 218. The diagnosis indicates that the impending fault using the method presented in this
chapter can be identified earlier than the inspection performed at the actual shutdown time of gearbox due to shaft
cracks estimating fault
• occurrence between Data Files 230 and 231. In this chapter, we have employed the feature extraction approach
based on the application of the autocovariance of maximal energy coefficients combined with wavelet analysis to
Gear Shaft Fault Detection Using the Wavelet Analysis 37
gear shaft fault detection. It has been demonstrated using real vibration data that the faults in gear shafts can be
early detected and identified successfully using this approach.
REFERENCES
1. L.Hamidi, J.B. Piand, H. Pastorel, W.M. Mansour and M. Massoud, Modal Parameters for Cracked Rotors-
Models and Comparisons, Journal of Sound and Vibrations, Vol.175 (1994) 265–278.
2. X.Y.Wang and V.Makis, Autoregressive Model-Based Gear Shaft Fault Diagnosis Using the Kolmogorov–
Smirnov Test, Journal of Sound and Vibration, Vol. 327(3-5) (2009) 413-423.
3. Z.K. Peng, and F.L. Chu, Application of the Wavelet Transform in Machine Condition Monitoring and Fault
Diagnostics: A Review With Bibliography, Mechanical Systems and Signal Processing, Vol. 18 (2004) 199–221.
4. O. Rioul and M. Vetterli, Wavelets and Signal Processing, IEEE SP Magazine, Vol.10 (1991)14-38.
5. G. Kaiser, A Friendly Guide to Wavelets, Birkhäuser, (1994) 300.
6. K.Mori, N.Kasashima, T.Yoshioka and Y.Ueno, Prediction of Spalling on a Ball Bearing by Applying the
Discrete Wavelet Transform to Vibration Signals, Wear, Vol.195 (1996)162-168.
7. G.Dalpiaz, A.Rivola and R.Rubini, Effectiveness and Sensitivity of Vibration Processing Techniques for Local
Fault Detection in Gears, Mechanical System and Signal Processing, Vol.3 (2000) 387–412.
8. P.E.Tikkanen, Nonlinear Wavelet and Wavelet Packet Denoising of Electrocardiogram Signal, Biological
Cybernetics, (1999) 259-267.
9. G.Y. Gary and K.C. Lin, Wavelet Packet Feature Extraction for Vibration Monitoring, IEEE Transactions on
Industrial Electronics, Vol. 47(3) (2000) 650-667.
10. M.Dilena and A.Morassi, The Use of Antiresonances for Crack Detection in Beams, Journal of Sound and
Vibration, Vol. 276 (1–2) (2004) 195–214.
11. F.A. Andrade, I. Esat and M.N.M. Badi, A New Approach to Time-Domain Vibration Condition Monitoring:
Gear Tooth Fatigue Crack Detection and Identification by the Kolmogorov-Smirnov, Journal of Sound and
Vibration, Vol. 240(5) (2001) 909-919.
12. MDTB Data (Data CDs: Test-Runs #9, #7, #5 and #13), Condition-Based Maintenance Department, Applied
Research Laboratory, The Pennsylvania State University, 1998.
13. C.S. Byington and J.D. Kozlowski, Transitional Data for Estimation of Gearbox Remaining Useful Life,
Mechanical Diagnostic Test Bed Data, Condition-Based Maintenance Department, Applied Research Laboratory,
The Pennsylvania State University, 2000.
14. P.D. Samuel and D.J. Pines, A Review of Vibration-Based Techniques for Helicopter Transmission Diagnostics,
Journal of Sound and Vibration, 282(1-2) (2005) 475-508.
15. A. Kahraman, Load Sharing Characteristics of Planetary Transmissions, Mechanism and Machine Theory, 29(8)
(1994) 1151-1165.
16. D.P. Townsend, Dudley’s Gear Handbook, 2nd Edition, McGraw-Hill, Inc,1992.

38 Onwuka Onyebuchi
17. P.D.McFadden, A Technique for Calculating the Time Domain Averages of the Vibration of the Individual Planet
Gears and The Sun Gear in a Planetary Gearbox, Journal of Sound and Vibration, 144(1) (1991)163-172.
18. B.D. Forrester, Method for the Separation of Epicyclic Planet Gear Vibration Signatures, United States Patent No.
US 6298725 B1, 2001.
19. Vibration Data (Baseline Data: Syncrude Gearbox Rig-Commissioning Data), Syncrude Canada Ltd., 2010.