gen y 2012 presentation
TRANSCRIPT

7/27/2019 Gen Y 2012 Presentation
http://slidepdf.com/reader/full/gen-y-2012-presentation 1/30
1
Copyright © 2013 Tata Consultancy Services Limited
TCS GenY Survey 2012
Digital Habits of School Students
June 14, 2013
7/27/2019 Gen Y 2012 Presentation
http://slidepdf.com/reader/full/gen-y-2012-presentation 2/30
2
Contents
Backdrop
Objectives
Logistics
Findings
Conclusion

7/27/2019 Gen Y 2012 Presentation
http://slidepdf.com/reader/full/gen-y-2012-presentation 3/30
3
About TCS IT WIZ
TCS IT Wiz, India's biggest IT quiz for schools, started in 1999, for
students of class 8-12 as an educational initiative. This has become anannual calendar event for schools across India. The programme aims to
build awareness and encourage students to get excited about Information
Technology.
The Quiz strives to enhance IT awareness among students, keeping themabreast of the latest developments in the world of Information Technology, as
IT has become an integral part of our lives today and has today put India on
the global map.
After the quiz was rebranded as TCS IT Wiz in 2005, the growth of the quiz
has been stupendous and now reaches 14 across India, making it India’s biggest Inter School IT Quiz.
Backdrop Objectives Logistics Findings Conclusion

7/27/2019 Gen Y 2012 Presentation
http://slidepdf.com/reader/full/gen-y-2012-presentation 4/30
4
The GenY Survey
The TCS IT Wiz has grown receives the physical participation of over
15,000 students across India, TCS conceptualized a questionnaire basedsurvey administered as part of the nation wide quiz
Objectives
A Nationwide study that would capture the trends and pulse of the
youth across this nation with a focus on technology.
A study to comprehend and compare the difference (if any) among
school students in the major metros and mini metros of India
An exclusive study of this scale to capture information access trends,
social networking preferences, future education mindset, career interests and youth aspiration products.
Backdrop Objectives Logistics Findings Conclusion

7/27/2019 Gen Y 2012 Presentation
http://slidepdf.com/reader/full/gen-y-2012-presentation 5/30
5
TCS GenY Survey 2012-13
TIME PERIOD OF STUDY
August 2012 – December 2012
17,478
students,
12 cities
Largest
Survey of Urban
High SchoolStudents
in India
Respondents
12-18 year old,
Questionnaire-based
Backdrop Objectives Logistics Findings Conclusion

7/27/2019 Gen Y 2012 Presentation
http://slidepdf.com/reader/full/gen-y-2012-presentation 6/30
6
Survey Reach
14 cities across India
Classified as Metros and Mini Metros
METROS
Bangalore, Chennai, Delhi, Hyderabad,
Kolkata and Mumbai
MINI METROS
Ahmedabad, Bhubaneshwar, Cochin,
Coimbatore, Indore, Lucknow, Nagpur and
Pune
TOTAL RESPONDENTS - 17478 TOTAL SCHOOLS : 1660
AGE OF RESPONDENTS : 12 - 18 years
Backdrop Objectives Logistics Findings Conclusion

7/27/2019 Gen Y 2012 Presentation
http://slidepdf.com/reader/full/gen-y-2012-presentation 7/307
Backdrop Objectives Logistics Findings Conclusion
Survey Findings
7/27/2019 Gen Y 2012 Presentation
http://slidepdf.com/reader/full/gen-y-2012-presentation 8/308
Backdrop Objectives Logistics Findings Conclusion
Survey Findings
GADGETS

7/27/2019 Gen Y 2012 Presentation
http://slidepdf.com/reader/full/gen-y-2012-presentation 9/30
9
Backdrop Objectives Logistics Findings Conclusion
Narrowing gap in ownership between
Metro and Mini Metro when it comes togadgets like Laptops and Tablets.
Gaming Console is still considered a
premium product and hence it stillpreferred more in Metros.
GADGETS > Mobiles emerge the principal deviceWhich of the following GADGETS do you own?
Mobile Phones have overtaken
the Home PC in metros while
mini metros are not far behind.
Which is your favourite GADGET?
GADGETS All India Metro Mini Metro
Mobile Phone 65.71 67.34 64.09
Home PC 65.64 64.16 67.12Laptop 51.20 54.24 48.15
MP3 player 47.93 45.09 50.77
Gaming Console 40.61 44.07 37.14
Tablet 37.73 39.99 35.48
65.71
65.64
51.20
47.93
40.61
37.73
67.34
64.16
54.24
45.09
44.07
39.99
64.09
67.12
48.15
50.77
37.14
35.48
Mobilephone
Home PC
Laptop
iPod/MP3player
GamingConsole
ipad/TabletAll India
Metro
Mini Metro
7/27/2019 Gen Y 2012 Presentation
http://slidepdf.com/reader/full/gen-y-2012-presentation 10/30
10
Backdrop Objectives Logistics Findings Conclusion
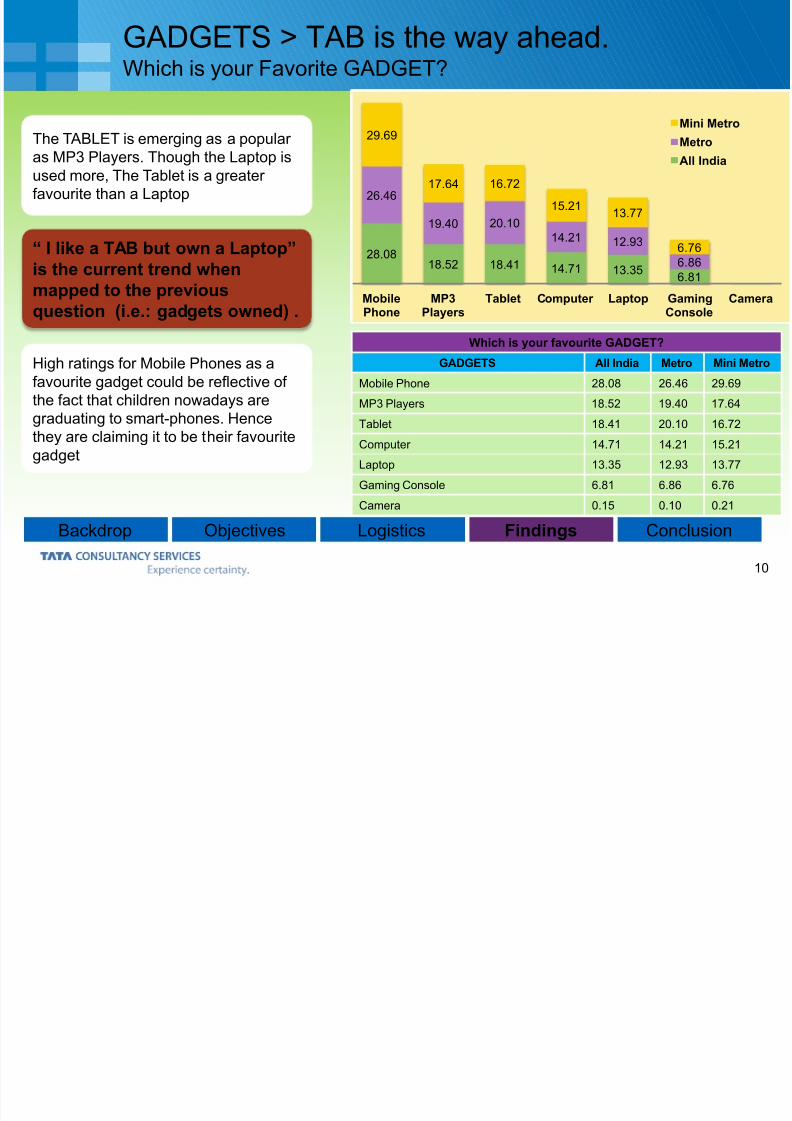
“ I like a TAB but own a Laptop”
is the current trend whenmapped to the previous
question (i.e.: gadgets owned) .
High ratings for Mobile Phones as a
favourite gadget could be reflective of
the fact that children nowadays are
graduating to smart-phones. Hencethey are claiming it to be their favourite
gadget
GADGETS > TAB is the way ahead.Which is your Favorite GADGET?
The TABLET is emerging as a popular as MP3 Players. Though the Laptop is
used more, The Tablet is a greater
favourite than a Laptop
Which is your favourite GADGET?
GADGETS All India Metro Mini Metro
Mobile Phone 28.08 26.46 29.69
MP3 Players 18.52 19.40 17.64
Tablet 18.41 20.10 16.72
Computer 14.71 14.21 15.21
Laptop 13.35 12.93 13.77
Gaming Console 6.81 6.86 6.76
Camera 0.15 0.10 0.21
28.0818.52 18.41 14.71 13.35
6.81
26.46
19.40 20.10
14.21 12.93
6.86
29.69
17.64 16.72
15.2113.77
6.76
MobilePhone
MP3Players
Tablet Computer Laptop GamingConsole
Camera
Mini Metro
Metro
All India

7/27/2019 Gen Y 2012 Presentation
http://slidepdf.com/reader/full/gen-y-2012-presentation 11/30
11
Backdrop Objectives Logistics Findings Conclusion
Decline in usage of MP3 Players
could be because of Mobilesbeing smart phones
Mini Metro Children Show greater
usage of Gaming Consoles
GADGETS > Smart Phones replace MP3sWhat gadget do you use the most ?
Mobiles emerge as the first Usage
Device ahead of the Computer
What gadget do you use the most?
GADGETS All India Metro Mini Metro
Mobile Phone 33.65 36.71 30.58
Computer 21.27 20.64 21.89
Laptop 18.03 16.85 19.22
Tablet 13.38 13.94 12.82
MP3 Players 12.57 12.18 12.95
Gaming Console 15.61 12.76 18.46
Camera 0.02 0.04 0.00
33.6521.27 18.03 13.38 12.57 15.61
36.71
20.6416.85
13.94 12.1812.76
30.58
21.89
19.22
12.82 12.9518.46
MobilePhone
Computer Laptop Tablet MP3 Players GamingConsole
Camera
All India
Metro
Mini Metro

7/27/2019 Gen Y 2012 Presentation
http://slidepdf.com/reader/full/gen-y-2012-presentation 12/30
12
Backdrop Objectives Logistics Findings Conclusion
Nokia still outscores Apple
The large ‘Others’ percentage could be
reflective of emerging brands likeKarbonn, Lava , Xolo etc
GADGETS > Samsung leads the wayWhich of these brands of electronic items do you use?
Samsung is clearly the marketleader in preference of brands
used by these children.
Which of these brands of electronic items do you use?
Brands All India Metro Mini Metro
Samsung 48.28 49.45 47.10
Nokia 46.46 46.48 46.43
Apple 39.56 38.01 41.11
HTC 36.54 37.64 35.45
Other 33.96 34.16 33.76
48.28 46.46 39.56 36.54 33.96
49.45 46.4838.01 37.64 34.16
47.10 46.43
41.1135.45
33.76
Samsung Nokia Apple HTC Other
All India
Metro
Mini Metro

7/27/2019 Gen Y 2012 Presentation
http://slidepdf.com/reader/full/gen-y-2012-presentation 13/30
13
Backdrop Objectives Logistics Findings Conclusion
Windows is picking up its pace.
GADGETS > Generation AndroidWhich Operating Platform is used by your Smart Device ?
Android is definitely the leadingOperating Platform which Gen -
Youth of India Prefers.
Which Operating Platform is used by your Smart Device ?
Operating Platform All India Metro Mini Metro
Windows 33.69 32.99 34.39
Android 53.70 53.45 53.95
iOS 22.91 22.58 23.24
33.6953.70
22.91
32.99
53.45
22.58
34.39
53.95
23.24
Windows Android iOS
All India
Metro
Mini Metro

7/27/2019 Gen Y 2012 Presentation
http://slidepdf.com/reader/full/gen-y-2012-presentation 14/30
14
Backdrop Objectives Logistics Findings Conclusion
GADGETS > Smart Phone please…. Do you own a Smart Phone ?
The Youth of India definitelyhas graduated to utilising the
full potential of Smart Phones.
Do you own a Smart Phone ?
Answer All India Metro Mini Metro
Yes 58.93 58.50 59.36
No 41.07 41.50 40.64
58.93
41.07
58.50
41.50
59.36
40.64
Yes
No
All India
Metro
Mini Metro

7/27/2019 Gen Y 2012 Presentation
http://slidepdf.com/reader/full/gen-y-2012-presentation 15/30
15
Backdrop Objectives Logistics Findings Conclusion
Survey FindingsSOCIAL NETWORKING
7/27/2019 Gen Y 2012 Presentation
http://slidepdf.com/reader/full/gen-y-2012-presentation 16/30
16
Backdrop Objectives Logistics Findings Conclusion
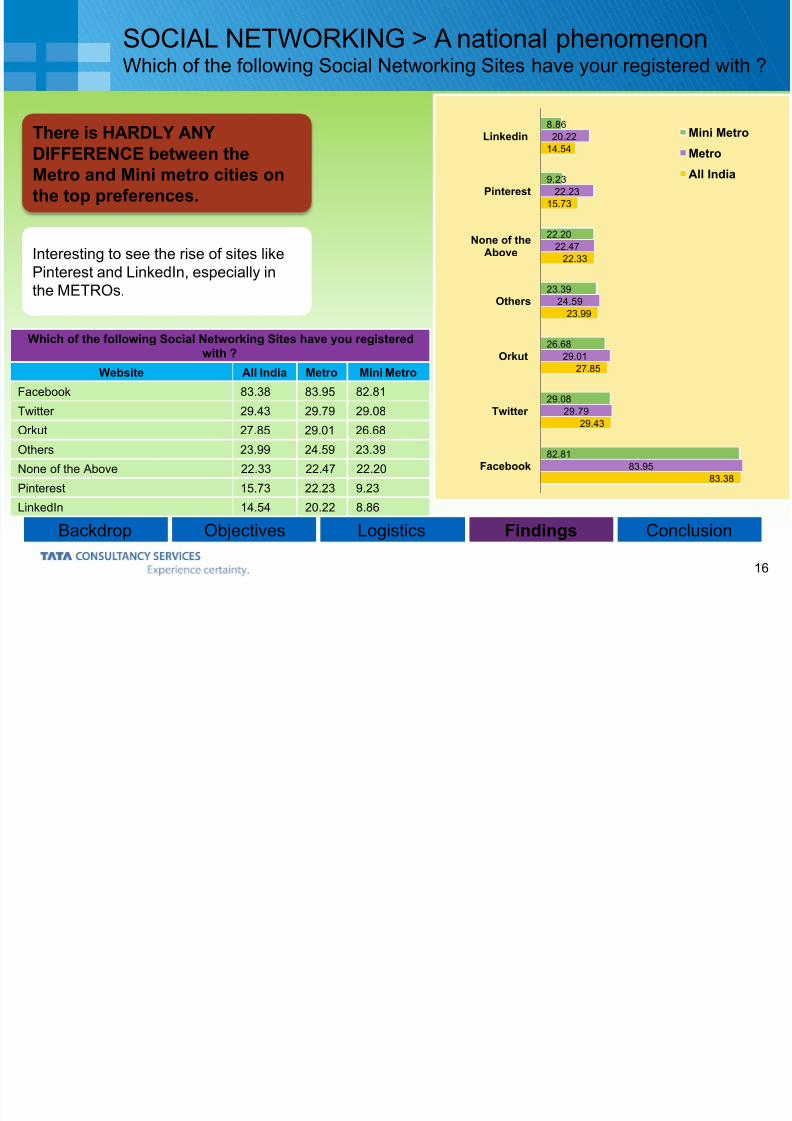
Interesting to see the rise of sites like
Pinterest and LinkedIn, especially inthe METROs.
SOCIAL NETWORKING > A national phenomenonWhich of the following Social Networking Sites have your registered with ?
There is HARDLY ANYDIFFERENCE between the
Metro and Mini metro cities on
the top preferences.
Which of the following Social Networking Sites have you registered
with ?
Website All India Metro Mini Metro
Facebook 83.38 83.95 82.81
Twitter 29.43 29.79 29.08Orkut 27.85 29.01 26.68
Others 23.99 24.59 23.39
None of the Above 22.33 22.47 22.20
Pinterest 15.73 22.23 9.23
LinkedIn 14.54 20.22 8.86
83.38
29.43
27.85
23.99
22.33
15.73
14.54
83.95
29.79
29.01
24.59
22.47
22.23
20.22
82.81
29.08
26.68
23.39
22.20
9.23
8.86
Orkut
Others
None of theAbove
LinkedinMini Metro
Metro
All India

7/27/2019 Gen Y 2012 Presentation
http://slidepdf.com/reader/full/gen-y-2012-presentation 17/30
17
Backdrop Objectives Logistics Findings Conclusion
SOCIAL NETWORKING > FB is young India’s biggest Colony Which is your most preferred site?
Facebook reigns supreme as themost preferred Social Networking
platform at a staggering 91.54%
National Average.
Which is your most preferred site?
Website All India Metro Mini Metro
Facebook 91.54 92.00 91.09
Others 4.96 4.90 5.02
Twitter 2.21 1.64 2.77
Google 1.24 1.42 1.05
LinkedIn 0.06 0.04 0.0891.54
4.96
2.21
1.24
0.06
92.00
4.90
1.64
1.42
0.04
91.09
5.02
2.77
1.05
0.08
Others
Linkedin Mini Metro
Metro
All India
7/27/2019 Gen Y 2012 Presentation
http://slidepdf.com/reader/full/gen-y-2012-presentation 18/30
18
Backdrop Objectives Logistics Findings Conclusion
Survey FindingsINFORMATION ACCESS
INFORMATION ACCESS > Home rules Phones rising

7/27/2019 Gen Y 2012 Presentation
http://slidepdf.com/reader/full/gen-y-2012-presentation 19/30
19
Backdrop Objectives Logistics Findings Conclusion
Mobile Phone as an internet
access device is growing in
metros. 1 out of every 4 Metro
children browses on a phone.
Cyber Cafes are still relevant in Mini
Metros with one in five childrenvisiting.
INFORMATION ACCESS > Home rules. Phones risingWhere do you access Internet ?
Internet access in METRO Schools is
on the rise.
Where do you access Internet ?
Source of Access All India Metro Mini Metro
Home 72.03 71.76 72.30
Mobile Phone 18.17 26.01 10.33
School 14.41 18.43 10.39
Cyber Café 13.57 4.38 22.76
Do Not Access 2.49 2.23 2.75
72.03
18.17
14.41
13.57
2.49
71.76
26.01
18.43
4.38
2.23
72.30
10.33
10.39
22.76
2.75
Home
Mobile Phone
School
Cyber Café
Do Not AccessMini Metro
Metro
All India

7/27/2019 Gen Y 2012 Presentation
http://slidepdf.com/reader/full/gen-y-2012-presentation 20/30
20
Backdrop Objectives Logistics Findings Conclusion
Cyber Cafes remain still relevant as a
point of access in Mini Metro’s.
Though Schools in METRO’s are
increasing access, students prefer browsing from Home.
INFORMATION ACCESS > Home is default locationHow
Which is your favorite place to access Internet ?
Home is still the preferred place
for access.
Which is your favorite place to access Internet ?
Source of Access All India Metro Mini Metro
Home 83.60 82.26 84.93
Cyber café 11.04 6.81 15.27
Others 7.02 8.27 5.77
School 2.60 2.66 2.53
83.60
11.04
7.02
2.60
82.26
6.81
8.27
2.66
84.93
15.27
5.77
2.53
Home
Cyber café
Others
SchoolMini Metro
Metro
All India
O O CC SS
7/27/2019 Gen Y 2012 Presentation
http://slidepdf.com/reader/full/gen-y-2012-presentation 21/30
21
Backdrop Objectives Logistics Findings Conclusion
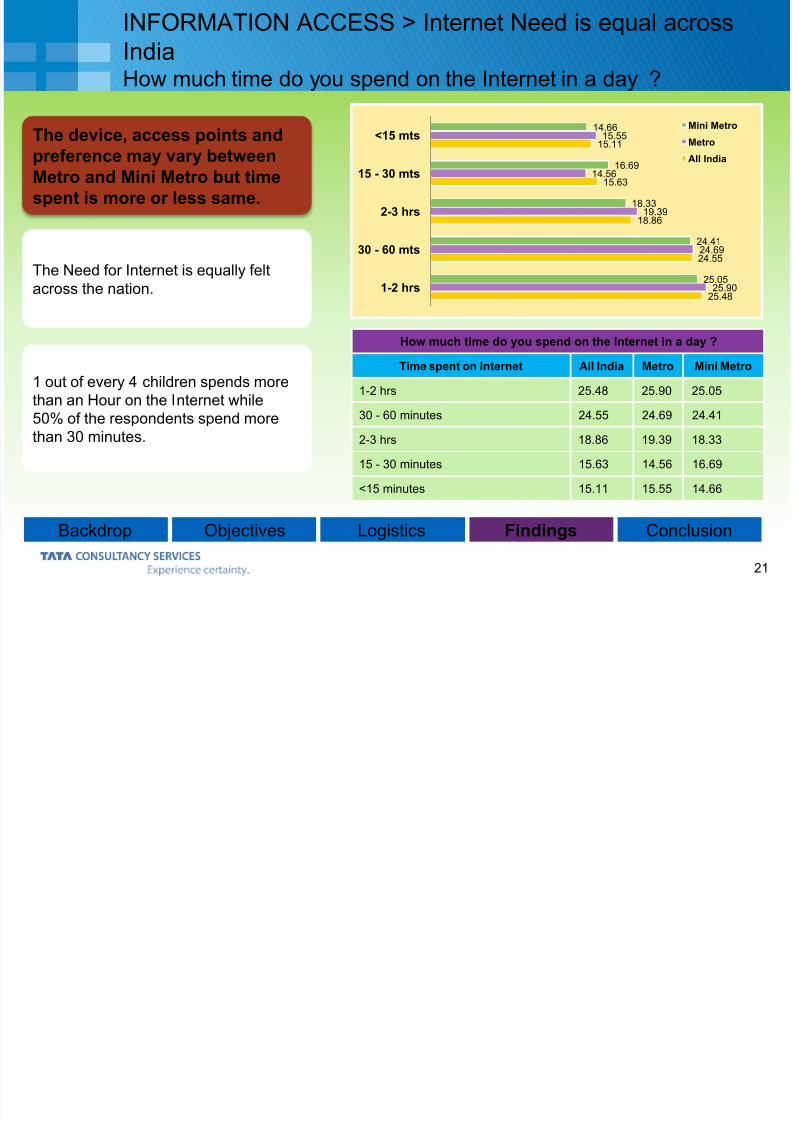
The Need for Internet is equally felt
across the nation.
1 out of every 4 children spends more
than an Hour on the Internet while
50% of the respondents spend morethan 30 minutes.
INFORMATION ACCESS > Internet Need is equal across
IndiaHow much time do you spend on the Internet in a day ?
The device, access points andpreference may vary between
Metro and Mini Metro but time
spent is more or less same.
How much time do you spend on the Internet in a day ?
Time spent on Internet All India Metro Mini Metro
1-2 hrs 25.48 25.90 25.05
30 - 60 minutes 24.55 24.69 24.41
2-3 hrs 18.86 19.39 18.33
15 - 30 minutes 15.63 14.56 16.69
<15 minutes 15.11 15.55 14.66
25.48
24.55
18.86
15.63
15.11
25.90
24.69
19.39
14.56
15.55
25.05
24.41
18.33
16.69
14.66
1-2 hrs
30 - 60 mts
2-3 hrs
15 - 30 mts
<15 mts
Mini Metro
Metro
All India
INFORMATION ACCESS I t t b h i i il P

7/27/2019 Gen Y 2012 Presentation
http://slidepdf.com/reader/full/gen-y-2012-presentation 22/30
22
Backdrop Objectives Logistics Findings Conclusion
Project work and Academic Research
for information is highest followed bySocial Networking.
INFORMATION ACCESS > Internet behaviour similar Pan-
IndiaWhy do you access the Internet?
Children reflect similar patternsin both Mini and Metros as
reasons to access the internet.
Why do you access the internet?
Reason to Access All India MetroMini
Metro
Research School subjects 73.65 73.70 73.59
Chat/Connect/Blog 62.34 62.51 62.17 Access Email 49.10 48.62 49.58
Listen/Download Music 45.47 45.74 45.21
View Movies 44.01 45.53 42.48
Do not Access 3.42 3.87 2.9873.65
62.34
49.10
45.47
44.01
3.42
73.70
62.51
48.62
45.74
45.53
3.87
73.59
62.17
49.58
45.21
42.48
2.98
Research Schoolsubjects
Chat / Connect /Blog
Access Email
Listen/DownloadMusic
View Movies
Do not Access
Mini Metro
Metro
All India

7/27/2019 Gen Y 2012 Presentation
http://slidepdf.com/reader/full/gen-y-2012-presentation 23/30
23
Backdrop Objectives Logistics Findings Conclusion
INFORMATION ACCESS > Online shopping gets younger Do you Shop Online ?
4 out of every 10 children are
shopping online today .
Where do you access Internet ?
Answer All India Metro Mini Metro
No 62.91 54.66 71.17
Yes 37.09 45.34 28.84
62.91
37.09
54.66
45.34
71.17
28.84
No
Yes
All India
Metro
Mini Metro
INFORMATION ACCESS E i I di ’
7/27/2019 Gen Y 2012 Presentation
http://slidepdf.com/reader/full/gen-y-2012-presentation 24/30
24
Backdrop Objectives Logistics Findings Conclusion
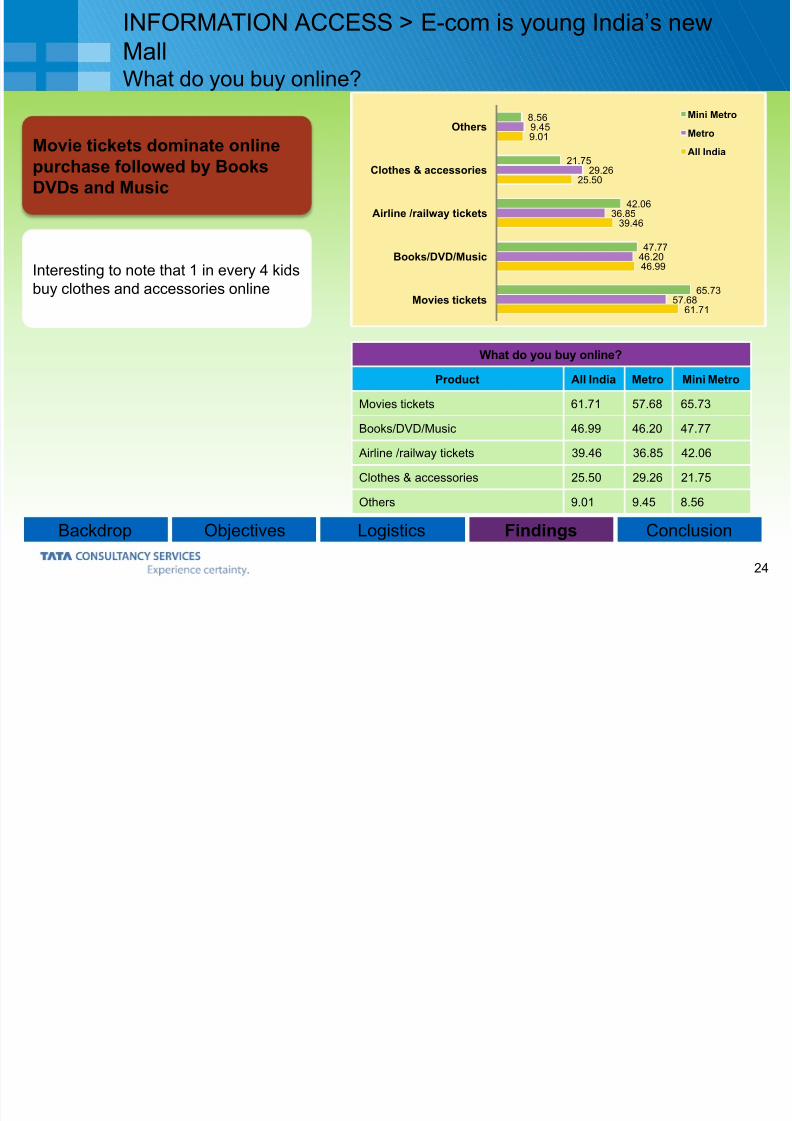
Interesting to note that 1 in every 4 kids
buy clothes and accessories online
INFORMATION ACCESS > E-com is young India’s new
MallWhat do you buy online?
Movie tickets dominate onlinepurchase followed by Books
DVDs and Music
What do you buy online?
Product All India Metro Mini Metro
Movies tickets 61.71 57.68 65.73
Books/DVD/Music 46.99 46.20 47.77
Airline /railway tickets 39.46 36.85 42.06
Clothes & accessories 25.50 29.26 21.75
Others 9.01 9.45 8.56
61.71
46.99
39.46
25.50
9.01
57.68
46.20
36.85
29.26
9.45
65.73
47.77
42.06
21.75
8.56
Movies tickets
Books/DVD/Music
Airline /railway tickets
Clothes & accessories
OthersMini Metro
Metro
All India

7/27/2019 Gen Y 2012 Presentation
http://slidepdf.com/reader/full/gen-y-2012-presentation 25/30
25
Backdrop Objectives Logistics Findings Conclusion
Survey Findings
CAREER INTERESTS
CAREER INTERESTS > N C O ti i

7/27/2019 Gen Y 2012 Presentation
http://slidepdf.com/reader/full/gen-y-2012-presentation 26/30
26
Backdrop Objectives Logistics Findings Conclusion
New areas like Retail, Tourism,
Media &
Entertainment are attractive toMETRO kids.
CAREER INTERESTS > New Career Options emerge in
METRO’sWhat are your top 3 career options ?
IT and Engineering are still clear preferences in Mini Metro’s.
What are your top 3 Career Options ?
Stream All India Metro Mini Metro
IT 41.71 31.77 51.65
Engineering 34.04 21.12 46.96
Medicine 14.74 13.31 16.17
Banking / Financial 13.10 10.42 15.77
Others/Not Sure 12.56 7.74 17.38
Media/ Entertainment 10.54 14.70 6.39
Retail 9.86 14.65 5.08
Tourism / Hospitality 9.52 16.17 2.88
Government 8.40 6.69 10.11Interesting to note that 1 in every 4 kids
buy clothes and accessories online
Interest in Medicine declining in
Metro’s

7/27/2019 Gen Y 2012 Presentation
http://slidepdf.com/reader/full/gen-y-2012-presentation 27/30
27
Backdrop Objectives Logistics Findings Conclusion
Survey Findings
COMMUNICATION (Preferences)
COMMUNICATION > Email a thing of the Past Its a
7/27/2019 Gen Y 2012 Presentation
http://slidepdf.com/reader/full/gen-y-2012-presentation 28/30
28
Backdrop Objectives Logistics Findings Conclusion
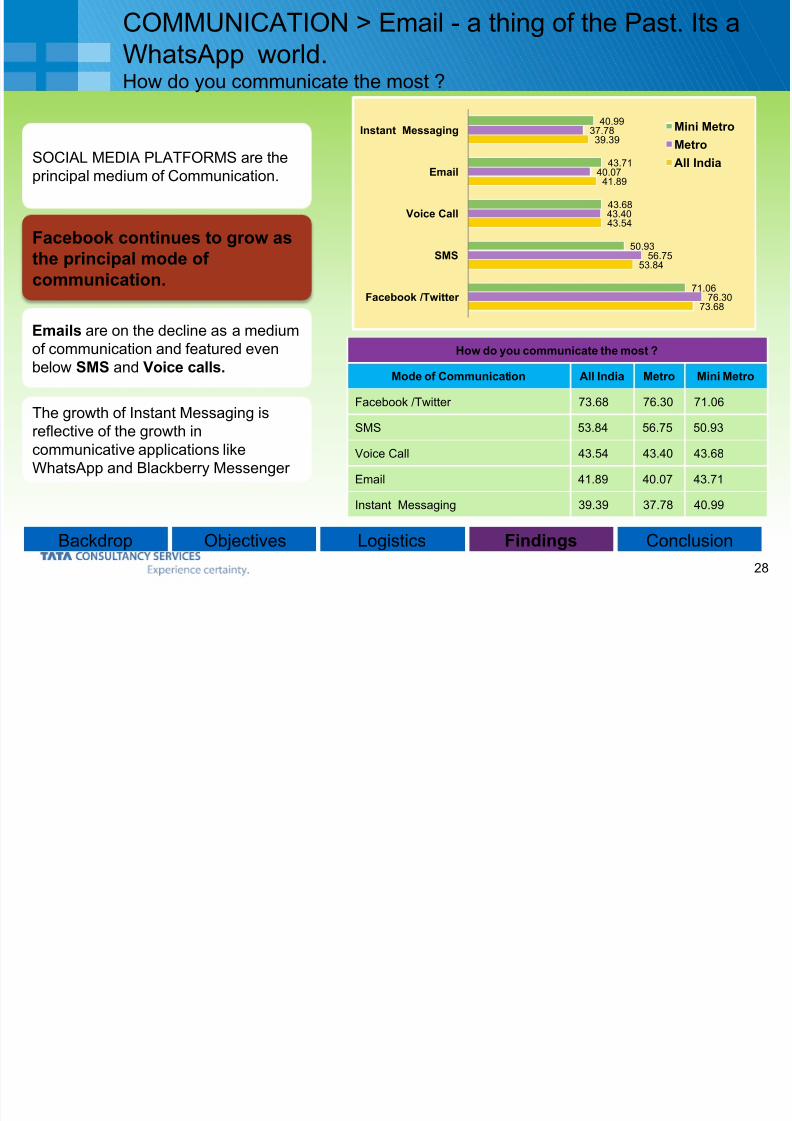
COMMUNICATION > Email - a thing of the Past. Its a
WhatsApp world.How do you communicate the most ?
How do you communicate the most ?
Mode of Communication All India Metro Mini Metro
Facebook /Twitter 73.68 76.30 71.06
SMS 53.84 56.75 50.93
Voice Call 43.54 43.40 43.68
Email 41.89 40.07 43.71
Instant Messaging 39.39 37.78 40.99
Facebook continues to grow as
the principal mode of
communication.
SOCIAL MEDIA PLATFORMS are the
principal medium of Communication.
Emails are on the decline as a medium
of communication and featured even
below SMS and Voice calls.
The growth of Instant Messaging isreflective of the growth in
communicative applications like
WhatsApp and Blackberry Messenger
73.68
53.84
43.54
41.89
39.39
76.30
56.75
43.40
40.07
37.78
71.06
50.93
43.68
43.71
40.99
Facebook /Twitter
SMS
Voice Call
Instant Messaging Mini Metro
Metro
All India
7/27/2019 Gen Y 2012 Presentation
http://slidepdf.com/reader/full/gen-y-2012-presentation 29/30
29
Backdrop Objectives Logistics Findings Conclusion
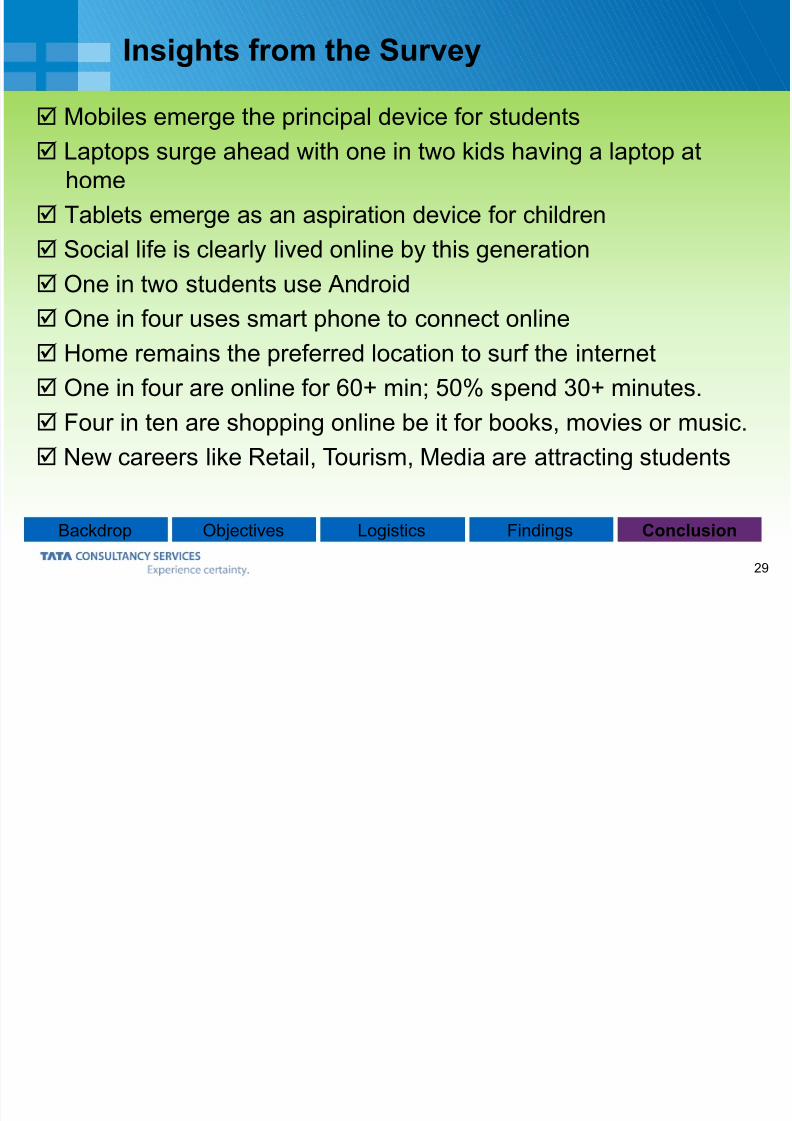
Insights from the Survey
Mobiles emerge the principal device for students
Laptops surge ahead with one in two kids having a laptop athome
Tablets emerge as an aspiration device for children
Social life is clearly lived online by this generation
One in two students use Android
One in four uses smart phone to connect online
Home remains the preferred location to surf the internet
One in four are online for 60+ min; 50% spend 30+ minutes.
Four in ten are shopping online be it for books, movies or music.
New careers like Retail, Tourism, Media are attracting students

7/27/2019 Gen Y 2012 Presentation
http://slidepdf.com/reader/full/gen-y-2012-presentation 30/30
Thank You