gencoa optix optix a new instrument for robust gas analysis in vacuum november 2017 1
TRANSCRIPT

Gencoa OptixA new instrument for robust gas analysis in vacuum
November 2017 www.gencoa.com 1

Why Monitor Your Vacuum Process?
• Identification of vacuum or process problems before they have a financial impact
• Optix maps the process environment to ensure reliable production
• Improves quality of products and repeatability
• Outputs for better process control
November 2017 www.gencoa.com 2

Optix vs RGA
November 2017 www.gencoa.com 3
Quadrupole Residual Gas Analyzers (RGAs)
Philiphofmann.net
Optix – remote plasma gas analysis (RPGA)
Optical method
Remote plasma
Spectrometer
Light
Low ppm detection Low ppm detection

Optix vs RGA
November 2017 www.gencoa.com 4
Optix – remote plasma gas analysis (RPGA) Optical method
Quadrupole Residual Gas Analyzers (RGAs)
Robust– detector separated from chemicals by optical window
Detector in contact with chemicals – easy to contaminate, hard to clean
No filaments –simple electrode geometry Filaments and ionizers are consumables
Operates 0.5 to 10-6 mbar Only operates reliably up to 10-4 mbar
Direct chamber monitoring – no need for differential pumping unless atmospheric sampling
Higher than 10-4 mbar pressure needs differential pumping – loss of sensitivity
FAST – ‘speed of light’, 10-50 msec response Typically 0.5 to several seconds range
Tolerates volatiles in the vacuum – hydrocarbons, solvents, long chain polymers
Only small amounts of contamination beforesensor failure
Wide range of useful software applications available –gas tracking, leak detection, pump-down monitoring, water tracker, end-point detection, multi-mode process tracking
Typically gas tracking & leak detection
Sensor degassing mode – avoid false reading Yes, but degas can affect filament lifetime

Optix remote plasma gas analysis
November 2017 www.gencoa.com 5
Cr`
Vacuum process 0.5 to 10-6 mbaror with a rotary pump to support atmospheric sensing
Wide pressure range remote plasma generator
High intensity plasma
Wide range spectrometer 200-850nm
Spectrum analysisgives species composition

Operating pressure
• Optix operates in the typical plasma processing pressure range
• Easy to use and robust device
November 2017 www.gencoa.com 6
Plasma has some non-linearity
Plasma light intensity too low
1x10⁻⁶ mbar – 0.5 mbar

Vacuum-based applications
November 2017 www.gencoa.com 7
1x10⁻⁶ 1x10⁻⁵ 1x10⁻⁴ 1x10⁻³ 1x10⁻² 1x10⁻¹
Pressure (mbar)
Evaporation
Sputtering
MF/RF Plasma surface treatment
CVD / PECVD
Optix & RGA Optix and differentially pumped RGA

Optix plasma generation
• Unlike RGA’s, the Optix detector is separated from the chemicals by an optical window, eliminating detector contamination
• Purpose designed and patented plasma generation source
• Very wide range of operation, with plasma present from 0.5 to 10-6 mbar
• Fast current feedback control
• Constant current – constant excitation source
• DC mode as standard, pulsed DC for highly contaminating atmospheres (ALD, OLED & CVD)
• Atmospheric sampling via simple mechanical pump – no turbo required
November 2017 www.gencoa.com 8
Current set-point (fixed) Power Supply fast current feedback control
Voltage regulation (up to 3kV)
++++
+ +++
+
Voltage and current feedback

Software interface
November 2017 www.gencoa.com 9
1. Connect / disconnect Optix sensor2. Optix device settings3. Power supply settings. 4. View spectrum plot.5. Sensor settings. Species setup screen. 6. Clear triggers.
7. Trigger settings8. Species table. 9. Species doughnut.10. Trigger settings.11. Species Table.
12. Species doughnut. 13. Species bar chart.14. The current total pressure reading.15. Species trend view. 16. Trigger status.

Optix software applications
• Quantitative gas analysis down to 2 ppm
• Gas mixture balance – up to 8 gases – can be selected
• Process gas tracking with trigger/alarm outputs
• Full spectrum view 200-850nm, control of integration time for sensitivity adjustments
• Tuneable spectrum view – more focussed range
• Automatic gas peak detection – gas auto identification database can be adjusted to incorporate additional un-common peaks of specific interest
• Leak detection mode for any gas
November 2017 www.gencoa.com 10

Optix software applications (continued)
• Process moisture monitor with triggers/alarm outputs
• Chamber pump-down tracker with triggers/alarm outputs
• Option of vacuum switch to prevent accidental operation at atmosphere
• In-built vacuum pressure reading
• Control of plasma power supply to tune power parameters for non-standard applications
• Multiple sensor monitoring
• Multiple language display options – English, Japanese, Chinese, French, Spanish
November 2017 www.gencoa.com 11

Software spectrum view
November 2017 www.gencoa.com 12
The spectrum displays the constituent species of the plasma. Each gas peak is automatically identified – as only common gases present in a vacuum are identified, this is a much more accurate feature than other spectral identification methods. The auto identification database can be user-defined.

Gas trending/tracking view
November 2017 www.gencoa.com 13

Hardware configuration options
November 2017 www.gencoa.com 14
Standard Optix package, plasma generator with power supply (DC as standard, pulsed DC as an option) with Spectrometer head and Optix software package/cables
Plasma generator with DC power supply (pulsed DC optional) and cables. Generates an intense plasma over a wide pressure range – can link to Speedflo or other control platforms
Standard Optix package, with optional optical fibrelink between sensor and spectrometer – increases flexibility of the package – use items separately
Spectrometer head with Optix software package – take advantage of the Optix software suite to manage your plasma monitoring and take advantage of the communication and trigger facilities

Dimensions and I/O options
November 2017 www.gencoa.com 15
95 mm
17
0 m
m
300 mm
Optix sensor: 300mm x 170mm x 95mmPSU: 165mm x 105mm x 55mmSensor weight: 2.2kgVacuum connection: KF25 flangeMounting orientation: Any
Communication interfaces
USB, RS232, Ethernet Digital relay output x 4
Optional PLC communication interface
Software compatible with Windows 7, 8, 10

Optix software
• An unlimited number of gas species can be monitored using the trend-line feature
November 2017 www.gencoa.com 16

Technical information
• Electrical Input voltage: 15V
• Input power: 20W typical
• Output voltage: 3kV max
• Output current: 1.5 mA max
• Total pressure operating range: 1x10⁻⁶ mbar – 0.5 mbar
• Sensitivity: 50 ppm air in argon at 1.6x10⁻² mbar total pressure
• Spectral range: 200nm – 900nm
• Update speed: 5ms – 5s (depending on sensitivity selected)
• Total pressure measurement: Integrated (1x10⁻⁶ mbar –1x10⁻² mbar measurement range)
• Electronics maximum operating temperature: 40°C
November 2017 www.gencoa.com 17

Optix hardware
November 2017 www.gencoa.com 18
• Much simpler and smaller hardware than a differentially pumped RGA arrangement
• Comprises the sensor head, small power supply and a remote PC or machine control
• Software for loading onto PC is provided

Remote Plasma Emission MonitoringHighly Sensitive Optical Method
Which species can be observed?
• Atomic emissions and molecular emissions (relative concentrations)
• Larger molecules are observed as fragments – due to disassociation in the sensor’s plasma
November 2017 www.gencoa.com 19
0
1000
2000
3000
4000
5000
6000
7000
8000
9000
10000
200 300 400 500 600 700 800 900
OHCO
CH
H
CH
O
𝐴2Σ+ − 𝑋2Π
𝐵2Σ − 𝑋2Π
𝐴2Δ − 𝑋2Π𝐵1Σ − 𝐴1Π

Caveats and considerations when using RPEM Disassociation
• “Fingerprints” of the original molecule
November 2017 www.gencoa.com 20
0
2000
4000
6000
8000
10000
12000
14000
200 300 400 500 600 700 800 900
Acetone (CH3COCH3)
Isopropanol (CH3CHOHCH3)

Remote Plasma Emission Monitoring
• Spectrum interpretation
• A single leak can emit multiple emission lines showing the exact composition
• Automated identification of the spectrum makes interpretation easier
November 2017 www.gencoa.com 21
N2+
H
OCO2+
N2+

Sensitivity quantification
• Experiments were repeated at lower pressures (reduced Arflow) and increased sensitivity was observed
• Based on this PPM limits at lower pressures can be predicted
November 2017 www.gencoa.com 22
1
10
100
1.00E-03 1.00E-02 1.00E-01
PP
M li
mit
Pressure (mbar)
Projected PPM limit
Mea
sure
d P
PM
lim
it
-1500
-1000
-500
0
500
1000
1500
10:48:52 10:49:35 10:50:18 10:51:01 10:51:45
531 PPM
Leak closed
Leak opened
Leak open

Application example 1: Hard coating
Optix gas measurement during heating phase of an Arc based hard coating cycle, comparison of different tools (Pressure c. 1x10⁻⁵ mbar)
• Outgassing ofspecies during heating phase prior to coating
• Comparison of outgassing between different tools
November 2017 www.gencoa.com 23

Application example 1: Hard coating
• Observation of gas levels during coating phase of an Arc based hard coating cycle
• Consumption of nitrogen and water vapour
• Outgassing of hydrogen
November 2017 www.gencoa.com 24

Example 2: reactive sputtering
• Optix gas measurement during reactive sputtering, comparison with high pressure RGA (process pressure 4x10⁻³ mbar)
November 2017 www.gencoa.com 25
Target clean (4 kW)
Poisoned (1 kW)
Cle
an (
4 k
W) Reactive mode (4 kW)
H outgassing from magnetron Shutter opened

November 2017 www.gencoa.com 26
• Carbon sputtered coating• Deposited on particle accelerator inner
surface to reduce secondary electron yield• Deposition pressure of 1.1x10⁻¹ mbar• Performance of coating is sensitive to the
presence of H outgassing from the magnetron environment
• Objective to monitor H outgassing during the deposition
Courtesy of CERN Vacuum Surfaces and Coatings Group
Case study 1 – Measurement of outgassing during carbon coating

November 2017 www.gencoa.com 27
• Comparison between Optix and a differentially pumped RGA• Hydrogen - 656 nm, 2 AMU
Magnetron turned offMagnetron turned off
Initial H value higher due to water vapour disassociation
Case study 1 – Measurement of outgassing during carbon coating

Case study 1 – Measurement of outgassing during carbon coating
November 2017 www.gencoa.com 28
• Optix is more sensitive to water vapour than differentially pumped RGA’s• Water vapour - 309.6 nm (OH), 18 AMU
Magnetron turned off and on –moisture increases as gettering is stopped – RGA not sensitive enough to detect the event

Case study 2: AlOx magnetron sputter deposition on roll-to-roll web
• Characterising an AlOx magnetron sputter deposition on roll-to-roll web
• Roll-to-roll deposition of reactively sputtered AlOx onto 125µm PET
• Optix sensor teed with a differentially pumped RGA
November 2017 www.gencoa.com 29
Courtesy of Emerson and Renwick

Case study 2: AlOx magnetron sputter deposition on roll-to-roll web
• Pump-down monitoring of different zones within a web coater
• Different zones in the vacuum can have different pump-down characteristics
November 2017 www.gencoa.com 30
Data courtesy of Emerson and Renwick, UK

Application: Plasma pre-treatment of plastic web based substrate
• Pre-treatment prior to coating is essential for adhesion in many vacuum coating processes
• The effectiveness of the pre-treatment can be monitored on-line
November 2017 www.gencoa.com 31
Data courtesy of Emerson and Renwick, UK

Application: Plasma pre-treatment of plastic web based substrate
• Process pressure 4x10⁻² mbar
• Different materials have different treatment requirements
• The pre-treatment can be controlled on-line for each material
November 2017 www.gencoa.com 32
Data courtesy of Emerson and Renwick, UK

Case study 2: AlOx magnetron sputter deposition on roll-to-roll web
• Very large H outgassing – taking significant time to reach steady state
• Other species also observed initially outgassing – OH, CO2, O
• Subsequent power increases cause increased H outgassing and additional settling time
• Consumption of N2 also observed – small chamber leak
November 2017 www.gencoa.com 33
Data courtesy of Emerson and Renwick, UK
Target cleaningMagnetron on
1 kW 5 kW 10 kW 15 kW 20 kW

Case study 2: AlOx magnetron sputter deposition on roll-to-roll web
• Reactive sputter characterisation
November 2017 www.gencoa.com 34
Data courtesy of Emerson and Renwick, UK
Ar signal interaction with O2 flow
Target poisoned
Target de-poisoned
O2 controller tuning mode
Unstable feedback control
Stable feedback control

Case study 2: AlOx magnetron sputter deposition on roll-to-roll web
• There is a clear increase in CO2 observed when the target becomes poisoned
November 2017 www.gencoa.com 35
CO2 increase when target is poisoned

Case study 2: AlOx magnetron sputter deposition on roll-to-roll web
• Web speed varied to determine the source of the CO2
• No influence = cathode
• Influence = web
November 2017 www.gencoa.com 36
0.9
m/m
in
0.7
m/m
in
0.5
m/m
in
1 m
/min
1.5
m/m
in
3 m
/min
3 m
/min
5 m
/min
8 m
/min
11
m/m
in
1 m
/min
• Strong influence of web speed observed
• Inverse effect on O2 observed

Case study 2: AlOx magnetron sputter deposition on roll-to-roll web
Problem summary
• Main species observed developing are CO2 and N2
• Only occurs when target is poisoned
• Web speed influences the observed concentration
November 2017 www.gencoa.com 37
Hypotheses
• Negative oxygen ion bombardment of the substrate occurs when the target (cathode) becomes poisoned
• In this case, the bombardment can be liberating species from the film surface. This is a mix of hydrocarbons and nitrogen
• The hydrocarbons are reacting with the activated oxygen process gas to form CO2
Simulation of O- ions emanating from poisoned cathode
-400V
- O
- O
CxHy
O2 CO2
Cathode
Substrate (web)
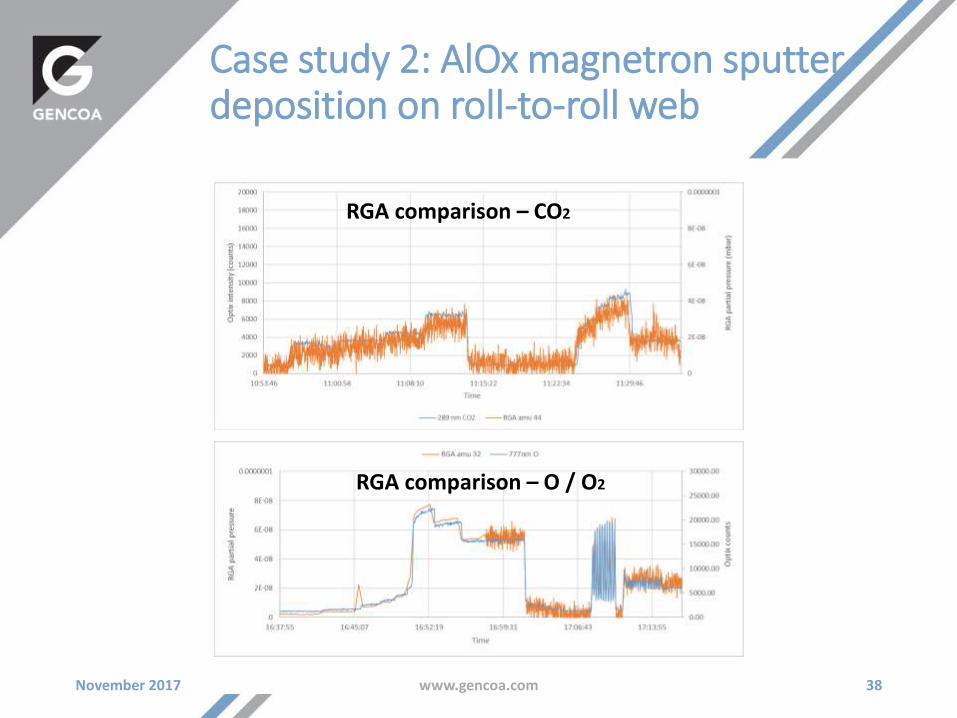
Case study 2: AlOx magnetron sputter deposition on roll-to-roll web
November 2017 www.gencoa.com 38
RGA comparison – CO2
RGA comparison – O / O2

Case study 2: AlOx magnetron sputter deposition on roll-to-roll web
November 2017 www.gencoa.com 39
RGA comparison – OH / H2O
Start of target cleaning
Optix 309 nm OH

Case study 2: AlOx magnetron sputter deposition on roll-to-roll web
• 656 nm (H) and amu 1 (H) are generally a good match
• The difference at the start of the trace can be attributed to water vapour disassociating inside the Optix sensor into H, increasing the H reading
November 2017 www.gencoa.com 40
RGA comparison – HStart of target cleaning
Optix 656nm H

Case study 3 - Characterising a reactive ion etch
• Detection of reactive ion etching effluent in the process backing line
November 2017 www.gencoa.com 41
N2 purge
CF4
Ar
Etch head
Processing chamber
Roughing pump
Pressure 4x10⁻² mbar
Optix

Case study 3 - Characterising a reactive ion etch
• Purge detection
November 2017 www.gencoa.com 42
N2 purge on

Case study 3 - Characterising a reactive ion etch
• CF4 detection (no Ar background)
November 2017 www.gencoa.com 43
40 sccms
20 sccms
10 sccms
5 sccms

Case study 3 - Characterising a reactive ion etch
• CF4 detection (Ar background)
November 2017 www.gencoa.com 44
40 sccms
20 sccms
10 sccms5 sccms

Case study 4 – Sensing from atmosphere
• Experimental setup
November 2017 www.gencoa.com 45
Optix
Pirani pressure gaugeNeedle valve
Rotary pump

Case study 4 – Sensing from atmosphere
• Solvent placed in close proximity to the inlet of the valve allowing detection of solvent vapour
• The spectrum was baselined at the background condition – therefore any changes in the spectrum are due to the detection of the vapour
• Three substances were tested – Isopropyl alcohol (IPA), Acetone and Naphtha (white spirit)
November 2017 www.gencoa.com 46

Case study 4 – Sensing from atmosphere
November 2017 www.gencoa.com 47
IPA Acetone
IPA Acetone
IPAAcetone
Naphtha Naphtha
Acetone has a higher CO reading due to the presence of a CO bond
IPA Acetone

Summary
• Remote PEM combined with spectroscopy can perform “RGA-like” functions
• Can use this method directly at higher process pressures – no need to differentially pump unless atmospheric sensing
• As case studies have shown, there is a clear benefit of improved monitoring of the vacuum at pressures used for industrial processing
• RPEM is less sensitive to contamination than RGA’s, can be used for ’dirty’ hydrocarbon environments as well as etch, CVD and ALD type processes
• This sensing technique offers a lower cost and complexity solution
November 2017 www.gencoa.com 48