gene expression correlated with delay in shell formation
TRANSCRIPT

RESEARCH ARTICLE Open Access
Gene expression correlated with delay inshell formation in larval Pacific oysters(Crassostrea gigas) exposed to experimentalocean acidification provides insights intoshell formation mechanismsPierre De Wit1* , Evan Durland2, Alexander Ventura3 and Chris J. Langdon2
Abstract
Background: Despite recent work to characterize gene expression changes associated with larval development inoysters, the mechanism by which the larval shell is first formed is still largely unknown. In Crassostrea gigas, thisshell forms within the first 24 h post fertilization, and it has been demonstrated that changes in water chemistrycan cause delays in shell formation, shell deformations and higher mortality rates. In this study, we use the delay in shellformation associated with exposure to CO2-acidified seawater to identify genes correlated with initial shell deposition.
Results: By fitting linear models to gene expression data in ambient and low aragonite saturation treatments, we are ableto isolate 37 annotated genes correlated with initial larval shell formation, which can be categorized into 1)ion transporters, 2) shell matrix proteins and 3) protease inhibitors. Clustering of the gene expression datainto co-expression networks further supports the result of the linear models, and also implies an importantrole of dynein motor proteins as transporters of cellular components during the initial shell formation process.
Conclusions: Using an RNA-Seq approach with high temporal resolution allows us to identify a conceptualmodel for how oyster larval calcification is initiated. This work provides a foundation for further studies onhow genetic variation in these identified genes could affect fitness of oyster populations subjected to futureenvironmental changes, such as ocean acidification.
Keywords: Crassostrea gigas, Gene expression, Larvae, Ocean acidification, Aragonite, Calcification
BackgroundCalcium carbonate (CaCO3) particles have been reportedto be initially formed in the intracellular compartments ofspecialized cells that transport the mineral to sites of shellformation in adult molluscs [1] and possibly in larvae. Thecomposition and structure of a protein matrix that is alsothought to be deposited by specialized cells [1], deter-mines how CaCO3 crystals become organized, formingdifferent isoforms with distinct chemical and physicalproperties [2]. The most common of these isoforms in
marine molluscs are calcite and aragonite. Shells of adultoysters are primarily composed of calcite [3], but the larvaloyster shell is composed of aragonite [4].Aragonite of Pacific oyster larval shells starts to form
after 14–18 h post-fertilization under standard cultureconditions [5]. Embryos initially exist as unprotectedtrochophore larvae whereupon a shell gland forms andproduces an organic pellicle or periostracum [6], allow-ing shell deposition to begin between the periostracumand the larval epithelium of the shell field [2]. Theseprocesses produce a shell that makes up to about 90% oflarval dry body weight [7]. Prodissoconch I stage larvaeare also called “D-larvae”, as the larval shell has a dis-tinct D-shaped form. After the initial shell has formed,
* Correspondence: [email protected] of Marine Sciences, University of Gothenburg, Strömstad,SwedenFull list of author information is available at the end of the article
© The Author(s). 2018 Open Access This article is distributed under the terms of the Creative Commons Attribution 4.0International License (http://creativecommons.org/licenses/by/4.0/), which permits unrestricted use, distribution, andreproduction in any medium, provided you give appropriate credit to the original author(s) and the source, provide a link tothe Creative Commons license, and indicate if changes were made. The Creative Commons Public Domain Dedication waiver(http://creativecommons.org/publicdomain/zero/1.0/) applies to the data made available in this article, unless otherwise stated.
De Wit et al. BMC Genomics (2018) 19:160 https://doi.org/10.1186/s12864-018-4519-y
the larvae become planktotrophic and feed on microal-gae for 2–3 weeks before developing into pediveliger lar-vae. When competent, pediveliger larvae settle on hardsubstrates and metamorphose into sessile juvenile oys-ters. At this life stage, shell mineral composition changesfrom aragonite to the calcite isoform of calcium carbon-ate [3, 8].During these major life stage transitions, large-scale
changes occur in the cellular biochemistry of the calcify-ing tissue (e.g. [9–12]). It is likely that these physio-logical and biochemical changes are linked totranscriptomic transitions, where for example transcriptscoding for shell matrix proteins, ion pumps and otherprocesses are up-regulated for shell formation, whileothers could be simultaneously down-regulated. Li et al.[13] showed that differential gene expression in the lar-vae of the pearl oyster, Pinctada fucata, occurs mostlyduring transitions between early developmental stages,such as from trochophore to D-shaped larva. Zhang etal. [10] reported that a fibronectin-like transcript andchitin synthase were highly expressed at the initiation ofshell formation in larval C. gigas. While the bone-morphogenetic-protein (BMP) [14] signalling pathwayhas been hypothesized as an initiator of these changes[15–17], a number of studies have also been conductedon individual candidate genes putatively directly in-volved in biomineralization in oysters; for example tyros-inases have been suggested as having a function inperiostracum formation and biogenesis [18, 19] and cy-clases have been suggested to control intracellular cal-cium and bicarbonate ion concentrations [20, 21].As several recent studies have shown a disconnect be-
tween gene expression and protein expression [22, 23],quantification of protein content provides an importantlink between gene expression changes and cellular physi-ology. In oysters, Huan et al. [9] compared proteins innon-calcifying trochophore larvae to calcifying D-shapedlarvae and found 50 differentially expressed proteins,which they divided into the four categories “cytoskeletalcomponents”, “biochemical regulators”, “cell prolifera-tors” and “protein modification factors”.On the United States (US) west coast, high mortalities
of Pacific oyster larvae have recently occurred in con-junction with upwelling of deep water that is under-saturated in aragonite, causing a significant loss of in-come for oyster hatcheries and farmers [24–26]. Carbondioxide (CO2)-acidified seawater can cause shell defor-mations and reductions in shell size of developing larvae(e.g. [27–29]) and delays in the initiation of shell forma-tion (e.g. [27, 30–32]). The delay in shell formation ofoyster larvae exposed to CO2-acidified seawater is af-fected by seawater aragonite saturation state (ΩARAG) [5,33, 34] and/or possibly by the ratio of bicarbonate tohydrogen ions at sites of calcification [34, 35].
Concurrent with shell formation, larval oysters areundergoing a complex transition from trochophore toveliger larvae, a process which invokes a myriad ofphysiological and transcriptomic changes [10]. In thisstudy, we have capitalized on the delay in initial shell de-velopment of oyster larvae under acidified seawater con-ditions in order to identify genes that are correlated withshell calcification during this early developmental phase.We have compared gene expression profiles during earlyshell development of larvae in ambient (ΩARAG ≈ 2.5–3.0) seawater with those of genetically similar larvae inacidified (ΩARAG ≈ 1.0–1.25) seawater during the first18 h post-fertilization in order to identify expression ofgenes previously known to be involved in shell forma-tion, but also expression of novel putative genes codingfor shell matrix proteins, as well as other processes asso-ciated with shell formation. This is the first study to usea high temporally resolved sampling scheme (every twohours) while assessing global gene expression changesdue to ΩARAG stress in C. gigas larvae, an investigationwhich could provide a better understanding of how oys-ter populations may respond to environmental change.Additionally, this study could provide insight into poten-tial targets of natural selection under future ocean acid-ification scenarios.
ResultsWater chemistryIn replicate experiment 1, the partial pressure of carbondoixide (pCO2) in ambient conditions ranged between462.8–731.0 μatm (μ = 564.9, s.d. = 65.6), while in thetreatment it ranged between 1325.8–1724.5 μatm (μ =1515.4, s.d. = 104.1) (Table 1; Additional file 1: TableS1). Aragonite saturation state ranged between 2.08–2.78 (μ = 2.53, s.d = 0.18) in ambient cultures, while inthe treatment replicates it ranged between 1.06–1.31 (μ= 1.19, s.d. = 0.07) (Table 1). One sample from the ambi-ent group (6 h post-fertilization, replicate A) was foundto contain low ΩARAG water, potentially as the result ofa mistake during filling of the culturing vessel, and wasthus treated as a low ΩARAG treatment sample for thegene expression analyses. The exclusion of certain cul-tures resulting in lack of replication within certain timepoints is not of major concern from a statistical perspec-tive due to our choice of regression analysis across alltime points.In replicate experiment 2, the pCO2 in ambient condi-
tions ranged between 405.0–521.6 μatm (μ = 449.0, s.d. =30.8), while in the treatment it ranged between 1103.0–1397.9 μatm (μ = 1241.9, s.d. = 109.2) (Table 1). Aragon-ite saturation state ranged between 2.63–3.25 (μ = 3.00,s.d. = 0.175) for ambient conditions while in the treat-ment it ranged between 1.27–1.60 (μ = 1.44, s.d. = 0.115)(Table 1). In this experiment one sample from the low
De Wit et al. BMC Genomics (2018) 19:160 Page 2 of 15

ΩARAG group (6 h post fertilization, replicate A) wasfound to have an abnormally low ΩARAG (0.688). As thevariance in all other replicates was very low, we interpretthis as a post-experimental sterilization failure of the watersample before analysis and not a true treatment effect.Carbonate chemistry in static culture systems is stronglyinfluenced by biologic metabolism within the cultureunit(s) and, as such, inherent differences in stocking rate(biomass) result in variability of seawater carbonate chem-istry. Despite notable variation in seawater pCO2 betweenreplicates for our experiments, ΩARAG levels were consist-ently and substantially different between treatments: > 2for ‘ambient’ conditions and ≈1.0–1.5 for ‘treated’ sea-water. No trend of decreasing ΩARAG with time was ob-served (Table 1, Additional file 1: Table S1).
Shell depositionBoth timing of onset and rate of shell calcification wassignificantly different between seawater treatments and
experiments (p < 0.05, Additional file 2: Table S2). Inreplicate experiment 1, larvae in ambient conditionsbegan to form aragonite crystals at 14 h post-fertilization (μ(CI) = 0.13, s.d. = 0.05) (3% fully calcified,20% partially calcified), while larvae in low ΩARAG treat-ments did not start calcifying until 16 h post fertilizationand then in much lower proportions than in ambientconditions (Fig. 1). At 18 h post fertilization, the propor-tion of calcified larvae in the low ΩARAG treatmentreached similar levels to that of larvae in ambient condi-tions μ(CI) = 0.58 ± 0.11 and 0.54 ± 0.22 for ambient andlow ΩARAG treatments, respectively (61% part- or fullycalcified vs 62% in ambient).In replicate experiment 2, the same general calcifica-
tion pattern was seen as in experiment 1 (Fig. 1), al-though larvae in both ambient conditions and lowΩARAG treatment began to partially calcify to a small ex-tent as early as 10–12 h post fertilization (≈7% partiallycalcified in each). At 14 h, however, only larvae in the
Fig. 1 Calcification index of larval cultures from 6 to 18 h post fertilization. Calcification index (CI) is calculated as: CI = (FC + (PC ∗ 0.5))/TL, whereFC, PC and TL denote the numbers of observed fully calcified, partially calcified and total larvae from each sample, respectively. Ambient (control)and low ΩARAG (treatment) conditions are represented in blue and orange respectively, with locally estimated average (LOESS) trends representedby lines. Experiment 1 is displayed as solid lines and filled points, experiment 2 is represented by dashed lines and unfilled points. Symbols of thesame type within each time point correspond to the two independent replicate cultures as specified in the “Methods” section
Table 1 Mean (±SD) temperature, salinity, total alkalinity (peq kg− 1), total CO2 (TCO2), partial pressure CO2 (pCO2), bicarbonate(pmol kg− 1), carbonate (pmol kg− 1), pH (pHT = pH on the total scale) and saturation state of aragonite (ΩARAG) for control and highpCO2 seawater treatments across two experiments rearing C.gigas larvae from 2 to 18 h post fertilization
Parameter
Temp.(°C)
Salinity(ppt)
Alkalinity(μeq kg−1)
TCO2
(μmol kg− 1)pCO2
(μatm)HCO3
−
(μmol kg− 1)CO3
2−
(μmol kg− 1)pHT ΩARAG
Experiment 1 Control 25.8 ± 0.49 30.4 ± 0 2259 ± 11 2053 ± 13 565 ± 65.6 1882 ± 21 154.7 ± 11.4 7.92 ± 0.04 2.53 ± 0.18
High pCO2 25.9 ± 0.28 30.4 ± 0 2285 ± 14 2225 ± 11 1515 ± 104.1 2109 ± 10 72.6 ± 4.5 7.54 ± 0.03 1.19 ± 0.07
Experiment 2 Control 26.1 ± 0.23 30.4 ± 0.04 2251 ± 18 2003 ± 11 449 ± 30.8 1808 ± 15 182.4 ± 10.6 8.01 ± 0.03 2.99 ± 0.17
High pCO2 26.3 ± 0.28 30.4 ± 0.12 2284 ± 14 2194 ± 13 1242 ± 109.2 2071 ± 14 87.5 ± 6.8 7.62 ± 0.04 1.44 ± 0.11
De Wit et al. BMC Genomics (2018) 19:160 Page 3 of 15

ambient treatment were fully calcified (48%) and at 16 h74% were fully calcified in the ambient while only 22%were fully calcified in the low ΩARAG treatment. Similarto the results of replicate experiment 1, this differencediminished at 18 h (97% part- or fully calcified in ambi-ent conditions vs 88% in the low ΩARAG treatment).
Bioinformatic analyses of RNA transcriptsSamples were sequenced with 50 bp single-end reads, ran-ging from 13.2–77.4 Mreads sample− 1 (μ = 39.0 Mreads).After quality trimming and removal of residual adaptersequences, a mean of 97.3% of the reads were retained,with a mean quality score of 36.1 and mean length of 47.3bases, considering data from both replicate experiments(Additional file 3: Table S3). Due to low output of the firstsequencing run for replicate experiment 1, most of thesamples were sequenced one more time, more than doub-ling the number of reads in this replicate experiment, withthe exception of one 10 h replicate of the ambient treat-ment and both 10 h replicates of the low ΩARAG treat-ment, as well as both 12 h replicates of the ambient andone 12 h replicate of the low ΩARAG treatments, whichwere not re-sequenced. Unfortunately one of the ambienttreatment replicates at 16 h in experiment 1 was lostduring the library preparation protocol.The fraction of reads that mapped uniquely to one
position in the genome coding regions ranged from 3.1%to 38.0% (μ = 25.7%). This rather low fraction was likelydue to the method of extraction of RNA in bulk fromseawater, which would also extract RNA from a varietyof micro-organisms. The fraction of duplicate readsranged from 6.48% to 24.79% (μ = 18.72%). Afterremoval of duplicate reads, sequencing depth rangedfrom 9.50–57.3 Mreads/sample (μ = 30.5 Mreads)(Additional file 4: Figure S1).
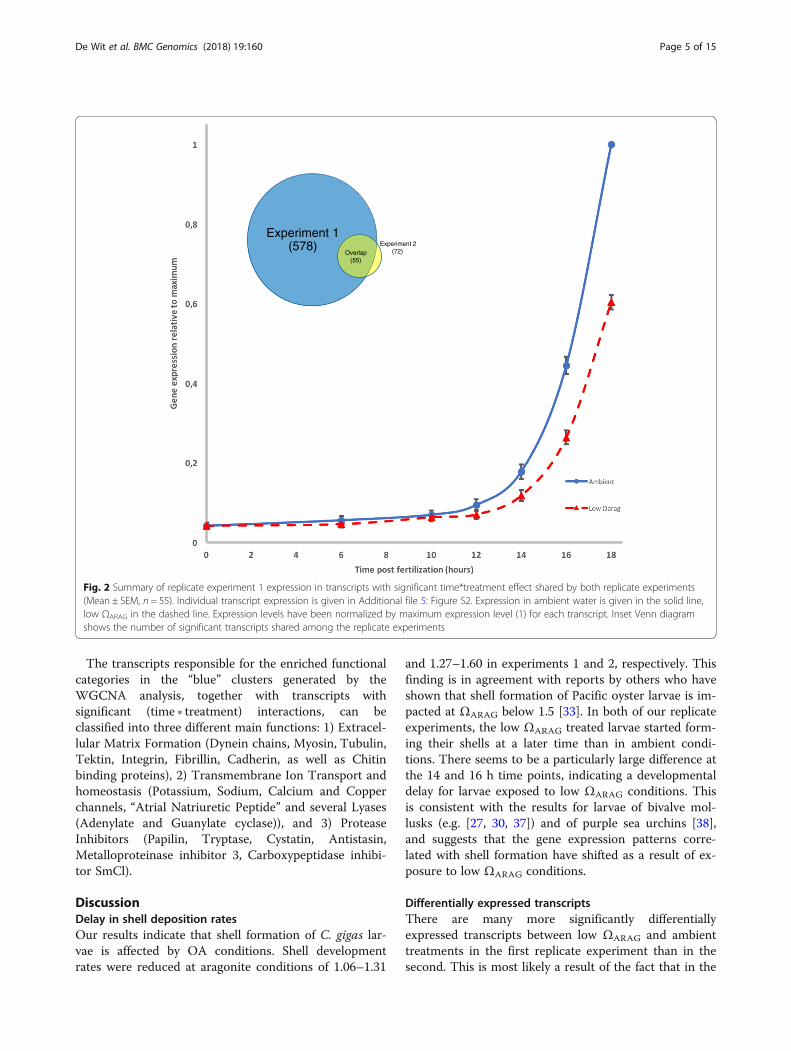
Differentially expressed transcriptsFiltering out transcripts with low expression values, lowvariances and ones not showing a positive expression *time interaction term in a generalized linear model (p <0.05), left 5448 transcripts in experiment 1 and 4030transcripts in experiment 2. From these datasets, 578transcripts showed a significant (time ∗ treatment) inter-action effect in the log linear model: log(y) = β0 + β1time+ β2treatment + β3(time ∗ treatment) in experiment 1after a Benjamini-Hochberg false discovery rate correc-tion (FDR = 0.05%), while there were 72 transcripts inexperiment 2 (p < 0.05). Fifty-five of the transcripts wereshared between the two experiments (Inset in Fig. 2;Additional file 5: Figure S2), all of which show higher ex-pression levels in the ambient than in the low ΩARAG
treatment (Fig. 2). Out of these, 31 had an InterPro an-notation [36] through the genome sequence, and 25 hada Gene Ontology (GO) functional annotation associated
with them. In total, 37 were attached to some form ofannotation, and all of these could be classified into oneof four categories: Metabolic genes (n = 3), Transmem-brane Proteins (transporters) (n = 8), Shell Matrix Pro-teins (n = 16) and Protease Inhibitors (n = 10) (Table 2).Overrepresented GO categories (within the “MolecularFunction” category) in this list are: “endopeptidase in-hibitor/regulator activity” (GO:0004866/GO:0061135;corrected p-value 3.35*10− 10), “serine-type endopeptid-ase inhibitor activity” (GO:0004867; corrected p-value1.68*10− 10), “serine-type endopeptidase activity”(GO:0004252; corrected p-value 0.0251) and “serine-typepeptidase/ hydrolase activity” (GO:0008236/GO:0017171; corrected p-value 0.0223) (Additional file 6: FigureS3). Looking closer at the transcripts within each ofthese categories, they code for the extracellular metallo-protease matrix protein “Papilin” (CGI_10,020,818 /CGI_10,021,289), as well as a variety of different prote-ase inhibitors such as for example Antistasin(CGI_10021371), Trypsin inhibitors (CGI_10,015,381 /CGI_10,012,273 / CGI_10,020,625) and Cystatins(CGI_10013713 / CGI_10013715 / CGI_10013717).
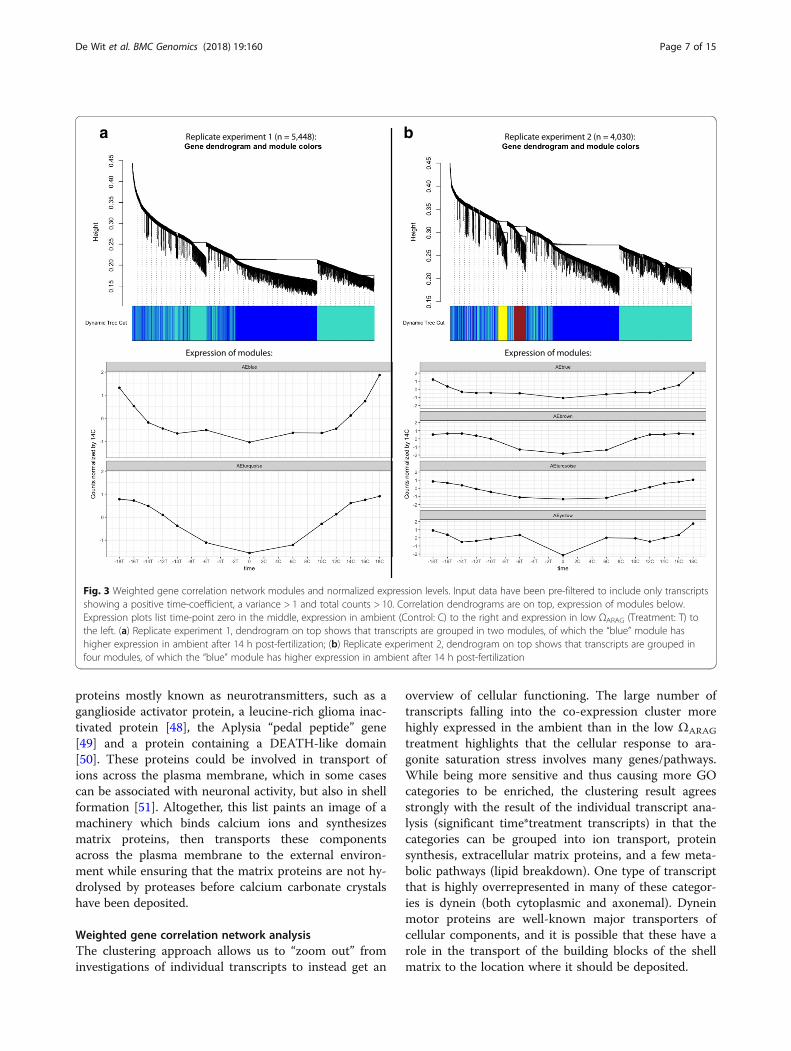
Weighted gene correlation network analysisClustering the expression data from the 5448 transcriptsfrom replicate experiment 1, after filtering out tran-scripts that were found not to be positively correlatedwith time and with low variance, rendered two majorclusters, of which one showed temporal differences inexpression patterns between ambient conditions and lowΩARAG treatment (“blue” in Fig. 3a), whereas the otherone did not (“turquoise” in Fig. 3a). Focusing on the“blue” cluster, it contained 2592 transcripts, with the listof genes being significantly enriched (Gene-score resam-pling multiple-test corrected p < 0.05) for 47 differentGO categories (10 Biological Processes, 9 Cellular Com-ponents and 28 Molecular Functions) (Additional file 6:Figure S3). In replicate experiment 2, the transcriptsclustered into 4 co-expression clusters, one of whichshowed different expression pattern in the low ΩARAG
treatment compared to ambient (“blue” in Fig. 3b). Thiscluster contained 1658 transcripts, and was enriched for12 GO categories (1 Biological Process, 4 Cellular Com-ponents and 7 Molecular Functions), all of which werealso enriched in replicate experiment 1 except fortubulin-tyrosine ligase activity (GO:0004835) and serine-type peptidase activity / serine hydrolase activity(GO:0008236 / GO:0017171) (Additional file 6: Figure S3).The lower number of significant categories reflect thedecrease in statistical power due to lower sequencingdepth in replicate experiment 2. These categories alsoinclude the ones enriched in the dataset of transcriptsshowing a significant (time ∗ treatment) interaction de-scribed above (Additional file 6: Figure S3).
De Wit et al. BMC Genomics (2018) 19:160 Page 4 of 15
The transcripts responsible for the enriched functionalcategories in the “blue” clusters generated by theWGCNA analysis, together with transcripts withsignificant (time ∗ treatment) interactions, can beclassified into three different main functions: 1) Extracel-lular Matrix Formation (Dynein chains, Myosin, Tubulin,Tektin, Integrin, Fibrillin, Cadherin, as well as Chitinbinding proteins), 2) Transmembrane Ion Transport andhomeostasis (Potassium, Sodium, Calcium and Copperchannels, “Atrial Natriuretic Peptide” and several Lyases(Adenylate and Guanylate cyclase)), and 3) ProteaseInhibitors (Papilin, Tryptase, Cystatin, Antistasin,Metalloproteinase inhibitor 3, Carboxypeptidase inhibi-tor SmCl).
DiscussionDelay in shell deposition ratesOur results indicate that shell formation of C. gigas lar-vae is affected by OA conditions. Shell developmentrates were reduced at aragonite conditions of 1.06–1.31
and 1.27–1.60 in experiments 1 and 2, respectively. Thisfinding is in agreement with reports by others who haveshown that shell formation of Pacific oyster larvae is im-pacted at ΩARAG below 1.5 [33]. In both of our replicateexperiments, the low ΩARAG treated larvae started form-ing their shells at a later time than in ambient condi-tions. There seems to be a particularly large difference atthe 14 and 16 h time points, indicating a developmentaldelay for larvae exposed to low ΩARAG conditions. Thisis consistent with the results for larvae of bivalve mol-lusks (e.g. [27, 30, 37]) and of purple sea urchins [38],and suggests that the gene expression patterns corre-lated with shell formation have shifted as a result of ex-posure to low ΩARAG conditions.
Differentially expressed transcriptsThere are many more significantly differentiallyexpressed transcripts between low ΩARAG and ambienttreatments in the first replicate experiment than in thesecond. This is most likely a result of the fact that in the
Experiment 1(578) Experiment 2
(72)Overlap(55)
Fig. 2 Summary of replicate experiment 1 expression in transcripts with significant time*treatment effect shared by both replicate experiments(Mean ± SEM, n = 55). Individual transcript expression is given in Additional file 5: Figure S2. Expression in ambient water is given in the solid line,low ΩARAG in the dashed line. Expression levels have been normalized by maximum expression level (1) for each transcript. Inset Venn diagramshows the number of significant transcripts shared among the replicate experiments
De Wit et al. BMC Genomics (2018) 19:160 Page 5 of 15

first replicate experiment sequencing depth is twice ashigh for most time points. Despite this difference, thereremains a remarkable overlap between the two replicateexperiments: 55 out of the 72 significantly differentiallyexpressed transcripts from replicate experiment 2 arealso significantly differentially expressed in replicate ex-periment 1. Interestingly, all of the annotated genes fromthis list can be divided into only four functional categor-ies: Metabolic Functions, Transmembrane Proteins(transporters), Shell Matrix Proteins and Protease Inhibi-tors. The metabolic genes are too few to result in signifi-cant enrichments for any metabolic GO category, andare restricted to specific types of metabolism, especiallylipid breakdown. This could be associated with fastercalcification rates in ambient seawater, as is also shownby increased expression of ion transporters and matrixprotein transcripts, or by a switch in energy allocation asreported in sea urchin larvae [22]. It is somewhat unex-pected to observe such a high number of protease inhib-itors in this list; however, this type of inhibitor plays avery important role in preventing proteins from beinghydrolysed by endopeptidases, and could be involved inshell formation as a way of protecting shell matrix pro-teins as they are secreted to form the extracellularmatrix for mineral deposition [39]. This would especiallybe the case for the metallo-proteinase inhibitors, such aspapilin [40], which could potentially protect importantprotein – CaCO3 bonds. As aragonite formation ishighly sensitive to the organisation of the shell proteinmatrix [41], degradation of some of the matrix proteinscould cause the aragonite crystals to become depositedin a sub-optimal manner which would, in turn, affect theintegrity of the shell. This could be a cause for the highnumbers of deformed shells observed in low ΩARAG
treatments (e.g. [27, 33]).Several of the differentially expressed transcripts are
from genes known to code for parts of the shell matrix,such as nacrein [42], papilin (also a metalloprotease in-hibitor; [40]), chitin-binding protein [43] and a proteinwith a beta-lactamase domain that is known to be partof the shell matrix, but with a currently unknown func-tion [44]. Nacrein has a carbonic anhydrase domain [42],and has previously been shown to be strongly expressedprior to the initiation of shell formation in blue mussels[45]. Furthermore, several calcium binding proteins arerepresented here, and quite a few proteins involved inextracellular matrix agglutination, such as lectin, colla-gen, EF-Hand, thrombospondin and fibrinogen.Transmembrane proteins are also found in this list,
such as the ion channel protein caveolin, that is knownto be involved in subcellular compartmentalization andvacuolar organization [46] as well as prominin that is in-volved in the organization of plasma membranes [47].Interestingly, this list also includes transmembrane
Table 2 Thirthy-seven annotated transcripts with significanttime * treatment effects in both replicate experiments, dividedinto four main functional categories. All are more highlyexpressed in ambient conditions
Metabolic transcripts Annotation
CGI 10022578 Cytochrome P450
CGI 10025516 Sulfotransferase
CGI 10011094 Lipase
Transmembrane proteins Annotation
CGI 10005173 Prominin
CGI 10024903 Transmembrane ion-channel
CGI_10009289 DEATH-like
CGI 10012122 Ganglioside activator protein
CGI 10007940 Caveolin
CGI 10011750 Transmembrane protein of unknown function
CGI 10012368 Pedal peptide
CGI 10022868 Leucine-rich glioma-inactivated protein
Shell matrix proteins Annotation
CGI 10016584 C-type lectin
CGI 10024633 Chitin-binding protein
CGI 10024602 Fibrinogen, alpha/beta/gamma chain
CGI 10000698 Carbonic anhydrase / Nacrein-like protein
CGI_10027654 C-type lectin
CGI_10027048 Low-density lipoprotein receptor -like
CGI_10001361 EGF-like calcium-binding protein
CGI 10005422 Beta-lactamase-type transpeptidase
CGI_10016583 C-type lectin
CGI_10022862 Toll-like receptor
CGI_10024126 Thrombospondin
CGI_10025037 Calcium-binding EF-hand
CGI_10020619 EF-HAND 2
CGI_10013619 Temptin
CGI_10010907 Galactose-binding protein
CGI_10007447 Collagen alpha-6(VI) chain-like
Protease inhibitors Annotation
CGI 10016790 Metalloproteinase inhibitor I3 5
CGI 10015381 Peptidase S1A, chymotrypsin-type
CGI 10018666 Cystatin-A2
CGI 10012273 Peptidase S1A, chymotrypsin-type
CGI 10010153 Protease inhibitor, Kazal-type
CGI 10020625 Peptidase S1A, chymotrypsin-type
CGI 10010888 Protease inhibitor, Kazal-type
CGI 10025096 Proteinase inhibitor I14/I15, hirudin/antistatin
CGI 10020818 Proteinase inhibitor I2, Kunitz metazoa
CGI 10021289 Proteinase inhibitor I2, Kunitz metazoa
De Wit et al. BMC Genomics (2018) 19:160 Page 6 of 15
proteins mostly known as neurotransmitters, such as aganglioside activator protein, a leucine-rich glioma inac-tivated protein [48], the Aplysia “pedal peptide” gene[49] and a protein containing a DEATH-like domain[50]. These proteins could be involved in transport ofions across the plasma membrane, which in some casescan be associated with neuronal activity, but also in shellformation [51]. Altogether, this list paints an image of amachinery which binds calcium ions and synthesizesmatrix proteins, then transports these componentsacross the plasma membrane to the external environ-ment while ensuring that the matrix proteins are not hy-drolysed by proteases before calcium carbonate crystalshave been deposited.
Weighted gene correlation network analysisThe clustering approach allows us to “zoom out” frominvestigations of individual transcripts to instead get an
overview of cellular functioning. The large number oftranscripts falling into the co-expression cluster morehighly expressed in the ambient than in the low ΩARAG
treatment highlights that the cellular response to ara-gonite saturation stress involves many genes/pathways.While being more sensitive and thus causing more GOcategories to be enriched, the clustering result agreesstrongly with the result of the individual transcript ana-lysis (significant time*treatment transcripts) in that thecategories can be grouped into ion transport, proteinsynthesis, extracellular matrix proteins, and a few meta-bolic pathways (lipid breakdown). One type of transcriptthat is highly overrepresented in many of these categor-ies is dynein (both cytoplasmic and axonemal). Dyneinmotor proteins are well-known major transporters ofcellular components, and it is possible that these have arole in the transport of the building blocks of the shellmatrix to the location where it should be deposited.
a b
Fig. 3 Weighted gene correlation network modules and normalized expression levels. Input data have been pre-filtered to include only transcriptsshowing a positive time-coefficient, a variance > 1 and total counts > 10. Correlation dendrograms are on top, expression of modules below.Expression plots list time-point zero in the middle, expression in ambient (Control: C) to the right and expression in low ΩARAG (Treatment: T) tothe left. (a) Replicate experiment 1, dendrogram on top shows that transcripts are grouped in two modules, of which the “blue” module hashigher expression in ambient after 14 h post-fertilization; (b) Replicate experiment 2, dendrogram on top shows that transcripts are grouped infour modules, of which the “blue” module has higher expression in ambient after 14 h post-fertilization
De Wit et al. BMC Genomics (2018) 19:160 Page 7 of 15
The GO category “viral capsid” is also enriched in rep-licate experiment 1. This could seem surprising at firstsight, but these are all chitin-binding proteins and thuslikely to be part of the shell formation machinery [43].Transmembrane serine protease and antistasin are also
commonly found in the enriched GO categories. Theseare genes known to have a part in immune defence andregulation of coagulation in other organisms [52, 53],and is possible that these genes also have a role in thecontrol of the deposition of shell matrix proteins inlarval oysters.
Comparison with previous workAs part of the work describing the C. gigas genome, geneexpression profiles of developing oyster larvae wereproduced [10]. Mining this resource (https://www.ncbi.nlm.nih.gov/bioproject/PRJNA146329) for ex-pression levels in the 55 transcripts exhibiting significanttime*treatment interactions in our data, we see consist-ent patterns with those of Zhang et al. [10] who foundthat all of these transcripts also started being expressedduring the transition between “trochophore” and “earlyD shaped larva” stages, some of these to extremely highexpression levels. Interestingly, however, Zhang et al.[10] found that some of these transcripts only reachedtheir maximum expression levels at later developmentalstages, hours or even days after the end of our experi-ment, while others were highly expressed only in D-larvae. It is reasonable to expect that there are differentmechanisms involved in the initial process of shell nu-cleation, compared to later shell formation stages wherearagonite layers are being deposited on pre-existinglayers, thus it makes sense to pay special attention togenes expressed in only early D-larvae. Unfortunately,however, the transcripts which Zhang et al. [10] foundto be most highly expressed at this stage are not anno-tated (e.g. CGI_10010907, CGI_10022681, CGI_10014978, CGI_10022681), thus their functions are not known.Further experiments using molecular biological tools toelucidate the functions of these genes could be an inter-esting subject of future research.Using a proteomics approach, Huan et al. [9] identified
a number of proteins differentially expressed betweentrochophore (11 h post-fertilization) and D-larvae (21 hpost-fertilization). Some of the expressed proteins couldalso be categorized as matrix proteins (e.g. tubulin,tropomyosin) and protein modification factors. Differ-ences between their results and those of our study couldhave been due to a number of factors, for example thetiming of sampling points, differences in oyster popula-tion used, or a lack of correlation between transcript andprotein expression [22].In a recent article, Wang et al. [21] found that adenylyl
cyclase was an important mediator of bicarbonate ion
concentrations and intracellular pH in low ΩARAG con-ditions in adult C. gigas. Interestingly, it seems that thesame mechanism is also important in larval oysters, asshown by both adenylyl and guanylyl cyclases beingcommonly found in our enriched GO categories.Guanylyl cyclase is also known to mediate the import ofcalcium ions into cells, through production of cyclicguanosine monophosphate (cGMP), which can act tokeep cGMP-mediated calcium ion channels open [20].Alkaline phosphatases, such as adenylyl cyclase, havealso been found to be highly expressed in the gastropodBiomphalaria glabrata just prior to the onset of shellformation [54].Huan et al. [19] identified a tyrosinase gene (cgi-tyr1)
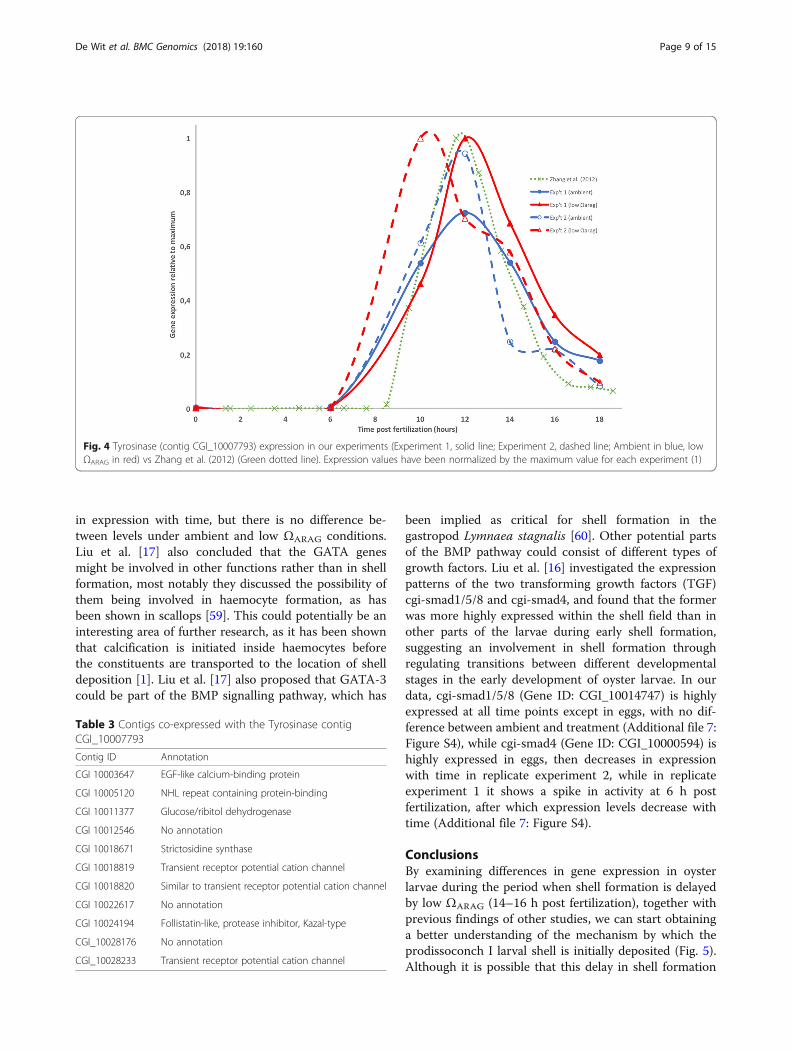
in C. gigas which was highly expressed in the trocho-phore and D-larvae stages but not later in larval devel-opment. More recently, Yang et al. [55], found that thehomolog in C. angulata (Ca-tyrA1) was expressed espe-cially in trochophore larvae, but was also significantlyupregulated in a high pCO2 treatment (3000 ppm). Theauthors concluded that this was likely in response tohigh pCO2 induced shell damage, and that Ca-tyrA1 wasinvolved in larval shell repair. Wang et al. [56] proposedthe involvement of a tyrosinase gene (CGI_10017214) inthe shell formation process following shell damage inadult C. gigas. An important role of tyrosinases in thefirst stages of shell repair in the blue mussel Mytilusedulis, has also recently been discussed [57]. Our datasupport previous work in that the tyrosinase gene (geneID CGI_10007793; available at http://www.uniprot.org/uniprot/U5U0P0) is highly expressed before shell forma-tion starts (10–14 h post-fertilization), perhaps in associ-ation with formation of the larval pellicle orperiostracum [18, 55, 58], and then the expression leveldecreases rapidly. In addition, the transcripts areexpressed more in the low ΩARAG treatment than in am-bient during these hours and the larvae in low ΩARAG inreplicate experiment 2 peak in tyrosinase expression sev-eral hours earlier than remaining treatments (Fig. 4).Examining the expression data from Zhang et al. [10]shows that there the tyrosinase contig (CGI_10007793)was highly expressed at 11.5–13.5 h (Fig. 4). In addition,this contig clusters (using the WGCNA approach as de-scribed above) in a co-expression cluster together with11 other contigs, out of which several are cation channelproteins and potential matrix proteins (Table 3). Thesetranscripts would be interesting candidates for furtherstudy of their role in the onset of shell formation.In search of regulatory proteins controlling larval shell
formation, Liu et al. [17] found that the transcriptionfactor GATA2/3 was expressed in the edge of the shellduring trochophore and D-larval stages in C. gigas. Inour dataset, GATA3 (GeneID: CGI_10013217) is mosthighly expressed at 6 h post fertilization, then decreases
De Wit et al. BMC Genomics (2018) 19:160 Page 8 of 15
in expression with time, but there is no difference be-tween levels under ambient and low ΩARAG conditions.Liu et al. [17] also concluded that the GATA genesmight be involved in other functions rather than in shellformation, most notably they discussed the possibility ofthem being involved in haemocyte formation, as hasbeen shown in scallops [59]. This could potentially be aninteresting area of further research, as it has been shownthat calcification is initiated inside haemocytes beforethe constituents are transported to the location of shelldeposition [1]. Liu et al. [17] also proposed that GATA-3could be part of the BMP signalling pathway, which has
been implied as critical for shell formation in thegastropod Lymnaea stagnalis [60]. Other potential partsof the BMP pathway could consist of different types ofgrowth factors. Liu et al. [16] investigated the expressionpatterns of the two transforming growth factors (TGF)cgi-smad1/5/8 and cgi-smad4, and found that the formerwas more highly expressed within the shell field than inother parts of the larvae during early shell formation,suggesting an involvement in shell formation throughregulating transitions between different developmentalstages in the early development of oyster larvae. In ourdata, cgi-smad1/5/8 (Gene ID: CGI_10014747) is highlyexpressed at all time points except in eggs, with no dif-ference between ambient and treatment (Additional file 7:Figure S4), while cgi-smad4 (Gene ID: CGI_10000594) ishighly expressed in eggs, then decreases in expressionwith time in replicate experiment 2, while in replicateexperiment 1 it shows a spike in activity at 6 h postfertilization, after which expression levels decrease withtime (Additional file 7: Figure S4).
ConclusionsBy examining differences in gene expression in oysterlarvae during the period when shell formation is delayedby low ΩARAG (14–16 h post fertilization), together withprevious findings of other studies, we can start obtaininga better understanding of the mechanism by which theprodissoconch I larval shell is initially deposited (Fig. 5).Although it is possible that this delay in shell formation
Fig. 4 Tyrosinase (contig CGI_10007793) expression in our experiments (Experiment 1, solid line; Experiment 2, dashed line; Ambient in blue, lowΩARAG in red) vs Zhang et al. (2012) (Green dotted line). Expression values have been normalized by the maximum value for each experiment (1)
Table 3 Contigs co-expressed with the Tyrosinase contigCGI_10007793
Contig ID Annotation
CGI 10003647 EGF-like calcium-binding protein
CGI 10005120 NHL repeat containing protein-binding
CGI 10011377 Glucose/ribitol dehydrogenase
CGI 10012546 No annotation
CGI 10018671 Strictosidine synthase
CGI 10018819 Transient receptor potential cation channel
CGI 10018820 Similar to transient receptor potential cation channel
CGI 10022617 No annotation
CGI 10024194 Follistatin-like, protease inhibitor, Kazal-type
CGI_10028176 No annotation
CGI_10028233 Transient receptor potential cation channel
De Wit et al. BMC Genomics (2018) 19:160 Page 9 of 15

is due to a general developmental delay, almost all of thedifferentially expressed transcripts observed in this studyseem to be related to shell deposition. Our data suggestthat the shell formation mechanism can be divided intothree different main parts, namely 1) transport of ionsacross plasma membranes, 2) secretion of shell matrixproteins, and 3) production of protease inhibitors (Fig.5). Increased expression of transcripts for calcium ionpumps suggests increased release of calcium ions intothe epithelial space that would result in elevated aragon-ite saturation states. Dynein motor proteins may trans-port shell matrix proteins to this external space,facilitating and perhaps controlling the deposition rateand organization of shell aragonite crystals, althoughthese observed expression changes could potentially alsobe due to other cellular processes. We also observed in-creased transcription of genes for chitin catabolism –chitin has been reported to be present in larval shells[43]. The role of the significant increase in transcriptsfor protease inhibitors in unknown, but one mayhypothesize that they are important in preventing break-down of proteins involved in shell formation (Fig. 5).At later stages of development, it has been shown that
metabolism is affected by aragonite saturation condi-tions, but this effect seems to be minor and associated
with breakdown of lipid energy reserves during theperiod from 14 to 16 h post fertilization when larvae arestarting the process of shell formation. Thus, productionof shell matrix and other proteins would seem to befueled by higher rates of lipid breakdown, based on in-creased transcription of genes coding for lipases.Interestingly, we do not see any gene expression differ-
ences in genes previously hypothesized to be involved inthe shell formation signalling pathway. This could bedue to a lack of power due to low replication in thisstudy, or it could actually be that the signalling pathwayremains unaffected by the water chemistry, and that thedetrimental effects of low ΩARAG on shell formation oc-curs downstream at the shell matrix level. We do, how-ever, see a spike in expression of genes coding fortyrosinase prior to the onset of shell formation (10–12 hpost fertilization), which is stronger in low ΩARAG, aswas recently also described in C. angulata [55]. Thisspike probably results in cross-linking of proteins andformation of the early larval pellicle. It is unlikely, how-ever, that the pellicle can form a completely sealed spacebetween itself and the outer shell-forming, epitheliallayer of the developing larva by 14–16 h postfertilization. In support of this contention, Waldbusseret al. [7] reported that carbon isotopes of the early oyster
Fig. 5 Schematic representation of biological and chemical processes at the leading edge of shell formation in a developing Pacific oyster larvaat ~ 14 h post fertilization. Solid arrows indicate biological processes identified by differentially expressed transcripts, dashed arrows indicatetransport of inorganic molecules into and out of the site of calcification
De Wit et al. BMC Genomics (2018) 19:160 Page 10 of 15

larval shell were dominated by those from the externalseawater medium and not from respired carbon. Thelack of a sealed external epithelial space also suggeststhat hydrogen ions, formed by formation of carbonate,as well as calcium ions can also be exchanged by diffu-sion with the external seawater medium [7] (Fig. 5).This study describes how low ΩARAG affects gene ex-
pression and shell formation of early oyster larvae. Theidentified genes, which show changes in expression as aresult of OA conditions may play an important role indetermining the capacity of oyster larvae to respond tofuture OA stress under natural and hatchery conditions.
MethodsLarval cultureCommercial broodstock of Crassostrea gigas was obtainedfrom Netarts Bay, Oregon, USA, in August 2014. Recentpublications have suggested that broodstock exposure tohigh pCO2 seawater may result, alternatively, in more ro-bust larvae [61] or compromised ones [62]. In order tosimplify our experiments, we chose to maintain all brood-stock in ‘optimal’ conditions with pH ≈ 8.0–8.3 andΩARAG > 2 (buffered with sodium carbonate) at atemperature of 19-20 °C prior to experimentation at theHatfield Marine Sciences Center (HMSC), Oregon StateUniversity, Newport, Oregon, USA. Eggs from two fe-males were collected through strip spawning and eachsample was equally divided into four aliquots in seawaterat ambient ΩARAG (> 2) and 25 °C. Each aliquot from eachfemale was fertilized with sperm from one of four males.After one hour, fertilization was confirmed and excesssperm were removed by washing the eggs on a 20 μmmesh sieve, then equal numbers of fertilized eggs fromeach cross were combined. After pooling, the eggs werecounted and ≈50,000 eggs were sampled for RNA by pre-serving them in RNAlater. Eggs were stocked in sealed 1 Lglass jars approximately 2 h post fertilization at a densityof 40 eggs ml− 1, as prior trials hatching C. gigas larvae upto 80 eggs ml− 1 had shown no adverse effects to densityat this age. The larvae were reared in either ambient(ΩARAG ≈ 2.5–3.0) or low ΩARAG (ΩARAG ≈ 1.0–1.25)treatment conditions. The level of seawater acidificationselected for the low ΩARAG treatment was chosen in orderto increase the likelihood of generating sufficient larval de-velopmental delay. In full salinity seawater (≈33 ppt), apCO2 level of ≈1500 ppm results in ΩARAG of 1–1.5, arange that impedes shell formation [33] and is also rou-tinely observed during periods of upwelling along theWest Coast USA [25].Seawater types for each treatment were prepared by
filling two 200 L tanks with full strength seawater(≈32 ppt) ≈ 18 h before the start of each experiment andaerating them vigorously with outside (ambient) air toallow the seawater to equilibrate with ambient CO2
concentrations overnight. Next, a mixture of outside airand pure CO2 moderated by mass flow controllers (Ali-cat Scientific, Tuscon, AZ), was bubbled into the lowΩARAG seawater tank for ≈2 h until a pH of 7.5 wasreached. Nominal pH values were measured using anOrion Star A211 pH meter with a Ross Ultra pH/ATCtriode probe (Thermo Fisher scientific) calibrated withNBS buffers and standardized with a certified seawaterreference (Batch 22, A.G. Dickson, Scripps Institution ofOceanography, US.). Seawater for both ambient and lowΩARAG conditions were transferred from correspondingstorage tanks to sealed 1 L glass jars (VWR scientific,part no. 89094–014) filled with 800 mL seawater imme-diately prior to stocking with eggs and were sealed witha screw top lid. Cultures were treated prophylacticallywith 2 ppm of the antibiotic chloramphenicol to reducebacterial respiration. Previous experiments had indicatedthat this antibiotic treatment had no effect on larvalgrowth and survival [63]. Larvae were sampled at 6, 10,12, 14, 16 and 18 h post fertilization from two independ-ent replicate glass jars for both ambient and low ΩARAG
conditions which results in a total of 24 samples.At each sampling point, temperature, salinity and pH of
the culture medium were measured, then sample watervolumes from each duplicate vessel per treatment were si-phoned through a screen (attached to the end of a siliconetube immersed in the culture vessel to prevent larval re-moval) into a 350 ml amber glass bottle. Each sample waspreserved by the addition of 30 μl saturated HgCl2 andsealed with a polyurethane-lined metal crimp cap, untilsubsequent carbonate chemistry analysis was performed(see below). The remaining culture volume was sievedonto a 25 μm mesh screen to retain larvae, which werethen re-suspended in 25 ml of ambient or low ΩARAG sea-water, depending on their exposure treatment. Larval con-centrations were estimated by aliquoting 30 μl (n = 3)volumes of vigorously agitated suspensions and countinglarvae in the samples under a microscope.At all sampling points, except at 6 h post fertilization,
two to three hundred developing larvae were transferredto 20 ml shell vials with 10 ml of seawater, to which250 μl of buffered formalin (pH 8.2) was added, for lateranalyses of shell deposition by means of cross-polarizedlight (CPL) microscopy (see below). Remaining larvaewere concentrated by centrifugation (2 min at4500 rpm) after addition of 10 ml distilled water to re-duce larval buoyancy to facilitate pellet formation, afterwhich all supernatant seawater was immediately re-moved. Larvae (ca. 10,000/sample) were then flash fro-zen in liquid nitrogen in order to break larval shells toallow RNAlater to quickly infuse into larval tissues. Thetime period from addition of freshwater to flash freezingof samples was less than 5 min to avoid effects of sam-pling on gene expression. Samples were stored in
De Wit et al. BMC Genomics (2018) 19:160 Page 11 of 15
RNAlater and divided between two replicate 1.5 mlEppendorf tubes for later transcriptomic analyses (seebelow). All tubes were maintained at 4 °C for 24 h, thenstored at − 20 °C until RNA extraction.The entire experiment was repeated a few days later
using the same methodology but different broodstock(from the same source) was used and sperm from fivemales instead of four were added to batches of eggs fromeach of two females. In addition, eggs were stocked at adensity of 20 eggs/ml (rather than 40 in experiment 1),resulting in ca. 5000 larvae per replicate culture sampledfor transcriptomic analyses.
Water chemistry analysesPreserved water samples were analysed by the lab ofDr. Burke Hales at Oregon State University followingthe procedure outlined by Hales et al. [64] andBandstra et al. [65] to obtain values for sample totaldissolved carbon dioxide (TCO2), pCO2, and seawaterpH, from which ΩARAG values were calculated. Thismethod has been shown to be highly accurate, provid-ing TCO2 and pCO2 estimates with < 0.2% and < 5%uncertainty, respectively [7].
Shell deposition measurementsLarvae from each time point were analysed for calcifica-tion using cross-polarized light (CPL) microscopy as de-scribed by Waldbusser et al. [5]. Patterns of refractivelight viewed under CPL indicated deposition of crystal-line calcium carbonate (aragonite) in the process of shellformation. A fully formed shell is curved and the sec-ondary refraction of the polarized light creates a “Mal-tese cross” pattern: a dark cross area over the center ofthe otherwise illuminated larval shell. In this way, wewere able to classify larvae into three categories: non-calcified, partially calcified and fully calcified (shelled)larvae for each sample. From these data, a “calcificationindex” (CI) was calculated as: CI = (FC + (PC ∗ 0.5))/TL,where FC, PC and TL denote the numbers of observedfully calcified, partially calcified and total larvae fromeach sample, respectively (Fig. 1). In order to determinethe statistical significance of difference in timing of calci-fication onset and rate of shell formation, calcificationindex data from hour 10–18 (period over which calcifi-cation occurred) was arcsine transformed and fit with ageneralized linear model (GLM) with the formula: CI~β-Time ∗ βTrt ∗ βExp, where βTime, βTrt and βExp represent es-timates for time (hours post fertilization), treatment(seawater pCO2) and experiment number, respectively.The “full” model (with all interactions) was subsequentlysubmitted to backwards stepwise AIC selection (“ste-pAIC” in R) to generate a final optimal fit model withthe formula CI~βTime + βTrt + βExp + (βTime x βTrt)+ (βTime x βExp). Associated p-values for each parameter
were calculated on Type I sum of squares based on achi-squared distribution.
Transcriptomic analysesRNAlater-fixed larvae were transported to the SvenLovén Centre for Marine Sciences, Tjärnö, Sweden,where total RNA was extracted using a Qiagen RNeasykit (Qiagen, Hilden, Germany), following the standardprotocol. RNA concentrations were measured using aQuBit 2.0 RNA fluorometric assay (Thermo Fisher Sci-entific, Waltham, MA, USA) and integrity was assessedwith a 3-(N-morpholino)propanesulfonic acid (MOPS)denaturing agarose gel. Complementary DNA (cDNA) li-braries were prepared using the Illumina TruSeq v2mRNA sample prep kit (Illumina, San Diego, CA, USA),following a standard protocol. Briefly, mRNA was iso-lated with poly-A selection, followed by cDNA synthesis,Illumina standard index adapter ligation and a brief PCRreaction. Concentrations of the cDNA libraries weremeasured using a QuBit DNA High-sensitivity assay(Thermo Fisher Scientific, Waltham, MA, USA) andfragment length distributions were assessed using anAgilent TapeStation with a D1000 tape (Agilent, SantaClara, CA, USA). cDNA libraries were multiplexed byequimolar pooling (6 or 7 samples/pool), and were thensent to the Swedish National Genomics Infrastructure’sSNP & SEQ platform in Uppsala for Illumina HiSeq2500 sequencing (8 lanes; 50 bp Single-End sequencing;Illumina, San Diego, CA, USA).Bioinformatic analyses were performed on the Univer-
sity of Gothenburg computer cluster Albiorix (http://albiorix.bioenv.gu.se) where raw reads were trimmed oflow-quality (Q < 20) ends and Illumina adapter se-quences were removed using the fastx toolkit (http://hannonlab.cshl.edu/fastx_toolkit/). All reads weremapped to the oyster genome v9 coding regions (avail-able at “ftp.ensemblgenomes.org/pub/metazoa/release-34/fasta/crassostrea_gigas/cds/Crassostrea_gigas.G-CA_000297895.1.31.cds.all.fa.gz”) using the Burrows-Wheeler Aligner (bwa) (http://bio-bwa.sourceforge.net/[66]), allowing for four mismatches, after which countdata for each contig was extracted using a custom script(all scripts available at https://github.com/DeWitP/Bioinformatic_Pipelines/tree/master/RNA-Seq_mater-ials/scripts). Only reads mapping uniquely to one gen-ome contig were considered. Duplicates were initiallyremoved from alignment files in order to assess the ef-fects of duplicate reads. After determining that the pro-portion of duplicates was low and correlated tosequencing depth, we decided to keep the duplicatereads, as is customary. To be able to compare count dataacross samples with differences in sequencing depth, thecount data were scale-normalized using the estimateSi-zeFactors function in the DESeq package [67] in R.
De Wit et al. BMC Genomics (2018) 19:160 Page 12 of 15

Scale-normalized count data were then analysed in Rindependently for each replicate experiment (n = 2) inseveral different ways. Firstly, transcripts with low variance(< 1) and with low counts (total counts < 10) were filteredout, after which exponential curves were fitted to thecount data, keeping only transcripts showing increasedexpression with time in the ambient treatment. This wasdone in order to filter out transcripts with peak expressionlevels in the newly fertilized eggs or prior to the onset ofshell formation, as well as transcripts showing no variationin expression over the experimental period.With the filtered datasets, we then fitted log-linear
curves of the type: log(y) = β0 + β1time + β2treatment+ β3(time ∗ treatment) to the transcripts of larvae from theambient and low ΩARAG treatments, while forcing expres-sion to be 0 at time point 0 (time of fertilization) (i.e. β0 =0), and keeping transcripts with a significant (p < 0.05)time*treatment interaction after a Benjamini-Hochbergfalse-discovery rate correction (Fig. 2). The lists of signifi-cant transcripts were annotated when possible using theoyster genome annotation and compared across replicateexperiments for overlap (Additional file 5: Figure S2).Transcripts with significant effects of time*treatment
in both replicated experiments were examined for non-random distributions of function using a functionalenrichment Gene Score Resampling (GSR) analysis inErmineJ [68]. Briefly, GSR analysis examines the distri-bution of functions (given by the Gene Ontology (GO)annotation from Zhang et al. [10]) in the transcripts ofinterest, and compares that to what would be expectedfrom a random draw of all the gene models in the gen-ome. Significant deviations from the expected randomdistribution can then be interpreted as evidence for abiological importance of function with regard to experi-mental treatments. The advantage of this approach isthat it can identify patterns of biological relevance inlists of transcripts, while overcoming the issue of noiseat transcript-level in gene expression data.The filtered datasets were also analysed for gene regu-
latory co-expression clusters, using a weighted gene cor-relation network analysis (WGCNA package in R [69])with Pearson correlation scores. This type of analysis isuseful in that it summarizes all of the variation in a largedataset into correlation clusters, assigns transcripts tothe different clusters and allows for visual examinationfor clusters showing expression patterns of interest. Inorder to do this, counts were first normalized acrosstranscripts by dividing by the mean count level at 14 hpost fertilization in the ambient treatment (point chosenarbitrarily as mean counts were never 0). Transcripts be-longing to clusters showing different expression profilesbetween ambient and low ΩARAG treatments wereextracted and analysed for GO enrichment in ErmineJ asdescribed above.
Additional files
Additional file 1: Table S1. Aragonite saturation states in ambient andlow aragonite saturation state treatments in the two replicateexperiments. (PDF 516 kb)
Additional file 2: Table S2. Results of Type I sum of squares for GLMmodelling the response variable Calcification Index (CI) as a function ofthe independent variables βtime, βTrt, and βExp representing time (hourspost fertilization), seawater treatment and experiment number,respectively, along with two 2-way interactions between time and treat-ment (βtime x βTrt) and time and experiment (βtime x βExp). All parametersare deemed significant on a p = 0.05 threshold. (DOCX 13 kb)
Additional file 3: Table S3. Quality statistics for all samples. Samplenames include: Time post-fertilization (in hours), treatment (C = ambient,T = low Ωarag), and Replicate number (A or B). (XLSX 12 kb)
Additional file 4: Figure S1. Mapping statistics for all samples, withand without duplicate reads. Sample names include: Time post-fertilization (in hours), treatment (C = ambient, T = low Ωarag), and Repli-cate number (A or B). (XLSX 17 kb)
Additional file 5: Figure S2. Expression of transcripts with significanttime x treatment effect in both replicate experiments. (PDF 1564 kb)
Additional file 6: Figure S3. Summary of functional enrichment resultsof the WGCNA clusters showing differences in expression acrosstreatments (“blue” clusters in Fig. 3), as well as the 55 transcripts showingsignificant time*treatment effects (Fig. 2). (XLSX 12 kb)
Additional file 7: Figure S4. Relative (to maximum) expression of (A) cgi-smad1/5/8 and (B) cgi-smad4 in the two replicate experiments. (PDF 576 kb)
AbbreviationsAIC: Akaike Information Criterion; BMP: bone-morphogenetic-protein;bwa: Burrows-Wheeler aligner; CaCO3: Calcium carbonate;cDNA: complementary DNA; cGMP: cyclic guanosine monophosphate;CI: Calcification index; CO2: Carbon dioxide; CPL: Cross-polarized light;FDR: False discovery rate; GLM: Generalized linear model; GO: Gene ontology;GSR: Gene score resampling; HMSC: Hatfield Marine Sciences Center;MOPS: 3-(N-morpholino)propanesulfonic acid; OA: Ocean Acidification;pCO2: partial pressure of carbon dioxide in seawater; TCO2: total dissolvedcarbon dioxide; TGF: transforming growth factor; US: United States ofAmerica; WGCNA: Weighted Gene Correlation Network Analysis;ΩARAG: Aragonite saturation state
AcknowledgementsThe authors would like to acknowledge support from Science for LifeLaboratory, the National Genomics Infrastructure, NGI, and UPPMAX forproviding assistance in massive parallel sequencing and computationalinfrastructure. We would also like to thank NBIS Bioinformatics support forassistance in data analysis. All bioinformatics analyses were run on theAlbiorix computer cluster (http://albiorix.bioenv.gu.se/) at the Department ofMarine Sciences, University of Gothenburg. In addition, we acknowledgeBurke Hales, the College of Earth, Ocean and Atmospheric Sciences atOregon State University, for seawater carbonate chemistry analysis, theadvice from George Waldbusser, College of Earth, Ocean and AtmosphericSciences, OSU in adjusting carbonate chemistry parameters of the seawatertreatments, and the Oregon Oyster Company for providing oysters. Travelsupport was provided by the Lavern Weber Fellowship for visiting scientiststo the Hatfield Marine Science Center, Oregon State University. Support forsequencing was provided also by the Magnus Bergwall foundation, HelgeAx:son Johnson foundation, Adlerbertska foundation, Längmanskafoundation and the Royal Society of Arts and Sciences in Sweden. PDW wassupported by the Marcus and Amalia Wallenberg foundation. AV wassupported by CACHE, a Marie Curie Initial Training Network (ITN) funded bythe People Programme (Marie Curie Actions) of the European Union’sSeventh Framework Programme FP7/2007-2013/ under REA grant agreementn° [605051]13. ED was partially funded by USDA-ARS (CRIS Project Number2072-31000-004-00D).This report was prepared by Oregon Sea Grant under award numberNA14OAR4170064 (project number R/SAQ-20) from the National Oceanicand Atmospheric Administration (NOAA), U.S. Department of Commerce,
De Wit et al. BMC Genomics (2018) 19:160 Page 13 of 15

and by appropriations made by the Oregon State Legislature. Thestatements, findings, conclusions, and recommendations are those of theauthors and do not necessarily reflect the views of these funders.
FundingAll experimental work was funded by Oregon Sea Grant under awardnumber NA14OAR4170064. All DNA sequencing was funded by the MagnusBergwall foundation, Helge Ax:son Johnson foundation, Adlerbertskafoundation, Längmanska foundation and the Royal Society of Arts andSciences in Sweden. The funding bodies had no role in the design of thestudy and collection, analysis, and interpretation of data, or in writing themanuscript.
Availability of data and materialsAll raw Illumina data was submitted to the NCBI Short Read SequenceArchive (SRA) under the BioProject accession code PRJNA306408. Raw readcount data with and without duplicate reads and the full output of thefunctional enrichment tests have been deposited on the Dryad digitalrepository http://datadryad.org, DOI:https://doi.org/10.5061/dryad.8m5v4. Allcustom scripts are available on GitHub at: https://github.com/DeWitP/Bioinformatic_Pipelines/tree/master/RNA-Seq_materials/scripts.
Authors’ contributionsPDW, ED, AV & CJL are responsible for project planning. PDW, ED & AVperformed all experimental work. PDW is responsible for all transcriptomicanalyses and manuscript writing. ED is responsible for water chemistry andmicroscopic analyses. CJL is responsible for funding and providing oystergrowing facilities. PDW, ED, AV & CJL all contributed to the final version ofthe manuscript. All authors read and approved the final manuscript.
Ethics approval and consent to participateNot applicable as oysters do not require ethical permits. No permits wererequired for the collection of oysters from the hatchery.
Consent for publicationNot applicable.
Competing interestsThe authors declare that they have no competing interests.
Publisher’s NoteSpringer Nature remains neutral with regard to jurisdictional claims inpublished maps and institutional affiliations.
Author details1Department of Marine Sciences, University of Gothenburg, Strömstad,Sweden. 2Department of Fisheries and Wildlife and Coastal Oregon MarineExperiment Station, Oregon State University, Newport, Oregon, USA.3Department of Biological and Environmental Sciences, University ofGothenburg, Fiskebäckskil, Sweden.
Received: 14 November 2017 Accepted: 31 January 2018
References1. Mount AS, Wheeler AP, Paradkar RP, Snider D. Hemocyte-mediated
shell mineralization in the eastern oyster. Science. 2004;304:297–300.2. Marin F, Luquet G, Marie B, Medakovic D. Molluscan shell proteins: primary
structure, origin, and evolution. Curr Top Dev Biol. 2007;80:209–76.3. Stenzel HB. Aragonite and calcite as constituents of adult oyster shells.
Science. 1963;142:232–3.4. Stenzel HB. Oysters: composition of the larval shell. Science. 1964;145:155–6.5. Waldbusser GG, Gray MW, Hales B, Langdon CJ, Haley BA, Gimenez I, et al.
Slow shell building, a possible trait for resistance to the effects of acuteocean acidification. Limnol Oceanogr. 2016;61:1969–83.
6. Kniprath E. Ontogeny of the molluscan shell field : a review. Zool Scr. 1981;10:61–79.
7. Waldbusser GG, Brunner EL, Haley BA, Hales B, Langdon CJ, Prahl FG. Adevelopmental and energetic basis linking larval oyster shell formationto acidification sensitivity. Geophys Res Lett. 2013;40:2171–6.
8. Weiss IM, Tuross N, Addadi L, Weiner S. Mollusc larval shell formation:amorphous calcium carbonate is a precursor phase for aragonite. J ExpZool. 2002;293:478–91.
9. Huan P, Wang H, Dong B, Liu B. Identification of differentially expressedproteins involved in the early larval development of the Pacific oysterCrassostrea Gigas. J Proteome. 2012;75:3855–65.
10. Zhang G, Fang X, Guo X, Li L, Luo R, Xu F, et al. The oyster genome revealsstress adaptation and complexity of shell formation. Nature. 2012;490:49–54.
11. Dineshram R, Chandramouli K, Ko GWK, Zhang H, Qian P-Y, Ravasi T, et al.Quantitative analysis of oyster larval proteome provides new insights intothe effects of multiple climate change stressors. Glob Chang Biol. 2016;22:2054–68.
12. Epelboin Y, Quintric L, Guévélou E, Boudry P, Pichereau V, Corporeau C.The kinome of Pacific oyster Crassostrea Gigas, its expression duringdevelopment and in response to environmental factors. PLoS One.2016;11:e0155435.
13. Li H, Zhang B, Huang G, Liu B, Fan S, Zhang D, et al. Differential geneexpression during larval metamorphic development in the pearl oyster,Pinctada Fucata, based on transcriptome analysis. Int J Genomics.2016;2016:2895303.
14. Wang RN, Green J, Wang Z, Deng Y, Qiao M, Peabody M, et al. Bonemorphogenetic protein (BMP) signaling in development and humandiseases. Genes Dis. 2014;1:87–105.
15. Kin K, Kakoi S, Wada H. A novel role for dpp in the shaping of bivalveshells revealed in a conserved molluscan developmental program. DevBiol. 2009;329:152–66.
16. Liu G, Huan P, Liu B. Cloning and expression patterns of two Smadgenes during embryonic development and shell formation of thePacific oyster Crassostrea Gigas. Chin J Oceanol Limnol. 2014;32:1224–31.
17. Liu G, Huan P, Liu B. A GATA2/3 gene potentially involved in larvalshell formation of the Pacific oyster Crassostrea Gigas. Dev Genes Evol.2015;225:253–7.
18. Zhang C, Xie L, Huang J, Chen L, Zhang R. A novel putative tyrosinaseinvolved in periostracum formation from the pearl oyster (PinctadaFucata). Biochem Biophys Res Commun. 2006;342:632–9.
19. Huan P, Liu G, Wang H, Liu B. Identification of a tyrosinase gene potentiallyinvolved in early larval shell biogenesis of the Pacific oyster CrassostreaGigas. Dev Genes Evol. 2013;223:389–94.
20. Sakurai K, Chen J, Kefalov VJ. Role of guanylyl cyclase modulation inmouse cone phototransduction. J Neurosci. 2011;31:7991–8000.
21. Wang X, Wang M, Jia Z, Wang H, Jiang S, Chen H, et al. Ocean acidificationstimulates alkali signal pathway: a bicarbonate sensing soluble adenylylcyclase from oyster Crassostrea Gigas mediates physiological changesinduced by CO2 exposure. Aquat Toxicol. 2016;181:124–35.
22. Pan T-CF, Applebaum SL, Manahan DT. Experimental ocean acidificationalters the allocation of metabolic energy. Proc Natl Acad Sci U S A. 2015;112:4696–701.
23. Pan TCF, Applebaum SL, Lentz BA, Manahan DT. Predicting phenotypicvariation in growth and metabolism of marine invertebrate larvae. J ExpMar Biol Ecol. 2016;483:64–73.
24. Feely RA, Sabine CL, Hernandez-Ayon JM, Ianson D, Hales B. Evidence forupwelling of corrosive “acidified” water onto the continental shelf. Science.2008;320:1490–2.
25. Barton A, Hales B, Waldbusser GG, Langdon C, Feely RA. The Pacific oyster,Crassostrea Gigas, shows negative correlation to naturally elevated carbondioxide levels: implications for near-term ocean acidification effects. LimnolOceanogr. 2012;57:698–710.
26. Barton A, Waldbusser GG, Feely RA, Weisberg SB, Newton JA, Hales B,et al. Impacts of coastal acidification on the Pacific northwest shellfishindustry and adaptation strategies implemented in response.Oceanography. 2015;28:146–59.
27. Kurihara H, Kato S, Ishimatsu A. Effects of increased seawater pCO2 on earlydevelopment of the oyster Crassostrea Gigas. Aquat Biol. 2007;1:91–8.
28. Parker LM, Ross PM, O’Connor WA. The effect of ocean acidification andtemperature on the fertilization and embryonic development of theSydney rock oyster Saccostrea Glomerata (Gould 1850). Glob ChangBiol. 2009;15:2123–36.
29. Welladsen HM, Southgate PC, Heimann K. The effects of exposure to near-future levels of ocean acidification on shell characteristics of PinctadaFucata (Bivalvia: Pteriidae). Molluscan Research. 2010;30:125–30.
De Wit et al. BMC Genomics (2018) 19:160 Page 14 of 15
30. Miller AW, Reynolds AC, Sobrino C, Riedel GF. Shellfish face uncertain futurein high CO2 world: influence of acidification on oyster larvae calcificationand growth in estuaries. PLoS One. 2009;4:e5661.
31. Talmage SC, Gobler CJ. The effects of elevated carbon dioxideconcentrations on the metamorphosis, size, and survival of larval hard clams(Mercenaria Mercenaria), bay scallops (Argopecten Irradians), and easternoysters (Crassostrea Virginica). Limnol Oceanogr. 2009;54:2072–80.
32. Frieder CA, Applebaum SL, Pan T-C F, Hedgecock D, Manahan DT.Metabolic cost of calcification in bivalve larvae under experimental oceanacidification. ICES J Mar Sci. 2017;74:941–54.
33. Waldbusser GG, Hales B, Langdon CJ, Haley BA, Schrader P, Brunner EL, et al.Saturation-state sensitivity of marine bivalve larvae to ocean acidification.Nat Clim Chang. 2015;5:273–80.
34. Waldbusser GG, Hales B, Haley BA. Calcium carbonate saturation state: onmyths and this or that stories. ICES J Mar Sci. 2016;73:563–8.
35. Cyronak T, Schulz KG, Jokiel PL. The omega myth : what really drives lowercalcification rates in an acidifying ocean. ICES J Mar Sci. 2016;73:558–62.
36. Apweiler R, Attwood TK, Bairoch A, Bateman E, Birney E, Biswas M, et al. TheInterPro database, an integrated documentation resource for proteinfamilies, domains and functional sites. Nucleic Acids Res. 2001;29:37–40.
37. Timmins-Schiffman E, O’Donnell MJ, Friedman CS, Roberts SB. ElevatedpCO2 causes developmental delay in early larval Pacific oysters, CrassostreaGigas. Mar Biol. 2013;160:1973–82.
38. Todgham AE, Hoffman GE. Transcriptomic response of sea urchin larvaeStrongylocentrotus Purpuratus to CO2-driven seawater acidification. J ExpBiol. 2009;212:2579–94.
39. Berezney R. Effect of protease inhibitors on matrix proteins and theassociation of replicating DNA. Exp Cell Res. 1979;123:411–4.
40. Fessler JH, Kramerova I, Kramerov A, Chen Y, Fessler LI. Papilin, a novelcomponent of basement membranes, in relation to ADAMTS metalloproteasesand ECM development. Int J Biochem Cell Biol. 2004;36:1079–84.
41. Falini G, Albeck S, Weiner S, Addadi L. Control of aragonite or calcitepolymorphism by mollusk shell macromolecules. Science. 1996;271:67–9.
42. Miyamoto H, Miyoshi F, Kohno J. The carbonic anhydrase domain proteinnacrein is expressed in the epithelial cells of the mantle and acts as anegative regulator in calcification in the mollusc Pinctada Fucata. Zool Sci.2005;22:311–5.
43. Weiss IM, Schönitzer V, Eichner N, Sumper M. The chitin synthase involvedin marine bivalve mollusk shell formation contains a myosin domain. FEBSLett. 2006;580:1846–52.
44. Marie B, Zanella-Cléon I, Guichard N, Becchi M, Marin F. Novel proteins fromthe calcifying shell matrix of the Pacific oyster Crassostrea Gigas. MarBiotechnol. 2011;13:1159–68.
45. Medakovic D. Carbonic anhydrase activity and biomineralization processin embryos, larvae and adult blue mussels Mytilus Edulis L. Helgol MarRes. 2000;54:1–6.
46. Williams TM, Lisanti MP. The caveolin proteins. Genome Biol. 2004;5:214.47. Florek M, Bauer N, Janich P, Wilsch-Braeuninger M, Fargeas CA, Marzesco A-
M, et al. Prominin-2 is a cholesterol-binding protein associated with apicaland basolateral plasmalemmal protrusions in polarized epithelial cells andreleased into urine. Cell Tissue Res. 2007;328:31–47.
48. Xie Y-J, Zhou L, Jiang N, Zhang N, Zou N, Zhou L, et al. Essential roles ofleucine-rich glioma inactivated 1 in the development of embryonic andpostnatal cerebellum. Sci Rep. 2015;5:7827.
49. Hall JD, Lloyd PE. Involvement of pedal peptide in locomotion in Aplysia:modulation of foot muscle contractions. J Neurobiol. 1990;21:858–68.
50. Bridgham J, Wilder J, Hollocher H, Johnson A. All in the family:evolutionary and functional relationships among death receptors. CellDeath Differ. 2003;10:19–25.
51. Boettiger A, Ermentrout B, Oster G. The neural origins of shell structure andpattern in aquatic mollusks. Proc Natl Acad Sci U S A. 2009;106:6837–42.
52. Mittl PR, Di Marco S, Fendrich G, Pohlig G, Heim J, Sommerhoff C, et al. Anew structural class of serine protease inhibitors revealed by the structureof the hirustasin–kallikrein complex. Structure. 1997;5:253–64.
53. Hooper JD, Clements JA, Quigley JP, Antalis TM. Type II transmembraneserine proteases. Insights into an emerging class of cell surface proteolyticenzymes. J Biol Chem. 2001;276:857–60.
54. Marxen JC, Witten PE, Finke D, Reelsen O, Rezgaoui M, Becker W. Alight- and electron-microscopic study of enzymes in the embryonicshell-forming tissue of the freshwater snail, Biomphalaria Glabrata.Invertebr Biol. 2003;122:313–25.
55. Yang B, Pu F, Li L, You W, Ke C, Feng D. Functional analysis of a tyrosinasegene involved in early larval shell biogenesis in Crassostrea Angulata and itsresponse to ocean acidification. Comp Biochem Physiol B Biochem Mol Biol.2017;206:8–15.
56. Wang X, Li L, Zhu Y, Du Y, Song X, Chen Y, et al. Oyster shell proteinsoriginate from multiple organs and their probable transport pathway to theshell formation front. PLoS One. 2013;8:e66522.
57. Hüning AK, Lange SM, Ramesh K, Jacob DE, Jackson DJ, Panknin U, et al. Ashell regeneration assay to identify biomineralization candidate genes inmytilid mussels. Mar Genomics. 2016;27:57–67.
58. Yu X, Yu H, Kong L. Molecular cloning and differential expression in tissuesof a tyrosinase gene in the Pacific oyster Crassostrea Gigas. Mol Biol Rep.2014;41:5403–11.
59. Yue F, Zhou Z, Wang L, Wang M, Song L. A conserved zinc fingertranscription factor GATA involving in the hemocyte production of scallopChlamys Farreri. Fish Shellfish Immunol. 2014;39:125–35.
60. Shimizu K, Sarashina I, Kagi H, Endo K. Possible functions of Dpp ingastropod shell formation and shell coiling. Dev Genes Evol. 2011;221:59–68.
61. Parker LM, Ross PM, O’Connor WA, Borysko L, Raftos DA, Pörtner H-O. Adultexposure influences offspring response to ocean acidification in oysters.Glob Chang Biol. 2012;18:82–92.
62. Griffith AW, Gobler CJ. Transgenerational exposure of North Atlantic bivalvesto ocean acidification renders offspring more vulnerable to low pH andadditional stressors. Sci Rep. 2017;7:11394.
63. Stefansson ES, Langdon CJ, Pargee SM, Blunt SM, Gage SJ, Stubblefield WA.Acute effects of non-weathered and weathered crude oil and dispersantassociated with the Deepwater horizon incident on the development ofmarine bivalve and echinoderm larvae. Environ Toxicol Chem. 2016;35:2016–28.
64. Hales B, Takahashi T, Bandstra L. Atmospheric CO2 uptake by a coastalupwelling system. Glob Biogeochem Cycles. 2005;19:GB1009.
65. Bandstra L, Hales B, Takahashi T. High-frequency measurements of totalCO2 : method development and first oceanographic observations. MarChem. 2006;100:24–38.
66. Li H, Durbin R. Fast and accurate short read alignment with burrows-wheeler transform. Bioinformatics. 2009;25:1754–60.
67. Anders S, Huber W. Differential expression analysis for sequence count data.Genome Biol. 2010;11:R106.
68. Gillis J, Mistry M, Pavlidis P. Gene function analysis in complex data setsusing ErmineJ. Nat Protoc. 2010;5:1148–59.
69. Langfelder P, Horvath S. WGCNA: an R package for weighted correlationnetwork analysis. BMC Bioinformatics. 2008;9:559.
• We accept pre-submission inquiries
• Our selector tool helps you to find the most relevant journal
• We provide round the clock customer support
• Convenient online submission
• Thorough peer review
• Inclusion in PubMed and all major indexing services
• Maximum visibility for your research
Submit your manuscript atwww.biomedcentral.com/submit
Submit your next manuscript to BioMed Central and we will help you at every step:
De Wit et al. BMC Genomics (2018) 19:160 Page 15 of 15