general education assessment committee annual report…
TRANSCRIPT

Appendix A OSU General Education Assessment Committee 2005 Annual Report
GENERAL EDUCATION ASSESSMENT COMMITTEE ANNUAL REPORT, 2005
2005 General Education Assessment Committee Membership Greg Wilber (Civil and Environmental Engineering), Chair; Jeff Hattey (Plant & Soil Sciences); John Gelder (Chemistry); Frances Griffin (Business Management); Ed Walkiewicz (English), Rick Rohrs (History); Pam Bowers (ex officio, University Assessment and Testing). General Education Assessment Committee History Assessment of OSU’s general education program is required by the Higher Learning Commission of the North Central Association (HLC, OSU’s accrediting body) and by the Oklahoma State Regents for Higher Education. OSU’s general education assessment efforts have been motivated by these requirements. The Assessment Council and Office of University Assessment and Testing formed a faculty General Education Assessment Task Force in May 2000 for the purpose of developing and implementing a new plan to assess the effectiveness of OSU’s general education program. Although general education and “mid-level” assessment methods such as standardized tests and surveys had been conducted intermittently at OSU since 1993, no sustainable approach to evaluating the general education curriculum had been established. The task force formed in 2000 was the first group of OSU faculty members who were paid to work on this university-wide assessment project and marked a renewed commitment to general education assessment at OSU. Following the assessment standard of articulating desired student outcomes first, the Task Force started in 2000 by revising OSU’s Criteria and Goals for General Education Courses document and identifying “assessable” outcomes for the general education program. After studying general education assessment practices at other institutions, the task group developed the following guidelines for effective and sustainable general education assessment for OSU:
• the process must not be aimed at individual faculty members or departments, • the process should be led by faculty members, and faculty participation should be
voluntary, • the process should use student work already produced in courses, and • the process should assess all undergraduates, including transfer students, because general
education outcomes describe qualities expected for all OSU graduates.
After summer-long study and discussion, the 2000 task group agreed to initiate two assessment methods to evaluate general education that were consistent with these guidelines: institutional portfolios and a course-content database. Institutional portfolios directly assess student achievement of the expected learning outcomes for the general education program, and the course database evaluates how each general education course contributes to student achievement of those articulated outcomes. These methods were implemented in 2001. In 2003, the Assessment Council and General Education Advisory Council approved the task force’s name change to the General Education Assessment Committee. The Committee is charged with continuing to develop and implement general education assessment and reports to the Assessment Council and General Education Advisory Council; membership in these committees is intentionally overlapped. Committee members serve rotating 3-year terms, are extensively involved in undergraduate teaching at OSU, represent a range of disciplines, and are paid summer stipends for their work on general education assessment.

Appendix A OSU General Education Assessment Committee 2005 Annual Report
Institutional Portfolios. The Committee has developed institutional portfolios to assess students’ written communication skills (data collection in 2001, 2002, 2003, 2004, and 2005), math problem solving skills (data collection in 2002, 2003 and 2005), and science problem solving skills (data collection in 2003, 2004 and 2005). The Committee began developing an institutional portfolio for assessment of students’ critical thinking in 2005, using a rubric pilot tested in 2004. Separate portfolios are developed to evaluate each general education learner goal, and each portfolio includes students’ work from course assignments collected throughout the undergraduate curriculum. Faculty members (including Committee members and additional faculty members involved in undergraduate teaching) work in groups to evaluate the work in each portfolio and assess student achievement relative to the learner goal that is being assessed by using standardized scoring rubrics. The results provide a measure of the extent to which students are achieving OSU’s general education learning goals. The Committee plans to continue to develop institutional portfolios to assess the learner goals for general education as described in the Criteria and Goals for General Education Courses.
General Education Course Database. The General Education Course Database is a tool for evaluating how each general education course is aligned with the overall expected learning outcomes for the general education program as a whole. Instructors are asked to submit their course information online via a web-based form, and the General Education Advisory Council reviews the submitted information during regular course reviews. The database form requests information about what general education learning goals are associated with the course and how the course provides students with opportunities to achieve those learning goals. Instructors are also asked to describe how student achievement of those goals is assessed within the course. When completed, the database will provide a useful tool for holistically evaluating general education course offerings and the extent to which the overall general education goals are targeted across the curriculum. During the past academic year efforts have been continued to develop the database; this effort will be a high priority during 2005-06. In addition to these two primary assessment tools, student surveys such as the National Survey of Student Engagement and OSU Alumni Surveys contribute to the general education assessment process and are considered in reviewing general education assessment results. Committee Goals for 2005
A. The Committee met in Fall 2004 to determine committee membership for work to be
completed in summer 2005. Although a 3-year rotating membership cycle had been articulated for the Committee, all current committee members continued with the committee so that portfolios for four learning goals could be evaluated in 2005.
B. The Committee continued the institutional portfolio for assessing student written
communication skills as in previous years. As planned, two portfolio-scoring groups each reviewed about 70 samples of randomly collected student work demonstrating written communication skills. Each group consisted of three faculty members, requiring six faculty reviewers for the 2005 written communication skills portfolio (two Committee members and four additional faculty reviewers).
C. The Committee also continued the institutional portfolio for evaluating students’ math
problem-solving skills. As planned, a portfolio-scoring group, consisting of three faculty reviewers (coordinated by a Committee member) evaluated the math skills

Appendix A OSU General Education Assessment Committee 2005 Annual Report
portfolio. This group of reviewers reviewed 189 samples of student work demonstrating math problem-solving skills.
D. Additionally, the Committee continued the institutional portfolio for evaluating
students’ science problem-solving skills. Although the timeline called for assessing science and math portfolios in alternate years, the committee believed it would be beneficial to do both, so that a sufficient sample size for analysis could be provided within a shorter timeframe. A portfolio-scoring group, consisting of three faculty members (two Committee members and one additional faculty reviewer), evaluated the science skills portfolio. This group of reviewers scored 141 samples of student work demonstrating math problem-solving skills.
E. The Committee developed the first full-scale institutional portfolio to evaluate
students’ critical thinking skills. Two portfolio-scoring groups, consisting of six faculty members (two Committee members and four additional faculty reviewers), evaluated the critical thinking portfolio. This group of reviewers reviewed 141 samples of student work demonstrating critical thinking skills.
F. As planned, the Committee presented information sessions for faculty to describe the
process and results of assessment of students’ achievement of general education learning goals since the committee began its work in 2000.

Appendix A OSU General Education Assessment Committee 2005 Annual Report
Assessment of Written Communication Skills
2005 collection of writing samples The University Assessment and Testing Office supervised the collection of student writing artifacts for the Written Communication Skills Institutional Portfolio in Spring 2005. Instructors from the following undergraduate courses contributed random samples of student work to the 2005 written communication skills institutional portfolio:
Course No.
Course Name
General
Education Designation
(if any)
Number of artifacts
randomly collected from
one assignment
Number of artifacts reviewed
Number of artifacts
used in data analysis
AGED 2303 Personal Leadership Development in Agricultural Sciences and Natural Resources 10 10 10
BCOM 3113 Written Communication 10 0 0 CIVE 3813 Environmental Engineering Science 10 10 10 ENGL 3323 Technical Writing 10 0 0 ENTO 2003 Insects and Society N 25 25 23 HDFS 3453 Management of Human Service Programs 25 25 24 HIST 1103 Survey of American History 11 11 11 HIST 4063 Historic Preservation 10 10 10 LEIS 4473 Outdoor Recreation 10 10 6 NSCI 2111 Professional Careers in Nutritional Sciences 21 21 20 NSCI 3543 Food and the Human Environment I, S 11 11 11 PLNT 3213 Forage and Grazinglands Resource Management 10 10 10 PSYC 3073 Neurobiological Psychology N 10 10 7 Total Number of Writing Artifacts (samples) 173 153 142 *The number of artifacts reviewed in 2005 was less than the number collected because it was determined that artifacts did not meet the criteria for assessment (n=20). The number of artifacts used in data analysis is less than the number reviewed because student information could not be found in OSU Student Information System databases (n=1); students were determined to be graduate students (n=3), or artifacts were incomplete or inappropriate for the assessment (5). Artifacts were collected as in previous years. Artifacts selected for the Institutional Portfolio were coded and all identifying information was removed from the samples. Demographic data were collected for each artifact using the OSU student database; these data were collected for analysis purposes only and the information cannot be used to identify an individual. The student demographic information associated with the samples was not shared with reviewers prior to the reviews. 2005 written communication skills portfolio reviews Six faculty reviewers for the written communication skills institutional portfolio met and completed their work in May and June 2005. The portfolio reviewers included Frances Griffin (Business Management), Rick Rohrs (History), Camille DeYong (Industrial Engineering), Celinda Reese (Psychology), Lou Anella (Horticulture and Landscape Architecture) and Lowell Caneday (Leisure Studies). All portfolio reviewers met for two training sessions where they received background information on the procedure, and practiced scoring samples of student work using the written communication

Appendix A OSU General Education Assessment Committee 2005 Annual Report
skills scoring rubric developed for this purpose in 2001. During these two initial sessions, reviewers discussed questions and concerns regarding use of the rubric, discussed scores given to samples of student work, and developed a common approach for evaluating student writing samples. As with past groups of reviewers, by the end of training sessions with all reviewers present, the reviewers were scoring fairly consistently with little variation among individual members. Eight artifacts were scored during the training session. The scoring committee then divided into two sub-groups, each of which undertook to review 71 artifacts. Scoring was done individually, and each sub-group then met to reach consensus scores where there was variation in individual scores. The final scores were then submitted to the Assessment and Testing Office for compilation and interpretation. Written communication skills scores from each review group
Review Group
Artifact Score
Number of Artifacts
Percent of Artifacts
1 6 9%
2 26 38%
3 26 38%
4 7 10%
#1 (68 artifacts scored)
5 3 4%
1 1 1%
2 12 17%
3 38 54%
4 16 23%
#2 (71 artifacts scored)
5 3 4%
1 0 0%
2 3 38%
3 3 38%
4 2 25%
8 artifacts scored during training
5 0 0%

Appendix A OSU General Education Assessment Committee 2005 Annual Report
Rubric for evaluating student written communication skills The General Education Assessment Committee developed the following rubric for evaluating samples of student writing in 2001. Minor revisions were made to the rubric in 2004; the revised rubric is provided below. Reviewers scored the artifacts independently and then met to develop a consensus score for each artifact; each artifact received a whole-number score from 1 to 5.
Score Characteristics
Topic/thesis is clearly stated and well developed; details/wording is accurate, specific, appropriate for the topic & audience, with no digressions; evidence of effective, clear thinking; completely accomplishes the goals of the assignment Content &
Organization Paragraphs are clearly focused and organized around a central theme; clear beginnings and endings; appropriate, coherent sequences and sequence markers
Word choice appropriate for the task; precise, vivid vocabulary; variety of sentence types; consistent and appropriate point of view and tone
5
Style & Mechanics
Standard grammar, spelling, punctuation; no interference with comprehension or writer's credibility
4 Exhibits some characteristics of “3” and some characteristics of “5”
Topic is evident; some supporting detail; wording is generally clear; reflects understanding of topic and audience; generally accomplishes goals of the assignment
Content & Organization
Most paragraphs are focused; discernible beginning and ending paragraphs; some sequence markers
Generally appropriate word choice; variety in vocabulary and sentence types; appropriate point of view and tone
3
Style & Mechanics
Some non-standard grammar, spelling, and punctuation; errors do not generally interfere with comprehension or writer's credibility
2 Exhibits some characteristics of “1” and some characteristics of “3”
Topic is poorly developed; support is only vague or general; ideas are trite; wording is unclear, simplistic; reflects lack of understanding of topic and audience; minimally accomplishes goals of the assignment Content &
Organization Most paragraphs are rambling and unfocused; no clear beginning or ending; inappropriate or missing sequence markers
Inappropriate or inaccurate word choice; repetitive words and sentence types; inappropriate or inconsistent point of view and tone
1
Style & Mechanics
Frequent non-standard grammar, spelling, punctuation interferes with comprehension and writer's credibility

Appendix A OSU General Education Assessment Committee 2005 Annual Report
Student demographics associated with written communication skills artifacts, 2001- 2005
2001-04 2005 All Years
no. of artifacts pct
no. of artifacts Pct
no. of artifacts Pct
# collected 673 173 846
# scored 575 142 717 Number of Artifacts # used in analysis 562 142 704
Class Freshman 88 16% 16 11% 104 15%
Sophomore 107 19% 35 25% 142 20%
Junior 145 26% 46 32% 191 27%
Senior 222 40% 45 32% 267 38%
College CAS 196 35% 27 19% 223 32%
CASNR 76 14% 26 18% 102 14% SSB 99 18% 12 8.5% 111 16% COE 67 12% 10 7% 77 11% CEAT 49 8.7% 13 9.2% 62 8.8% CHES 58 10% 48 34% 106 15% UAS 17 3.0% 6 4.2% 23 3.3%
Gender Female 299 53% 82 58% 381 54% Male 261 47% 60 42% 321 46%
Admit Regular (A, AR, L) 340 60% 97 68% 437 62% Type Alternative Admit (F) 22 3.9% 5 3.5% 27 3.8% Adult Admit (G) 8 1.4% 3 2.0% 11 1.6% "Third Door" Admit (K) 5 .9% 0 5 .7% International (J) 3 .5% 0 3 .4% Transfer (M, MR) 170 30% 37 26% 207 29% Other or Blank 14 2.5% 0 14 2.0%
ACT <22 136 30% 37 32% 173 30% 22 to 24 126 28% 35 31% 161 28% 25 to 27 101 22% 28 25% 129 23% 28 to 30 69 15% 11 9.6% 80 14% >30 26 5.7% 3 2.6% 29 5.0%
OSU GPA <2.0 29 5.2% 7 4.9% 36 5.1% 2.0 to 2.49 73 13% 20 14% 93 13% 2.50 to 2.99 128 23% 30 21% 158 23% 3.00 to 3.49 175 31% 50 35% 225 32% 3.50 to 4.00 155 28% 35 25% 190 27%

Appendix A OSU General Education Assessment Committee 2005 Annual Report
Written communication skills scores, 2001 - 2005 (years combined) Score 1 2 3 4 5 Avg N
n 34 196 306 139 29 2.9 704 Overall Scores
Overall % 4.8% 28% 43% 20% 4.1%
n 10 36 43 13 2 2.63 104 Freshmen % 9.6% 35% 41% 13% 1.9% 15% n 9 37 64 25 7 2.89 142 Sophomores % 6.3% 26% 45% 18% 4.9% 20% n 7 61 84 33 6 2.84 191 Juniors % 3.7% 32% 44% 17% 3.1% 27% n 8 62 115 68 14 3.07 267
By Class
Seniors % 3.0% 23% 43% 25% 5.2% 38%
n 6 30 38 11 2 2.69 87 Freshmen % 6.9% 34% 44% 13% 2.3% 20% n 5 24 47 19 5 2.95 100 Sophomores % 5.0% 24% 47% 19% 5.0% 23% n 2 27 54 16 4 2.93 103 Juniors % 1.9% 26% 52% 16% 3.9% 24% n 2 30 64 41 10 3.18 147
By Class (regular admit only)
Seniors % 1.4% 20% 44% 28% 6.8% 34%
n 23 136 217 95 23 2.92 494 Native Students* (domestic only) % 4.6% 28% 44% 19% 4.6%
n 9 60 88 44 6 2.89 207
By Transfer Status Transfer Students
% 4.3% 29% 43% 21% 2.9% *Native students refers to freshmen who started at OSU as first-time freshmen Key findings • Writing scores for samples from freshmen had significantly lower scores than writing
samples for seniors (n=704, p<0.05); 45% of the freshmen writing samples had scores of “1” or “2” and 55% had scores of “3” or higher. In contrast, 73% of writing samples from seniors received a score of “3” or higher. When only regularly admitted students were included in the analysis (i.e., excluding transfer, international, and alternatively admitted students), the contrast was even more pronounced. Considering only regularly admitted students, 79% of work produced by seniors received scores of “3” or higher.
• Although students who start their career at OSU (“native” OSU students) are slightly more
likely to receive high scores on their writing samples, there is no statistically significant difference between the writing scores of native and transfer students, even when only regularly admitted native students are considered in the comparison.

Appendix A OSU General Education Assessment Committee 2005 Annual Report
Assessment of Science Problem-Solving Skills 2005 collection of science samples The University Assessment and Testing Office supervised the collection of artifacts for the Science Problem-Solving Skills Institutional Portfolio in Spring 2005 using methods described in previous annual reports. As with the other portfolios, the artifacts were collected from introductory-level sciences courses that are part of the general education course offerings. Instructors from the following courses contributed artifacts to the 2005 science problem-solving skills institutional portfolio. Three faculty reviewers for the science problem-solving skills institutional portfolio met and completed their work in June and July 2005. The portfolio reviewers included John Gelder (Chemistry), Ed Walkiewicz (English), and Bruce Ackerson (Physics).
Course No.
Course Name
General Education
Designation (if any)
Number of artifacts
randomly collected
Number of artifacts reviewed
Number of artifacts used in
data analysis
ASTR 1024 Stars, Galaxies and the Universe N 25 0 0
BIOL 1114 Introductory Biology L, N 29 29 29
CHEM 1314 General Chemistry L, N 44 25 25
ENTO 2003 Insects and Society N 25 25 25
GEOG 1114 Physical Geography L, N 25 25 25
PHYS 1313 Inquiry-Based Physics L, N 25 25 25
Total Number of Science Artifacts (samples) 173 129 129
The artifacts collected from ASTR 1024, and some from CHEM 1314 (n=19) were determined to not be appropriate for assessing science problem-solving skills using this method and were not scored or included in analysis. Rubric for evaluating students’ science problem-solving skills The General Education Assessment Committee developed the following rubric for evaluating students’ science problem-solving skills in 2003, and made minor revisions in 2005. Reviewers scored the artifacts independently and then met to develop a consensus score for each artifact; each artifact received a whole-number score from 1 to 5. Scores of “2” indicate work that has some elements of “1” and some elements of “3.” Scores of “4” indicate work that has some elements of “3” and some elements of “5.”

Appendix A OSU General Education Assessment Committee 2005 Annual Report
Rubric for evaluating students’ science problem solving skills
Aspects (1) (3) (5)
Understanding of problem
Student does not exhibit a clear understanding of the problem; Displays little comprehension of the important elements of the problem; Failed to understand enough to start to work the problem.
Response is free of misconceptions that lead to wrong answers; Student grasps basic parts of the problem as well as the general framework; Understands enough to work most of the problem; Can make a diagram that exhibits some understanding of the model; Can demonstrate some conceptualization of the model.
Student manifests a thorough understanding of concepts and relationships between concepts; Identifies all the important elements of the problem; Organizes the response in a manner that demonstrates clarity of understanding.
Use of terms and symbols
Student is unable to communicate scientific concepts through terminology; Fails to employ technical, mathematical, or scientific terms or employs them inappropriately; Fails to use symbols or uses them incorrectly.
Student uses most terminology and symbols correctly; Provides evidence of reasonable understanding of terms and symbols.
Student explains thoughts thoroughly using correct terminology and clearly displayed, appropriate symbols; Communicates ideas clearly and concisely; Demonstrates superior knowledge of the language of science and symbolic usage; Knows all the symbols and terms in a mathematical relationship and their association with the scientific model of interest.
Calculations and graphical data presentation
Student provides no evidence of manipulation of mathematical expressions; Commits numerous arithmetic errors; Fails to present data in graphical or tabular format.
Response is mainly accurate with some minor arithmetic errors; Student possesses sufficient understanding to work the problem, but presentation is not sophisticated; Provides graphical representation but cannot extract abstract information or interpretation; Presents calculations in an orderly manner, but misses some details; Represents data graphically but commits minor errors.
Response is fully mathematically accurate; Solution is clearly displayed with various computation steps shown; Student executes algorithms completely and correctly; Presents data in an appropriate graphical or tabular format; Provides a clear interpretation and conceptualization of results; Displays results graphically in a clear and illuminating way.
Solution and graphical data interpretation
Student shows significant misunderstanding of the process; Does not correctly apply or even make attempt to apply appropriate solution; Adopts inappropriate strategy for solving the problem; Attempts to use irrelevant information; Fails to provide a graphical representation of the mathematical thought process or provides an incorrect one.
Student shows understanding of the process; Adopts a reasonable strategy for solving most of the problem; Displays solution in a rote manner indicating a simple conceptualization of the problem; Shows understanding of some of the problem’s concepts.
Student shows mastery of the process; Presents a detailed solution characterized by logical sequencing and systematic progression; Offers strong supporting arguments; Uses relevant outside information; Solution reflects excellent problem-solving skills.
Answer and conclusions
Answer lacks units or they are stated incorrectly; Student offers an invalid answer; Fails to offer any empirical findings.
Answer is stated in correct units; Student expresses empirical findings but is limited in identification of related issues; Is unable to demonstrate complete understanding of the mathematical result and its relationship to the conceptual model.
Answer is stated in correct units with any unit changes clearly illustrated; Student provides a complete response with a clear, unambiguous, accurate explanation; Fully describes findings in words; Convincingly connects the numeric results and the conceptual model.
Evidence of higher level thinking
Student is unable to plug values directly into equation; Seems incapable of mathematical manipulation.
Student combines two related concepts; Substitutes correct values and manipulates equation but still has some difficulty with more complicated relationships or model; Has some difficulty in developing a mathematical relationship from the written form.
Student can solve problems requiring multiple steps with development of concepts evolving into the solution; Can clearly synthesize information and organize it in a path through multiple steps to arrive at the solutions; Has no difficulty connecting mathematical relationships or expressing ideas mathematically; Is capable of interpreting and applying results in a new or modified situation.

Appendix A OSU General Education Assessment Committee 2005 Annual Report
Student demographics associated with science problem solving skills artifacts, 2003-2005
2003-04 2005 Total Years
No. of
artifacts
pct No. of
artifacts
pct no. of
artifacts Pct
# collected - 173
# scored - 129 Number of Artifacts # used in analysis 209 - 129 338
Class Freshman 76 36% 41 32% 117 35%
Sophomore 67 32% 50 39% 117 35%
Junior 41 20% 26 20% 67 20%
Senior 25 12% 12 9.3% 37 11%
College CAS 78 37% 49 38% 127 38%
CASNR 55 26% 14 11% 69 20% SSB 9 4.3% 17 13% 26 7.7% COE 44 21% 33 26% 77 23% CEAT 14 6.7% 3 2.3% 17 5.0% CHES 7 3.3% 9 7.0% 16 4.7% UAS 2 1.0% 4 3.1% 6 1.8%
Gender Female 135 65% 87 67% 222 66% Male 74 35% 42 33% 116 34%
Regular (A, AR,L) 148 71% 90 70% 238 70% Alternative Admit (F) 8 3.8% 5 3.9% 13 3.8% Adult Admit (G) 0 0 "Third Door" Admit (K) 0 1 .8% 1 .3% International (J) 4 1.9% 1 .8% 5 1.5% Transfer (M, MR) 49 23% 29 22% 78 23%
Admit Type
Other or Blank 0 3 2.3% 3 .9%
ACT <22 46 27% 39 36% 85 30% 22 to 24 50 29% 33 31% 83 30% 25 to 27 45 26% 17 16% 62 22% 28 to 30 21 12% 13 12% 34 12% >30 10 5.8% 5 4.7% 15 5.4%
OSU GPA <2.0 13 6.2% 9 7.0% 22 6.5% 2.0 to 2.49 24 11% 23 18% 47 14% 2.50 to 2.99 52 25% 33 26% 85 25% 3.00 to 3.49 55 26% 29 22% 84 25% 3.50 to 4.00 65 31% 35 27% 100 30%

Appendix A OSU General Education Assessment Committee 2005 Annual Report
Science problem-solving skills scores, 2003-2005
Score 1 2 3 4 5 Avg N
n 20 127 121 63 7 2.73 338 Overall Scores
Overall % 5.9% 38% 36% 19% 2.1%
n 6 47 43 19 2 2.69 117 Freshmen % 5.1% 40% 37% 16% 1.7% 35% n 9 40 41 25 2 2.75 117 Sophomores % 7.7% 34% 35% 21% 1.7% 35% n 4 25 25 11 2 2.73 67 Juniors % 6.0% 37% 37% 16% 3.0% 20% n 1 15 12 8 1 2.81 37
By Class
Seniors % 2.7% 41% 32% 22% 2.7% 11%
n 6 42 40 17 2 2.69 107 Freshmen % 5.6% 39% 37% 16% 1.9% 45% n 8 29 28 19 1 2.72 85 Sophomores % 9.4% 34% 33% 22% 1.2% 36% n 1 12 12 5 2 2.84 32 Juniors % 3.1% 38% 38% 16% 6.3% 13% n 3 4 6 1 3.36 14
By Class (regular admits only)
Seniors % 21% 29% 43% 7.1% 5.8%
n 17 95 92 50 6 2.74 260 Native Students*
% 6.5% 37% 36% 19% 2.3% 77% n 3 32 29 13 1 2.71 78
By Transfer Status
Transfer Students % 3.8% 41% 37% 17% 1.3% 23%
*Native students refers to freshmen who started at OSU as first-time freshmen Key findings • The science problem-solving skills portfolio is limited to assessing science problem-solving skills of
students in entry-level science courses. The data are too limited at this point to make generalizations about students’ science problem-solving skills, but this approach appears to be promising for this type of assessment.
• Science scores from the institutional portfolio were significantly correlated with OSU GPA (n=338,
p<0.01); and with ACT Composite scores and all ACT sub-scores (n=279, p<0.01).

Appendix A OSU General Education Assessment Committee 2005 Annual Report
Assessment of Math Skills
2005 collection of math samples The University Assessment and Testing Office supervised the collection of student math artifacts for the Math Institutional Portfolio in Spring 2005. Instructors from the following undergraduate courses contributed random samples of student work to the 2005 math skills institutional portfolio:
Course No.
Course Name
General
Education Designation
(if any)
Number of artifacts
randomly collected from
one assignment
Number of artifacts reviewed
Number of artifacts
used in data analysis
MATH 1483 Mathematical Functions and their Uses A 75 54 54 MATH 1493 Applications of Modern Mathematics A 25 25 25 MATH 1513 College Algebra A 100 25 25 MATH 1613 Trigonometry A 25 25 25 MATH 2103 Elementary Calculus A 50 50 50 MATH 2153 Calculus II A 10 10 10 Total Number of Math Artifacts (samples) 285 189 189
Some of the artifacts collected from MATH 1483 (n=21) and some from MATH 1513 (n=75) were determined to not be appropriate for assessing mathematics problem-solving skills using this method and were not scored or included in analysis. 2005 math problem-solving skills portfolio reviews The General Education Assessment Committee developed the following rubric for evaluating students’ mathematical problem-solving skills in 2002. Reviewers scored the artifacts independently and then met to develop a consensus score for each artifact; each artifact received a whole-number score from 1 to 5. Scores of “2” indicate work that has some elements of “1” and some elements of “3.” Scores of “4” indicate work that has some elements of “3” and some elements of “5.” Three faculty reviewers for the mathematics problem-solving skills institutional portfolio met and completed their work in June and July 2005. The portfolio reviewers included Nigel Jones (Architecture), Meg Kletke (Management Science and Information Systems), and Dennis Bertholf (Mathematics). Reviewers met for a training session to “calibrate” their reviewing process using the rubric. Each reviewer received a copy of the artifacts to be evaluated and reviewed them independently; the group then met and discussed each artifact to agree on a consensus score for each.

Appendix A OSU General Education Assessment Committee 2005 Annual Report
Rubric for evaluating student math problem solving skills
The General Education Assessment Committee developed the following rubric for evaluating students’ math problem solving skills in 2002. Reviewers score the artifacts independently and then meet to develop a consensus score for each artifact; each artifact receives a whole-number score from 1 to 5.
Poor (1) Acceptable (3) Excellent (5)
Understanding of problem
No clear understanding indicated; Lack of comprehension of the basic parts of the problem; Didn’t understand enough to start to work the problem;
Able to glean basic parts of the problem and the general framework; No serious misconceptions; Adequate to work most of the problem;
Full grasp of concepts and relationships between concepts; Identifies all the important elements of the problem;
Use of terms and symbols
Unable to communicate any math concepts though terminology; Absent of technical or mathematical terms, or used inappropriately; Mathematical symbols are not used, or used incorrectly;
Uses most terminology and symbols correctly; Evidence of reasonable understanding of terms and symbols;
Clear, concise communication of ideas; Thoughts thoroughly explained with the correct terminology and clearly displayed appropriate symbols; Demonstrates superior knowledge of the language of mathematics/science
Calculations
No evidence of manipulation of mathematical expressions; Arithmetic errors prevalent in the work;
Mainly accurate with some minor arithmetic errors; Appropriate to work the problem, but not a sophisticated presentation;
Fully arithmetically accurate; Clearly represented with various computation steps shown; Executes algorithms completely and correctly;
Solution
Shows significant misunderstanding of the process; Does not correctly apply or even make attempt to apply appropriate solution; Reflects inappropriate strategy for solving the problem; Attempts to use irrelevant information; No (or incorrect) graphical representation of the mathematical thought process;
Reflects reasonable strategy for solving most of the problem; Displayed in a rote manner showing simple conceptualization; Shows understanding of some of the problem’s mathematical concepts; Presented in an orderly manner, but lacking some details; Represented graphically with only minor flaws;
Represented with detail through logical sequence and systematic progression; Reflects excellent problem-solving skills; Presents strong supporting arguments; Use of relevant outside information; Results are represented graphically in clear and illuminating way;
Answer
No expression of any empirical finding; Units if stated are incorrect; Conclusion is not valid;
Expressed empirical findings but limited in identification of related issues; Answer is stated in correct units;
Complete response with a clear, unambiguous, accurate explanation; Fully described findings in words; Stated in correct units with any unit changes clearly illustrated;
Difficulty of Problem
Values plug directly into equation; No mathematical manipulation;
Combines two related concepts;
Requires multiple steps with development of concepts evolving into the solution;

Appendix A OSU General Education Assessment Committee 2005 Annual Report
Student demographics associated with math problem solving skills artifacts, 2002-2005
2002-03 2005 All Years
no. of
artifacts Pct no. of
artifacts pct no. of
artifacts pct
# collected 695 - 285 - 980 -
# scored 352 - 189 - 541 -Number of Artifacts # used in analysis 344 - 189 - 533 -
Class Freshman 239 69% 95 50% 334 63%
Sophomore 53 15% 51 27% 104 20%
Junior 29 8.4% 23 12% 52 9.8%
Senior 23 6.7% 20 11% 43 8.1%
College CAS 94 27% 50 26% 144 27%
CASNR 64 19% 22 12% 86 16% SSB 90 26% 51 27% 141 27% COE 17 4.9% 32 17% 49 9.2% CEAT 37 11% 14 7.4% 51 9.6% CHES 18 5.2% 12 6.3% 30 5.6% UAS 24 7.0% 8 4.2% 32 6.0%
Gender Female 174 51% 102 54% 276 52% Male 170 49% 87 46% 257 48%
Admit Regular (A, AR) 254 74% 140 74% 394 74%Type Alternative Admit (F) 14 4.1% 6 3.2% 20 3.8% Adult Admit (G) 5 1.5% 2 1.1% 7 1.3% "Third Door" Admit (K) 0 0 0 International (J) 12 3.5% 1 .5% 13 2.4% Transfer (M, MR) 57 17% 39 21% 96 18% Other or Blank 2 .6% 1 .5% 2 .4%
ACT <22 102 36% 59 37% 161 37% 22 to 24 86 30% 51 32% 137 31% 25 to 27 55 19% 29 18% 84 19% 28 to 30 32 11% 10 6.3% 42 9.5% >30 8 2.8% 9 5.7% 17 3.9%
OSU GPA <2.0 49 14% 23 12% 72 14% 2.0 to 2.49 43 13% 35 19% 78 15% 2.50 to 2.99 78 23% 47 25% 125 23% 3.00 to 3.49 84 24% 42 22% 126 24% 3.50 to 4.00 90 26% 42 22% 132 25%

Appendix A OSU General Education Assessment Committee 2005 Annual Report
Math problem solving skills scores, 2002 - 2005 (years combined)
Score 1 2 3 4 5 Avg n
N 60 155 159 118 41 2.86 533 Overall Scores
Overall % 11% 29% 30% 22% 7.7%
N 34 93 99 78 30 2.93 334 Freshmen % 10% 28% 30% 23% 9% 63% N 11 39 26 22 6 2.74 104 Sophomores % 11% 38% 25% 21% 5.8% 20% N 10 15 15 10 2 2.60 52 Juniors % 19% 29% 29% 19% 3.8% 9.7% N 5 8 19 8 3 2.91 43
By Class
Seniors % 12% 19% 44% 19% 7.0% 8.0%
N 29 76 91 74 27 2.98 297 Freshmen % 9.8% 26% 31% 25% 9.1% 75% N 2 22 18 14 3 2.90 59 Sophomores % 3.4% 37% 31% 24% 5.1% 15% N 3 2 6 6 1 3.00 18 Juniors % 17% 11% 33% 33% 5.6% 4.5% N 1 3 11 3 2 3.10 20
By Class, (regular admits only)
Seniors % 5.0% 15% 55% 15% 10% 5.0%
N 40 124 135 101 36 2.93 436 Native Students*
% 9.2% 28% 31% 23% 8.3% 82% n 20 30 24 17 5 2.55 96
By Transfer Status Transfer Students
% 21% 31% 25% 18% 5.2% 18% *Native students refers to freshmen who started at OSU as first-time freshmen, regardless of admit type Key findings • The math problem solving skills portfolio is limited to assessing math problem-solving skills of
students, primarily freshmen, in entry-level mathematics courses. The overall distribution of scores indicates that 60% of students in entry-level math courses demonstrate math problem-solving skills at the midpoint of the rubric (a score of “3”) or higher.
• Math scores from the institutional portfolio were significantly correlated with OSU GPA (n=533,
p<0.01); and with ACT Composite scores and all ACT sub-scores (n=441, p<0.01).

Appendix A OSU General Education Assessment Committee 2005 Annual Report
Assessment of Critical Thinking Skills Background information regarding assessment of critical thinking The criteria and goals for each General Education area designation include some aspect of critical thinking as part of their desired results. For example, those courses designated with an “A” (analytical and quantitative thought) list as their first goal that “Students will critically analyze and solve problems using quantitative, geometric, or logical models.” Those courses designated with “H” (humanities) have the goal that “Students will critically analyze the relationships of aesthetics, ideas, or cultural values to historic and contemporary cultures.” Similar goals are stated for those courses designated as social and behavioral sciences (“S”), natural sciences (“N”), contemporary international cultures (“I”), and scientific investigation (“L”). The assessment of the achievement of these critical thinking goals was pilot-tested in the summer of 2004, and in 2005 implemented the first full-scale critical thinking institutional portfolio. The critical thinking assessment plan Assessment of critical thinking follows most closely that of the writing skills assessment which has been in place for several years. Like writing, critical thinking is a skill which is desired across the curriculum, and one for which continuous improvement over the course of a student’s education is expected. The assessment plan consists of the collection of artifacts of assignments designed (as reported by participating faculty) to elicit critical thinking by the student. Artifacts were collected from a total of 10 courses, representing 10 departments and four colleges. Freshmen through seniors were represented in the sample of student work. A total of 141 artifacts were determined to be usable for assessment using the rubric developed for this process and were analyzed by the faculty sub-committee. These artifacts were evaluated using the rubric, developed last year, which lists four essential characteristics and three additional optional characteristics of critical thinking. The rubric is designed such that each characteristic can be scored from 1 to 5, with 5 indicating the highest level of achievement. The artifacts are also given an overall score. These scores are then submitted to the Office of University Assessment and Testing for statistical analysis and cross-referencing with the individual student information (which is not made known to the reviewers). Critical thinking assessment committee activities in 2005 Members of this sub-committee included Greg Wilber (Civil and Environmental Engineering), Jeff Hattey (Plant and Soil Science), Jonathan Comer (Geography), Joanna Ledford (Biochemistry and Molecular Biology), Doren Recker (Philosophy), and Stacey Thompson (Human Development and Family Sciences). The committee operated much like those for the other assessments. Initially, reviewers participated in a training session using artifacts from last summer’s pilot study. Then, reviewers independently evaluated a set of training artifacts using the critical thinking rubric. The committee reconvened and, following some discussion, settled on consensus scores for the training artifacts. In this way, the committee’s judgment was calibrated, to the extent possible, for evaluation of the new artifacts collected for 2005. The next task was to evaluate the artifacts collected over the year for the critical thinking assessment. Several of the artifacts were very quickly deemed unusable for the assessment. This was primarily due to the structure of the assignment or the degree to which key assumptions were built into the assignment. For example, a laboratory assignment involving a worksheet for reporting observations was submitted for evaluation. While answering the worksheet’s questions may have required critical thinking on the part of
Appendix A OSU General Education Assessment Committee 2005 Annual Report
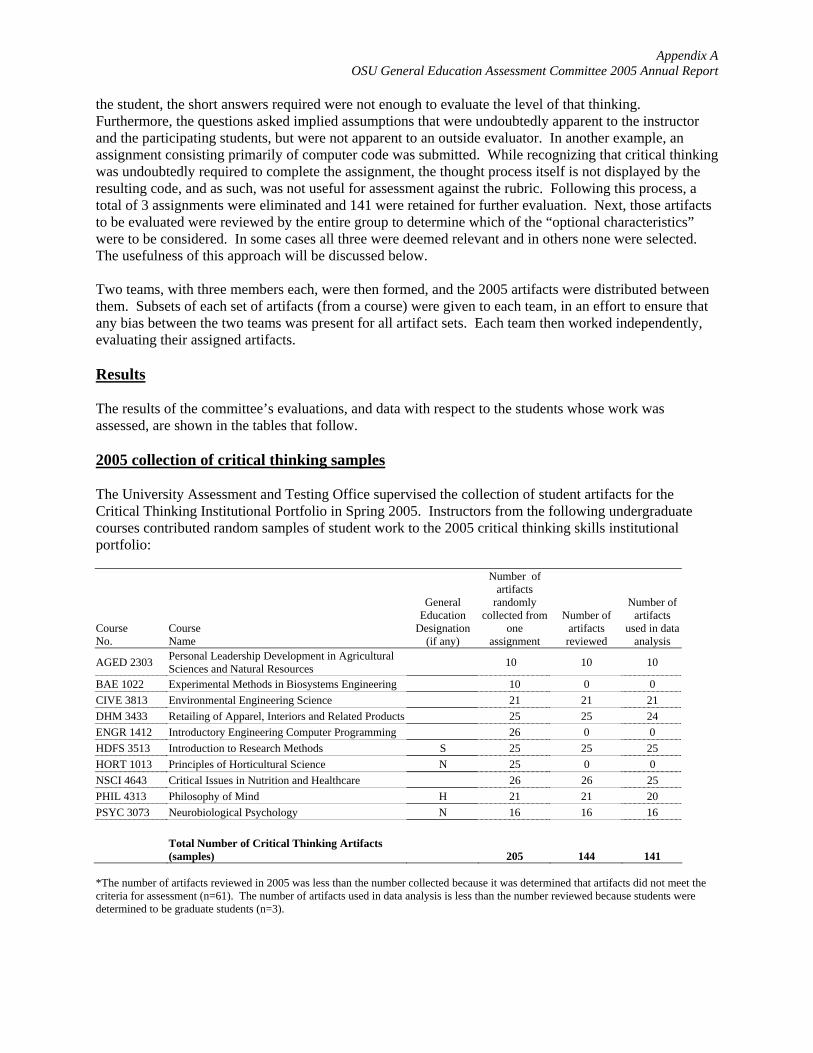
the student, the short answers required were not enough to evaluate the level of that thinking. Furthermore, the questions asked implied assumptions that were undoubtedly apparent to the instructor and the participating students, but were not apparent to an outside evaluator. In another example, an assignment consisting primarily of computer code was submitted. While recognizing that critical thinking was undoubtedly required to complete the assignment, the thought process itself is not displayed by the resulting code, and as such, was not useful for assessment against the rubric. Following this process, a total of 3 assignments were eliminated and 141 were retained for further evaluation. Next, those artifacts to be evaluated were reviewed by the entire group to determine which of the “optional characteristics” were to be considered. In some cases all three were deemed relevant and in others none were selected. The usefulness of this approach will be discussed below. Two teams, with three members each, were then formed, and the 2005 artifacts were distributed between them. Subsets of each set of artifacts (from a course) were given to each team, in an effort to ensure that any bias between the two teams was present for all artifact sets. Each team then worked independently, evaluating their assigned artifacts. Results The results of the committee’s evaluations, and data with respect to the students whose work was assessed, are shown in the tables that follow. 2005 collection of critical thinking samples The University Assessment and Testing Office supervised the collection of student artifacts for the Critical Thinking Institutional Portfolio in Spring 2005. Instructors from the following undergraduate courses contributed random samples of student work to the 2005 critical thinking skills institutional portfolio:
Course No.
Course Name
General
Education Designation
(if any)
Number of artifacts
randomly collected from
one assignment
Number of artifacts reviewed
Number of artifacts
used in data analysis
AGED 2303 Personal Leadership Development in Agricultural Sciences and Natural Resources 10 10 10
BAE 1022 Experimental Methods in Biosystems Engineering 10 0 0 CIVE 3813 Environmental Engineering Science 21 21 21 DHM 3433 Retailing of Apparel, Interiors and Related Products 25 25 24 ENGR 1412 Introductory Engineering Computer Programming 26 0 0 HDFS 3513 Introduction to Research Methods S 25 25 25 HORT 1013 Principles of Horticultural Science N 25 0 0 NSCI 4643 Critical Issues in Nutrition and Healthcare 26 26 25 PHIL 4313 Philosophy of Mind H 21 21 20 PSYC 3073 Neurobiological Psychology N 16 16 16
Total Number of Critical Thinking Artifacts (samples)
205 144 141
*The number of artifacts reviewed in 2005 was less than the number collected because it was determined that artifacts did not meet the criteria for assessment (n=61). The number of artifacts used in data analysis is less than the number reviewed because students were determined to be graduate students (n=3).

Appendix A OSU General Education Assessment Committee 2005 Annual Report
Student demographics associated with critical thinking skills artifacts, 2005
2005
no. of artifacts pct
# collected 205
# scored 144 Number of Artifacts # used in analysis 141
Class Freshman 1 .7%
Sophomore 18 13%
Junior 57 40%
Senior 65 46%
College CAS 34 24%
CASNR 11 7.8% SSB 0 COE 0 CEAT 22 16% CHES 74 52% UAS 0
Gender Female 95 67% Male 46 33%
Admit Regular (A, AR, L) 85 60% Type Alternative Admit (F) 4 2.8% Adult Admit (G) 0 "Third Door" Admit (K) 0 International (J) 2 1.4% Transfer (M, MR) 49 35% Other or Blank 1 .7%
ACT <22 42 37% 22 to 24 23 20% 25 to 27 21 18% 28 to 30 15 13% >30 13 11%
OSU GPA <2.0 3 2.1% 2.0 to 2.49 22 16% 2.50 to 2.99 31 22% 3.00 to 3.49 44 31% 3.50 to 4.00 41 29%

Appendix A OSU General Education Assessment Committee 2005 Annual Report
Critical thinking skills scores, 2005
Score 1 2 3 4 5 Avg N
n 2 40 72 26 1 2.89 141 Overall Scores
Overall % 1.4% 28% 51% 18% .7%
n 0 0 1 0 0 3.00 1 Freshmen % 100% .7% n 1 4 12 1 0 2.72 18 Sophomores % 5.6% 22% 67% 5.6% 13% n 0 19 23 15 0 2.93 57 Juniors % 33% 40% 26% 40% n 1 17 36 10 1 2.89 65
By Class
Seniors % 1.5% 26% 55% 15% 1.5% 46%
n 0 0 1 0 0 3.00 1 Freshmen % 100% 1.2% n 0 1 10 0 0 2.91 11 Sophomores % 9.1% 91% 13% n 0 10 18 12 0 3.05 40 Juniors % 25% 45% 30% 47% n 0 9 20 4 0 2.85 33
By Class (regular admit only)
Seniors % 27% 61% 12% 39%
n 0 23 51 18 0 2.95 92 Native Students* % 25% 55% 20% 65%
n 2 17 21 8 1 2.78 49
By Transfer Status Transfer Students
% 4.1% 35% 43% 16% 2.0% 35% *Native students refers to freshmen who started at OSU as first-time freshmen Key findings • In the first year of full-scale implementation of the critical thinking assessment, a few conclusions can
be drawn about the results as well as about the process. Regarding the results, the first conclusion is that the overall scores were disappointingly low. Of the artifacts available for assessment, very few received overall scores of 4 or 5, including those produced by seniors. The average score for assignments written by seniors was 2.89. Some members of the committee felt that, to some extent, the nature of the artifacts resulted in the low scores. For example, for some of the assignments, the ‘identification of the problem’ was so implicit in the assignment that it was never explicitly stated by the student. This may have resulted in somewhat artificially low scores for that characteristic.
• Regarding the process itself, some committee members expressed some frustration with the artifacts
that were available. As mentioned above, one common problem was the nature of the assignments and the implicit nature of the assumptions inherent. Another problem involved assignments that were so specialized that some of the reviewers did not feel they had an adequate background in the topic to thoroughly evaluate the quality of the critical thinking. While it is felt that the attributes of sound

Appendix A OSU General Education Assessment Committee 2005 Annual Report
critical thinking, like good written communication, are somewhat universal, the evidence for such thinking may be highly specialized.
• The solution to these difficulties involves two actions. One, the committee will make an effort to
seek a wider variety of samples, focusing on mid-level courses that are designated with either an ‘H’ or an ‘S’. As noted, most of these courses list critical thinking as a prominent learning objective. Two, by continuing to host seminars on the assessment of critical thinking, it is felt that more faculty will become aware of the need for developing assignments that can be assessed in this way. Based on past experience at these seminars, many faculty are very interested in learning from each other about how they structure and evaluate such assignments.
Campus-wide discussion of critical thinking assessment The committee plans to continue the campus-wide discussion on the development and assessment of students’ critical thinking skills, and encourage faculty to share their experiences in teaching and assessing critical thinking. A professional development workshop, held in February 2005, on the development of the process for assessment of critical thinking was well attended and generated many ideas about the development of assignments for this assessment. Additional seminars, in conjunction with other university assessment activities, are being discussed. Specifically, the leaders of the Washington State University critical thinking project will be invited to present their work on assessment of critical thinking, most likely in the Spring 2006 semester. Committee plans for critical thinking assessment During the 2005-2006 academic year, the committee’s activities will again be focused on two goals: continuing development of the campus-wide conversation on critical thinking, and gathering of artifacts for evaluation next summer using the adapted critical thinking rubric. Accumulating enough artifacts and enough data to be statistically meaningful takes time. Additional efforts will be made to find a wider variety of artifacts, with the goal of avoiding some of the difficulties with the previous set. A greater emphasis on ‘H’-designated courses that stress critical thinking as a learning goal will be made. These efforts will be critical in ensuring that data is available and can be used in improving critical thinking development and assessment in the General Education program, as well as throughout the college, at OSU.

Appendix A OSU General Education Assessment Committee 2005 Annual Report
Critical thinking rubric (adapted from Washington State University course evaluation for critical thinking)
Level of Achievement Characteristics
1 -4: Essential Characteristics 1 2* 3 4** 5
1 Identification and/or summary of the problem/question at issue.
No identification and/or summary of the problem.
The main question is identified and clearly stated.
The main question and subsidiary, embedded, or implicit aspects of a question are identified and clearly stated.
2 Presentation of the STUDENT'S OWN perspective and position as it is important to the analysis of the issue.
The student’s own position relative to the question is not provided.
The student’s own position on the question is stated; however, little support for the position is provided.
The student’s own position on the issue is stated and support has been drawn from experience or information not available from assigned sources.
3 Assessment and appropriate use of supporting data/evidence.
No supporting data or evidence is utilized.
Evidence is used but not carefully examined. Source(s) of evidence are not questioned for accuracy, precision, relevance, and completeness. Inferences of cause and effect are stated, but not completely or entirely accurately. Facts and opinions are stated although not clearly distinguished from value judgments.
Evidence is identified and carefully examined. Source(s) of the evidence are questioned for accuracy, precision, relevance, and completeness. Accurately observes cause and effect. Facts and opinions are stated and clearly distinguished, and value judgments are acknowledged.
4 Discussion of conclusions, implications and consequences.
Conclusions are not provided.
Conclusions are provided without discussion of implications or consequences. Little or no reflective thought is provided with regards to the assertions.
Conclusions are clearly stated and discussed. Implications and consequences of the conclusion are considered in context, relative to assumptions, and supporting evidence. The student provides reflective thought with regards to the assertions.
5 – 7: Optional Characteristics (evaluated where appropriate)
5 Consideration of OTHER salient perspectives and positions that are important to the analysis of the issue.
Does not acknowledge other possible perspectives.
Acknowledges other possible perspectives although they are not clearly stated.
Uses other perspectives noted previously, and additional diverse perspectives drawn from outside information.
6 Assessment of the key assumptions and the validity of the supporting/ background information.
Does not identify the key assumptions and/or evaluate the given information that underlies the issue.
The key assumption(s) that underlies the issue is clearly stated. Necessary data or other background data is identified but not evaluated for validity, relevance or completeness.
The key assumption that underlies the issue is clearly stated and the validity of the assumption that underlies the issue is assessed. Key data and background information is evaluated for validity and used in a way consistent with this evaluation.
7 Consideration of the influence of the context on the issue (including, where appropriate, cultural, social, economic, technological, ethical, political, or personal context).
The problem is not connected to other issues or placed in context.
The context of the question is provided although it is not clearly analyzed. Limited consideration of the audience is provided. No consideration of other contexts is provided.
The issue is clearly analyzed within the scope and context of the question. An assessment of the audience is provided. Consideration of other pertinent contexts is provided.
* 2 - Exhibits some characteristics of ‘3’ and no characteristics of ‘5’ ** 4 - Exhibits most characteristics of ‘3’ and some characteristics of ‘5’ Critical Thinking rubric, based on revisions resulting from pilot study.

Appendix A OSU General Education Assessment Committee 2005 Annual Report
General Education Institutional Portfolios Overview The numbers of samples scored and used in analysis for each institutional portfolio developed in 2001-2005 are shown below. Institutional Portfolios for written communication skills assessment were developed in 2001 (pilot test year), 2002, 2003, 2004 and 2005; portfolios for math problem-solving skills were developed in 2002 (pilot test year), 2003 and 2005; and portfolios for science problem-solving skills were developed in 2003 (pilot test year), 2004 and 2005. An Institutional Portfolio for assessment of critical thinking was pilot tested in 2004 (data not reported) and fully developed in 2005. Samples sizes have been increased in each year of portfolio development to allow sufficient samples sizes for data analysis. Number of samples in each portfolio, 2001 – 2005
Portfolio Type Total number of
samples - all portfolios
Year
Written
Communication Skills
Math
Problem- Solving Skills
Science
Problem- Solving Skills
Critical Thinking Skills
2001 86 - - - 86
2002 111 76 - - 187
2003 225 268 68 - 561
2004 140 - 141 - 281
2005 142 189 129 141 601
All Years 704 533 338 141 1716
Appendix A OSU General Education Assessment Committee 2005 Annual Report
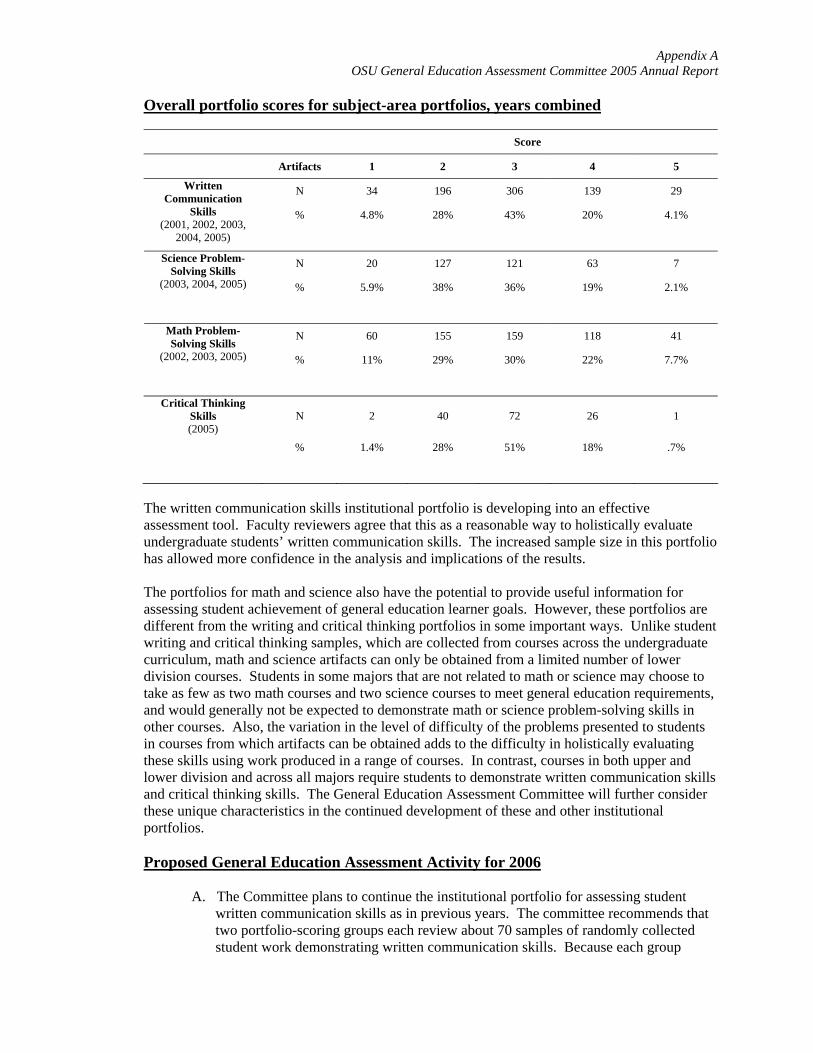
Overall portfolio scores for subject-area portfolios, years combined
Score
Artifacts 1 2 3 4 5
N 34 196 306 139 29
% 4.8% 28% 43% 20% 4.1%
Written Communication
Skills (2001, 2002, 2003,
2004, 2005)
N 20 127 121 63 7
% 5.9% 38% 36% 19% 2.1%
Science Problem- Solving Skills
(2003, 2004, 2005)
N 60 155 159 118 41
% 11% 29% 30% 22% 7.7%
Math Problem- Solving Skills
(2002, 2003, 2005)
Critical Thinking Skills (2005)
N 2 40 72 26 1
% 1.4% 28% 51% 18% .7%
The written communication skills institutional portfolio is developing into an effective assessment tool. Faculty reviewers agree that this as a reasonable way to holistically evaluate undergraduate students’ written communication skills. The increased sample size in this portfolio has allowed more confidence in the analysis and implications of the results. The portfolios for math and science also have the potential to provide useful information for assessing student achievement of general education learner goals. However, these portfolios are different from the writing and critical thinking portfolios in some important ways. Unlike student writing and critical thinking samples, which are collected from courses across the undergraduate curriculum, math and science artifacts can only be obtained from a limited number of lower division courses. Students in some majors that are not related to math or science may choose to take as few as two math courses and two science courses to meet general education requirements, and would generally not be expected to demonstrate math or science problem-solving skills in other courses. Also, the variation in the level of difficulty of the problems presented to students in courses from which artifacts can be obtained adds to the difficulty in holistically evaluating these skills using work produced in a range of courses. In contrast, courses in both upper and lower division and across all majors require students to demonstrate written communication skills and critical thinking skills. The General Education Assessment Committee will further consider these unique characteristics in the continued development of these and other institutional portfolios. Proposed General Education Assessment Activity for 2006
A. The Committee plans to continue the institutional portfolio for assessing student written communication skills as in previous years. The committee recommends that two portfolio-scoring groups each review about 70 samples of randomly collected student work demonstrating written communication skills. Because each group

Appendix A OSU General Education Assessment Committee 2005 Annual Report
consists of three faculty members, this will require six faculty reviewers for the 2006 written communication skills portfolio (two Committee members and four additional faculty reviewers).
B. The Committee plans to continue the institutional portfolio to evaluate students’
critical thinking skills. The Committee recommends that two portfolio-scoring groups, consisting of six faculty members, evaluate the critical thinking portfolio (two Committee members and four additional faculty reviewers). It is expected that this group of reviewers could review about 150 samples of student work demonstrating critical thinking skills.
C. The Committee will work with the Assessment Council and the General Education
Advisory Council to conduct a review of the General Education Assessment Process. D. The Committee will work with the General Education Advisory Council to clarify
criteria and goals for the general education learning outcome regarding diversity, and to develop an assessment process to evaluate students’ learning related to this learning goal.
E. The Committee plans to present information sessions for faculty to describe the
process and results of assessment of students’ achievement of general education learning goals since the committee began its work in 2000.