general election 2015: what happened and...
TRANSCRIPT
General Election 2015:
What Happened and Why?
Roger Scully
15th June 2015

Outline of Session
1. Introduction
2. General Election 2015: the UK Results
3. The Results in Wales
4. Why? Explaining the Election Outcome
5. Q & A

2015: Overall UK Result (changes on 2010)
Party % Vote Seats
Conservative 36.9 (+0.8) 331 (+24)
Labour 30.4 (+1.5) 232 (-26)
UKIP 12.6 (+9.5) 1 (+1)
Lib-Dems 7.9 (-15.2) 8 (-49)
SNP 4.7 (+3.1) 56 (+50)
Greens 3.8 (+2.8) 1
Others 3.7 (-2.5) 22

Notable Features of the UK Results, 1
• Slight reversal of long-term decline in two-party vote-share
• But continued fragmentation of the British party system: big rise in support for parties outside traditional three

How People Have Voted (1) 1950-2015
0
10
20
30
40
50
60
Labour
Tory

How People Have Voted (2) 1950-2015
0
10
20
30
40
50
60
70
80
90
100
19
50
19
51
19
55
19
59
19
64
19
66
19
70
19
74
f
19
74
o
19
79
19
83
19
87
19
92
19
97
20
01
20
05
20
10
20
15
Others
LDs
Cons+Lab
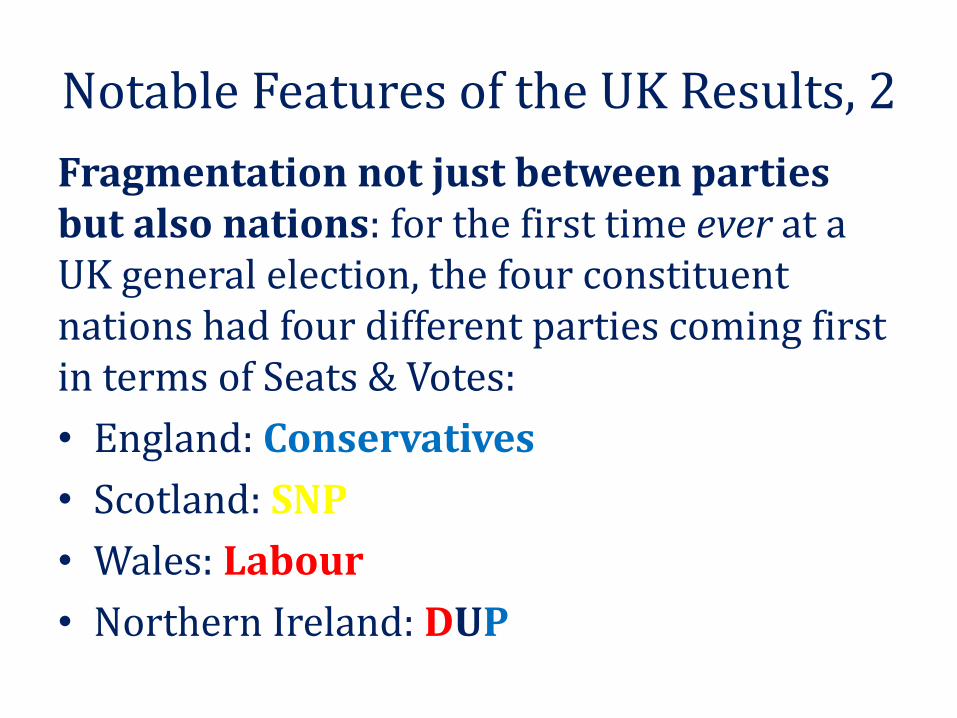
Notable Features of the UK Results, 2
Fragmentation not just between parties but also nations: for the first time ever at a UK general election, the four constituent nations had four different parties coming first in terms of Seats & Votes:
• England: Conservatives
• Scotland: SNP
• Wales: Labour
• Northern Ireland: DUP

Notable Features of the UK Results, 3
Fragmentation, under First Past the Post, means continued high dis-proportionality: several parties winning significant vote-share but few seats.
UK elections produce high levels of dis-proportionality by international standards
But this is not a new problem…

Gallagher Index of ‘Dis-Proportionality’, UK General Elections, 1951-2015
0
2
4
6
8
10
12
14
16
18
20
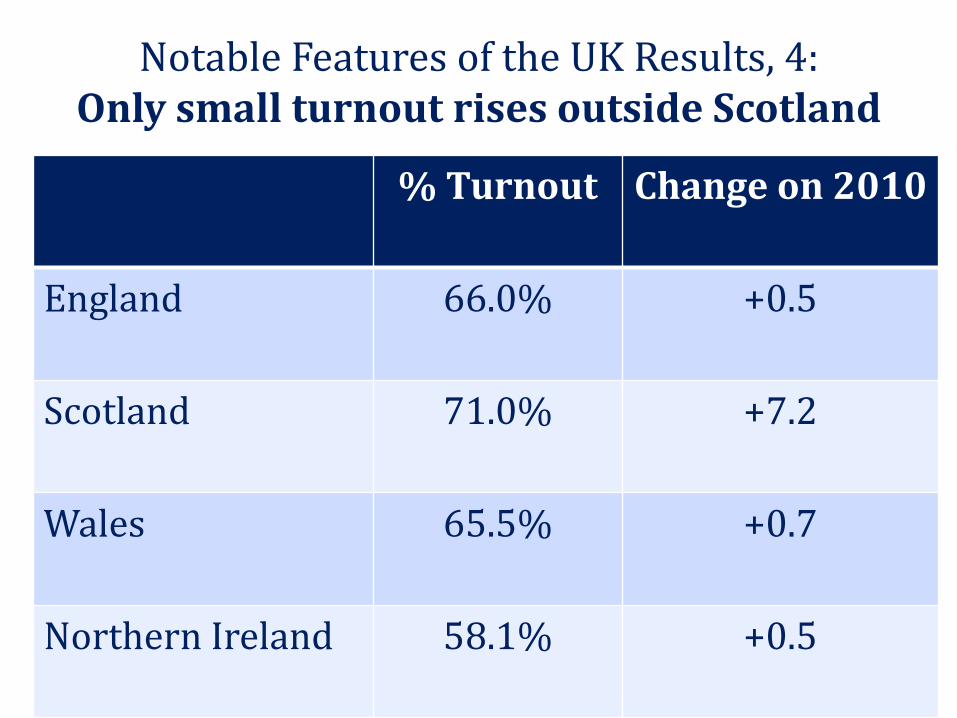
Notable Features of the UK Results, 4: Only small turnout rises outside Scotland
% Turnout Change on 2010
England 66.0% +0.5
Scotland 71.0% +7.2
Wales 65.5% +0.7
Northern Ireland 58.1% +0.5

% Turnout at UKGEs since 1950
0
10
20
30
40
50
60
70
80
90

Notable Features of the UK Results, 5: Scotland!
Scotland: an ‘Out-of-Sample Event’ (Nate Silver)
• Labour lost 97.6% of the seats they won in 2010; SNP increased their seat total in Commons by 833%
• SNP increased vote share from 19.9% in 2010 to 50.0% in 2015
• SNP came within 4255 votes of winning EVERY Scottish seat; a close second in all three seats they didn’t win

Outline of Session
1. Introduction
2. General Election 2015: the UK Results
3. The Results in Wales
4. Why? Explaining the Election Outcome
5. Q & A

2015: Result in Wales (changes on 2010)
Party % Vote Seats
Labour 36.9 (+0.7) 25 (-1)
Conservative 27.2 (+1.1) 11 (+3)
Plaid Cymru 12.1 (+0.9) 3
Lib-Dems 6.5 (-13.6) 1 (-2)
UKIP 13.6 (+11.2) 0
Others 3.7 (-0.2) 0

2015 Results: Labour • Labour won the most votes,
and a majority of the seats, in Wales for the 20th successive general election (every one from 1935 onwards)
• But 36.9% was second lowest general election vote share since 1918
• Lost 0 deposits
• Highest Vote Share: Blaenau Gwent: 58.0%
• Lowest Vote Share: Montgomeryshire: 5.6%
Best Vote Share Changes From 2010 • Cardiff Central: +11.2% • Merthyr Tydfil & Rhymney: +10.2% • Swansea West: +7.9% • Blaenau Gwent: +5.6% • Brecon & Radnor: +4.2% Worst Vote Share Changes from 2010 • Cynon Valley: -4.8% • Rhondda: -4.6% • Carm. West & South Pembs: -4.0% • Vale of Clwyd: -3.9% • Aberavon: -3.0%

2015 Results: Conservative • Highest number of
Conservative seats in Wales since the 14 won in 1983
• However, lower vote share than in 1987 or 1992
• Lost 0 deposits
• Highest Vote Share: Monmouth: 49.9%
• Lowest Vote Share: Rhondda: 6.7%
Best Vote Share Changes From 2010 • Wrexham: +6.2% • Aberconwy: +5.7% • Gower: +5.1% • Cardiff North: +4.9% • Brecon & Radnor: +4.5% Worst Vote Share Changes from 2010 • Cardiff Central: -6.9% • Cardiff West: -4.5% • Arfon: -3.8% • Aberavon: -2.4% • Preseli Pembrokeshire: -2.4%
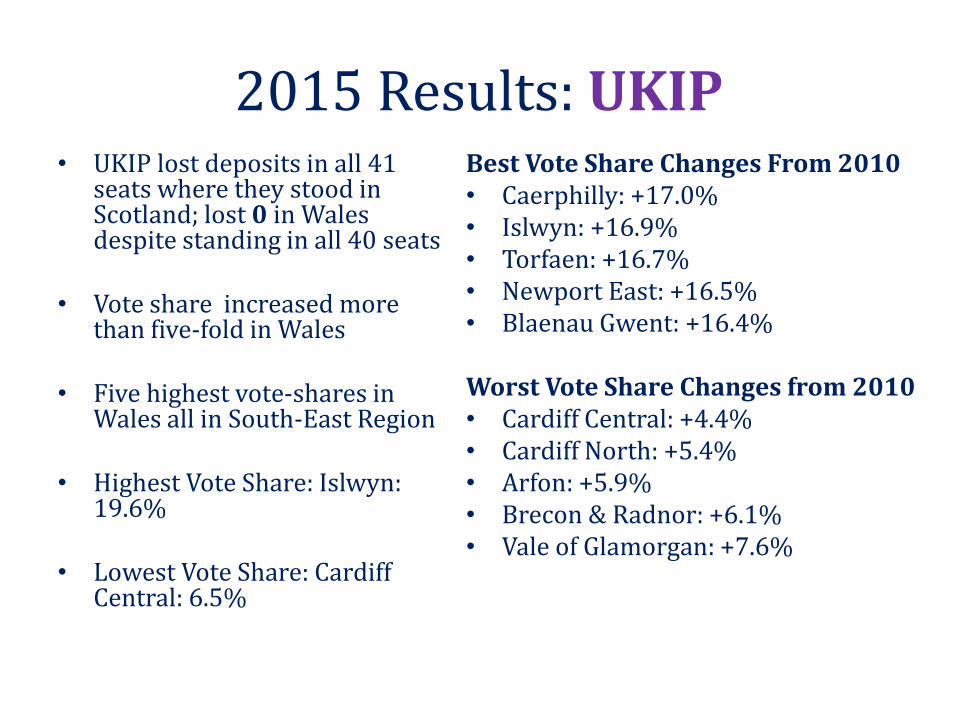
2015 Results: UKIP • UKIP lost deposits in all 41
seats where they stood in Scotland; lost 0 in Wales despite standing in all 40 seats
• Vote share increased more than five-fold in Wales
• Five highest vote-shares in Wales all in South-East Region
• Highest Vote Share: Islwyn: 19.6%
• Lowest Vote Share: Cardiff Central: 6.5%
Best Vote Share Changes From 2010 • Caerphilly: +17.0% • Islwyn: +16.9% • Torfaen: +16.7% • Newport East: +16.5% • Blaenau Gwent: +16.4% Worst Vote Share Changes from 2010 • Cardiff Central: +4.4% • Cardiff North: +5.4% • Arfon: +5.9% • Brecon & Radnor: +6.1% • Vale of Glamorgan: +7.6%

2015 Results: Plaid Cymru • Vote share up in general
election for first time since 2001
• Third highest Plaid vote share ever at a general election
• Lost 7 deposits
• Highest Vote Share: Arfon: 43.9%
• Lowest Vote Share: Newport East: 3.5%
Best Vote Share Changes From 2010 • Rhondda: +8.9% • Arfon: +8.0% • Cardiff West: +6.9% • Blaenau Gwent: +4.9% • Aberavon: +4.5% Worst Vote Share Changes from 2010 • Llanelli: -7.0% • Aberconwy: -6.1% • Cynon Valley: -3.5% • Dwyfor Meirionydd: -3.5% • Clwyd West: -3.2%
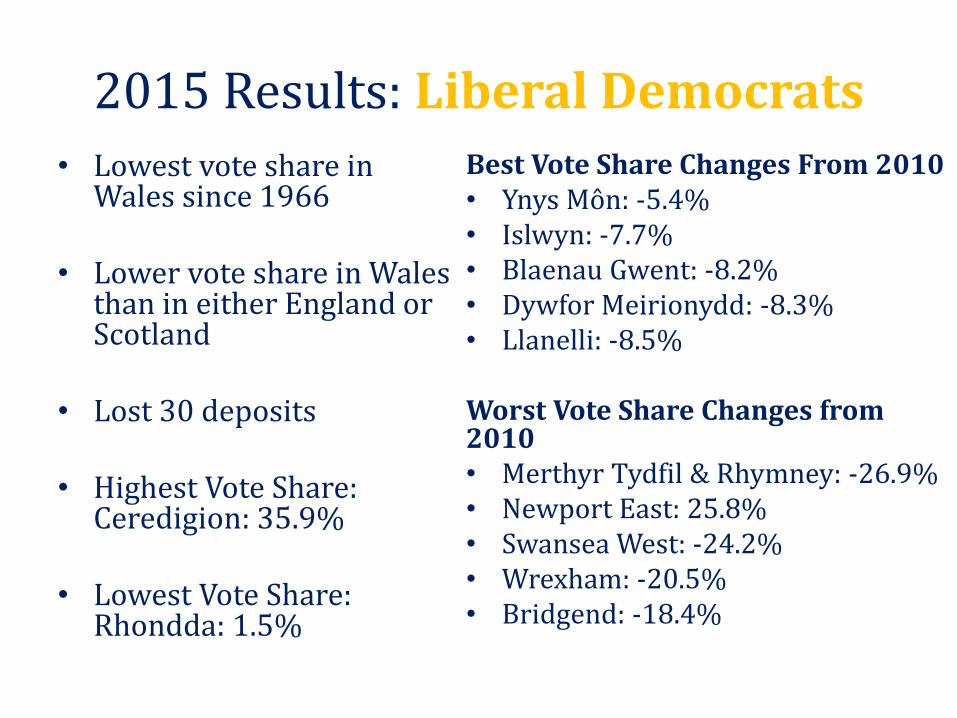
2015 Results: Liberal Democrats
• Lowest vote share in Wales since 1966
• Lower vote share in Wales than in either England or Scotland
• Lost 30 deposits
• Highest Vote Share: Ceredigion: 35.9%
• Lowest Vote Share: Rhondda: 1.5%
Best Vote Share Changes From 2010 • Ynys Môn: -5.4% • Islwyn: -7.7% • Blaenau Gwent: -8.2% • Dywfor Meirionydd: -8.3% • Llanelli: -8.5% Worst Vote Share Changes from 2010 • Merthyr Tydfil & Rhymney: -26.9% • Newport East: 25.8% • Swansea West: -24.2% • Wrexham: -20.5% • Bridgend: -18.4%

How Did Parties Perform Locally?
• Can evaluate against pre-election expectations
• In following slides, seat in bold if party won
Party Status of Seat
Uncompetitive Competitive
Held Safe Defence
Non-Held Hopeless Target
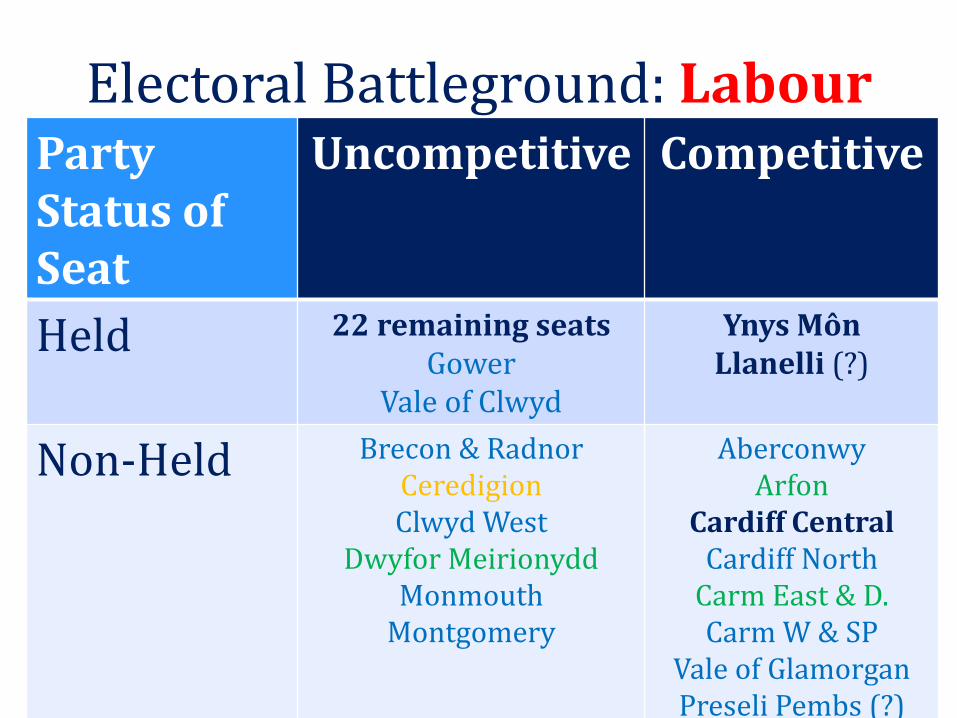
Electoral Battleground: Labour Party Status of Seat
Uncompetitive Competitive
Held 22 remaining seats Gower
Vale of Clwyd
Ynys Môn Llanelli (?)
Non-Held Brecon & Radnor Ceredigion Clwyd West
Dwyfor Meirionydd Monmouth
Montgomery
Aberconwy Arfon
Cardiff Central Cardiff North
Carm East & D. Carm W & SP
Vale of Glamorgan Preseli Pembs (?)
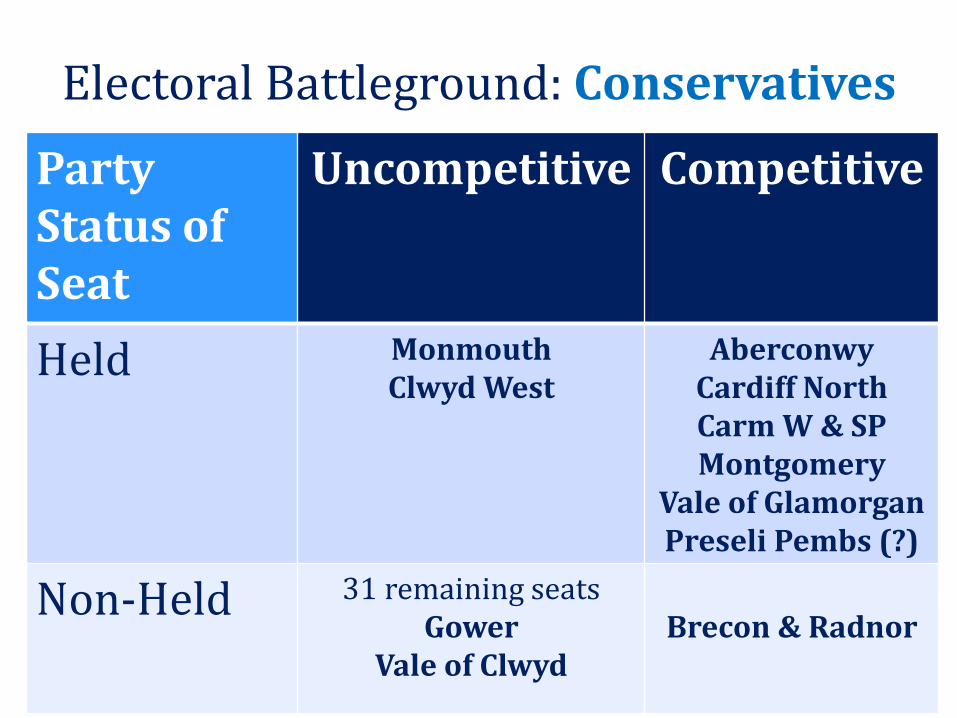
Electoral Battleground: Conservatives
Party Status of Seat
Uncompetitive Competitive
Held Monmouth Clwyd West
Aberconwy Cardiff North Carm W & SP Montgomery
Vale of Glamorgan Preseli Pembs (?)
Non-Held 31 remaining seats Gower
Vale of Clwyd
Brecon & Radnor

Electoral Battleground: Lib-Dems
Party Status of Seat
Uncompetitive Competitive
Held Brecon & Radnor Cardiff Central
Ceredigion
Non-Held 36 remaining seats Montgomery

Electoral Battleground: Plaid Cymru
Party Status of Seat
Uncompetitive Competitive
Held Dwyfor Meirionydd Arfon Carm East & D.
Non-Held 34 remaining seats Ynys Môn Ceredigion Llanelli (?)

Outline of Session
1. Introduction
2. General Election 2015: the UK Results
3. The Results in Wales
4. Why? Explaining the Election Outcome
5. Q & A

Election 2015: Why? 1 Votes Seats • ConLab swing in England of c.1.1%; should
have seen net Labour gain from Tories of 15 seats; actual net gain of 4
• LabCon swing in Wales of 0.2%; should have seen no seat changes; actual Con gain of 2
• Conservative local campaigning highly effective: o Perhaps some first-time incumbency effect? o Maybe also squeezing UKIP votes in marginals? (BES) o ‘Black Widow’ strategy in Lib-Dem seats
• ‘Labour Doorstep’ less effective in key seats – contrast with 2010

Campaigns: Contact as of early-March
0%
10%
20%
30%
40%
50%
60%
70%
80%
90%
Yes No Don't Know
‘Have you been contacted by someone from a political party about the General Election?’

Of Those Contacted (March): Which Party?
0%
10%
20%
30%
40%
50%
60%
70%
Labour Conservative Lib-Dems Plaid UKIP

Campaigns: Contact (BES Campaign Survey)
0%
10%
20%
30%
40%
50%
60%
70%
Yes No Don't Know
‘Have any of the political parties contacted you during the previous four weeks?’

Of Those Contacted (May): Which Party?
0%
10%
20%
30%
40%
50%
60%
70%
80%
90%
Labour Conservative Lib-Dems Plaid UKIP

Election 2015: Why? 2 A Valence election
• Substantial Conservative advantage on economic competence
• Substantial Conservative advantage on leadership
No governing party has ever lost a general election when simultanously leading on both factors
Election result therefore really shouldn’t have been so surprising; it was, because of…

Election 2015: Why? 3 The Polls: where did it all go so wrong?
• Polls very close to final outcome in Scotland and in Wales; problems in England
• In England, polls close on UKIP, Lib-Dems and Greens
• Core problem was over-estimate of Labour and under-statement of Conservatives: common to different pollsters, different methods etc
• WHY? o Late Swing?
o Polls were always wrong?

For Wales, See England?
• Election extended much further the divergence of Scottish electoral politics from those in England
• For Wales, trends less clear; has always been influenced by rest of Britain, although also persisting differences

Tory Electoral Support, England, Scotland & Wales, 1945-2015
0
10
20
30
40
50
60
Scotland
England
Wales

Labour Electoral Support, England, Scotland & Wales, 1945-2015
0
10
20
30
40
50
60
70
Scotland
England
Wales

Gap Between Electoral Support in England and Wales, Conservatives & Labour, 1945-2015
-25
-20
-15
-10
-5
0
5
10
15
20

Dissimilarity From England: Election Results Scotland & Wales, 1945-2015
0
10
20
30
40
50
60