general exam hints (semester 1) student saturday · pdf filegeneral exam hints (semester 1)...
TRANSCRIPT

General Exam Hints (Semester 1) Student Saturday Session
Contributions by Gloria Barrett, Virginia Advanced Study Strategies
Student Notes: Prep Session Topic: AP Statistics Exam Hints, Writing Complete Free Response Answers Exam Format The AP Statistics Exam is three hours long. The exam consists of (1) a 90‐minute multiple‐choice section and (2) a 90‐minute free‐response section requiring the student to answer open‐ended questions and to complete an investigative task involving more extended reasoning. In the determination of the grade for the exam, the two sections will be given equal weight. In the free‐response section of the AP Statistics Exam, students are asked to answer five questions and complete an investigative task. Each question is designed to be answered in approximately 12 minutes. The longer investigative task is designed to be answered in approximately 30 minutes. You will be allowed to use tables (the same ones that are in your textbook or alternative ones that your teacher will provide), formula sheets, and calculator during the entire exam. Students are not permitted to have programs in their calculators that upgrade the functionality beyond the statistical features found on newer approved models. Scoring of Free Response Questions The evaluation of free‐response answers reflects the dual importance of statistical knowledge and good communication. The free‐response questions and the investigative task are scored “holistically”; that is, each question’s response is evaluated as “a complete package.” With holistic scoring, after reading through the details of a student’s response, the scorer makes a judgment about the overall quality of the response. The AP Statistics scoring guideline (rubric) for each free‐response question has five categories, numerically scored on a 0 to 4 scale. Each of these categories represents a level of quality in the student response. The levels of quality are defined on two dimensions: statistical knowledge and communication. 4: Complete – Shows complete understanding of the problem’s statistical components and provides a clear,
organized, and complete explanation, using correct terminology, of what was done and why. 3: Substantial – Shows substantial understanding of the problem’s statistical components and provides a clear
but not perfectly organized explanation, using correct terminology, of what was done and why, but explanation may be slightly incomplete.
2: Developing – Shows some understanding of the problem’s statistical components and provides some
explanation of what was done, but the explanation may be vague and difficult to interpret and terminology may be somewhat inappropriate.
1: Minimal – Shows limited understanding of the problem’s statistical components by failing to identify
important components; provides minimal or unclear explanation of what was done or why it was done, and explanation may not match the presented solution.
AP Statistics Exam Scoring 40 Multiple Choice Raw Score = total correct (there is NO guessing penalty) 1.25 * Multiple Choice Raw Score → possible 50 points 5 Free Response 1.875*Score → possible 7.5 points each → possible 37.5 points 1 Investigative Task 3.125*Score → possible 12.5 points (note: the investigative task counts 1/8 of the total score – don’t skip it!) Total points possible = 100
General Exam Hints (Semester 1) Student Saturday Session
Contributions by Gloria Barrett, Virginia Advanced Study Strategies
For the 2007 AP Statistics exam, the score ranges were: Total Points AP Grade
Score Points 5 63 to 100 4 49 to 62
3* 37 to 48 2 29 to 36 1 0 to 28
*That is correct… Students only needed 37% of the points to earn a qualifying score in 2007!
General tips for writing free response answers (adapted from Zack Bigner post to the AP Statistics EDG) 1. Understand that your obligation as a test taker is to convince the reader that you understand the key concepts
in the question. You are evaluated both on the correctness of your answers and on your ability to communicate the methods you used to reach them.
2. Be aware that “naked” numerical answers receive no credit; similarly, single word answers, for example, “yes” or “no,” receive no credit without justification.
3. Calculator syntax will not be sufficient for full credit. 4. Read all the parts of a question and think about how they are related before you begin writing your answer. If
one part asks you to answer a question based on the result of a previous part that you could not do, make up an answer to the previous part so that you can continue. Sometimes the later parts of a question do not depend on the parts that come before. Be sure to read every part of a question so that you don’t overlook later parts that you can answer.
5. Answer the question that you are asked. Read each question carefully to make sure you really understand what is being asked.
6. When you have answered the question, quit writing. Generally you are given more space than you need. 7. Answer the question in context. This is especially important when writing conclusions. 8. Use standard symbols and be sure to define any symbols that you make up. Be careful not to confuse symbols
for population parameters and symbols for sample statistics. 9. Use vocabulary very carefully. Be especially careful when you use the words normal and significant. 10. Avoid using the pronoun “it” unless the antecedent is clear. You will not get full credit for a vague answer. 11. Leave sufficient time for the investigative task. One strategy is to work several of the other free response
questions that seem easy to you and then work on the investigative task for awhile. If you run out of time, it would be better to omit one of the five regular free response questions, since they count less than the Investigative Task.
12. Provide only one answer to a question. When students provide two solutions, AP Statistics readers will grade both solutions and record the lower sore. So you will waste precious time if you work a problem two ways.
13. If you decide to change an answer, be sure to cross out or erase the incorrect answer. Often crossing out the answer is quicker, if you have room for the new answer.
14. On both Multiple Choice and Free Response questions, skip questions that seem hard to you. Come back and work on these questions if time permits. There is no “guessing penalty” – answer all of the multiple-choice questions.
15. Write neatly and clearly. Reviewing for the exam You will be preparing for the AP Statistics exam all year, but you will be most successful if you begin a systematic review several weeks before the exam. Your teacher will provide you with the list of topics covered on the exam. As you look over the topics, spend time studying topics that you struggled with during the course or that you have forgotten. Practice writing good free response answers. The handouts that you received at prep sessions have lots of old free response questions, and many sample solutions are provided. Write answers to problems and then compare your answer to the model solution. Remember, your goal is to get maximum credit for what you know. Do not try to cut corners in your answer. The graders read only what you write, not what they may think you meant.
General Exam Hints (Semester 1) Student Saturday Session
Contributions by Gloria Barrett, Virginia Advanced Study Strategies
Writing complete answers to descriptive statistics questions 1. If you are asked to make a graph, be sure to include a title, labels on the horizontal and vertical axes, and
scales on both axes (if appropriate). Also, if the graph includes multiple data sets (for example parallel boxplots), be sure to label each plot.
2. Be careful when you describe the shape of a mound‐shaped, approximately symmetric distribution. The distribution may or may not be normal. Graders will accept the description as approximately normal, but they will not accept that the distribution is normal based only on a mound‐shaped, symmetric graph.
3. Be careful to use the correct term when you describe the shape of a uniform distribution. 4. If you are asked to provide information about a distribution based on a graph, you should always comment on
center, shape, and spread. If there are unusual features, for example outliers, clusters, or gaps, you should also comment on those. All discussion should be in context.
5. If you are asked to compare two distributions based on graphs, be sure to compare and describe the center, shape, and spread. Simply listing these features for both samples without a direct comparison has earned students no credit in the past. Also, saying that shapes are similar without describing the shape will not receive full credit.
6. Right skewed is the same as skewed toward large values; left skewed is the same as skewed toward small values. A student may also describe right-skewedness as “having a longer tail on the right”.
7. If a distribution is approximately symmetric, the mean and median will be close in value. If a distribution is skewed, the mean will generally be pulled away from the median in the direction of the tale. So generally it will be correct to say “since the distribution is skewed to the right, we expect the mean to be greater than the median.”
8. Knowing that the mean and median are unequal does not guarantee that the shape of the distribution is skewed. So it is risky (and generally not correct) to say something like “since the mean is greater than the median, the distribution is skewed to the right.”

General Exam Hints (Semester 1) Student Saturday Session
Contributions by Gloria Barrett, Virginia Advanced Study Strategies
2002B #5 5. At a school field day, 50 students and 50 faculty members each completed an obstacle course. Descriptive
statistics for the completion times (in minutes) for the two groups are shown below.
(a) Use the same scale to draw boxplots for the completion times for students and for faculty members.
(b) Write a few sentences comparing the variability of the two distributions.
(c) You have been asked to report on this event for the school newspaper. Write a few sentences describing student and faculty performances in this competition for the paper.

General Exam Hints (Semester 1) Student Saturday Session
Contributions by Gloria Barrett, Virginia Advanced Study Strategies

General Exam Hints (Semester 1) Student Saturday Session
Contributions by Gloria Barrett, Virginia Advanced Study Strategies
Writing complete answers to probability questions 1. Be sure to show support for your answers. For example, on an expected value problem, show the formula
µX = E(X) = xi pi! ; on a problem requiring probabilities associated with a normal distribution, provide a sketch and a statement of the probability you are calculating.
2. Be sure to identify the model being used for questions requiring a normal distribution along with the appropriate mean, standard deviation and the direction. This can be done via a sketch of the normal distribution with mean and standard deviation labeled and the appropriate portion of the graph shaded.
3. Be sure to identify the model being used for questions requiring a binomial distribution along with the appropriate parameters (n and p) . This can be done by simply stating “the distribution of X follows a binomial distribution with n=__ and p=__. It is also acceptable for students to use the standard notation: X ~ B(n, p) .
4. If the answer to one part of a free response question depends on the answer to a previous part that you could not work, make up an answer to the previous part (be sure to state that you are doing this) and use it in your computations. Choose a value between 0 and 1 other than .5.
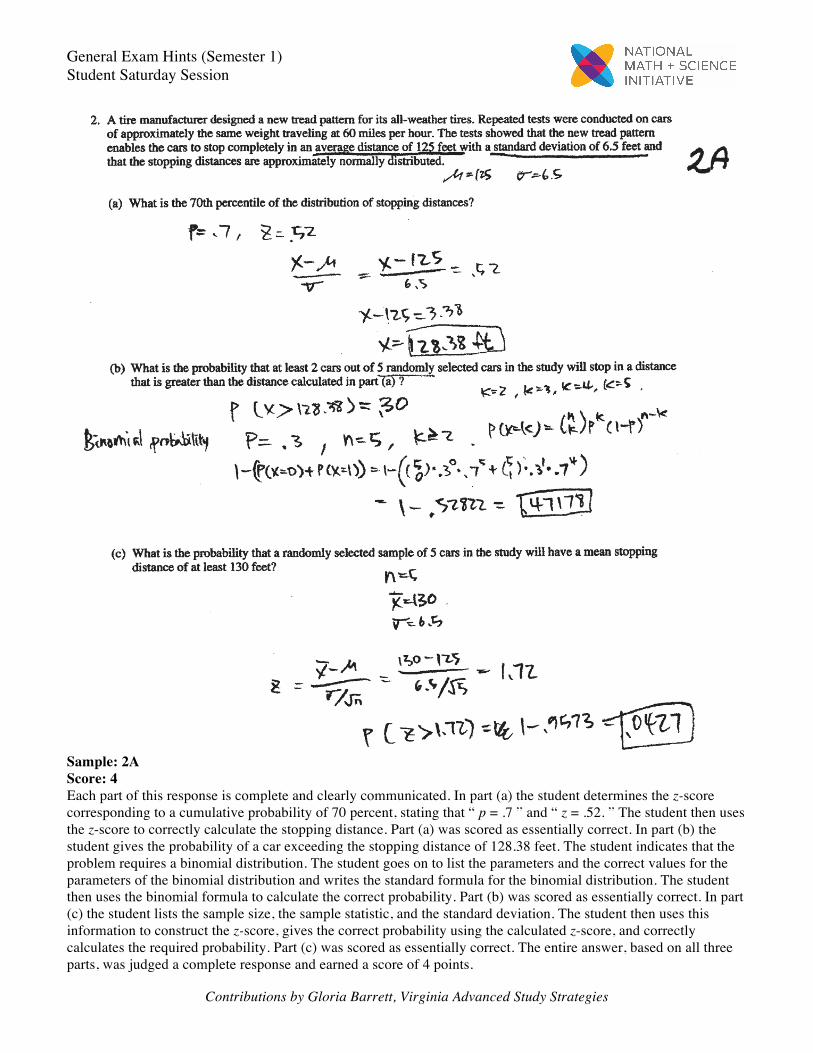
5. Never leave an answer to a probability problem that is greater than 1 or less than 0. 2009 #2 2. A tire manufacturer designed a new tread pattern for its all-weather tires. Repeated tests were conducted on
cars of approximately the same weight traveling at 60 miles per hour. The tests showed that the new tread pattern enables the cars to stop completely in an average distance of 125 feet with a standard deviation of 6.5 feet and that the stopping distances are approximately normally distributed.
A. What is the 70th percentile of the distribution of stopping distances? B. What is the probability that at least 2 cars out of 5 randomly selected cars in the study will stop in a
distance that is greater than the distance calculated in part (a) ? C. What is the probability that a randomly selected sample of 5 cars in the study will have a mean stopping
distance of at least 130 feet?
General Exam Hints (Semester 1) Student Saturday Session
Contributions by Gloria Barrett, Virginia Advanced Study Strategies
Sample: 2A Score: 4 Each part of this response is complete and clearly communicated. In part (a) the student determines the z-score corresponding to a cumulative probability of 70 percent, stating that “ p = .7 ” and “ z = .52. ” The student then uses the z-score to correctly calculate the stopping distance. Part (a) was scored as essentially correct. In part (b) the student gives the probability of a car exceeding the stopping distance of 128.38 feet. The student indicates that the problem requires a binomial distribution. The student goes on to list the parameters and the correct values for the parameters of the binomial distribution and writes the standard formula for the binomial distribution. The student then uses the binomial formula to calculate the correct probability. Part (b) was scored as essentially correct. In part (c) the student lists the sample size, the sample statistic, and the standard deviation. The student then uses this information to construct the z-score, gives the correct probability using the calculated z-score, and correctly calculates the required probability. Part (c) was scored as essentially correct. The entire answer, based on all three parts, was judged a complete response and earned a score of 4 points.

General Exam Hints (Semester 1) Student Saturday Session
Contributions by Gloria Barrett, Virginia Advanced Study Strategies
Sample: 2C Score: 2 Two of the three parts of this response are complete and clearly communicated. In part (a) the student lists the parameters of the given distribution and uses the 70 percent cumulative probability to obtain the zscore of 0.52. The student uses the z-score formula to determine the correct stopping distance. The student goes on to give a complete statement indicating the required stopping distance, which shows very good communication skills. Part (a) was scored as essentially correct. In part (b) the student indicates a binomial cumulative distribution function and gives a probability statement for X ≥ 2, setting this probability equal to the required binomial terms and summing them to get the required probability. Part (b) was scored as essentially correct. In part (c) the student fails to determine the sampling distribution and the parameters of the distribution and does not compute the correct probability. Part (c) was scored as incorrect. With two parts essentially correct and one part incorrect, the entire answer was judged a developing response and earned a score of 2 points.

General Exam Hints (Semester 1) Student Saturday Session
Contributions by Gloria Barrett, Virginia Advanced Study Strategies
When writing answers to experimental design and sampling questions, be sure you understand that‐‐‐ 1. Some experiments have a control group (a group of experimental units that receive no treatment or receive
only a placebo), but this is not necessary for a well-designed experiment. Sometimes different treatments are compared, and the control results from comparing a new treatment with a traditional treatment.
2. Replication refers to having multiple experimental units in each treatment group (repeating the treatment), not to repeating the entire experiment.
3. In an experiment, randomization refers to randomly assigning experimental units to the treatments. Often the experimental units are not a random sample of the population of interest.
While this is not a problem with the experimental design, it may limit the scope of inference for the experimental results. (Note that random samples are necessary in surveys.)
4. The purpose of random assignment (of experimental units to treatment groups or of treatments to experimental units) is to even out extraneous variables and make treatment groups that are approximately similar in all respects except for the treatment.
5. In a double blind experiment, someone must know which treatment the experimental unit received. The evaluator does not know, but other members of the research team do know.
6. A confounding variable is one that affects the response variable and also is related to group membership. A variable that affects the response variable and is not related to group membership (that is, the variable would be expected to even out across the groups) is not a confounding variable. You may refer to this type of variable as an extraneous variable.
7. Blocks are groups of experimental units that are homogeneous with respect to some variable that is expected to affect the response to treatments.
8. Blocks are considered a form of control – blocks help control known sources of variability among the experimental units so that the experimenter is better able to detect differences in the response variable that are due to the treatments.
9. “Blocking is used to control the factors you can see; randomization helps balance the ones you cannot see.” Richard L. Scheaffer, AP Statistics Chief Faculty Consultant, 1997‐1999
10. Random sampling from a population helps ensure (but does not guarantee) that the individuals in the sample are representative of the population.
11. Without random samples, results cannot be generalized to the population. 12. It is best to avoid using the term lurking variable. It will almost always get you in trouble!

General Exam Hints (Semester 1) Student Saturday Session
Contributions by Gloria Barrett, Virginia Advanced Study Strategies
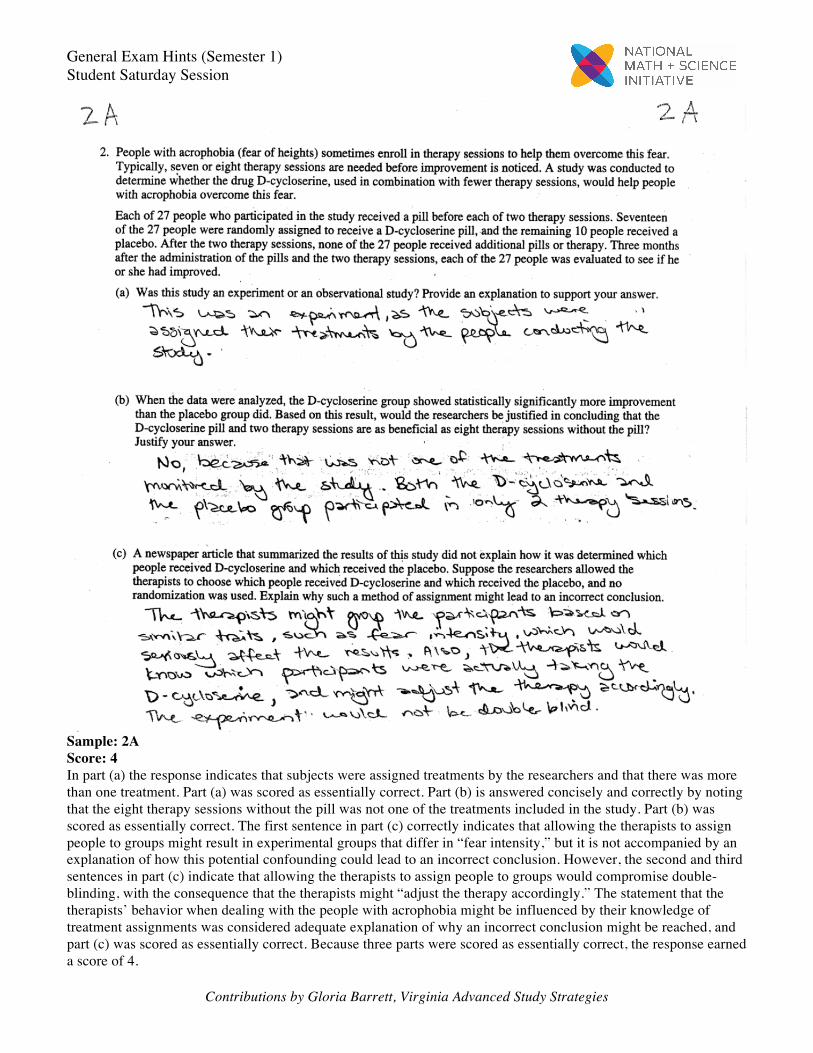
2011B #2 2. People with acrophobia (fear of heights) sometimes enroll in therapy sessions to help them overcome this fear.
Typically, seven or eight therapy sessions are needed before improvement is noticed. A study was conducted to determine whether the drug D-cycloserine, used in combination with fewer therapy sessions, would help people with acrophobia overcome this fear.
Each of 27 people who participated in the study received a pill before each of two therapy sessions.
Seventeen of the 27 people were randomly assigned to receive a D-cycloserine pill, and the remaining 10 people received a placebo. After the two therapy sessions, none of the 27 people received additional pills or therapy. Three months after the administration of the pills and the two therapy sessions, each of the 27 people was evaluated to see if he or she had improved.
A. Was this study an experiment or an observational study? Provide an explanation to support your answer. B. When the data were analyzed, the D-cycloserine group showed statistically significantly more
improvement than the placebo group did. Based on this result, would the researchers be justified in concluding that the D-cycloserine pill and two therapy sessions are as beneficial as eight therapy sessions without the pill? Justify your answer.
C. A newspaper article that summarized the results of this study did not explain how it was determined
which people received D-cycloserine and which received the placebo. Suppose the researchers allowed the therapists to choose which people received D-cycloserine and which received the placebo, and no randomization was used. Explain why such a method of assignment might lead to an incorrect conclusion.
General Exam Hints (Semester 1) Student Saturday Session
Contributions by Gloria Barrett, Virginia Advanced Study Strategies
Sample: 2A Score: 4 In part (a) the response indicates that subjects were assigned treatments by the researchers and that there was more than one treatment. Part (a) was scored as essentially correct. Part (b) is answered concisely and correctly by noting that the eight therapy sessions without the pill was not one of the treatments included in the study. Part (b) was scored as essentially correct. The first sentence in part (c) correctly indicates that allowing the therapists to assign people to groups might result in experimental groups that differ in “fear intensity,” but it is not accompanied by an explanation of how this potential confounding could lead to an incorrect conclusion. However, the second and third sentences in part (c) indicate that allowing the therapists to assign people to groups would compromise double-blinding, with the consequence that the therapists might “adjust the therapy accordingly.” The statement that the therapists’ behavior when dealing with the people with acrophobia might be influenced by their knowledge of treatment assignments was considered adequate explanation of why an incorrect conclusion might be reached, and part (c) was scored as essentially correct. Because three parts were scored as essentially correct, the response earned a score of 4.

General Exam Hints (Semester 1) Student Saturday Session
Contributions by Gloria Barrett, Virginia Advanced Study Strategies
Sample: 2B Score: 3 In part (a) the response indicates correctly that the study was an experiment because the independent variable was “manipulated” and the dependent variable was “to be observed.” The response also indicates that there was a “control group and experimental group.” Part (a) was scored as essentially correct. Part (b) was answered correctly by noting that because the study includes only treatments with two therapy sessions, conclusions can be made only about treatments with two therapy sessions. Part (b) was scored as essentially correct. The response in part (c) indicates that lack of random assignment could lead to confounding, but no example in the context of the study is provided. Part (c) was scored as partially correct. Because two parts were scored as essentially correct and one part was scored as partially correct, the response earned a score of 3.
General Exam Hints (Semester 1) Student Saturday Session
Contributions by Gloria Barrett, Virginia Advanced Study Strategies
Additional Reminders… Use your calculator wisely Calculators can save you lots of time on both Multiple Choice and Free Response questions. Be sure to review the syntax your calculator uses for
• Computing summary statistics • Binomial probability computations • Computations associated with normal, t, and X 2 distributions • Computing linear regression equations •
Also, be sure that you know how to create statistical graphs, including boxplots, histograms, normal probability plots, scatter plots (with and without regression lines), and residual plots. You should also be familiar with the confidence intervals and significance tests that your calculator will perform. Entering the two‐way table for X 2 tests may require matrices, so be sure to review these procedures before the AP exam. As stated previously, calculator syntax will not provide sufficient support for numerical answers. Be sure to give additional support for your answer that communicates your understanding of the procedure or computation. Last minute reminders 1. Get a good night’s sleep before the exam. 2. Make sure your calculator has good batteries. You are allowed to bring two calculators to the exam. 3. Bring extra pencils. 4. Do not panic! Keep in mind that it usually takes less than 70 points to get a 5 on the exam and only around
40% to earn a 3.