general information on deterioration of existing concrete structures
TRANSCRIPT

GENERAL INFORMATION ON DETERIORATION OF EXISTING CONCRETE STRUCTURES
AND RECENT RESEARCH TOPICS ON THE MAINTENANCE TECHNIQUES IN PWRI
Hiroshi WATANABE1 and Hirohisa KOGA1
SUMMARY
Many concrete structures have been constructed in Japan. Some concrete structures show severe deterioration and need repair or strengthening to keep their serviceability. Development of strategic maintenance is the highest priority under the background of aging of huge amount of stock of concrete structures and restrained budget. Public Works Research Institute has been undertaking comprehensive research projects for effective maintenance techniques for existing concrete structures. As part of the research, we carried out nationwide survey of soundness of concrete structures and maintenance cost of concrete structures deteriorated by salt attack. In this paper, the research results are introduced and discussed to recognize importance of preventative maintenance against deterioration of salt induced corrosion. Keywords: Nationwide survey, Deterioration of concrete structures, Life cycle cost of concrete structures, Diagnosis with non-destructive tests
INTRODUCTION
Many civil concrete structures have been built in Japan, many of which keep good performance and satisfy their intended service ability. However some concrete structures show deterioration and need repair or strengthening to achieve their service life. It is very important to establish strategic maintenance programme for the existing civil concrete structures especially under decline of tax revenues in Japan. Public Works Research Institute (hereafter PWRI) carries out comprehensive research and development on strategic maintenance for existing concrete structures. This paper outlines research results on current state of performance of existing concrete structures, maintenance cost of concrete structures deteriorated by salt-induced corrosion.
1 Research Engineer, Structure Management Technology Team, Construction Technology Research Department, Public Works Research Institute, JAPAN 305-8516, e-mail: [email protected] , [email protected]

RESEARCH ON DURABILITY PERFORMANCE OF EXISTING CIVIL
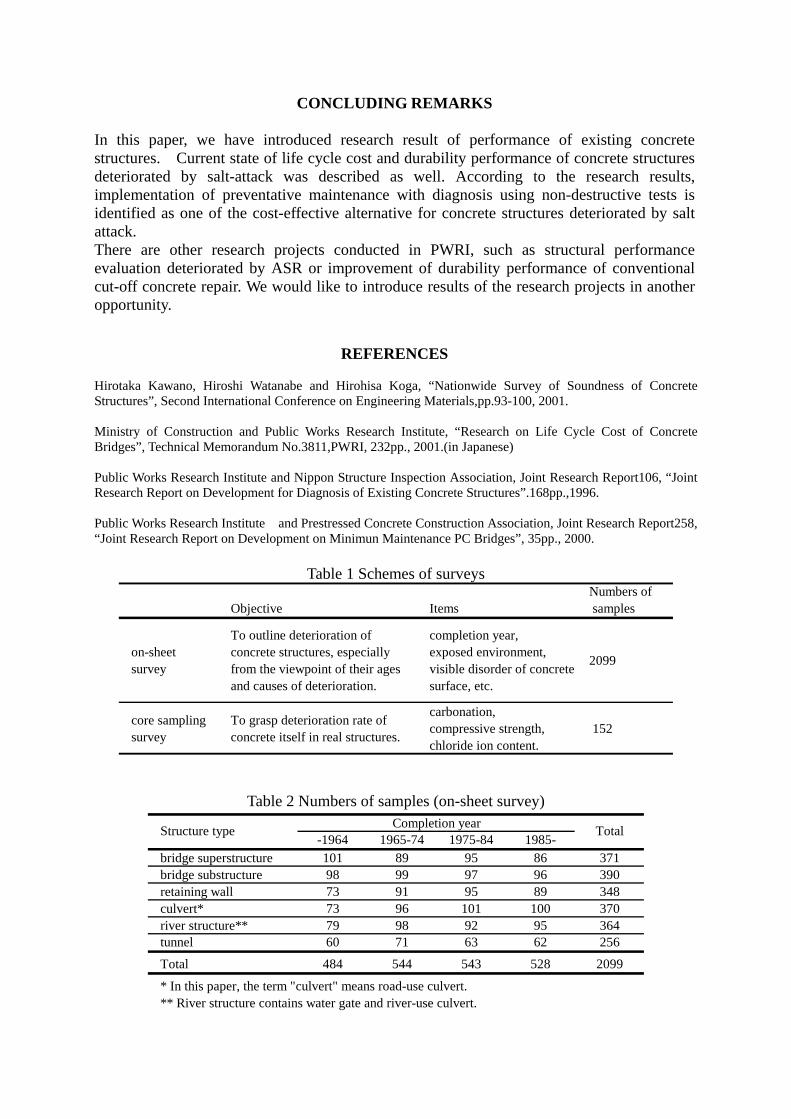
CONCRETE STRUCTURES IN JAPAN Research background An accident in a Shinkansen railway tunnel, in which a 200-kg concrete block fell from the tunnel lining and hit a travelling train in 1999 in Japan, triggered much discussion and concern as to the durability of concrete structures. Newspapers reported many subsequent accidents and the reliability of concrete structures were put in doubt. With this background, the Ministry of Construction, the Ministry of Transport, and the Ministry of Agriculture, Forestry and Fisheries of Japan set up a committee to discuss strategies on the construction and maintenance of public concrete structures. The committee made nationwide surveys to assist the discussion. The overall objectives were as follows: - To summarize the deterioration of concrete structures and to grasp approximate numbers of deteriorated structures - To research the effects of standards used to maintain the durability of concrete structures - To identify urgent issues to improve the durability of concrete structures The structure of the survey is shown in Table 1. The surveys were carried out from September to November 1999. This chapter reports the results of the surveys on road and river structures by the Ministry of Land, Infrastructure and Transportation (MLIT). ON-SHEET SURVEY Method Sample structures were selected at random with regard to type of structure, age and geographical distribution (Table 2). Data of these structures (age, design strength of concrete, etc.) and their circumstances (distance from coastline, annual usage of de-icing salts, etc.) were reported; and a visual inspection was conducted. Where the surface of the concrete showed any disorder, drawings and photos were taken. From these documents, we classified the structural condition of the samples into five degrees, mainly based on the condition of the structure itself. For tunnels we used other assessment criteria, because tunnel lining contains little reinforcement and flaking off of concrete could injure a third party (Table 3). We also estimated the causes of deterioration for samples that were not ranked as the first degree, and classified the causes into five types (Table 4). Results and discussion Degrees of deterioration are shown in Fig. 1. Some 5.9% of structures were ranked as third or worse degrees. Five samples (two superstructures, one substructure and two tunnels) were ranked as the worst degree, requiring immediate treatment. In general, the percentage of deteriorated concrete structures is closely related with age: there are more deteriorated structures among the older ones, and there is no evidence for a particularly inferior decade. On the other hand, not all structures deteriorate with time; 54.8% of samples remained in perfect condition for more than 35 years. Causes of deterioration are shown in Fig. 2. “Low-quality concrete” and “shortage of cover concrete” were common. “Low-quality concrete” can be divided into two groups: one (honeycomb, cold joint, etc.) is mainly due to inadequate concreting; the other (efflorescence, etc.) can not be separated into the effects of construction, materials and circumstances, though the former was relatively common. The survey showed that the major cause of deterioration was construction, and hence it is especially important to ensure adequate construction

processes (such as the placement and curing of concrete, and arrangement of reinforcements). Regarding the heavily damaged structures, “alkali-aggregate reaction”, “chloride attack” and “frost damage”, which mainly depend on materials and circumstances, were frequently cited (Table 4). Especially, “chloride attack” was mentioned as a factor in the deterioration of two bridge superstructures and one substructure of the worst degree. Therefore, effective repair methods to combat these factors need to be developed continuously. No structure deterioration was caused by alkali-aggregate reaction (ASR) after 1986, when the ASR mitigating standard came into effect. This standard consists of the following four countermeasures: - avoidance of reactive aggregate - use low-alkali cement - use fly-ash cement or blast-furnace slag cement - limitation on alkali content in concrete CORE SAMPLING SURVEY Method About 150 samples were surveyed in detail to evaluate their quality and deterioration of concrete (Table 5). In this survey, carbonated thickness, chloride content, and compressive strength were measured by using core test specimens (cylinder with a diameter of 100 mm and a height of 200 mm). Bridge superstructures and tunnels were not surveyed because of the difficulty of taking core samples. Carbonated thickness Carbonated thickness was measured at three coring sites for each structure. The relationship of carbonated thickness and age of each sample is shown in Fig. 3. The curves in this figure indicate the thickness calculated by Kishitani’s experimental formula (Equation 1). In 84% of samples, the experimental carbonated thickness was less than the calculated one for W/C=60% concrete. Usually, reinforcement is covered by concrete 30 mm deep or more; so few structures should deteriorate owing to carbonation unless the arrangement of reinforcement is poor. Generally, it is assumed that carbonation progresses in proportion to the square root of time. In this paper, the term “carbonation rate” as defined by Equation 2 is used to refer to the speed of carbonation. Fig. 4 shows the relationship of carbonation rate and compressive strength, indicating that the compressive strength of concrete is related to the maximum speed of carbonation. Chloride content Chloride content was measured by the method of JCI-SC4. Twenty-mm thick slices were cut from cores for chemical analysis, and a typical result was the total chloride content by weight percent of concrete. At 50-mm depth from the surface, the amount of chloride ion exceeded 0.05% of concrete in 27 samples (18% of all samples of the core sampling survey), and exceeded 0.10% in 14 samples. However, reinforcements were not severely corroded in these samples, because most of them had more than 50 mm of cover concrete or no reinforcement. Based on the change of chloride content at each depth, distance from coastline and annual usage of de-icing salts, we traced the origin of chloride ion of concrete for these 26 samples. The results are shown in Table 6. In 12 cases, “airborne salts” was the main factor, and in 13 other cases, the fresh concrete contained a large chloride ion concentration. The effects of de-icing salts were not clarified by this survey. The results for the latter 13 were classified as follows: 1960 - 69 ・・・ 3 1970 - 79 ・・・ 7
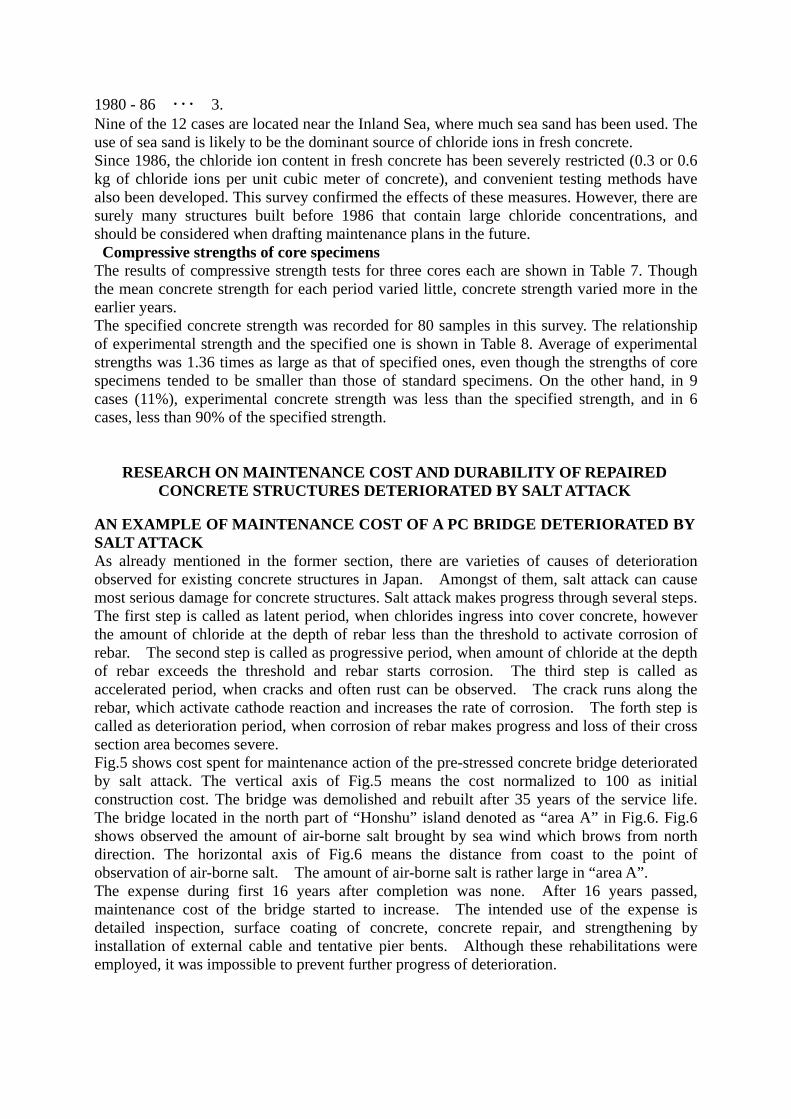
1980 - 86 ・・・ 3. Nine of the 12 cases are located near the Inland Sea, where much sea sand has been used. The use of sea sand is likely to be the dominant source of chloride ions in fresh concrete. Since 1986, the chloride ion content in fresh concrete has been severely restricted (0.3 or 0.6 kg of chloride ions per unit cubic meter of concrete), and convenient testing methods have also been developed. This survey confirmed the effects of these measures. However, there are surely many structures built before 1986 that contain large chloride concentrations, and should be considered when drafting maintenance plans in the future. Compressive strengths of core specimens The results of compressive strength tests for three cores each are shown in Table 7. Though the mean concrete strength for each period varied little, concrete strength varied more in the earlier years. The specified concrete strength was recorded for 80 samples in this survey. The relationship of experimental strength and the specified one is shown in Table 8. Average of experimental strengths was 1.36 times as large as that of specified ones, even though the strengths of core specimens tended to be smaller than those of standard specimens. On the other hand, in 9 cases (11%), experimental concrete strength was less than the specified strength, and in 6 cases, less than 90% of the specified strength.
RESEARCH ON MAINTENANCE COST AND DURABILITY OF REPAIRED CONCRETE STRUCTURES DETERIORATED BY SALT ATTACK
AN EXAMPLE OF MAINTENANCE COST OF A PC BRIDGE DETERIORATED BY SALT ATTACK As already mentioned in the former section, there are varieties of causes of deterioration observed for existing concrete structures in Japan. Amongst of them, salt attack can cause most serious damage for concrete structures. Salt attack makes progress through several steps. The first step is called as latent period, when chlorides ingress into cover concrete, however the amount of chloride at the depth of rebar less than the threshold to activate corrosion of rebar. The second step is called as progressive period, when amount of chloride at the depth of rebar exceeds the threshold and rebar starts corrosion. The third step is called as accelerated period, when cracks and often rust can be observed. The crack runs along the rebar, which activate cathode reaction and increases the rate of corrosion. The forth step is called as deterioration period, when corrosion of rebar makes progress and loss of their cross section area becomes severe. Fig.5 shows cost spent for maintenance action of the pre-stressed concrete bridge deteriorated by salt attack. The vertical axis of Fig.5 means the cost normalized to 100 as initial construction cost. The bridge was demolished and rebuilt after 35 years of the service life. The bridge located in the north part of “Honshu” island denoted as “area A” in Fig.6. Fig.6 shows observed the amount of air-borne salt brought by sea wind which brows from north direction. The horizontal axis of Fig.6 means the distance from coast to the point of observation of air-borne salt. The amount of air-borne salt is rather large in “area A”. The expense during first 16 years after completion was none. After 16 years passed, maintenance cost of the bridge started to increase. The intended use of the expense is detailed inspection, surface coating of concrete, concrete repair, and strengthening by installation of external cable and tentative pier bents. Although these rehabilitations were employed, it was impossible to prevent further progress of deterioration.

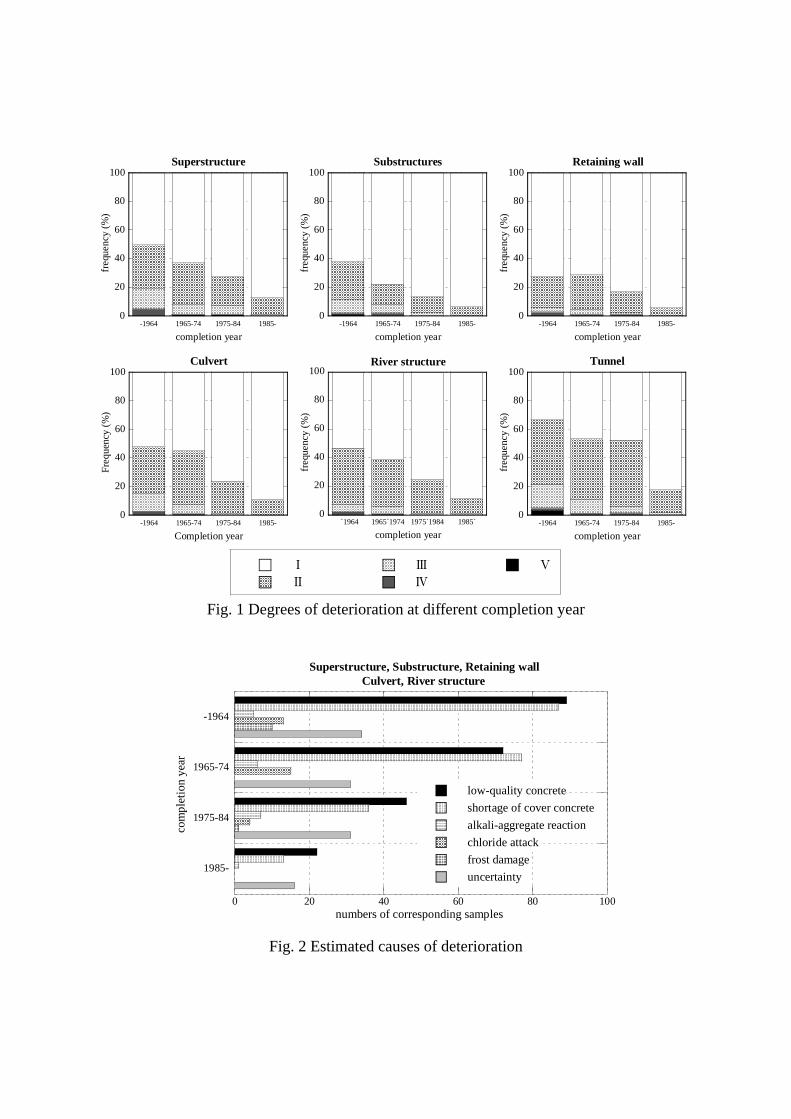
SURVEY ON DURABILITY PERFORMANCE OF REPAIRED CONCRETE STRUCTURES Outline of the survey As mentioned above, it can occur that intended durability is not achieved by repair. Effectiveness of repair is still not fully understood. There are many reasons why repair did not bring satisfactory results in their durability. As for the case of the example of the PC bridge, one of the reasons is losing the chance to repair. The repair work was employed after defects such as rust of rebar was observed by visual inspection of the bridge. We carried out questionnaire survey for the repaired concrete structures to understand the chance of repair is crucial for the performance of repair. The questionnaire is sent to the local branch offices of MLIT. The number of sample of the structures answered by the local office was 40. Fig.7 shows the distribution of cause of deterioration of the structures. Structures deteriorated by salt attack were most frequently answered in this survey. Relationship between window of repair operation and performance of the structure after repair Fig.8 shows the distribution of the answered repair methods employed for the structures. Surface coating and cut off repair were frequently answered. Electro-chemical repair such as cathodic protection was not answered in this survey. In the questionnaire, condition of the structure at the time just before repair operation was also inquired. The answer was expressed as the soundness index, which was estimated by visual inspection according to the criteria summarized in Table.9. The less number of soundness index means the worse condition of the structures. Fig.9 shows the distribution of the year of first repair operation after completion of the structures. The majority of the structures in the questionnaire carried out repair operation within 10 to 20 years after completion. A few structures were repaired within 10 years, which are supposed due to poor workmanship. Fig.10 shows the result of visual inspection of the structures after repair operation. The visual inspection was carried out from 5 to 10 years after repair work completed. In case of the structures located more than 100m from coast line, 85% of them were reported as sound condition, which means repair works were effective, however, in case of the structures located less than 100m from coast line, 58% of the repaired structures showed some signs of re-deterioration, which means repair work was not effective. Durability performance of repaired concrete structures varies with environmental condition for salt attack. Fig.11 shows the relationship between the ratio of re-deterioration after repair and the soundness index just before repair. According to Fig.11, it can be concluded that the structures which were repaired when their soundness index were 4, showed good durability performance after repair. Whereas the structures which were repaired when their soundness index less than 3 showed bad durability performance after repair. In case of the structures which located less than 100m from coast line, the structures which were repaired when their soundness index was 3, still showed high rate of re-deterioration. Summary of the research Corrective rehabilitation sometimes can increase maintenance cost for concrete structures deteriorated by salt attack. When defects are observed by visual inspection, this means chloride contents in concrete at the depth of rebar exceeds the threshold value beyond which corrosion reaction is activated and concrete structures can be in accelerated period. Conventional repair method such as surface coating or cut off repair is not necessarily effective for prevention of further progress of deterioration. For the cost-effective maintenance of concrete structures to salt attack, there seems to be two alternative. One is to develop preventative maintenance scheme, the other is to develop effective repair method such as electro-chemical rehabilitation, for example, cathodic

protection or desalination. For the delivery of preventative maintenance, it is crucial to improve structural diagnosis techniques with non-destructive test to detect latent deterioration which is difficult to identify by visual inspection. The following section, an example of the diagnosis of concrete structures deteriorated by salt attack is introduced.
AN EXAMPLE OF DIAGNOSIS OF CONCRETE STRUCTURE DETERIORATED BY SALT ATTACK
OUTLINE OF THE STRUCTURES INVESTIGATED The concrete structures diagnosed are RC flame piers of the viaduct which was constructed about 30 years ago. The structure locates within 100m from the coast line. We picked up 4 piers of the piers named as P-1 to P-4. Dimensions of the piers are shown in Fig.12. Photo1 shows appearance of the surface of concrete of the piers investigated in the diagnosis. It seems difficult to judge soundness of the piers by the visual inspection. TEST RESULTS AND DISCUSSIONS Fig.13 to Fig.15 shows test results of the piers. According to the rebound number, strength of concrete was fair. The carbonation depth was different among the piers. The results of rebound hammer and carbonation depth, quality of concrete of P-2 seemed worst of all the piers investigated. Fig.15 shows the distribution of half-cell potential. The result of half-cell potential measurement indicates that corrosion risk was highest for P-2, which was consistent with other test results of rebound number and carbonation depth. Photo2 shows condition of rebar corrosion of P-2 pier visualized by removal of cover concrete. We can confirm soundness of the piers can be estimated with non destructive tests.
FUTURE RESERCH WORK FOR DIAGNOSIS OF REBAR CORROSION OF CONCRETE STRUCTURES
The example of diagnosis of the piers gave reasonable results. However non destructive tests do not necessarily give reasonable results, especially half-cell potential measurement has not obtained reliability for estimate possibility of rebar corrosion. For examples, half-cell potential measured on the surface of concrete is affected by moisture content of cover concrete. Pre-wetting condition is provided in JSCE standard testing methods as 30 minutes wetting operation, however there is not defined to measure water content of surface concrete. For the estimation of rebar corrosion risk, ASTM C876 is often referred. If we apply half-cell potential measurement for real concrete structures, half-cell potential of rebar in cathode area can shift less noble potential because of polarization by formation of macro cell. When corrosion risk is estimated according to ASTM C876, i.e., 95% of corrosion risk for the area where half-cell potential is less noble than -350mV.vs.CSE, it is necessary to take into account potential shift by the polarization. Half-cell potential measurement is easy to apply for in-situ test, however it gives information of only corrosion risk, and it does not give any information on corrosion rate, which is helpful information to predict service life of the structures. The measurement of polarization resistance can give the corrosion rate of rebar. AC impedance method has been recently tried to measure polarization resistance, however there are still unsolved problem such as selection of frequency and Tafel coefficient of K to convert polarization resistance to corrosion current. It is desired to improve reliability of polarization resistance measurement. LPR method can be one of the solutions.
CONCLUDING REMARKS In this paper, we have introduced research result of performance of existing concrete structures. Current state of life cycle cost and durability performance of concrete structures deteriorated by salt-attack was described as well. According to the research results, implementation of preventative maintenance with diagnosis using non-destructive tests is identified as one of the cost-effective alternative for concrete structures deteriorated by salt attack. There are other research projects conducted in PWRI, such as structural performance evaluation deteriorated by ASR or improvement of durability performance of conventional cut-off concrete repair. We would like to introduce results of the research projects in another opportunity.
REFERENCES Hirotaka Kawano, Hiroshi Watanabe and Hirohisa Koga, “Nationwide Survey of Soundness of Concrete Structures”, Second International Conference on Engineering Materials,pp.93-100, 2001. Ministry of Construction and Public Works Research Institute, “Research on Life Cycle Cost of Concrete Bridges”, Technical Memorandum No.3811,PWRI, 232pp., 2001.(in Japanese) Public Works Research Institute and Nippon Structure Inspection Association, Joint Research Report106, “Joint Research Report on Development for Diagnosis of Existing Concrete Structures”.168pp.,1996. Public Works Research Institute and Prestressed Concrete Construction Association, Joint Research Report258, “Joint Research Report on Development on Minimun Maintenance PC Bridges”, 35pp., 2000.
Table 1 Schemes of surveys
Objective ItemsNumbers of samples
on-sheetsurvey
To outline deterioration ofconcrete structures, especiallyfrom the viewpoint of their agesand causes of deterioration.
completion year,exposed environment,visible disorder of concretesurface, etc.
2099
core samplingsurvey
To grasp deterioration rate ofconcrete itself in real structures.
carbonation,compressive strength,chloride ion content.
152
Table 2 Numbers of samples (on-sheet survey)
-1964 1965-74 1975-84 1985-bridge superstructure 101 89 95 86 371bridge substructure 98 99 97 96 390retaining wall 73 91 95 89 348culvert* 73 96 101 100 370river structure** 79 98 92 95 364tunnel 60 71 63 62 256
Total 484 544 543 528 2099
* In this paper, the term "culvert" means road-use culvert.** River structure contains water gate and river-use culvert.
Completion yearStructure type Total

Table 3 Classification of deteriorating degree
superstructure, substructure, retaining wall, culvert, river structureClass Conditions
Ⅴ Deteriorated fatally; need remedy, i.e. obvious declined of structural performance
Ⅳ
Deteriorated remarkably; need to consider requirement of remedy, i.e. structuralperformance possibly declined, or would decline severely if no remedial measures arecarried out.
ⅢDeteriorated a little; need to monitor, i.e. structure is safe now, but would not be in thefuture.
ⅡMay deteriorate in future, i.e. some disorder (noticeable cracks, surface staining caused bycorrosion, etc.) are shown, but not important.
Ⅰ Sound, no disorder are shown.
tunnelClass ConditionsⅤ Obviously in danger of flaking off and need to remedy.
ⅣIn many places, there are possibility of flaking off, i.e. dull sound is made by hammerhitting.
ⅢIn some places, there are possibility of flaking off, i.e. dull sound is made by hammerhitting.
Ⅱ In some places there are noticeable cracks and/or cold joints that may lead to flaking off.
Ⅰ Sound, no disorder are shown.
Table 4 Causes of deterioration and their circumstantial evidence
Ⅴ Ⅳ Ⅲ Ⅱ Ⅴ Ⅳ Ⅲ Ⅱ
low-qualityconcrete
・ noticeable honeycomb, cold joint andsegregation of coarse aggregate・ noticeable surface staining caused byefflorescence・ excessive erosive-wear・ noticeable cracks 2 9 51 250 1 2 17 53
shortage ofcover concrete
・ appearance of reinforcements on thesurface of concrete・ noticeable surface staining caused bycorrosion (but chloride can not bebrought from outside) 2 11 46 194 0 0 1 3
alkali-aggregatereaction
・ characteristic cracking pattern of alkali-aggregate reaction 0 5 6 11 0 0 1 2
chloride attack
・ rusty reinforcements・ circumstance where chloride can bebrought from outside (as airborne salts ordeicing salts) 3 3 10 17 0 0 0 0
frost damage・ scaling of concrete・ circumstance where freezing andthawing action would occur 0 1 10 13 0 0 1 1
uncertainty ・ difficult to estimate 0 2 8 103 1 1 5 45
* One or a few causes can be selected for one sample.
Except tunnel TunnelNumbers of corresponding samples
Cause ofdeterioration* Circumstantial evidence
0
20
40
60
80
100
-1964 1965-74 1975-84 1985-
Superstructure
freq
uenc
y (%
)
completion year
0
20
40
60
80
100
-1964 1965-74 1975-84 1985-
Substructures
freq
uenc
y (%
)
completion year
0
20
40
60
80
100
-1964 1965-74 1975-84 1985-
Retaining wall
freq
uenc
y (%
)
completion year
0
20
40
60
80
100
-1964 1965-74 1975-84 1985-
Culvert
Freq
uenc
y (%
)
Completion year
0
20
40
60
80
100
�̀1964 1965�̀1974 1975�̀1984 1985�̀
River structure
freq
uenc
y (%
)
completion year
0
20
40
60
80
100
-1964 1965-74 1975-84 1985-
Tunnel
freq
uenc
y (%
)
completion year
Ⅰ
Ⅱ
Ⅲ
Ⅳ
Ⅴ
Fig. 1 Degrees of deterioration at different completion year
0 20 40 60 80 100
-1964
1965-74
1975-84
1985-
Superstructure, Substructure, Retaining wallCulvert, River structure
low-quality concreteshortage of cover concretealkali-aggregate reactionchloride attackfrost damageuncertainty
numbers of corresponding samples
com
plet
ion
year
Fig. 2 Estimated causes of deterioration

Table 5 Numbers of samples (core sampling survey) (At different structure type)
-1964 1965-74 1975-84 1985-bridge substructure 15 13 11 11 50retaining wall 5 6 7 6 24culvert 14 12 13 9 48river structure 7 8 7 8 30Total 41 39 38 34 152
(At different degrees of deterioration)
-1964 1965-74 1975-84 1985-Ⅴ 0 0 0 0 0Ⅳ 2 1 0 0 3Ⅲ 6 3 2 0 11Ⅱ 12 13 10 9 44Ⅰ 21 22 26 25 94Total 41 39 38 34 152
Degrees ofdeterioration
Completion year Total
Structure type Completion year Total
0
10
20
30
40
50
60
0 10 20 30 40 50 60 70 80
W/C 50%W/C 60%W/C 70%
carb
onat
ed th
ickn
ess
(mm
)
age (year) Fig.3 Carbonated thickness and age of structure

0
1
2
3
4
5
6
7
8
0 10 20 30 40 50 60 70
carb
onat
ion
ratio
(m
m/
yea
r)
compressive strength (MPa)
√
Fig. 4 Relationship of carbonation ratio and compressive strength
Where t : time that spend to carbonate at C mm depth (year) x : water-cement ratio derived from compressive strength C : carbonated depth (mm) R : parameter (cement, etc.) * In this paper, we use specified water-cement ratio for x, and 1.0 for R.
Where A : carbonation ratio C : carbonated depth (mm) t : age of structure (year)
Table 6 Origin of chloride in concrete structures
Numbers ofcorresponding samples
material Chloride ion conctent might have exceeded thelimit from the time of fresh concrete becausechloride ion contents are constant at different depthof one core sample. 13
airborn salts Airborn salts from the sea might penetrate intoconcrete beacause there are more chloride ion nearthe surface. 12
uncertainty Difficult to estimate. 2

Table 7 Compressive strengths of core specimens
-1964 1965-74 1975-84 1985-
10≦ <15 3 2 1 0 615≦ <20 8 5 5 6 2420≦ <25 8 11 10 11 4025≦ <30 6 5 15 10 3630≦ <35 3 13 5 3 2435≦ <40 5 2 0 4 1140≦ <45 5 0 2 0 745≦ <50 3 1 0 0 4
Total 41 39 38 34 152
*mean of three core samples
Compressivestrength*
(MPa)
Completion yearTotal
Table 8 Core strengths and specified strengths
-1964 1965-74 1975-84 1985- <0.9 2 1 2 1 6
0.9≦ <1.0 0 0 1 2 31.0≦ 17 15 20 19 71
unknown 22 23 15 12 72Total 41 39 38 34 152
*strength ratio: compressive strength of core samples divided by specified strength
Strengthratio*
Completion year Total
Fig.5 Maintenance cost for a deteriorated concrete bridge
A Bridge
0
100
200
300
0 10 20 30 40
Age (year)
Sum
of c
ost

Fig.6 Observed amount of air-borne salt in Japan
Fig.7 Causes of deterioration of existing concrete in the questionnaire survey
distance from coastline(km)
amou
nt o
f sup
plie
d N
aCl(m
g/dm
2 /day
)
amou
nt o
f sup
plie
d N
aCl(m
g/dm
2 /day
)am
ount
of s
uppl
ied
NaC
l(mg/
dm2 /d
ay)
distance from coastline(km)
Okinawa Islands
area b.
b.
c.
a.
distance from coastline(km)
area c.
area a.average97% confidence limit
0 5 10 15 20 25 30
Salt
Freeze & Thaw
ASR
Settlement
Lack of covor
Others
Number of structures investigated
Fig.8 Repair method employed for concrete structures
Fig.9 Year of the first repair operation
Fig.10 Performance of concrete structures after repair
(Left: Structures located more than 100m from coast line, Right: Structures located less than 100m from coast line)
Deterio
sound
15%
85%
DeterioratedSound58%
42%
0 5 10 15 20
Pre-packed
Patching
FRP
Steel bond
Paint
Crack Injection
Add concrete
Spray mortar
Recast Concrete
Number
0 5 10 15 20
less than 5
5 - 10
10 - 20
20 - 30
30 - 40
40 -50
number

Fig.11 Re-deterioration ratio after repair
Table.9 Criteria for estimation of the soundness index Index Description of defects appeared in the structure
1 Exposure or failure of rebar by corrosion, or serious loss of cross sectional area of concrete was observed
2 Continuous crack of cover concrete by rebar corrosion, rust, or delamination of cover concrete was observed.
3 Crack, delamination of cover concrete, or rust of rebar observed. The extent is less serious than index=2
4 Crack or rust slightly observed 5 No sign of deterioration observed.
Fig.12 Dimensions of the pier inspected
0%
20%
40%
60%
80%
Poorer the S.I2 S.I. 3 S.I 4
Ratio
of r
e-de
teri
orat
ion
afte
r rep
air
>=100m
<100m
18m
3.7m
1.8m
2.6m
1m
7.5m
4.2m
1.8m
1.5m
P-3
P-1P-2
P-4(Test are is soffit of the beam)

Photo.1 Visual condition of the pier
Fig.13 Measured rebound number Fig.14 Measured carbonation depth
Fig.15 Distribution of half-cell potential
P-1 P-2
P-3 P-4
P-1
P-2
P-3
P-4
0 25 50 75
Rebound Number
P-1
P-2
P-3
P-4
0 5 10 15 20 25
Carbonation Depth(mm)
0%
5%
10%
15%
20%
25%
30%
35%
0 100 200 300 400 500
Potenial(-mV:CSE)
Occure
nce
P-1
P-2
P-3

Photo2 Verification of corrosion of rebar by removing cover concrete