research 337 - deterioration of prestressed concrete bridge beams
TRANSCRIPT
Deterioration of Prestressed Concrete Bridge Beams
S.M. Bruce, P.S. McCarten, S.A. Freitag, L.M. Hasson
Land Transport New Zealand Research Report 337
ISBN 978-0-478-30947-8 ISSN 1177-0600
© 2008, Land Transport New Zealand PO Box 2840, Waterloo Quay, Wellington, New Zealand Telephone 64-4 931 8700; Facsimile 64-4 931 8701 Email: [email protected] Website: www.landtransport.govt.nz Bruce, S.M.¹, McCarten, P.S.², Freitag S.A.¹, Hasson, L.M.¹ 2008. Deterioration of prestressed concrete bridge beams. Land Transport New Zealand Research Report 337. 72 pp. 1 Opus International Consultants Ltd, Central Laboratories 2 Opus International Consultants Ltd, Napier
Keywords: bridge design, bridges, concrete bridges, corrosion, deterioration,
Gisborne, New Zealand, prestressing corrosion, reinforcement corrosion, steel

An important note for the reader Land Transport New Zealand is a Crown entity established under the Land Transport Management Act 2003. The objective of Land Transport New Zealand is to allocate resources and to undertake its functions in a way that contributes to an integrated, safe, responsive and sustainable land transport system. Each year, Land Transport New Zealand invests a portion of its funds on research that contributes to this objective. The research detailed in this report was commissioned by Land Transport New Zealand. While this report is believed to be correct at the time of its preparation, Land Transport New Zealand, and its employees and agents involved in its preparation and publication, cannot accept any liability for its contents or for any consequences arising from its use. People using the contents of the document, whether directly or indirectly, should apply and rely on their own skill and judgement. They should not rely on its contents in isolation from other sources of advice and information. If necessary, they should seek appropriate legal or other expert advice in relation to their own circumstances, and to the use of this report. The material contained in this report is the output of research and should not be construed in any way as policy adopted by Land Transport New Zealand but may be used in the formulation of future policy.
Abbreviations and acronyms
FIB: Federation Internationale du Beton
MoW: Ministry of Works
MWD: Ministry of Works and Development
VPV: Volume of Permeable Voids
W/C: Water to cement ratio
XRF: X-ray Fluorescence
5
Contents
Executive summary ........................................................................................... 7 Abstract............................................................................................................10
1. Introduction ............................................................................................11 1.1 Background .......................................................................................11 1.2 Scope of investigation .........................................................................13
2. Corrosion of prestressing steel – overview ...............................................14 2.1 Background .......................................................................................14 2.2 Metal properties .................................................................................15 2.3 Concrete quality.................................................................................17 2.4 Service conditions ..............................................................................17 2.5 Assessment of prestressed elements .....................................................18
3. Methodology ............................................................................................19 3.1 Review of the Hamanatua Stream Bridge design .....................................19 3.2 Selection of other bridges for investigation.............................................19 3.3 Concrete condition assessments ...........................................................23
3.3.1 Types of inspection ....................................................................23 3.3.2 Nomenclature used in inspections ................................................24 3.3.3 Visual inspection........................................................................24 3.3.4 Volume of permeable voids .........................................................24 3.3.5 Compressive strength.................................................................24 3.3.6 Depth of cover concrete..............................................................25 3.3.7 Chloride ion contamination..........................................................25 3.3.8 Carbonation depth .....................................................................26
3.4 Service conditions...................................................................................26
4. Design and distribution of prestressed I-beam bridges built in the 1960s................27 4.1 Beam design......................................................................................27 4.2 Concrete quality.................................................................................31 4.3 Bridge descriptions .............................................................................32 4.4 Distribution of 1960s prestressed I-beam bridges....................................35
5. Observations and test results...................................................................36 5.1 Bridge condition .................................................................................36 5.2 As-built concrete quality......................................................................39 5.3 Depth of cover concrete ......................................................................42 5.4 Chloride ion contamination and carbonation depth...................................44
5.4.1 Measurements...........................................................................44 5.4.2 Chloride ion contamination..........................................................46 5.4.3 Carbonation depths....................................................................49
6. Discussion ...............................................................................................50 6.1 Cause of prestressing strand corrosion on the Hamanatua Stream Bridge ...50 6.2 Likelihood of prestressing strand corrosion on other bridges of similar design ..............52 6.3 Likelihood of future prestressing and reinforcing steel corrosion ................54
6.3.1 Mathematical predictions ............................................................54 6.3.2 Discussion ................................................................................57 6.3.3 Service life requirements ............................................................58
6.4 Implications for bridges of more recent design........................................59 6.5 Structural implications of prestressing strand corrosion............................61 6.6 Long-term management of pre-1973 prestressed bridges.........................63
7. Conclusions..............................................................................................65
6
8. Recommendations ................................................................................... 67 8.1 Findings from current research ............................................................ 67 8.2 Further work..................................................................................... 67
9. References .............................................................................................. 68 Appendix ......................................................................................................... 71

7
Executive summary
The Hamanatua Stream Bridge was built in 1966 to a standard Ministry of Works and
Development design used in approximately 117 State Highway bridges. A routine
inspection in 2004 revealed that the prestressing steel on at least one of its beams was
corroding. Although the strand has not yet broken, the corrosion has cracked and spalled
the cover concrete.
A feature of this beam design is that the prestressing strand is not fully confined by
stirrups, which means that corrosion of the stirrups does not provide an early warning of
imminent corrosion of the prestressing steel. Because consequences of corrosion in
prestressed components can be severe, this investigation was initiated to identify the
current and future risks associated with prestressing steel failure in bridges, particularly
prestressed concrete beams built in the 1960s and early 1970s. The findings will facilitate
informed, cost-effective decisions regarding the future management of such bridges.
The research was carried out in 2005–2006. It aimed to:
• identify the factors that contributed to the deterioration on the Hamanatua Stream
Bridge;
• assess the current condition and future risk of corrosion of both prestressing and
conventional reinforcement on other bridges of similar age and design in a range of
exposure environments in New Zealand to ascertain whether this type of
deterioration is widespread;
• assess the variability in materials and workmanship for this type of bridge beam;
and
• develop recommendations for the future management of these structures to assist
New Zealand bridge owners and managers to optimise the economic life of the
bridge stock and the remaining life of individual structures.
An implicit aim was to find out whether the corrosion risk has been reduced by current
prestressed concrete beam design standards.
The research involved site assessments of the condition of the Hamanatua Stream Bridge
and of 29 bridges of similar design, representing a range of ages and exposure conditions,
to ascertain the cause and extent of prestressing corrosion. Measured depths of concrete
cover and chloride ion contamination on the beams were used to predict the onset of
corrosion and hence whether the bridges would achieve a 100-year service life without
intervention to keep them in a serviceable condition.
The quality of the concrete materials and workmanship in the Hamanatua Stream Bridge
were found to be generally good. Specified cover depths were one inch (25 mm), much
less than current requirements, but the cover to some of the steel was less than 25 mm.
The bridge is in the B2 ‘coastal frontage’ exposure zone defined by NZS 3101: 2006 and
within 200 m of an open surf beach. The corrosion was caused by the ingress of chloride
ions from sea spray, resulting in chloride ion concentrations at the steel surface exceeding
DETERIORATION OF PRESTRESSED CONCRETE BRIDGE BEAMS
8
the threshold value at which corrosion is initiated. The influence of prestressing steel
composition and different corrosion mechanisms on the observed deterioration could not
be determined.
Despite the risk of chloride-induced corrosion, corrosion of prestressing steel was not
observed on any other bridges of this design, although corrosion of conventional
reinforcement was relatively common. In some cases, this may be because the small
volume of corrosion products has not generated sufficient stress to damage the cover
concrete.
Nevertheless, site and laboratory testing showed that other bridges of the same design in
the B2 exposure zone are likely to be affected by the same deterioration mechanism
because the chloride contamination, quality of concrete and the depth of cover were
similar to those on the Hamanatua Stream Bridge. Corrosion is unlikely in bridges of the
same design in the B1 (‘coastal perimeter’) and A2 (‘inland’) exposure zones because
they are not exposed to external sources of chloride ion contamination.
Analysis of concrete samples from these bridges also showed that the concrete in some of
them contains calcium chloride accelerating admixture, which increases the likelihood of
corrosion irrespective of exposure conditions.
On bridges where corrosion damage is not yet evident, the approximate time to future
corrosion can be predicted by a simple model that uses chloride ion diffusion rates to
predict the onset of corrosion (often referred to as ‘time to corrosion initiation’). The bond
between prestressing steel and concrete may be lost shortly after corrosion begins, so the
time to corrosion initiation is a reasonable approximation of time to corrosion damage.
The model predicted that bridges of the same design as the Hamanatua Stream Bridge
and in the B2 exposure zone are unlikely to achieve a 100-year service life without some
corrosion damage, but that corrosion is unlikely within this period on bridges of the same
design in the B1 and A2 exposure zones. This broadly correlated with observations.
Refinements to the sampling and modelling procedures may allow more precise
predictions.
Bridge beams designed to current specifications (NZS 3101: 2006 and Transit
New Zealand’s Bridge Manual) have much greater cover depths. The corrosion initiation
model indicated that beams made with similar concrete quality as the Hamanatua Stream
Bridge but with cover depths in accordance with current specifications will probably
achieve a 100-year service life without corrosion damage. Beams with similar concrete
properties and cover depths to the Hamanatua Stream Bridge do not comply with current
specifications and are just as likely to be affected by corrosion.
For a given corrosion rate, corrosion of the prestressing strand reduces the structural
performance of a beam faster than corrosion of conventional reinforcing because a
greater proportion of the steel cross-section is lost. The Hamanatua Stream Bridge beam
on which corrosion was observed may have lost up to 10% of its live load capacity,
9
reducing the overall live load superstructure capacity by up to 5%. The corrosion
mechanisms and eventual strand failure mode on the Hamanatua Stream Bridge could not
be determined because the strand could not be sampled safely for investigation.
Therefore the possible influences of hydrogen embrittlement, stress corrosion cracking,
fretting corrosion and fatigue corrosion on the eventual strand failure mode on the
Hamanatua Stream Bridge remain unknown.
The risk associated with prestressing steel corrosion in these bridges is greater than the
risk of reinforcement corrosion in bridges of similar age. Some intervention will be
necessary to ensure that bridges of this particular design in the B2 exposure zone remain
serviceable for a 100-year service life. This may involve either preventive maintenance or
repair to the concrete once the steel has started to corrode.
To enable Transit New Zealand and LTNZ to cost-effectively and proactively manage the
risk in pre-1973 prestressed concrete bridges and in more recent designs, further work is
recommended to identify the bridges at risk and to identify appropriate methods of
managing prestressing corrosion in them. Further research topics were identified to refine
methods of predicting corrosion initiation and to optimise mitigation strategies.
DETERIORATION OF PRESTRESSED CONCRETE BRIDGE BEAMS
10
Abstract A routine inspection revealed significant corrosion of the prestressing strand
on a concrete road bridge built in 1966 to a standard design used in about
117 State Highway bridges in New Zealand. To identify the cause of the
deterioration and how many bridges of this design might be affected, the
conditions of 29 similar bridges on New Zealand State Highways were
evaluated by site investigation. The research, carried out in 2005–2006,
found that although the concrete quality in the bridge beams was generally
good, the combination of cover depths less than 25 mm and exposure to salt
spray had increased the likelihood of corrosion in bridges of this design in the
B2 (coastal frontage) exposure zone. Bridges in the B1 (coastal perimeter)
and A2 (inland) zones are less likely to be affected, although the concrete in
some of the beams contained chlorides added during construction. The risk
associated with prestressing corrosion in this beam design is higher than in
current designs because the prestressing strand is poorly confined and the
cover depth is low. Bridges of this design in the B2 zone will probably need
some form of intervention to remain serviceable for a 100-year service life.
1. Introduction
11
1. Introduction
1.1 Background
The Hamanatua Stream Bridge was built in 1966 on State Highway 35 near Gisborne on
the East Coast of the North Island in New Zealand. It is a prestressed (pretensioned)
structure1. In 2004, a routine detailed inspection of the Hamanatua Stream Bridge
identified significant deterioration of one of the prestressed concrete beams whereby
corrosion of the outer prestressing strand on the bottom flange of the beam had spalled
the cover concrete along much of the length of the strand. Further investigation by the
regional bridge consultant found a lesser degree of spalling on two other beams. These
apparent failures were not reported in the previous inspection in 2002. Such a failure has
significant implications to the load-carrying capacity and long-term durability of this
structure.
A feature of the beam design was that the prestressing strand was relatively poorly
confined (by today’s standards), the secondary reinforcement only partly enclosing it. This
deficiency is believed to have contributed to the damage. Lack of enclosing stirrups
(which, if present, would normally corrode and crack the concrete before the prestressing
steel corroded) also prevented early warning of potential corrosion of the strand. The
Hamanatua Stream Bridge is close to the coast and it is likely that the corrosion risk was
further increased by atmospheric chloride contamination of the concrete.
Damage like this poses an immediate risk to structural capacity. As well as the obvious
aspects of safety and collateral property damage, it has short-, medium- and long-term
cost implications:
• the need for immediate preventive action where possible;
• the need for repair and strengthening when damage occurs; and
• the possible reduction in capacity and durability may reduce service life, particularly
with anticipated future increases in heavy vehicle loads.
The prestressing steel corrosion on the Hamanatua Stream Bridge was one of the first
such cases recorded on a prestressed concrete bridge in New Zealand under normal
service conditions. It raised the concern that other prestressed concrete bridges of the
same design on the New Zealand roading network may face a similar risk.
The H20-S16-T16 standard design loading (Stirrat & Huizing 1961) used in the
Hamanatua Stream Bridge was widely used in the 1960s and early 1970s. A search of
Transit New Zealand’s Bridge Descriptive Inventory2 prior to this investigation indicated
1 In this report ‘prestressed’ is synonymous with ‘pretensioned’. Post-tensioned prestressed structures were not considered in the investigation.
2 The Bridge Descriptive Inventory, also known as the Bridge Data System, is a computer database administered by Transit New Zealand. People wanting to access this database should contact Transit New Zealand’s National Office.

DETERIORATION OF PRESTRESSED CONCRETE BRIDGE BEAMS
12
approximately 92 similar prestressed concrete bridges of this design loading on the State
Highway network throughout New Zealand. They comprise about 2.5% of the
approximately 3800 bridges on the State Highway network. The number of bridges of this
type on the Local Authority roading network is unknown.
Repair and strengthening costs on the Hamanatua Stream Bridge are estimated to be in
the order of $400,000. If it is assumed that a third of the other 92 bridges of this type on
the State Highway network are in similar condition or at risk of similar deterioration then
future potential repair costs are likely to be in the order of ten to fifteen million dollars.
The potential repair cost for Local Authority bridges is unknown. Thus the potential short-,
medium- and long-term costs associated with this type of deterioration in New Zealand
could be rather large, particularly if the risks to life and property as a result of a sudden
failure are included. Proactive management of the deterioration may reduce the life cycle
cost of these bridges, for example by applying preventive treatments before damage is
evident, or by determining the most cost-effective state of deterioration at which to repair
the structure.
The key objective of this research was to determine the current and future risk of
prestressing steel failure in bridges, in particular prestressed concrete beams constructed
in the 1960s and early 1970s. The findings will enable Transit New Zealand and Local
Authority bridge practitioners to understand the variability in concrete materials and
workmanship better, and make informed and cost-effective decisions regarding the
management of these structures, including improving or maintaining their load-carrying
capacity. As part of its overall asset management process, Transit New Zealand is
developing a bridge replacement programme that will involve identifying all risks
associated with its bridges, including environment, vehicle loads, standard designs and
condition. The findings of the research relate directly to this programme.
Significant failures of prestressed concrete structures have been reported from Germany
(Federation Internationale du Beton (FIB) 2003). These were related to a combination of
problems including prestressing steel properties, the use of high alumina cement,
concrete admixtures containing chlorides or thiocyanates, and poor design and
construction practices. Durability problems affecting prestressed concrete bridges have
also been encountered in the US, Europe and the United Kingdom. These were primarily
caused by de-icing salts initiating corrosion of the prestressing steel and are not directly
relevant to this investigation apart from the corrosion mechanism.
1. Introduction
13
1.2 Scope of investigation
The research, carried out in 2005–2006, aimed to:
• identify the factors that contributed to the deterioration on the Hamanatua Stream
Bridge;
• assess the current condition and future risk of corrosion in both prestressing and
conventional reinforcement on other bridges of similar age and design, in a range of
exposure environments in New Zealand, to ascertain whether this type of
deterioration is widespread;
• assess the variability in materials and workmanship for this type of bridge beam; and
• develop recommendations for the future management of these structures to assist
New Zealand bridge owners and managers to optimise the economic life of the
bridge stock and the remaining life of individual structures.
An implicit aim was to find out whether the corrosion risk has been reduced by current
prestressed concrete beam designs.
The research involved:
• examining the design of the Hamanatua Stream Bridge;
• searching the Transit Bridge Descriptive Inventory to identify other bridges of
similar design on the State Highway network;
• searching for information on international experience with corrosion of prestressing
steel and associated failures;
• assessing the condition of the Hamanatua Stream Bridge, including assessing the
condition of remaining prestressing strands and measuring concrete contamination
levels which may have contributed to corrosion of the steel;
• assessing, in a similar way, the condition of a range of bridges of similar
construction type throughout the New Zealand State Highway network that were
selected to represent a range of reported conditions and environmental exposure;
• evaluating the feasibility of a simple model for predicting the onset of prestressing
corrosion, which could be used by bridge practitioners to optimise maintenance and
intervention strategies for these bridges; and
• assessing whether the inherent risks associated with the beam designs and
materials used in the 1960s and early 1970s have been addressed by current
designs and materials, or whether some of the shortcomings identified in these
earlier bridges remain.
The original research proposal was based on reports of failure of prestressing wire on the
bridge beams. The investigation revealed that prestressing strands, not wire, had
corroded, and that the strand had corroded but not actually broken. This limited the scope
of the investigation as described in Chapter 3.
Preliminary findings were presented at the 2006 AUSTROADS Bridge Conference (Bruce &
McCarten 2006). This report includes the complete findings, plus recommendations for
further work that is necessary to develop a strategy for the management of these bridges,
including preventive maintenance, repair and strengthening.
DETERIORATION OF PRESTRESSED CONCRETE BRIDGE BEAMS
14
2. Corrosion of prestressing steel – overview
2.1 Background
Corrosion of prestressing steel is relatively rare. Because the cross-section of each
prestressing wire or strand is small and the steel is already under significant stress, a
much smaller cross-section loss from strand or wire (compared to reinforcing bar) will
cause the strand to debond from the concrete and eventually break. In addition, it may
corrode without producing outward evidence such as rust staining, cracking or spalling
because the tensile stresses that the small cross-section of steel generates in the cover
concrete are small. Consequently, the strand or wire may debond or break without
warning. If it breaks, it may burst from the concrete where the cover concrete cannot
withstand the prestressing forces released by the failure. Once one wire (or strand)
breaks, its load is redistributed to others that may not have the residual capacity to
sustain the extra load, so the risk to the element increases very quickly.
Management of reinforcement corrosion is usually based on a need to maintain the
appearance of the structure, prevent damage or injury caused by spalling concrete, or
delay the rate of corrosion, i.e. to maintain serviceability. In contrast, management of
prestressing corrosion is directly related to maintaining structural integrity because even
a small amount of corrosion may affect the bond and thereby the structural performance.
ACI 222.2R-01 (American Concrete Institute 2005) presents a detailed review of the
corrosion of prestressing steels. This chapter summarises the salient points.
Three factors contribute to the corrosion of prestressing wire or strand:
• metal properties (these have the least influence on corrosion resistance),
• the quality of the concrete that surrounds the wire or strand (this has significant
influence on corrosion resistance),
• service conditions (these have the greatest influence on corrosion resistance).
These factors are described in Chapters 2.2–2.4.
2. Corrosion of prestressing steel - overview
15
2.2 Metal properties
The properties of the metal are determined by its chemical composition, thermal
treatments applied to achieve the desired microstructure, and the methods used to draw
the wire/bar and to relieve stress after drawing.
The extra energy input used to produce their higher yield strength means prestressing
steels are generally less corrosion-resistant than the steels used in the reinforcing bar.
Nevertheless, the corrosion resistance of any prestressing steel will be satisfactory
provided that its mechanical properties and composition, and the process by which the
strand or wire is manufactured are optimised. Similarly, any prestressing steel can be
susceptible to corrosion if these properties are not optimised. The effects of metal
composition, structure and mechanical properties on the corrosion resistance of
prestressing steels, including examples of prestressing steel failures, are described by FIB
(2003).
An increase in carbon content or the presence of other elements known as poisons (such
as phosphorus, antimony, tin, sulphides and arsenic), particularly as inclusions at metal
grain boundaries, can increase the amount of hydrogen entrapped in the steel lattice,
increasing the possibility of hydrogen embrittlement (Novokshchenov 1994, FIB 2003).
Hydrogen embrittlement may increase the risk of failure if the wire or strand is exposed
to a corrosive environment. High strength steels are particularly susceptible to hydrogen
embrittlement because of their high carbon content.
Until the 1980s, the rod from which a wire was drawn was pretreated by quenching in a
molten lead bath to produce the desired microstructure. After that date, the
microstructure was formed by cooling the rod in water and then in air immediately after
hot-rolling. This change increased the strength of the steel significantly, but not its
ductility.
Prestressing wires and bars are made by one of four processes:
• hot-rolled, stretched and stress-relieved bars,
• quenched and tempered martensitic wires/bars,
• cold-drawn, stress relieved wires/strands, and
• cold-drawn wires.
Corrosion activity, particularly that related to hydrogen embrittlement, is concentrated at
the most disturbed and weakest part of the metal structure, i.e. the boundaries of the
individual metal grains. The manufacturing process determines the orientation of the
grain boundaries. Steel with grain boundaries perpendicular to the direction of applied
force is more susceptible to premature failure caused by corrosion than steel with grain
boundaries parallel to the direction of applied force. In hot-rolled, and quenched and
tempered steels, the grain boundaries are perpendicular to the applied force so these
types of steel are generally less corrosion-resistant than cold-formed steels, in which the
grain boundaries are parallel to force direction.
DETERIORATION OF PRESTRESSED CONCRETE BRIDGE BEAMS
16
The most commonly specified prestressing steels, including those included in the current
specification for prestressing steel (AS/NZS 4672.1-2007 (Standards Australia 2007)), are
cold-drawn and stress relieved.
Quenched and tempered steels with a martensitic structure are the most susceptible to
hydrogen embritttlement because they contain a relatively large amount of free hydrogen
and their martensitic structure is highly stressed. Their corrosion resistance can be
improved significantly by modifying the steel’s chemistry to both reduce its free hydrogen
content and allow the hardening and tempering process to be optimised to minimise the
martensite content (FIB 2003).
Similarly, stress corrosion is not normally an issue with ferritic steels such as cold-drawn
stress-relieved materials, but martensitic steels such as those produced by quenching and
tempering are susceptible to stress corrosion in the presence of sodium chloride solutions.
Brittle failure of prestressing steel is sometimes referred to as hydrogen-induced stress
corrosion because of the close relationship between hydrogen embrittlement and stress
corrosion cracking.
Hydrogen embrittlement and stress corrosion cracking may promote brittle failure of the
prestressing steel, and can accelerate the damage caused by corrosion alone. Current
specifications for prestressing steel aim to minimise this risk.
To determine whether the nature of the prestressing steel used in a particular bridge has
contributed significantly to an observed failure, three questions need to be answered:
• Was the same steel used in all beams on the bridge? If not, is the poor performance
of one beam related to the wire product used?
• Did the failed steel comply with the design specifications for the bridge (i.e. was the
correct steel used, or was the product or batch of steel substandard)? If not, the
problem may be limited to this bridge or others built with the same product.
• Does the failed steel comply with current specifications for prestressing wire
(AS/NZS 4672.1-2007(Standards Australia 2007)), i.e. from current knowledge,
would we expect it to perform satisfactorily?
To answer these questions, samples need to be taken on site to determine the tensile
strength of the wire or strand, its microstructure, its chemical composition, and whether
the strand failed in a brittle or ductile mode. Unless the strand or wire has completely
broken and is no longer stressed, this cannot be done without significantly reducing the
load-carrying capacity of the structure.
2. Corrosion of prestressing steel - overview
17
2.3 Concrete quality
Steel in concrete is normally protected from corroding by the cement paste’s high
alkalinity and its relatively low permeability to moisture, oxygen and chlorides. Corrosion
will be initiated if the alkalinity of the cover concrete is reduced by carbonation or if it is
contaminated by chlorides.
Sufficient depth and quality of concrete cover is essential to protect the prestressing steel
from the ingress of moisture, oxygen and chlorides. Selection of an appropriate mix
design is important, but cracks and voids will increase the permeability of even the best
concrete mix designs. Significant corrosion damage is more likely when the concrete’s
permeability is increased by inadequate compaction, inappropriate mix design or
insufficient thickness over the steel. Should the prestressing steel fail, deeper cover will
reduce the risk of the cover concrete cracking or spalling, and the risk of the strand or
wire bursting out of the element.
2.4 Service conditions
Although corrosion can be initiated by loss of concrete alkalinity by carbonation, most
cases of prestressing corrosion reported in the literature are related to ingress of moisture
and chlorides caused by poor drainage. This poor drainage results from poor design and
poor maintenance of features such as drains and joints.
Chlorides are a particular problem because they can cause very localised corrosion pitting,
which may reduce the cross-section sufficiently to cause the steel to fail under a normal
working load. Acidification of corrosion pits may lead to hydrogen embrittlement. In
addition, corrosion may be promoted at lower chloride concentrations than for unstressed
steel. Steel may be contaminated with chlorides before being cast into the concrete, e.g.
by storage on site in a marine environment, or it may be contaminated during the service
life of a structure exposed to seawater, sea spray or de-icing salts. Chlorides may also be
introduced into the concrete at the time of construction in the form of accelerating
admixtures based on calcium chloride, which were sometimes used in precast concrete
until the 1980s.
Stray currents from electrical or cathodically protected services may also induce
corrosion. Corrosion induced by stray currents is easily detected by a characteristic
appearance.
Overloading can cause the premature failure of a wire undergoing general corrosion. Pure
overloading is usually characterised by a ductile failure mode, although the relatively
lower ductility of prestressing steels may make a ductile failure difficult to detect.
In addition to hydrogen embrittlement and stress corrosion, corrosion fatigue and fretting
corrosion may occur, particularly in partially prestressed elements (Nurnberger 2002) or
where the bond to the wire/strand has been lost, e.g. by corrosion of the strand surface.
DETERIORATION OF PRESTRESSED CONCRETE BRIDGE BEAMS
18
2.5 Assessment of prestressed elements
Because of the risks involved and because outward signs of corrosion in prestressing steel
are often absent, inspection of prestressed structures may need to be more rigorous than
for reinforced structures. Features that may indicate an increased likelihood of corrosion
on prestressed elements include:
• drainage of runoff over the surface;
• cracking, particularly if not expected from normal loading;
• insufficient depth of concrete cover, particularly on surfaces exposed to runoff or
chloride ingress;
• physical damage that reduces the effective cover depth;
• leaking deck joints or other features of poor surface drainage that provide a source
of moisture for corrosion;
• inadequate concrete consolidation, as evidenced by surface voids;
• reduced alkalinity of concrete cover, particularly on surfaces exposed to runoff; and
• elevated chloride ion content in cover concrete.
Design drawings will identify factors that may affect the corrosion risk. As-built drawings
are particularly useful for identifying details and materials, as are ordering or purchase
records of materials.
Corrosion of steel in concrete is often related to the presence of air voids at the steel
surface, so good quality concrete and good compaction is particularly important. In
addition, honeycombed or highly porous concrete could allow thinner wires to lose a
significant proportion of their cross-section with no external evidence because corrosion
products can be accommodated in the voids without generating the expansion stresses
that would otherwise crack or spall the cover concrete.
Measurement of electrochemical corrosion potential (also known as ‘corrosion potential’)
has been reported to be effective in detecting areas where corrosion is most likely
(Novokshchenov 1997), although it may be difficult to distinguish between the risk to
reinforcement and the risk to prestressing steel. Commonly used assessment criteria may
not apply to wires or strands with a higher cover than reinforcement, so variations in
electrochemical corrosion potential may be more relevant than the absolute values. In a
chloride-contaminated environment, the strand/wire’s performance may be limited by the
risk of localised pitting corrosion, which is not necessarily detected by corrosion potential
measurements. Ali & Maddocks (2003) reviewed non-destructive methods of detecting
corrosion of prestressing in situ and concluded that a combination of techniques is
required to assess the condition of prestressing tendons.
3. Methodology
19
3. Methodology
This project sought to find out what had caused the corrosion of the prestressing strand
on the Hamanatua Stream Bridge, and whether the same risks were present on the other
elements and on bridges of similar design. The intended methodology was to consider
whether the following features on the affected beam were common to the other elements
and to similar bridges:
• features of the corroded prestressing strand as described in Chapter 2.2: whether
they meet the requirements of the original design and of current practice;
• features of the concrete as described in Chapter 2.3: whether they meet the
requirements of the original design and of current practice; and/or
• features of environmental exposure and loading conditions as described in
Chapter 2.4.
The site investigation revealed that the corroded prestressing strand had not yet broken,
so no information about failure modes could be gleaned. In addition, it was too dangerous
to sample the unbroken strand to determine its composition. Consequently, the
composition and likely failure mode of the prestressing strand could not be considered in
this investigation, which then focused instead on determining critical features of the
concrete and the service environment.
3.1 Review of the Hamanatua Stream Bridge design
The design of the Hamanatua Stream Bridge was analysed to determine whether it met
current requirements of Transit New Zealand’s Bridge Manual (TNZ 2003). Deficiencies
and their significance were identified.
3.2 Selection of other bridges for investigation
The design of the Hamanatua Stream Bridge having been identified, the Bridge
Descriptive Inventory was searched to identify other prestressed I-beam bridges of
similar age and to ascertain their distribution. The search criterion used was ‘pre-1973
precast pretensioned I-beam bridges’. The search revealed 117 bridges meeting this
criterion.
Twenty-nine bridges, or 25% of the 117 bridges of interest, were selected for
assessment. These structures were selected on the following basis:
• For convenience, all were in the central North Island, and in general proximity to
the Hamanatua Stream Bridge.
• They were from several different regions to ensure that beams from a range of
precast concrete yards were sampled.
• They represented a range of exposure classifications as defined by NZS 3101:
2006. The sample included sixteen bridges in the A2 exposure zone (inland
environment), five bridges in the B1 zone (coastal perimeter) and eight in the B2
zone (coastal frontage). The bridges in the B2 zone are all 500 m or less from open
surf beaches affected at times by onshore winds.
DETERIORATION OF PRESTRESSED CONCRETE BRIDGE BEAMS
20
The selected bridges ranged in age between 35 and 48 years at the time of inspection.
They included bridge beams prestressed using high tensile wire and prestressing strand
with the adoption of these materials following international trends as the technology
advanced.
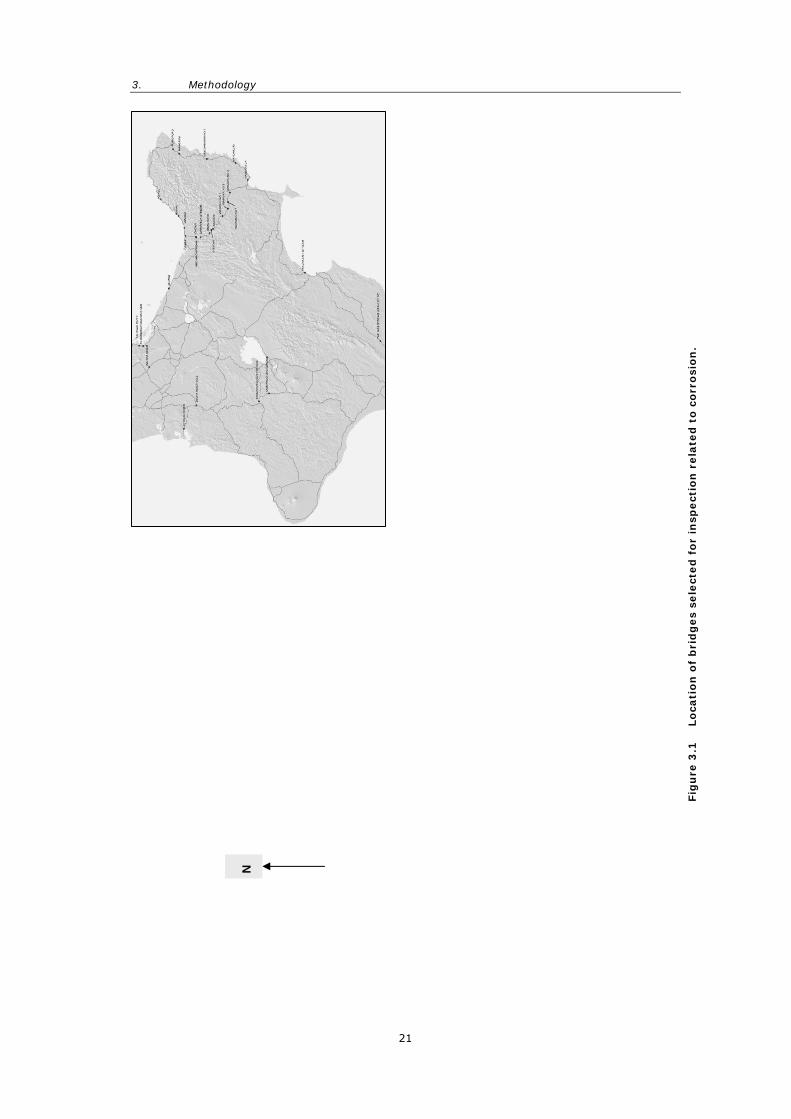
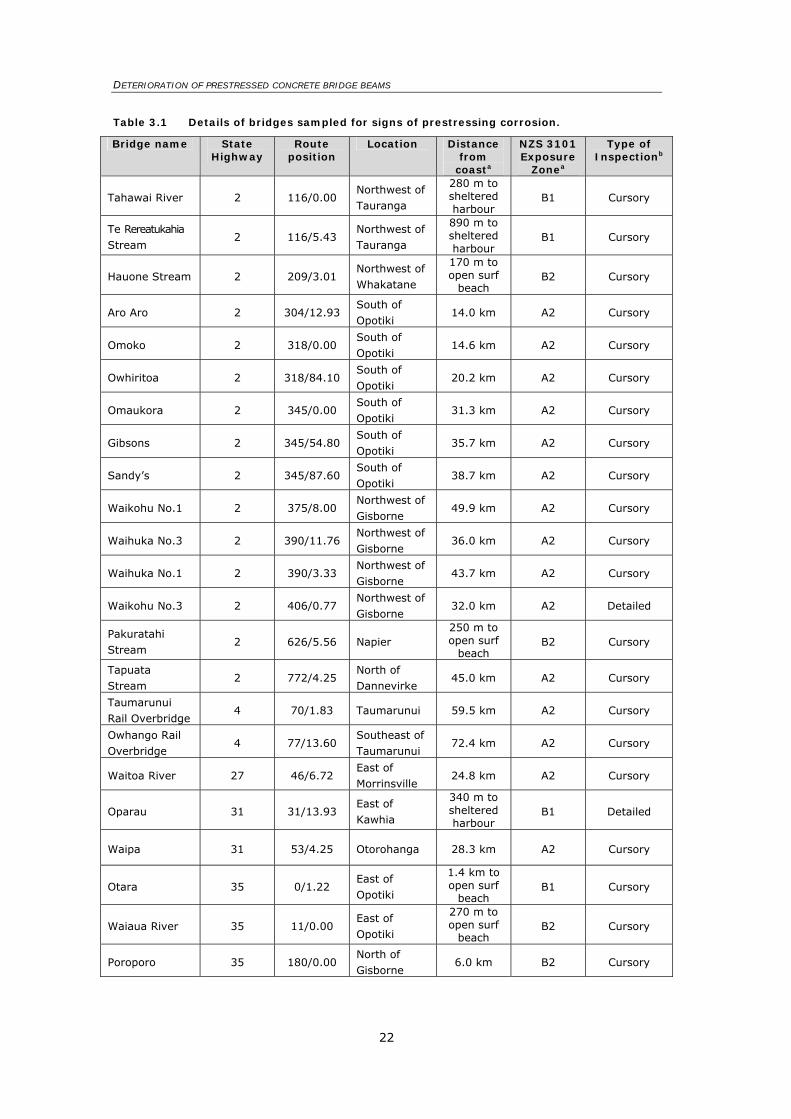
The locations of the selected bridges are shown in Figure 3.1 and described in Table 3.1.
Chloride contamination depths on a thirtieth bridge, the Turihaua Stream Bridge (SH 35,
308/3.76), were measured and compared to those measured 15 years previously, and the
effect of this measured increase in contamination on predicted corrosion risk assessed.
This bridge was built in 1978, has a HN-HO-72 design loading, has a deck constructed of
hollow core units and is in the B2 exposure zone. Although younger and of different
design, it was considered to face a similar corrosion risk to the bridge designs on which
this investigation is focused.
3. Methodology
21
N
Fig
ure
3.1
Lo
cati
on
of
bri
dg
es
sele
cted
fo
r in
spect
ion
rela
ted
to
co
rro
sio
n.
DETERIORATION OF PRESTRESSED CONCRETE BRIDGE BEAMS
22
Table 3.1 Details of bridges sampled for signs of prestressing corrosion.
Bridge name State Highway
Route position
Location Distance from
coasta
NZS 3101 Exposure
Zonea
Type of Inspectionb
Tahawai River 2 116/0.00 Northwest of Tauranga
280 m to sheltered harbour
B1 Cursory
Te Rereatukahia Stream
2 116/5.43 Northwest of Tauranga
890 m to sheltered harbour
B1 Cursory
Hauone Stream 2 209/3.01 Northwest of Whakatane
170 m to open surf
beach B2 Cursory
Aro Aro 2 304/12.93 South of Opotiki
14.0 km A2 Cursory
Omoko 2 318/0.00 South of Opotiki
14.6 km A2 Cursory
Owhiritoa 2 318/84.10 South of Opotiki
20.2 km A2 Cursory
Omaukora 2 345/0.00 South of Opotiki
31.3 km A2 Cursory
Gibsons 2 345/54.80 South of Opotiki
35.7 km A2 Cursory
Sandy’s 2 345/87.60 South of Opotiki
38.7 km A2 Cursory
Waikohu No.1 2 375/8.00 Northwest of Gisborne
49.9 km A2 Cursory
Waihuka No.3 2 390/11.76 Northwest of Gisborne
36.0 km A2 Cursory
Waihuka No.1 2 390/3.33 Northwest of Gisborne
43.7 km A2 Cursory
Waikohu No.3 2 406/0.77 Northwest of Gisborne
32.0 km A2 Detailed
Pakuratahi Stream
2 626/5.56 Napier 250 m to open surf
beach B2 Cursory
Tapuata Stream
2 772/4.25 North of Dannevirke
45.0 km A2 Cursory
Taumarunui Rail Overbridge
4 70/1.83 Taumarunui 59.5 km A2 Cursory
Owhango Rail Overbridge
4 77/13.60 Southeast of Taumarunui
72.4 km A2 Cursory
Waitoa River 27 46/6.72 East of Morrinsville
24.8 km A2 Cursory
Oparau 31 31/13.93 East of Kawhia
340 m to sheltered harbour
B1 Detailed
Waipa 31 53/4.25 Otorohanga 28.3 km A2 Cursory
Otara 35 0/1.22 East of Opotiki
1.4 km to open surf
beach B1 Cursory
Waiaua River 35 11/0.00 East of Opotiki
270 m to open surf
beach B2 Cursory
Poroporo 35 180/0.00 North of Gisborne
6.0 km B2 Cursory
3. Methodology
23
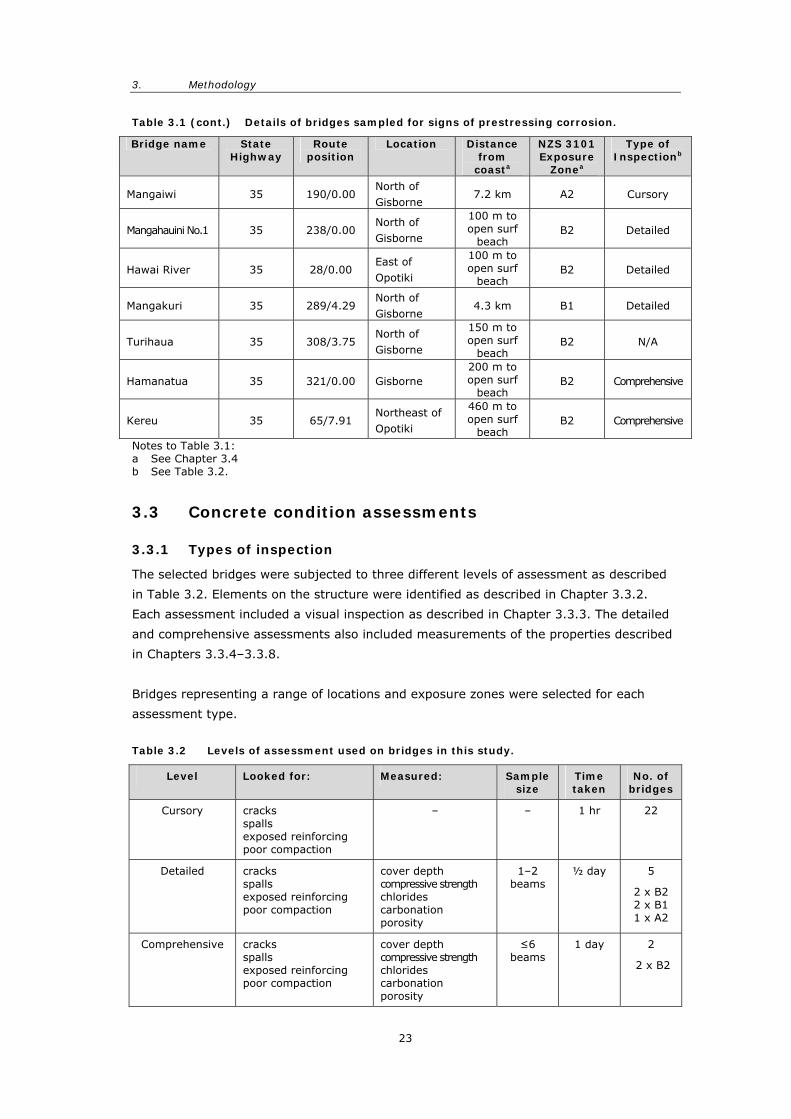
Table 3.1 (cont.) Details of bridges sampled for signs of prestressing corrosion.
Bridge name State Highway
Route position
Location Distance from
coasta
NZS 3101 Exposure
Zonea
Type of Inspectionb
Mangaiwi 35 190/0.00 North of Gisborne
7.2 km A2 Cursory
Mangahauini No.1 35 238/0.00 North of Gisborne
100 m to open surf
beach B2 Detailed
Hawai River 35 28/0.00 East of Opotiki
100 m to open surf
beach B2 Detailed
Mangakuri 35 289/4.29 North of Gisborne
4.3 km B1 Detailed
Turihaua 35 308/3.75 North of Gisborne
150 m to open surf
beach B2 N/A
Hamanatua 35 321/0.00 Gisborne 200 m to open surf
beach B2 Comprehensive
Kereu 35 65/7.91 Northeast of Opotiki
460 m to open surf
beach B2 Comprehensive
Notes to Table 3.1: a See Chapter 3.4 b See Table 3.2.
3.3 Concrete condition assessments
3.3.1 Types of inspection
The selected bridges were subjected to three different levels of assessment as described
in Table 3.2. Elements on the structure were identified as described in Chapter 3.3.2.
Each assessment included a visual inspection as described in Chapter 3.3.3. The detailed
and comprehensive assessments also included measurements of the properties described
in Chapters 3.3.4–3.3.8.
Bridges representing a range of locations and exposure zones were selected for each
assessment type.
Table 3.2 Levels of assessment used on bridges in this study.
Level Looked for: Measured: Sample size
Time taken
No. of bridges
Cursory cracks spalls exposed reinforcing poor compaction
– – 1 hr 22
Detailed cracks spalls exposed reinforcing poor compaction
cover depth compressive strength chlorides carbonation porosity
1–2 beams
½ day 5
2 x B2 2 x B1 1 x A2
Comprehensive cracks spalls exposed reinforcing poor compaction
cover depth compressive strength chlorides carbonation porosity
≤6 beams
1 day 2
2 x B2
DETERIORATION OF PRESTRESSED CONCRETE BRIDGE BEAMS
24
3.3.2 Nomenclature used in inspections
On the Hamanatua Stream Bridge, the abutments and piers were labelled A–D from north
to south in the direction of increasing State Highway route distance, and the three spans
identified accordingly as AB, BC and CD. On the other bridges, the spans were identified
by compass bearings based on the general orientation of the carriageway.
Beams on all bridges were identified as upstream, inner and downstream.
3.3.3 Visual inspection
The beams were visually inspected from ground level by the naked eye and, where
appropriate, with binoculars. On most bridges, all beams could be inspected, although the
width of the river channel on some bridges prevented full inspection of beams in the
central spans.
The inspection concentrated on identifying defects likely to influence the durability of the
beams, such as cracking and spalling caused by prestressing or reinforcing steel
corrosion, exposed prestressing or reinforcing steel, and poor concrete compaction.
Defects and features of interest were photographed.
3.3.4 Volume of permeable voids
An important influence on the durability of prestressed or reinforced concrete is the
ingress of moisture. Water is required to initiate reinforcement corrosion and also acts as
the carrier for aggressive agents such as chloride ions. The amount of moisture that can
enter the concrete is related to its pore volume and continuity, so the volume of
permeable voids (VPV) is a useful durability indicator.
Two concrete cores, nominally 54 mm in diameter, were removed from the web of each
beam sampled. The nature and quality of concrete in the cores was described, and the
VPV measured. Testing was in accordance with AS1012.21: 1999 (Standards Australia
1999), except that measurements were made on whole cores rather than slices and
drying was carried out at 60°C rather than 110°C. This approach allowed the compressive
strength of the cores to be measured after the VPV testing.
The quality and likely durability of the concrete in these bridges was assessed by
comparing the VPVs measured with limits proposed by Andrews-Phaedonos (1997). His
limits are, however, based on drying specimens at 110°C.
3.3.5 Compressive strength
After measurement of VPV (see Chapter 3.3.4), the two cores from each beam sampled
were dry-conditioned for seven days in accordance with the NZS 3112: Part 2: 1986 then
tested for compressive strength. Testing was in accordance with NZS 3112: Part 2:1986
except that the ratio of core diameter to aggregate size was just under 3:1, rather than
4:1 or greater as required by NZS 3112. The relatively small core diameter was
considered acceptable for this work, as the results were needed to provide an indication of
strength rather than for compliance purposes (see below). All concretes had the same
3. Methodology
25
maximum aggregate size so any effect of this deviation from the standard will be
consistent for all samples.
Schmidt hammer readings were also taken on each beam tested. This was to enable some
comment to be made on the compressive strength of beams that were subject to tests
other than compressive strength. It would also indicate differences in the quality of the
surface of the concrete on different beams, which may affect chloride ion ingress and
carbonation (Chapters 3.3.7 and 3.3.8). Ten readings were taken on each surface tested.
Compressive strength and Schmidt hammer tests were carried out to give an indication of
material quality and variability only. For structural assessment in accordance with Transit
New Zealand’s Bridge Manual (TNZ 2003), a higher sampling rate for both tests is
needed. Structural assessment of individual bridges was considered inappropriate for the
scope of this investigation.
3.3.6 Depth of cover concrete
The depth of cover concrete was determined using a digital electromagnetic cover-meter.
Cover was measured over reinforcing stirrups in the web and in the soffit of the lower
flange of each of twenty beams. Cover-meter readings were calibrated against actual
cover depths by drilling to expose the reinforcing steel.
Ideally, the depth of cover over the outermost strand at the top and sides of the lower
flange would also have been measured because corrosion of these strands would affect
the beam’s performance significantly. These covers were not measured, however,
because of the risk of damaging the strand when exposing it to calibrate the cover
readings.
3.3.7 Chloride ion contamination
Drilled powder samples were collected from various depths from the concrete surface on
the beam webs to determine the level of contamination from chloride ions. Samples were
taken between stirrups and prestressing strands in the upper half of web. As with the
cover measurements, chloride profiles on the top and side of the lower flange may have
given a more accurate picture of the risk of chloride-induced corrosion at these highly
sensitive positions, but chloride contamination was not measured here because of the risk
of damaging the closely spaced strands during the sampling process. The chloride
contamination on the web was assumed to be similar to that on the lower flange but no
attempt was made to validate this assumption.
A surface sample was removed to give an indication of the chlorides available at the
concrete surface, then samples were removed at approximately 20 mm increments to a
depth of 60 mm. The samples were then ground and analysed by X-ray fluorescence
(XRF), and the chloride ion content expressed as a percentage of the dry weight of
concrete.
The corrosion of reinforcing steel in chloride-contaminated concrete is a complex process.
Its occurrence and rate depend on several factors (e.g. availability of water and oxygen,
DETERIORATION OF PRESTRESSED CONCRETE BRIDGE BEAMS
26
concrete permeability) in addition to the chloride content of the concrete. Practically,
however, the use of a chloride threshold to indicate the likelihood of reinforcement
corrosion provides a reasonable estimate of the likelihood of corrosion. The UK Concrete
Society (1984) suggests that some risk of corrosion is associated with chloride ion
contents exceeding 0.05% by weight of concrete and a high risk of corrosion is associated
with levels exceeding 0.15%. These thresholds were used to assess the likelihood of
corrosion in this investigation. The threshold may be slightly lower for prestressing steel
depending on the specific conditions to which the steel is exposed. For example, it has
been suggested that a threshold as low as 0.02% or 0.03% should be used for
prestressed concrete because of the higher associated risk and the possibility of stress
corrosion (W. Green, pers. comm. May 2007). This is very close to typical background
chloride levels and therefore may be overly conservative. Errors related to sampling and
accuracy of analytical test methods would also be more significant at such a low level.
This investigation therefore considered 0.05% to be the corrosion threshold.
Chloride contents had been measured on samples from the deck units and abutments of
the Turihaua Stream Bridge in 1991 as part of a routine maintenance programme. The
chloride content of concrete sampled from the deck units was also measured in the
current investigation. No other tests were performed on this bridge.
3.3.8 Carbonation depth
The carbonation depth of the concrete was assessed using a phenolphthalein indicator at
holes drilled to take samples for chloride analysis and to calibrate the cover readings.
Carbonation depth was also measured on the concrete cores removed from the beams.
3.4 Service conditions
The environmental exposure classification for each bridge was determined in accordance
with NZS 3101: 2006 by comparing the bridge location with the definitions of exposure
classifications C (tidal/splash/spray) and B2 (coastal frontage), and the boundary between
exposure classifications B1 (coastal perimeter) and A2 (inland). The classifications thus
obtained are listed in Table 3.1.
Specific conditions at each bridge were also taken into account, such as exposure to sea
spray. Such exposure conditions are also noted in Table 3.1.
4. Design and distribution of prestressed I-beam bridges built in the 1960s
27
4. Design and distribution of prestressed I-beam bridges built in the 1960s
The 1956 Ministry of Works Bridge Manual set out the criteria for the design and
specification of bridge construction in New Zealand and, with subsequent amendments,
was the prime reference document until the 1970s, when new standards MWD CDP 701
(Ministry of Works and Development 1972–1978) and NZS 3101P: 1978 (Standards
Association of New Zealand 1978) were introduced.
4.1 Beam design
The Public Works Department and the Ministry of Works (MoW) were the early designers
and builders of road bridges in New Zealand. Standardised beams and superstructure
forms were the norm because they made the design and production processes much
quicker and easier. Prestressed I-beam bridges were first constructed in New Zealand in
the late 1950s. Standard prestressed bridge beam designs were first issued by the MoW
in 1957 and published in 1959. Beam design was based on working stress alone (i.e.
serviceability limit state) until NZS3101: 1982 (Standards Association of New Zealand
1982a & b) introduced the need to also consider ultimate limit state.
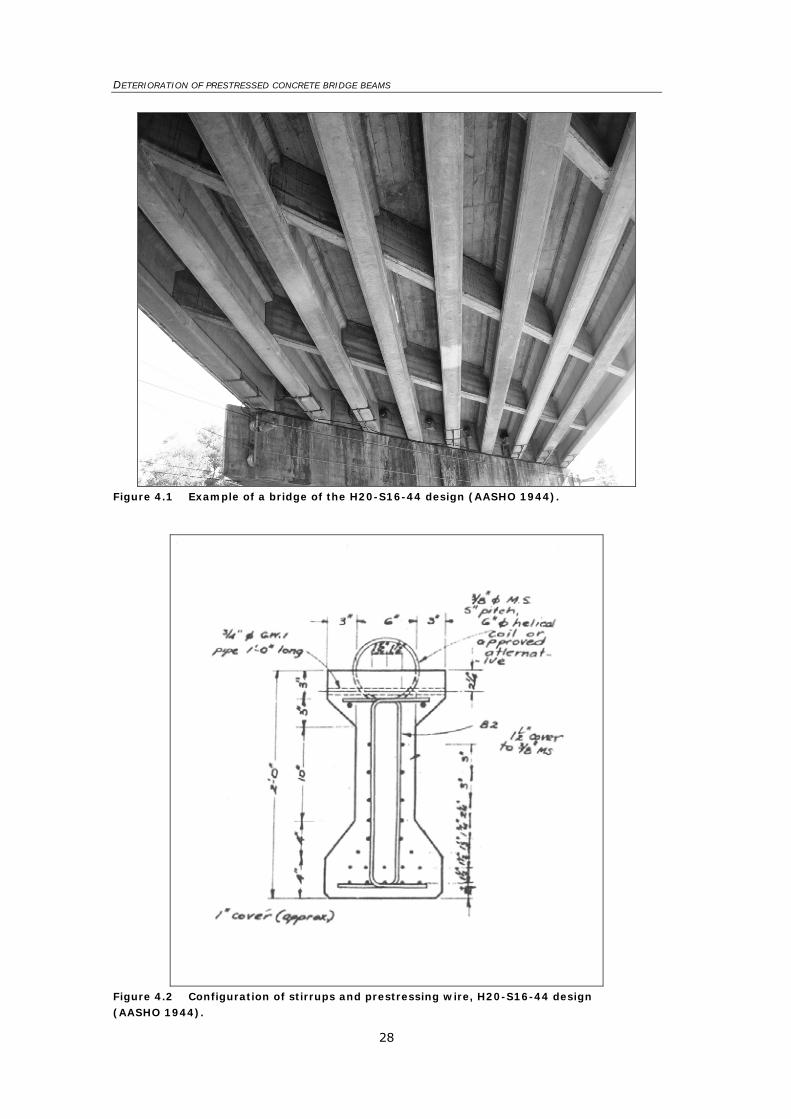
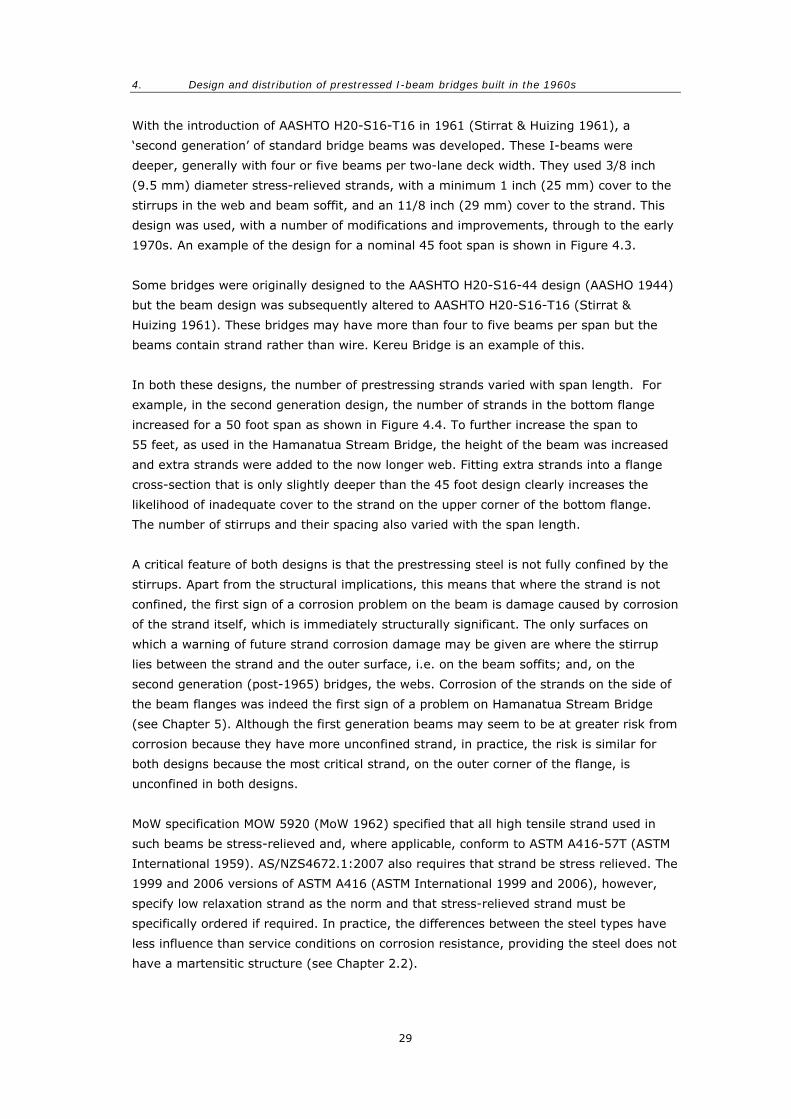
In the 1950s and early 1960s, beams were designed to the AASHTO H20-S16-44 design
loading (AASHO 1944). Typical I-beams were shallow in depth, with six or more beams
used per two-lane deck width. They used 0.2 inch (5 mm) diameter pretensioned high
tensile wire, with a minimum 0.9 inch (23 mm) cover to the wire in the web and a 1 inch
(25 mm) cover to stirrups in the beam soffit. Figure 4.1 shows an example of one of these
‘first generation’ bridges. Figure 4.2 shows the configuration of the prestressing wire and
stirrups used in this design.
DETERIORATION OF PRESTRESSED CONCRETE BRIDGE BEAMS
28
Figure 4.1 Example of a bridge of the H20-S16-44 design (AASHO 1944).
Figure 4.2 Configuration of stirrups and prestressing wire, H20-S16-44 design (AASHO 1944).
4. Design and distribution of prestressed I-beam bridges built in the 1960s
29
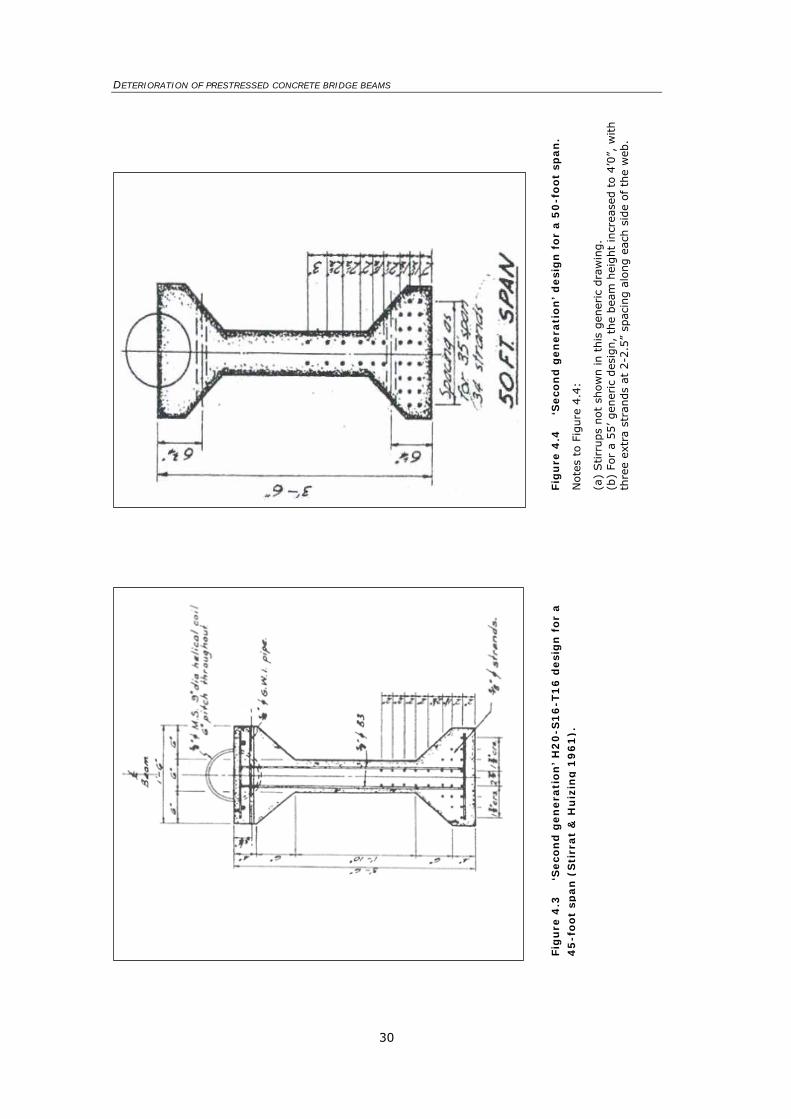
With the introduction of AASHTO H20-S16-T16 in 1961 (Stirrat & Huizing 1961), a
‘second generation’ of standard bridge beams was developed. These I-beams were
deeper, generally with four or five beams per two-lane deck width. They used 3/8 inch
(9.5 mm) diameter stress-relieved strands, with a minimum 1 inch (25 mm) cover to the
stirrups in the web and beam soffit, and an 11/8 inch (29 mm) cover to the strand. This
design was used, with a number of modifications and improvements, through to the early
1970s. An example of the design for a nominal 45 foot span is shown in Figure 4.3.
Some bridges were originally designed to the AASHTO H20-S16-44 design (AASHO 1944)
but the beam design was subsequently altered to AASHTO H20-S16-T16 (Stirrat &
Huizing 1961). These bridges may have more than four to five beams per span but the
beams contain strand rather than wire. Kereu Bridge is an example of this.
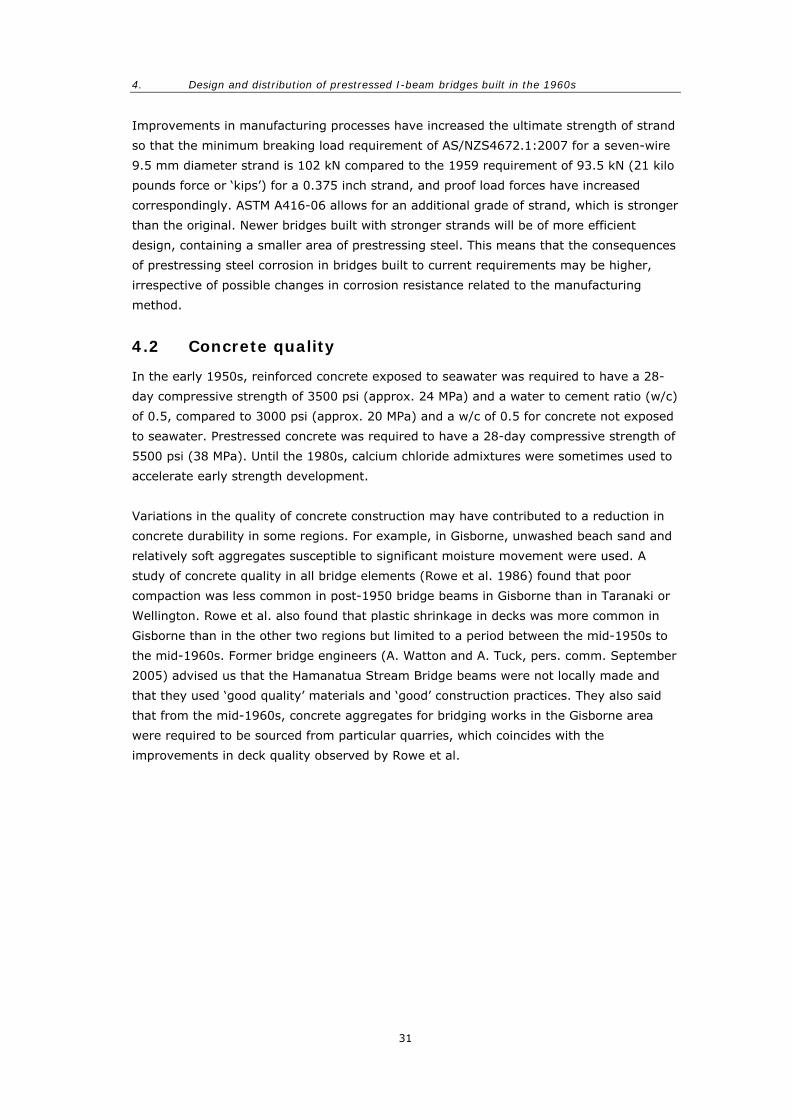
In both these designs, the number of prestressing strands varied with span length. For
example, in the second generation design, the number of strands in the bottom flange
increased for a 50 foot span as shown in Figure 4.4. To further increase the span to
55 feet, as used in the Hamanatua Stream Bridge, the height of the beam was increased
and extra strands were added to the now longer web. Fitting extra strands into a flange
cross-section that is only slightly deeper than the 45 foot design clearly increases the
likelihood of inadequate cover to the strand on the upper corner of the bottom flange.
The number of stirrups and their spacing also varied with the span length.
A critical feature of both designs is that the prestressing steel is not fully confined by the
stirrups. Apart from the structural implications, this means that where the strand is not
confined, the first sign of a corrosion problem on the beam is damage caused by corrosion
of the strand itself, which is immediately structurally significant. The only surfaces on
which a warning of future strand corrosion damage may be given are where the stirrup
lies between the strand and the outer surface, i.e. on the beam soffits; and, on the
second generation (post-1965) bridges, the webs. Corrosion of the strands on the side of
the beam flanges was indeed the first sign of a problem on Hamanatua Stream Bridge
(see Chapter 5). Although the first generation beams may seem to be at greater risk from
corrosion because they have more unconfined strand, in practice, the risk is similar for
both designs because the most critical strand, on the outer corner of the flange, is
unconfined in both designs.
MoW specification MOW 5920 (MoW 1962) specified that all high tensile strand used in
such beams be stress-relieved and, where applicable, conform to ASTM A416-57T (ASTM
International 1959). AS/NZS4672.1:2007 also requires that strand be stress relieved. The
1999 and 2006 versions of ASTM A416 (ASTM International 1999 and 2006), however,
specify low relaxation strand as the norm and that stress-relieved strand must be
specifically ordered if required. In practice, the differences between the steel types have
less influence than service conditions on corrosion resistance, providing the steel does not
have a martensitic structure (see Chapter 2.2).
DETERIORATION OF PRESTRESSED CONCRETE BRIDGE BEAMS
30
Fig
ure
4.3
‘S
eco
nd
gen
era
tio
n’ H
20
-S1
6-T
16
desi
gn
fo
r a
45
-fo
ot
span
(S
tirr
at
& H
uiz
ing
19
61
).
Fig
ure
4.4
‘S
eco
nd
gen
era
tio
n’ d
esi
gn
fo
r a 5
0-f
oo
t sp
an
.
Note
s to
Fig
ure
4.4
:
(a)
Stirr
ups
not
show
n in t
his
gen
eric
dra
win
g.
(b
) Fo
r a
55’ gen
eric
des
ign,
the
bea
m h
eight
incr
ease
d t
o 4
’0”,
with
thre
e ex
tra
stra
nds
at 2
-2.5
” sp
acin
g a
long e
ach s
ide
of
the
web
.
4. Design and distribution of prestressed I-beam bridges built in the 1960s
31
Improvements in manufacturing processes have increased the ultimate strength of strand
so that the minimum breaking load requirement of AS/NZS4672.1:2007 for a seven-wire
9.5 mm diameter strand is 102 kN compared to the 1959 requirement of 93.5 kN (21 kilo
pounds force or ‘kips’) for a 0.375 inch strand, and proof load forces have increased
correspondingly. ASTM A416-06 allows for an additional grade of strand, which is stronger
than the original. Newer bridges built with stronger strands will be of more efficient
design, containing a smaller area of prestressing steel. This means that the consequences
of prestressing steel corrosion in bridges built to current requirements may be higher,
irrespective of possible changes in corrosion resistance related to the manufacturing
method.
4.2 Concrete quality
In the early 1950s, reinforced concrete exposed to seawater was required to have a 28-
day compressive strength of 3500 psi (approx. 24 MPa) and a water to cement ratio (w/c)
of 0.5, compared to 3000 psi (approx. 20 MPa) and a w/c of 0.5 for concrete not exposed
to seawater. Prestressed concrete was required to have a 28-day compressive strength of
5500 psi (38 MPa). Until the 1980s, calcium chloride admixtures were sometimes used to
accelerate early strength development.
Variations in the quality of concrete construction may have contributed to a reduction in
concrete durability in some regions. For example, in Gisborne, unwashed beach sand and
relatively soft aggregates susceptible to significant moisture movement were used. A
study of concrete quality in all bridge elements (Rowe et al. 1986) found that poor
compaction was less common in post-1950 bridge beams in Gisborne than in Taranaki or
Wellington. Rowe et al. also found that plastic shrinkage in decks was more common in
Gisborne than in the other two regions but limited to a period between the mid-1950s to
the mid-1960s. Former bridge engineers (A. Watton and A. Tuck, pers. comm. September
2005) advised us that the Hamanatua Stream Bridge beams were not locally made and
that they used ‘good quality’ materials and ‘good’ construction practices. They also said
that from the mid-1960s, concrete aggregates for bridging works in the Gisborne area
were required to be sourced from particular quarries, which coincides with the
improvements in deck quality observed by Rowe et al.
DETERIORATION OF PRESTRESSED CONCRETE BRIDGE BEAMS
32
4.3 Bridge descriptions
Based on the type of prestressing reported in construction drawings, of the 29 bridges
examined:
• five (built between 1958 and 1964) were of the AASHO H20-S16-44 design,
• seventeen (built between 1962 and 1971) were of the AASHTO H20-S16-T16
design, and
• seven (built between 1961 and 1971) were of unknown design.
Of the ‘unknown’ designs, four (built between 1961 and 1964) have seven to nine beams
and are probably of the AASHO H20-S16-44 design; three (built between 1966 and 1971)
have four beams per span and are probably of the AASHTO H20-S16-T16 design.
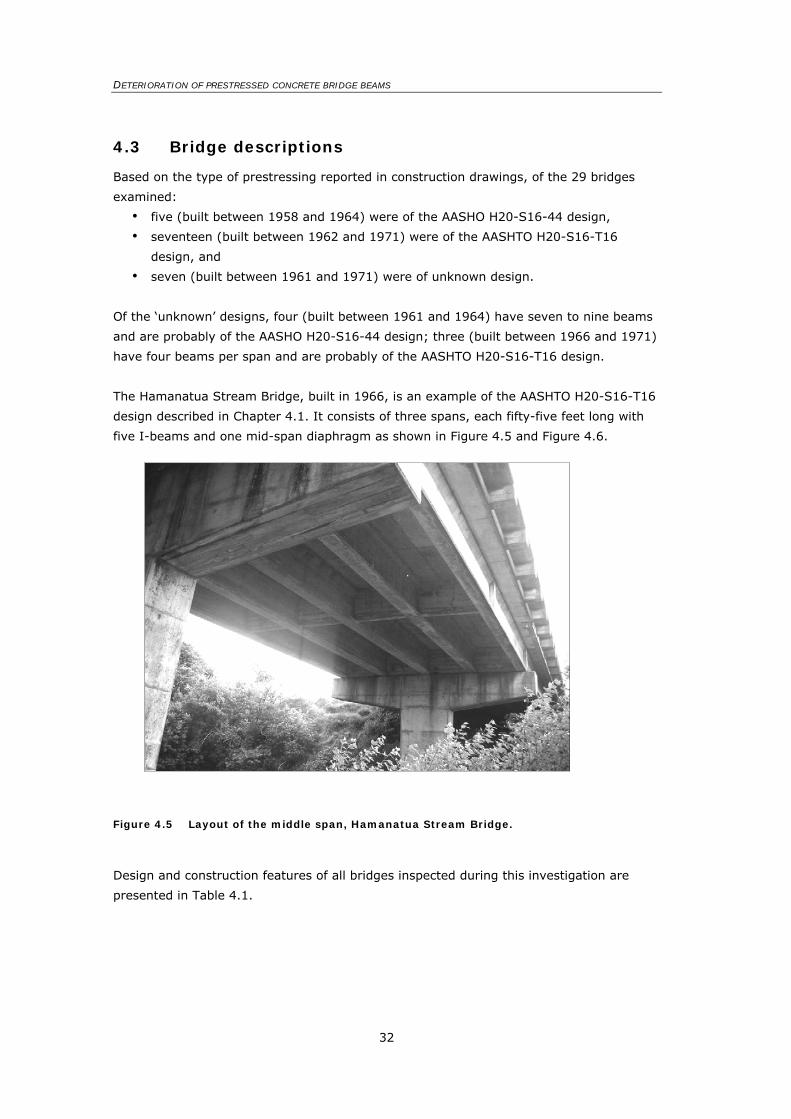
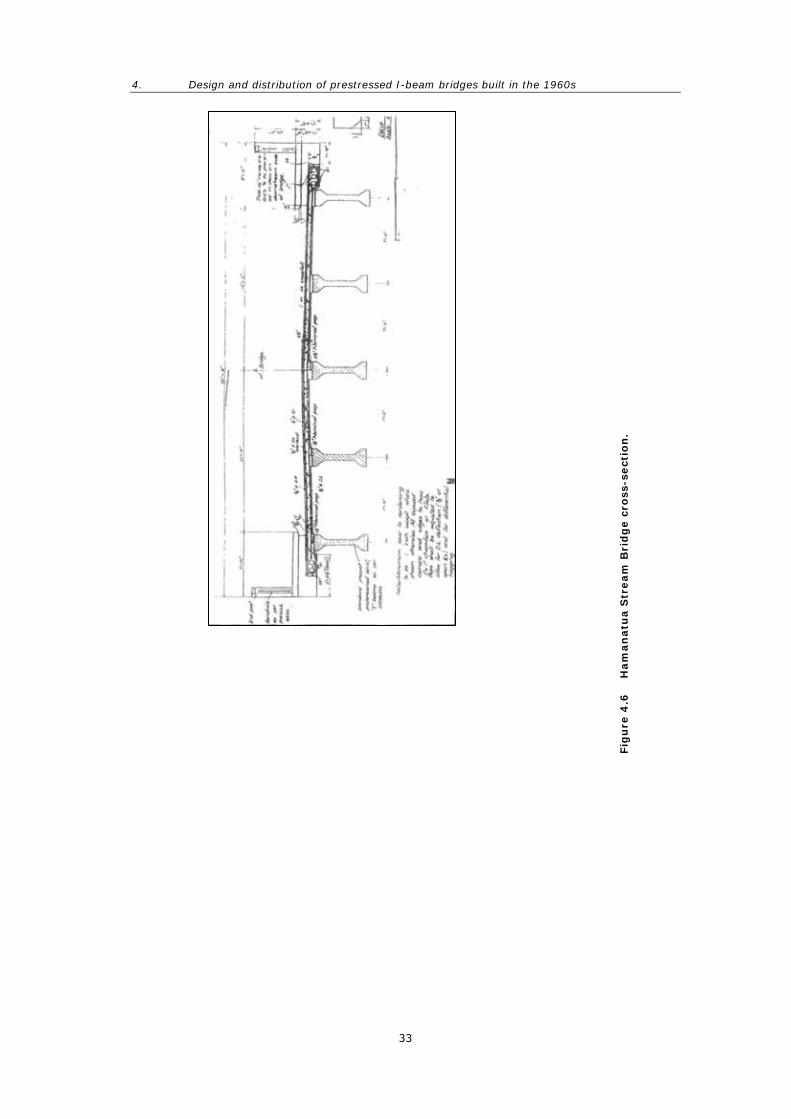
The Hamanatua Stream Bridge, built in 1966, is an example of the AASHTO H20-S16-T16
design described in Chapter 4.1. It consists of three spans, each fifty-five feet long with
five I-beams and one mid-span diaphragm as shown in Figure 4.5 and Figure 4.6.
Figure 4.5 Layout of the middle span, Hamanatua Stream Bridge.
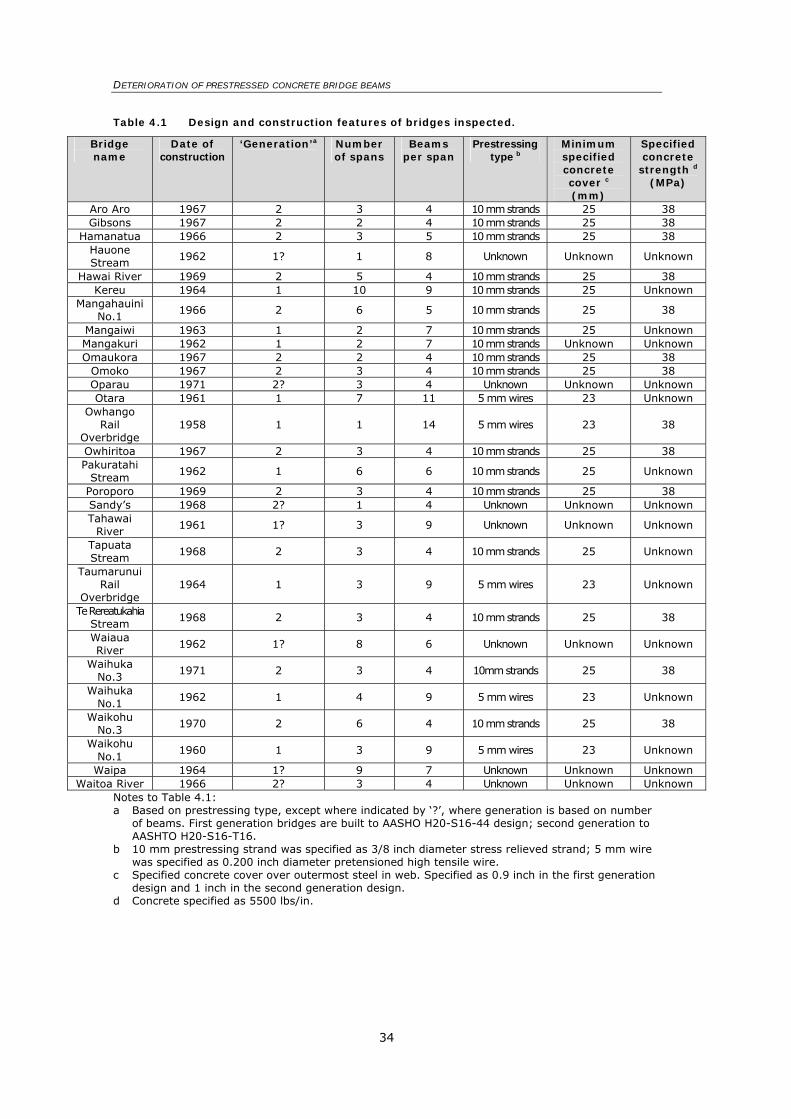
Design and construction features of all bridges inspected during this investigation are
presented in Table 4.1.
4. Design and distribution of prestressed I-beam bridges built in the 1960s
33
Fig
ure
4.6
H
am
an
atu
a S
tream
Bri
dg
e c
ross
-sect
ion
.
DETERIORATION OF PRESTRESSED CONCRETE BRIDGE BEAMS
34
Table 4.1 Design and construction features of bridges inspected.
Bridge name
Date of construction
‘Generation’a Number of spans
Beams per span
Prestressing type b
Minimum specified concrete cover c (mm)
Specified concrete
strength d (MPa)
Aro Aro 1967 2 3 4 10 mm strands 25 38 Gibsons 1967 2 2 4 10 mm strands 25 38
Hamanatua 1966 2 3 5 10 mm strands 25 38 Hauone Stream
1962 1? 1 8 Unknown Unknown Unknown
Hawai River 1969 2 5 4 10 mm strands 25 38 Kereu 1964 1 10 9 10 mm strands 25 Unknown
Mangahauini No.1
1966 2 6 5 10 mm strands 25 38
Mangaiwi 1963 1 2 7 10 mm strands 25 Unknown Mangakuri 1962 1 2 7 10 mm strands Unknown Unknown Omaukora 1967 2 2 4 10 mm strands 25 38
Omoko 1967 2 3 4 10 mm strands 25 38 Oparau 1971 2? 3 4 Unknown Unknown Unknown Otara 1961 1 7 11 5 mm wires 23 Unknown
Owhango Rail
Overbridge 1958 1 1 14 5 mm wires 23 38
Owhiritoa 1967 2 3 4 10 mm strands 25 38 Pakuratahi
Stream 1962 1 6 6 10 mm strands 25 Unknown
Poroporo 1969 2 3 4 10 mm strands 25 38 Sandy’s 1968 2? 1 4 Unknown Unknown Unknown Tahawai
River 1961 1? 3 9 Unknown Unknown Unknown
Tapuata Stream
1968 2 3 4 10 mm strands 25 Unknown
Taumarunui Rail
Overbridge 1964 1 3 9 5 mm wires 23 Unknown
Te Rereatukahia Stream
1968 2 3 4 10 mm strands 25 38
Waiaua River
1962 1? 8 6 Unknown Unknown Unknown
Waihuka No.3
1971 2 3 4 10mm strands 25 38
Waihuka No.1
1962 1 4 9 5 mm wires 23 Unknown
Waikohu No.3
1970 2 6 4 10 mm strands 25 38
Waikohu No.1
1960 1 3 9 5 mm wires 23 Unknown
Waipa 1964 1? 9 7 Unknown Unknown Unknown Waitoa River 1966 2? 3 4 Unknown Unknown Unknown
Notes to Table 4.1: a Based on prestressing type, except where indicated by ‘?’, where generation is based on number
of beams. First generation bridges are built to AASHO H20-S16-44 design; second generation to AASHTO H20-S16-T16.
b 10 mm prestressing strand was specified as 3/8 inch diameter stress relieved strand; 5 mm wire was specified as 0.200 inch diameter pretensioned high tensile wire.
c Specified concrete cover over outermost steel in web. Specified as 0.9 inch in the first generation design and 1 inch in the second generation design.
d Concrete specified as 5500 lbs/in.
4. Design and distribution of prestressed I-beam bridges built in the 1960s
35
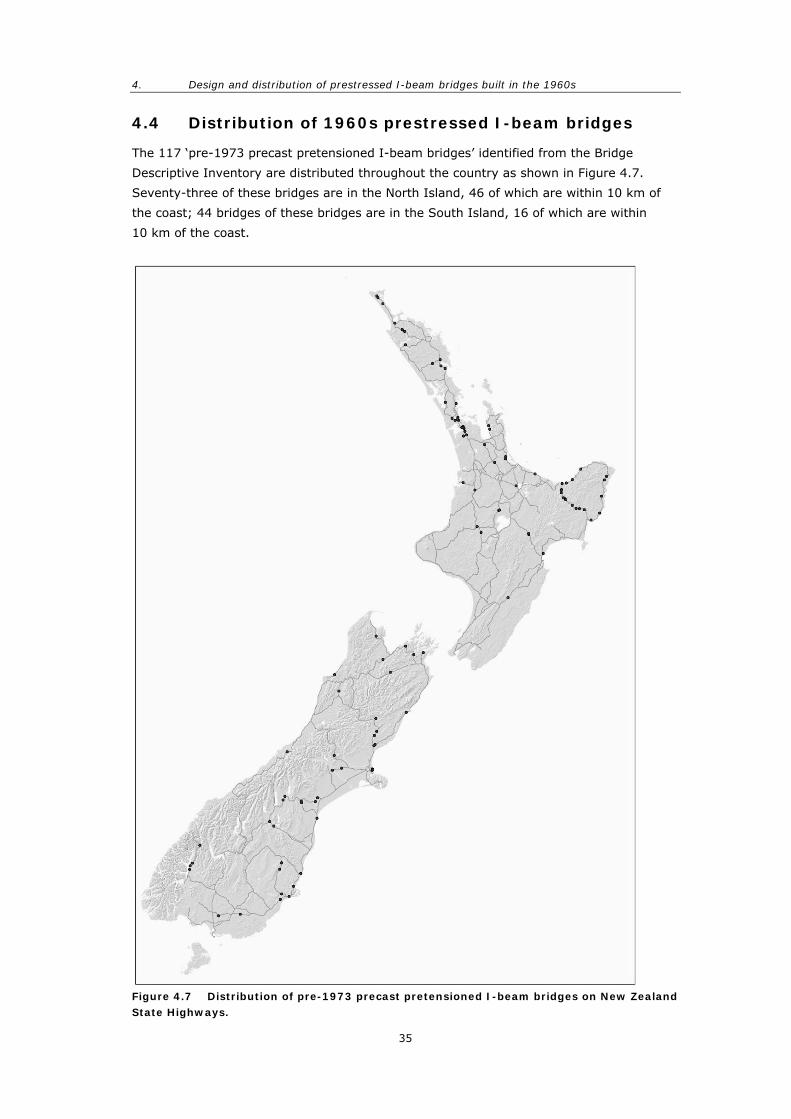
4.4 Distribution of 1960s prestressed I-beam bridges
The 117 ‘pre-1973 precast pretensioned I-beam bridges’ identified from the Bridge
Descriptive Inventory are distributed throughout the country as shown in Figure 4.7.
Seventy-three of these bridges are in the North Island, 46 of which are within 10 km of
the coast; 44 bridges of these bridges are in the South Island, 16 of which are within
10 km of the coast.
Figure 4.7 Distribution of pre-1973 precast pretensioned I-beam bridges on New Zealand State Highways.
DETERIORATION OF PRESTRESSED CONCRETE BRIDGE BEAMS
36
5. Observations and test results
5.1 Bridge condition
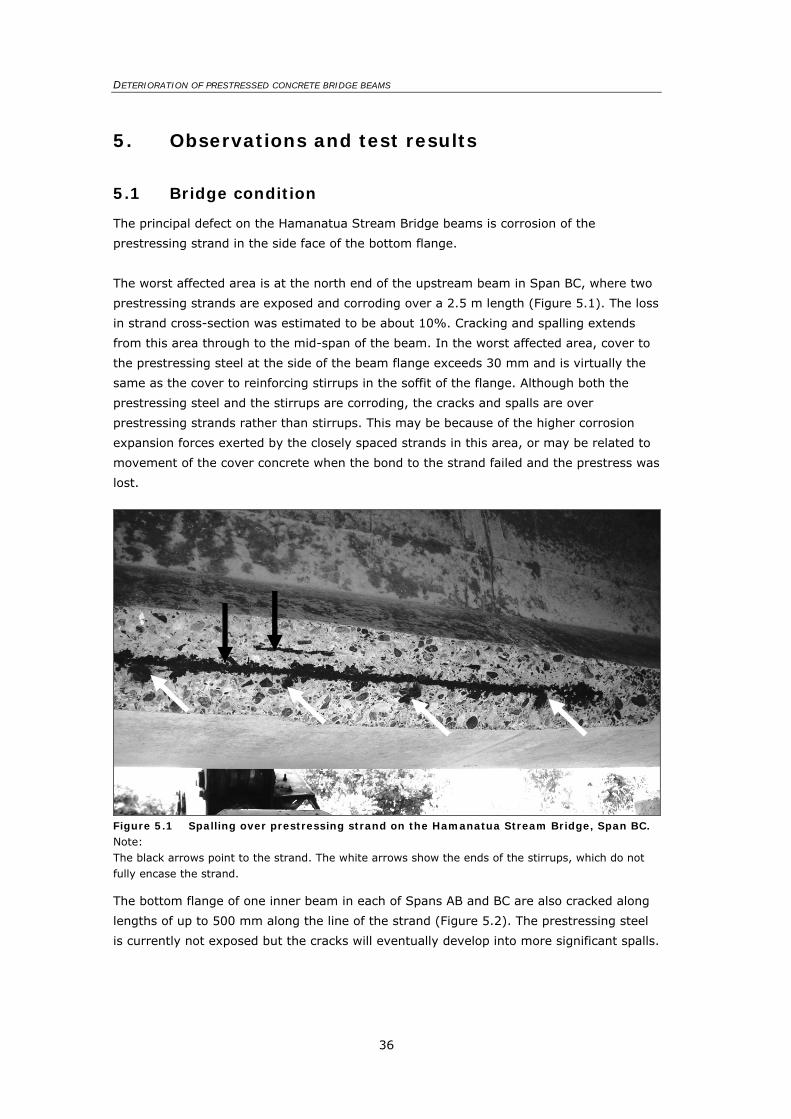
The principal defect on the Hamanatua Stream Bridge beams is corrosion of the
prestressing strand in the side face of the bottom flange.
The worst affected area is at the north end of the upstream beam in Span BC, where two
prestressing strands are exposed and corroding over a 2.5 m length (Figure 5.1). The loss
in strand cross-section was estimated to be about 10%. Cracking and spalling extends
from this area through to the mid-span of the beam. In the worst affected area, cover to
the prestressing steel at the side of the beam flange exceeds 30 mm and is virtually the
same as the cover to reinforcing stirrups in the soffit of the flange. Although both the
prestressing steel and the stirrups are corroding, the cracks and spalls are over
prestressing strands rather than stirrups. This may be because of the higher corrosion
expansion forces exerted by the closely spaced strands in this area, or may be related to
movement of the cover concrete when the bond to the strand failed and the prestress was
lost.
Figure 5.1 Spalling over prestressing strand on the Hamanatua Stream Bridge, Span BC. Note: The black arrows point to the strand. The white arrows show the ends of the stirrups, which do not fully encase the strand.
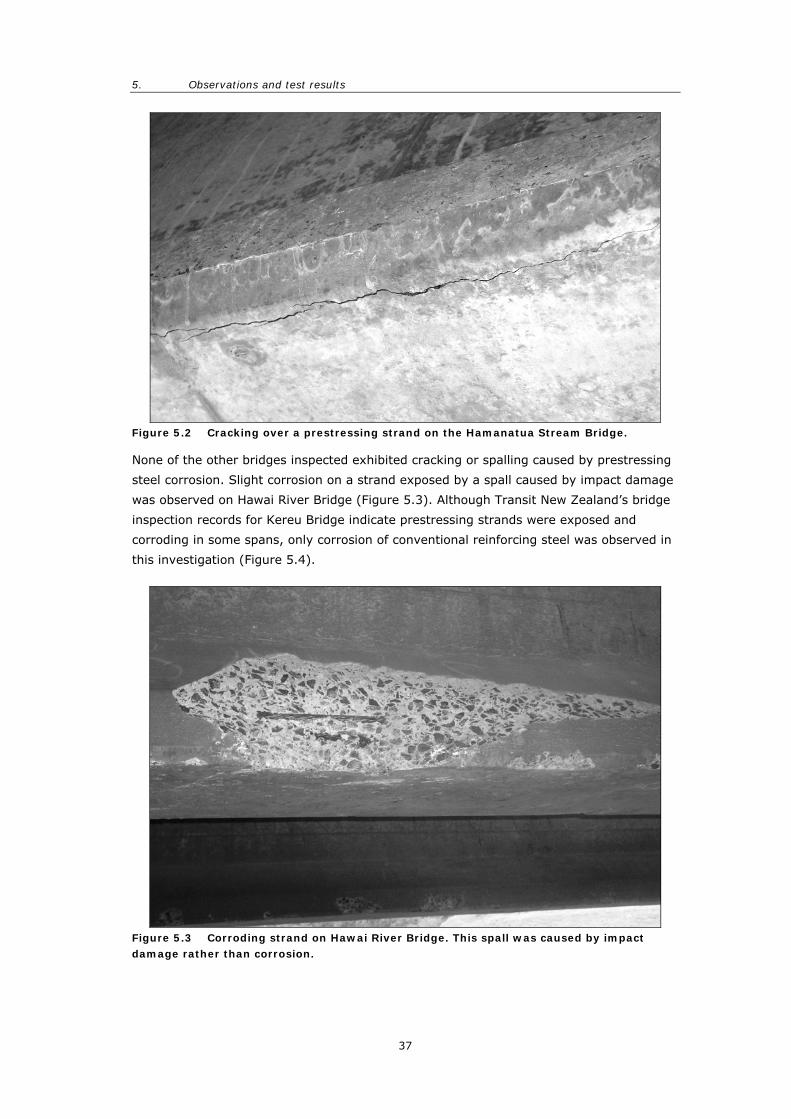
The bottom flange of one inner beam in each of Spans AB and BC are also cracked along
lengths of up to 500 mm along the line of the strand (Figure 5.2). The prestressing steel
is currently not exposed but the cracks will eventually develop into more significant spalls.
5. Observations and test results
37
Figure 5.2 Cracking over a prestressing strand on the Hamanatua Stream Bridge.
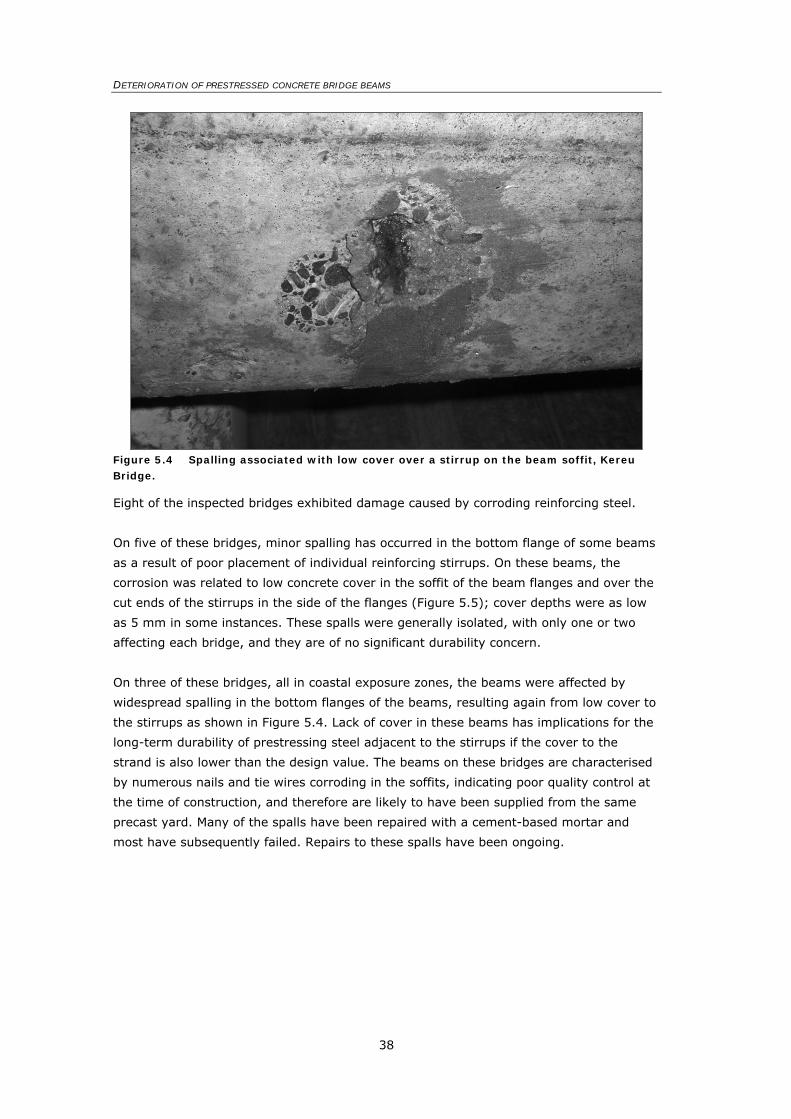
None of the other bridges inspected exhibited cracking or spalling caused by prestressing
steel corrosion. Slight corrosion on a strand exposed by a spall caused by impact damage
was observed on Hawai River Bridge (Figure 5.3). Although Transit New Zealand’s bridge
inspection records for Kereu Bridge indicate prestressing strands were exposed and
corroding in some spans, only corrosion of conventional reinforcing steel was observed in
this investigation (Figure 5.4).
Figure 5.3 Corroding strand on Hawai River Bridge. This spall was caused by impact damage rather than corrosion.
DETERIORATION OF PRESTRESSED CONCRETE BRIDGE BEAMS
38
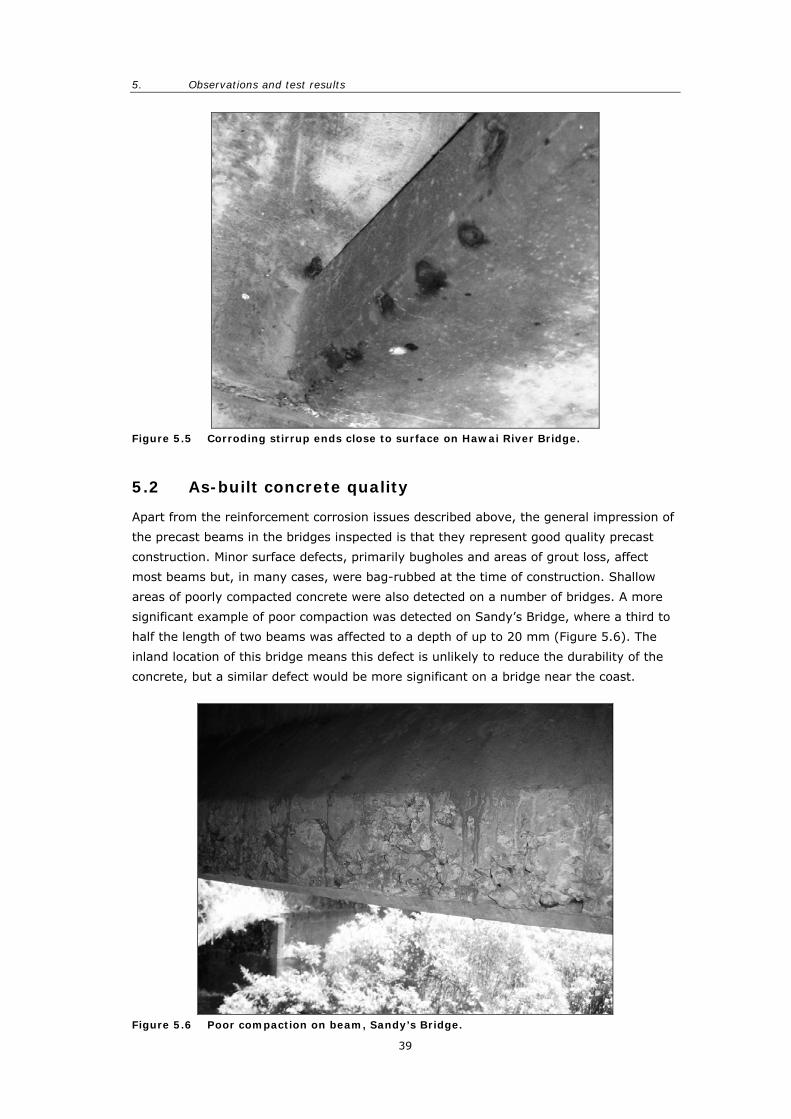
Figure 5.4 Spalling associated with low cover over a stirrup on the beam soffit, Kereu Bridge.
Eight of the inspected bridges exhibited damage caused by corroding reinforcing steel.
On five of these bridges, minor spalling has occurred in the bottom flange of some beams
as a result of poor placement of individual reinforcing stirrups. On these beams, the
corrosion was related to low concrete cover in the soffit of the beam flanges and over the
cut ends of the stirrups in the side of the flanges (Figure 5.5); cover depths were as low
as 5 mm in some instances. These spalls were generally isolated, with only one or two
affecting each bridge, and they are of no significant durability concern.
On three of these bridges, all in coastal exposure zones, the beams were affected by
widespread spalling in the bottom flanges of the beams, resulting again from low cover to
the stirrups as shown in Figure 5.4. Lack of cover in these beams has implications for the
long-term durability of prestressing steel adjacent to the stirrups if the cover to the
strand is also lower than the design value. The beams on these bridges are characterised
by numerous nails and tie wires corroding in the soffits, indicating poor quality control at
the time of construction, and therefore are likely to have been supplied from the same
precast yard. Many of the spalls have been repaired with a cement-based mortar and
most have subsequently failed. Repairs to these spalls have been ongoing.
5. Observations and test results
39
Figure 5.5 Corroding stirrup ends close to surface on Hawai River Bridge.
5.2 As-built concrete quality
Apart from the reinforcement corrosion issues described above, the general impression of
the precast beams in the bridges inspected is that they represent good quality precast
construction. Minor surface defects, primarily bugholes and areas of grout loss, affect
most beams but, in many cases, were bag-rubbed at the time of construction. Shallow
areas of poorly compacted concrete were also detected on a number of bridges. A more
significant example of poor compaction was detected on Sandy’s Bridge, where a third to
half the length of two beams was affected to a depth of up to 20 mm (Figure 5.6). The
inland location of this bridge means this defect is unlikely to reduce the durability of the
concrete, but a similar defect would be more significant on a bridge near the coast.
Figure 5.6 Poor compaction on beam, Sandy’s Bridge.
DETERIORATION OF PRESTRESSED CONCRETE BRIDGE BEAMS
40
Table 5.1 presents descriptions of the concrete and results from measurements of the
compressive strength and VPV made on the core samples taken from the seven bridges
subject to detailed or comprehensive inspections.
The core samples revealed that the concrete used in the precast beams was generally
well-proportioned and well compacted. The coarse aggregates used were rounded
greywacke in the Gisborne and East Cape areas, crushed volcanic aggregate in the Bay of
Plenty and crushed greywacke aggregate at Kawhia (Oparau Bridge) on the west coast.
The maximum aggregate size in all concretes was approximately 20 mm.
The compressive strength of the concrete cores ranged from 40 MPa to 81.5 MPa. Only
one core was weaker than 50 MPa. This low (40 MPa) strength, measured on one beam
on Kereu Bridge, means it is unlikely this beam would have met the 28-day specified
strength of 38 MPa. All other concretes are likely to have met this 28-day strength
requirement.
Average Schmidt rebound numbers on the surfaces from which the cores were taken
ranged from 46 to 55. Schmidt rebound numbers are a measure of surface hardness,
variations in which, for a given concrete, can indicate local deficiencies in concrete quality
or surface finish. They did not always correlate well with the core compressive strengths
and therefore are not considered in the context of strength. The similarity of results over
all structures reflects their generally good compaction and uniform surface finish.
Transit New Zealand requires its structures to have a specified intended life of 100 years.
For structures with a specified intended life of 100 years and made from concrete
containing Type GP cement only (i.e. no supplementary cementitious materials added),
NZS 3101: 2006 does not permit cover depths less than 30 mm for structures in the A2
and B1 zones, or less than 35 mm for structures in the B2 zone. NZS 3101: 2006 requires
a 28-day concrete compressive strength of 60–100 MPa for structures with these
minimum covers. The concretes in the bridges assessed would not meet these
compressive strength requirements let alone the higher strengths that would be
necessary to provide adequate durability at covers less than 30 mm.
The VPV results range from 7.8% to 10.7%. VicRoads requires a VPV less than 14% for
coastal/marine structures, less than 16% for structures in the B2 exposure zone and less
than 17% for inland structures (Andrews-Phaedonos 1997). This suggests that the VPVs
recorded in this investigation are relatively low and therefore that the void structures in
the concretes examined here are likely to enhance rather than detract from the overall
durability performance. The VicRoads requirements, however, are based on VPVs
measured at 28 days after drying at 110°C rather than VPVs measured many years later
after drying at 60°C. Consequently, the results from the cores assessed in this
investigation may suggest the concrete quality is better than it actually is. Two factors
contribute to this. Firstly, the cement would be hydrated to a greater degree after 30 to
40 years than after 28 days. Secondly, the less rigorous drying regime may have resulted
in the concretes being wetter when tested and therefore able to absorb less water than
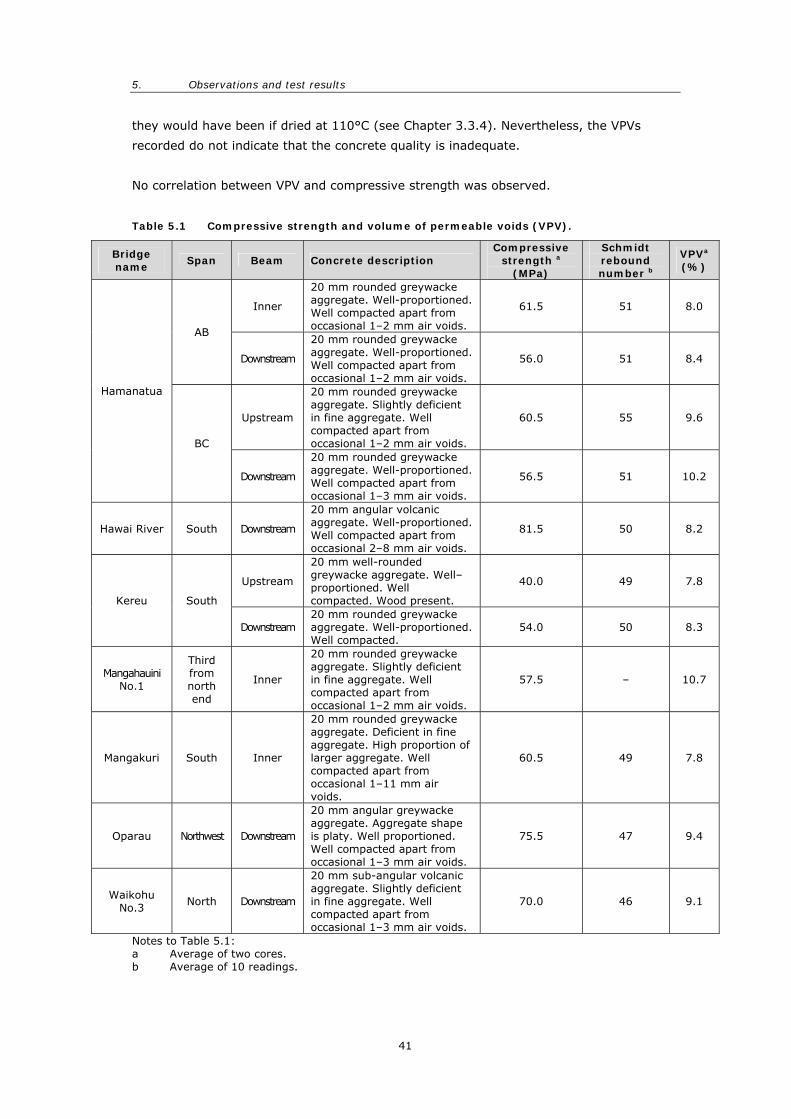
5. Observations and test results
41
they would have been if dried at 110°C (see Chapter 3.3.4). Nevertheless, the VPVs
recorded do not indicate that the concrete quality is inadequate.
No correlation between VPV and compressive strength was observed.
Table 5.1 Compressive strength and volume of permeable voids (VPV).
Bridge name
Span Beam Concrete description Compressive
strength a (MPa)
Schmidt rebound number b
VPVa (%)
Inner
20 mm rounded greywacke aggregate. Well-proportioned. Well compacted apart from occasional 1–2 mm air voids.
61.5 51 8.0
AB
Downstream
20 mm rounded greywacke aggregate. Well-proportioned. Well compacted apart from occasional 1–2 mm air voids.
56.0 51 8.4
Upstream
20 mm rounded greywacke aggregate. Slightly deficient in fine aggregate. Well compacted apart from occasional 1–2 mm air voids.
60.5 55 9.6
Hamanatua
BC
Downstream
20 mm rounded greywacke aggregate. Well-proportioned. Well compacted apart from occasional 1–3 mm air voids.
56.5 51 10.2
Hawai River South Downstream
20 mm angular volcanic aggregate. Well-proportioned. Well compacted apart from occasional 2–8 mm air voids.
81.5 50 8.2
Upstream
20 mm well-rounded greywacke aggregate. Well–proportioned. Well compacted. Wood present.
40.0 49 7.8
Kereu South
Downstream 20 mm rounded greywacke aggregate. Well-proportioned. Well compacted.
54.0 50 8.3
Mangahauini No.1
Third from north end
Inner
20 mm rounded greywacke aggregate. Slightly deficient in fine aggregate. Well compacted apart from occasional 1–2 mm air voids.
57.5 – 10.7
Mangakuri South Inner
20 mm rounded greywacke aggregate. Deficient in fine aggregate. High proportion of larger aggregate. Well compacted apart from occasional 1–11 mm air voids.
60.5 49 7.8
Oparau Northwest Downstream
20 mm angular greywacke aggregate. Aggregate shape is platy. Well proportioned. Well compacted apart from occasional 1–3 mm air voids.
75.5 47 9.4
Waikohu No.3
North Downstream
20 mm sub-angular volcanic aggregate. Slightly deficient in fine aggregate. Well compacted apart from occasional 1–3 mm air voids.
70.0 46 9.1
Notes to Table 5.1: a Average of two cores. b Average of 10 readings.
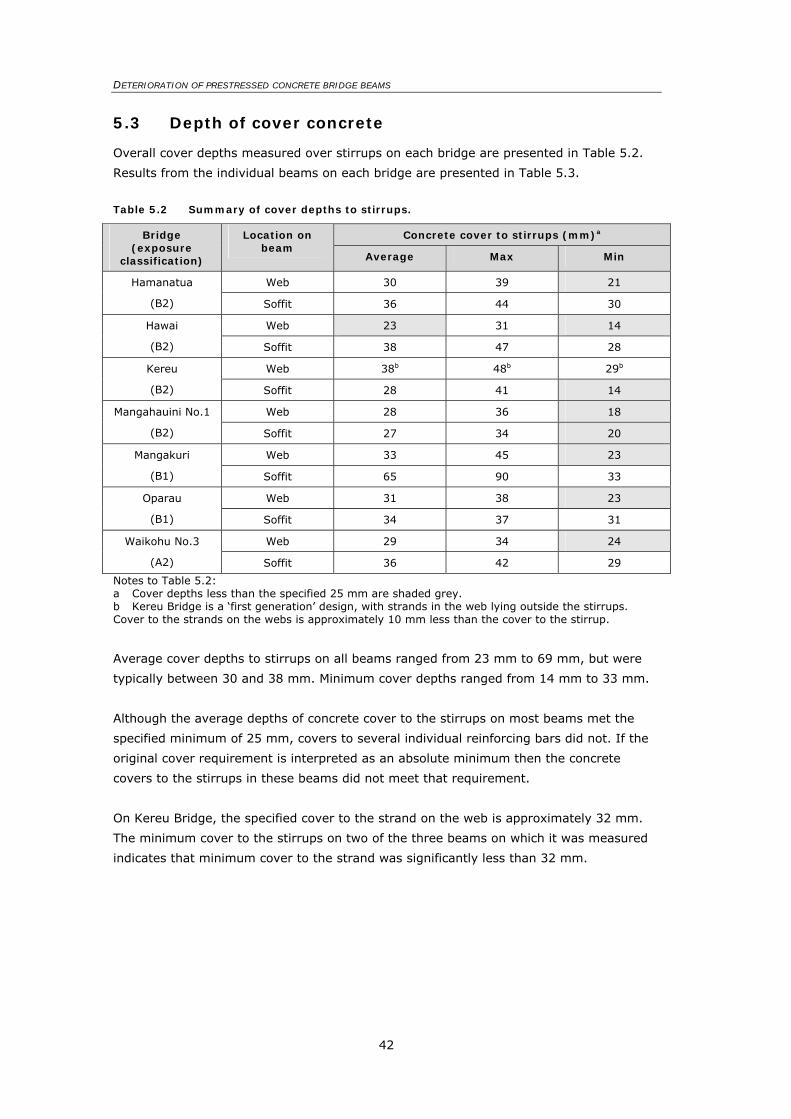
DETERIORATION OF PRESTRESSED CONCRETE BRIDGE BEAMS
42
5.3 Depth of cover concrete
Overall cover depths measured over stirrups on each bridge are presented in Table 5.2.
Results from the individual beams on each bridge are presented in Table 5.3.
Table 5.2 Summary of cover depths to stirrups.
Concrete cover to stirrups (mm)a Bridge (exposure
classification)
Location on beam
Average Max Min
Web 30 39 21 Hamanatua
(B2) Soffit 36 44 30
Web 23 31 14 Hawai
(B2) Soffit 38 47 28
Web 38b 48b 29b Kereu
(B2) Soffit 28 41 14
Web 28 36 18 Mangahauini No.1
(B2) Soffit 27 34 20
Web 33 45 23 Mangakuri
(B1) Soffit 65 90 33
Web 31 38 23 Oparau
(B1) Soffit 34 37 31
Web 29 34 24 Waikohu No.3
(A2) Soffit 36 42 29
Notes to Table 5.2: a Cover depths less than the specified 25 mm are shaded grey. b Kereu Bridge is a ‘first generation’ design, with strands in the web lying outside the stirrups. Cover to the strands on the webs is approximately 10 mm less than the cover to the stirrup.
Average cover depths to stirrups on all beams ranged from 23 mm to 69 mm, but were
typically between 30 and 38 mm. Minimum cover depths ranged from 14 mm to 33 mm.
Although the average depths of concrete cover to the stirrups on most beams met the
specified minimum of 25 mm, covers to several individual reinforcing bars did not. If the
original cover requirement is interpreted as an absolute minimum then the concrete
covers to the stirrups in these beams did not meet that requirement.
On Kereu Bridge, the specified cover to the strand on the web is approximately 32 mm.
The minimum cover to the stirrups on two of the three beams on which it was measured
indicates that minimum cover to the strand was significantly less than 32 mm.
5. Observations and test results
43
NZS 3101: 2006 defines minimum concrete cover depths for durability based on
environmental exposure and specified compressive strength. Using the durability design
approach of NZS 3101: 2006, and assuming a specified intended life of 100 years and a
concrete compressive strength of 40 MPa, the cover depths required for these prestressed
I-beams today would be as follows:
• A2 (inland) 35 mm,
• B1 (coastal perimeter) 40 mm,
• B2 (coastal frontage) 50 mm.
The specified cover of 25 mm and the measured cover depths are clearly deficient when
compared to these requirements.
Cover to the prestressing strand is unlikely to vary from that specified because the strand
is attached to the formwork in the designed positions and tensioned before concrete is
placed. The construction industry has previously expressed concern that cover may be
compromised by the concrete ‘sagging’ in the bottom flange as a result of inadequate
compaction. This would be evidenced by unevenness, laitance or bubbles on the upper
surface of the lower flange, or by plastic settlement cracking at the internal corner
between the web and the flange. No such features were observed on the beams
inspected; therefore, it was assumed that the cover to the strand was in accordance with
the beam design.
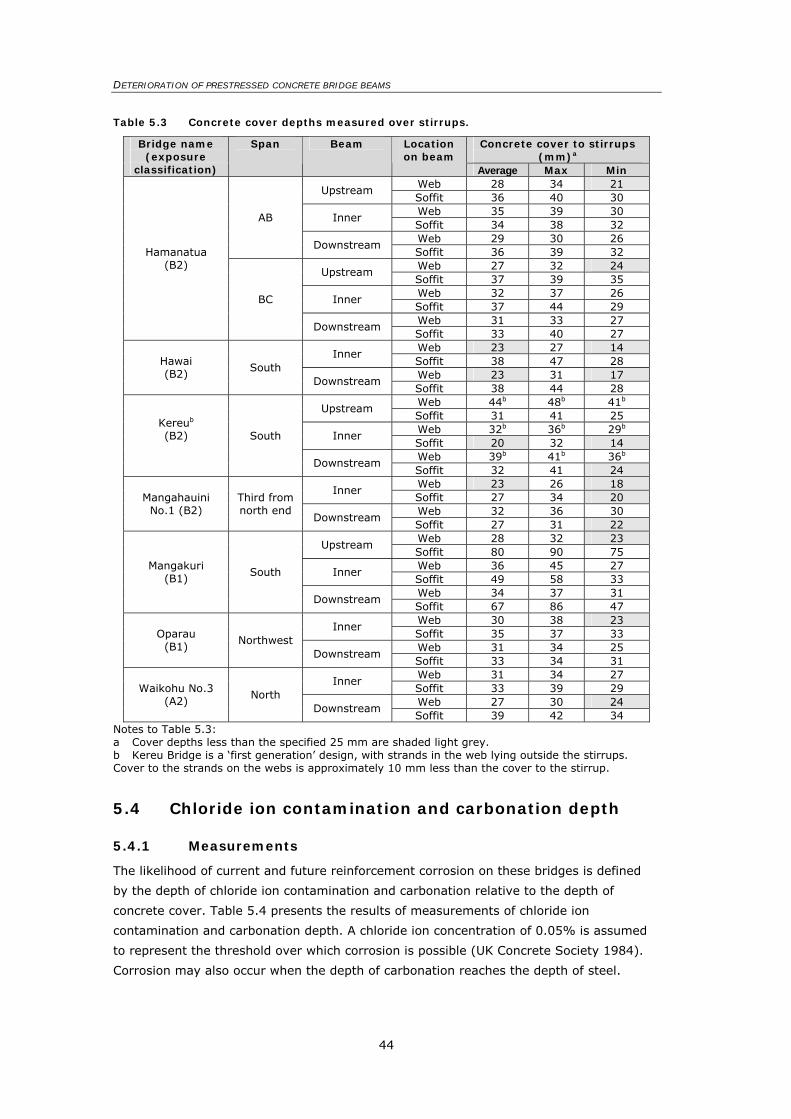
DETERIORATION OF PRESTRESSED CONCRETE BRIDGE BEAMS
44
Table 5.3 Concrete cover depths measured over stirrups.
Concrete cover to stirrups (mm)a
Bridge name (exposure
classification)
Span Beam Location on beam
Average Max Min Web 28 34 21 Upstream Soffit 36 40 30 Web 35 39 30 Inner Soffit 34 38 32 Web 29 30 26
AB
Downstream Soffit 36 39 32 Web 27 32 24 Upstream Soffit 37 39 35 Web 32 37 26 Inner Soffit 37 44 29 Web 31 33 27
Hamanatua (B2)
BC
Downstream Soffit 33 40 27 Web 23 27 14 Inner Soffit 38 47 28 Web 23 31 17
Hawai (B2)
South Downstream
Soffit 38 44 28 Web 44b 48b 41b Upstream Soffit 31 41 25 Web 32b 36b 29b Inner Soffit 20 32 14 Web 39b 41b 36b
Kereub (B2)
South
Downstream Soffit 32 41 24 Web 23 26 18
Inner Soffit 27 34 20 Web 32 36 30
Mangahauini No.1 (B2)
Third from north end
Downstream Soffit 27 31 22 Web 28 32 23
Upstream Soffit 80 90 75 Web 36 45 27
Inner Soffit 49 58 33 Web 34 37 31
Mangakuri (B1)
South
Downstream Soffit 67 86 47 Web 30 38 23
Inner Soffit 35 37 33 Web 31 34 25
Oparau (B1)
Northwest Downstream
Soffit 33 34 31 Web 31 34 27
Inner Soffit 33 39 29 Web 27 30 24
Waikohu No.3 (A2)
North Downstream
Soffit 39 42 34 Notes to Table 5.3: a Cover depths less than the specified 25 mm are shaded light grey. b Kereu Bridge is a ‘first generation’ design, with strands in the web lying outside the stirrups. Cover to the strands on the webs is approximately 10 mm less than the cover to the stirrup.
5.4 Chloride ion contamination and carbonation depth
5.4.1 Measurements
The likelihood of current and future reinforcement corrosion on these bridges is defined
by the depth of chloride ion contamination and carbonation relative to the depth of
concrete cover. Table 5.4 presents the results of measurements of chloride ion
contamination and carbonation depth. A chloride ion concentration of 0.05% is assumed
to represent the threshold over which corrosion is possible (UK Concrete Society 1984).
Corrosion may also occur when the depth of carbonation reaches the depth of steel.
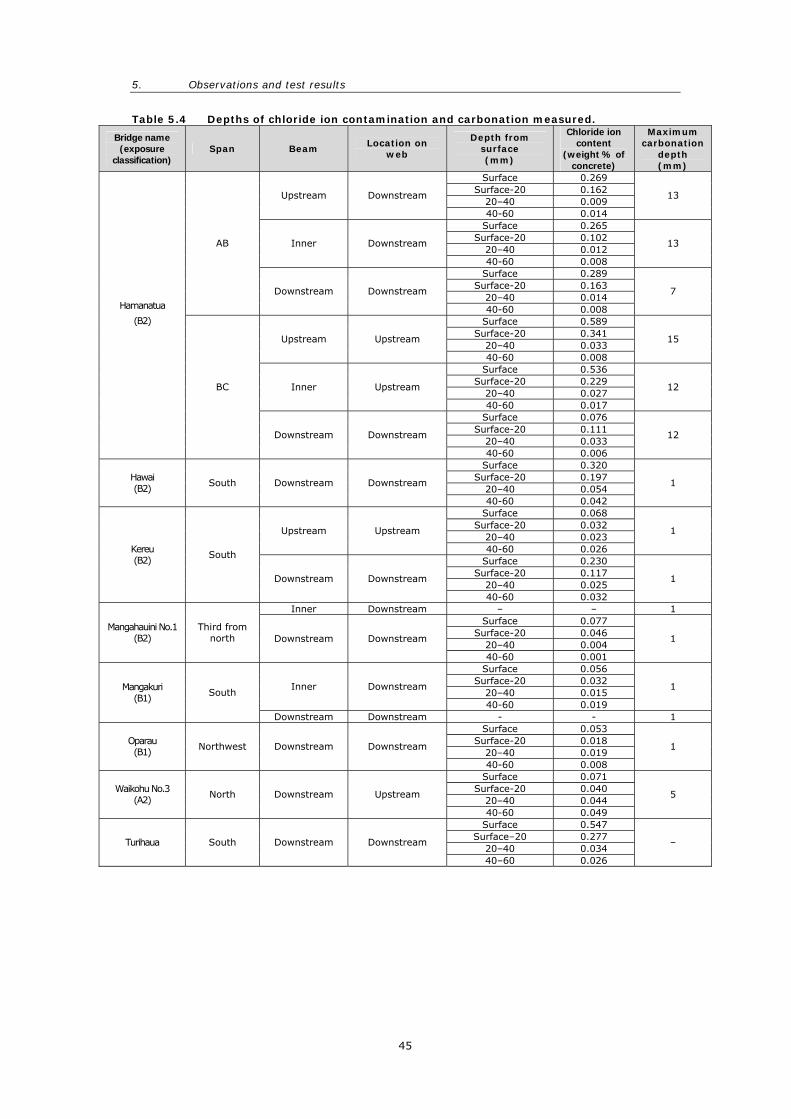
5. Observations and test results
45
Table 5.4 Depths of chloride ion contamination and carbonation measured.
Bridge name (exposure
classification) Span Beam
Location on web
Depth from surface (mm)
Chloride ion content
(weight % of concrete)
Maximum carbonation
depth (mm)
Surface 0.269 Surface-20 0.162
20–40 0.009 Upstream Downstream
40-60 0.014
13
Surface 0.265 Surface-20 0.102
20–40 0.012 Inner Downstream
40-60 0.008
13
Surface 0.289 Surface-20 0.163
20–40 0.014
AB
Downstream Downstream
40-60 0.008
7
Surface 0.589 Surface-20 0.341
20–40 0.033 Upstream Upstream
40-60 0.008
15
Surface 0.536 Surface-20 0.229
20–40 0.027 Inner Upstream
40-60 0.017
12
Surface 0.076 Surface-20 0.111
20–40 0.033
Hamanatua
(B2)
BC
Downstream Downstream
40-60 0.006
12
Surface 0.320 Surface-20 0.197
20–40 0.054 Hawai (B2)
South Downstream Downstream
40-60 0.042
1
Surface 0.068 Surface-20 0.032
20–40 0.023 Upstream Upstream
40-60 0.026
1
Surface 0.230 Surface-20 0.117
20–40 0.025
Kereu (B2)
South
Downstream Downstream
40-60 0.032
1
Inner Downstream – – 1 Surface 0.077
Surface-20 0.046 20–40 0.004
Mangahauini No.1 (B2)
Third from north Downstream Downstream
40-60 0.001
1
Surface 0.056 Surface-20 0.032
20–40 0.015 Inner Downstream
40-60 0.019
1 Mangakuri (B1)
South
Downstream Downstream - - 1 Surface 0.053
Surface-20 0.018 20–40 0.019
Oparau (B1) Northwest Downstream Downstream
40-60 0.008
1
Surface 0.071 Surface-20 0.040
20–40 0.044 Waikohu No.3
(A2) North Downstream Upstream
40-60 0.049
5
Surface 0.547 Surface–20 0.277
20–40 0.034 Turihaua South Downstream Downstream
40–60 0.026
–
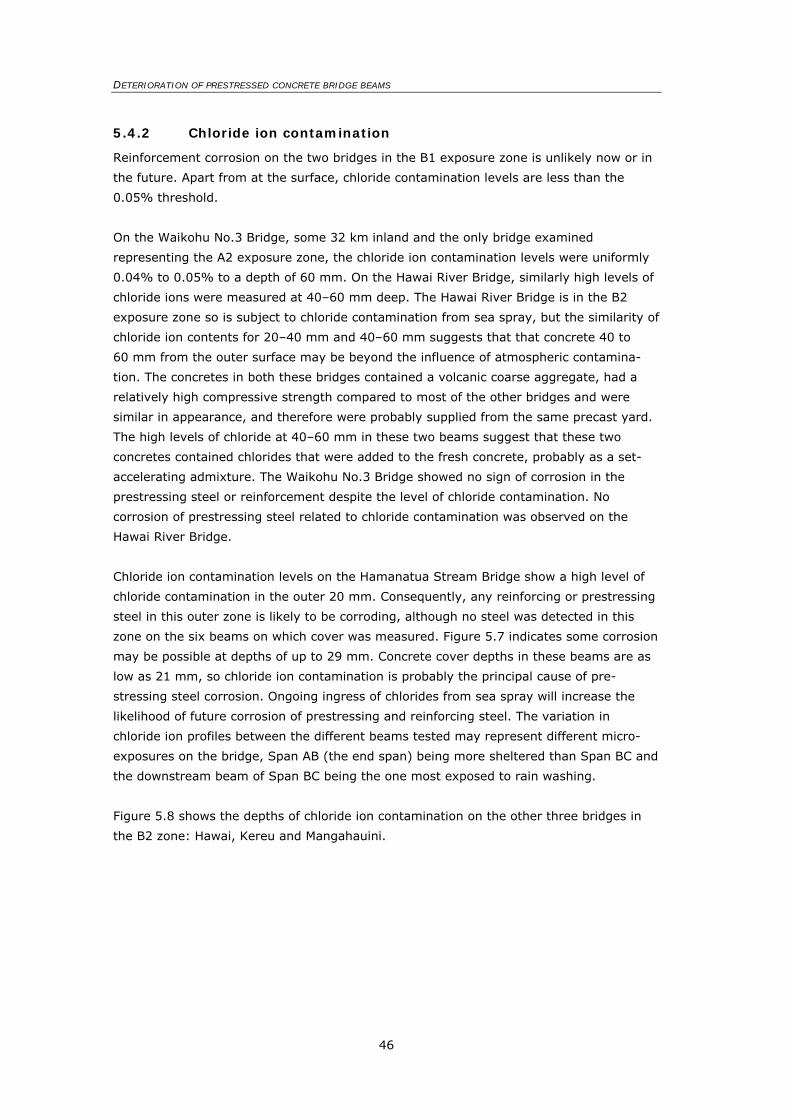
DETERIORATION OF PRESTRESSED CONCRETE BRIDGE BEAMS
46
5.4.2 Chloride ion contamination
Reinforcement corrosion on the two bridges in the B1 exposure zone is unlikely now or in
the future. Apart from at the surface, chloride contamination levels are less than the
0.05% threshold.
On the Waikohu No.3 Bridge, some 32 km inland and the only bridge examined
representing the A2 exposure zone, the chloride ion contamination levels were uniformly
0.04% to 0.05% to a depth of 60 mm. On the Hawai River Bridge, similarly high levels of
chloride ions were measured at 40–60 mm deep. The Hawai River Bridge is in the B2
exposure zone so is subject to chloride contamination from sea spray, but the similarity of
chloride ion contents for 20–40 mm and 40–60 mm suggests that that concrete 40 to
60 mm from the outer surface may be beyond the influence of atmospheric contamina-
tion. The concretes in both these bridges contained a volcanic coarse aggregate, had a
relatively high compressive strength compared to most of the other bridges and were
similar in appearance, and therefore were probably supplied from the same precast yard.
The high levels of chloride at 40–60 mm in these two beams suggest that these two
concretes contained chlorides that were added to the fresh concrete, probably as a set-
accelerating admixture. The Waikohu No.3 Bridge showed no sign of corrosion in the
prestressing steel or reinforcement despite the level of chloride contamination. No
corrosion of prestressing steel related to chloride contamination was observed on the
Hawai River Bridge.
Chloride ion contamination levels on the Hamanatua Stream Bridge show a high level of
chloride contamination in the outer 20 mm. Consequently, any reinforcing or prestressing
steel in this outer zone is likely to be corroding, although no steel was detected in this
zone on the six beams on which cover was measured. Figure 5.7 indicates some corrosion
may be possible at depths of up to 29 mm. Concrete cover depths in these beams are as
low as 21 mm, so chloride ion contamination is probably the principal cause of pre-
stressing steel corrosion. Ongoing ingress of chlorides from sea spray will increase the
likelihood of future corrosion of prestressing and reinforcing steel. The variation in
chloride ion profiles between the different beams tested may represent different micro-
exposures on the bridge, Span AB (the end span) being more sheltered than Span BC and
the downstream beam of Span BC being the one most exposed to rain washing.
Figure 5.8 shows the depths of chloride ion contamination on the other three bridges in
the B2 zone: Hawai, Kereu and Mangahauini.
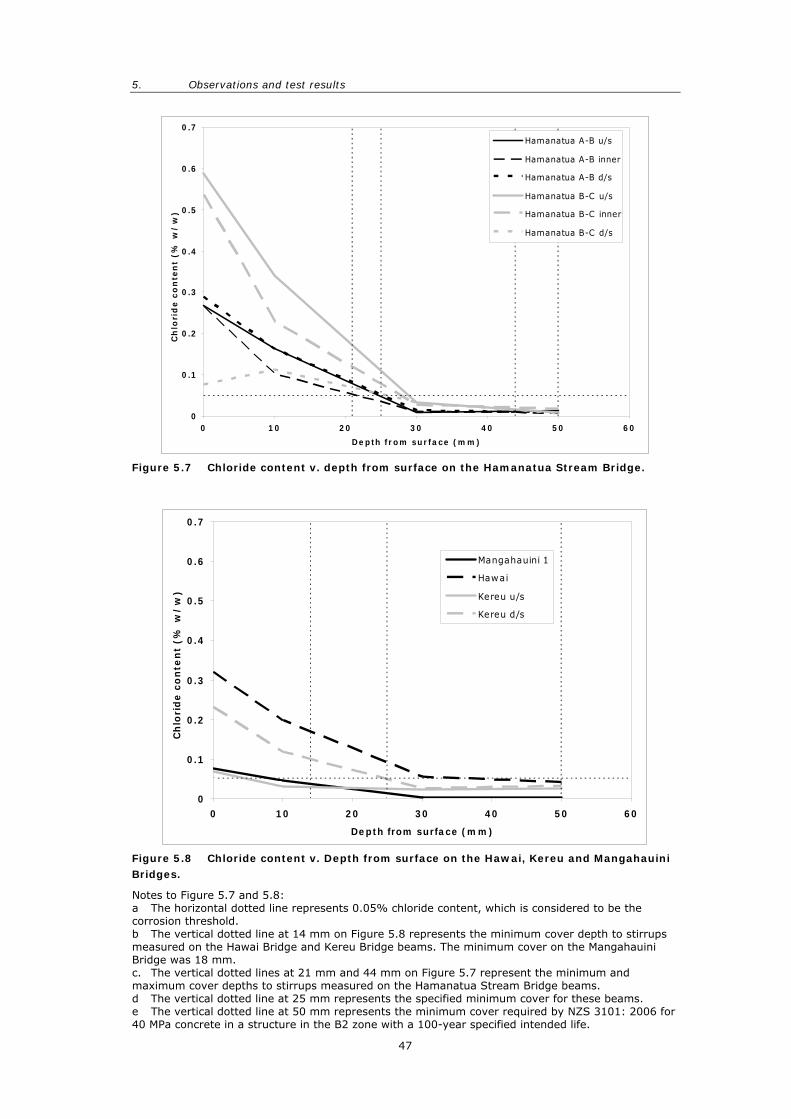
5. Observations and test results
47
0
0.1
0.2
0.3
0.4
0.5
0.6
0.7
0 10 20 30 40 50 60
Depth from surface (mm)
Ch
lori
de
co
nte
nt
(% w
/w
)
Hamanatua A-B u/s
Hamanatua A-B inner
Hamanatua A-B d/s
Hamanatua B-C u/s
Hamanatua B-C inner
Hamanatua B-C d/s
Figure 5.7 Chloride content v. depth from surface on the Hamanatua Stream Bridge.
0
0.1
0.2
0.3
0.4
0.5
0.6
0.7
0 10 20 30 40 50 60
Depth from surface (mm)
Ch
lori
de
co
nte
nt
(% w
/w
)
Mangahauini 1
Hawai
Kereu u/s
Kereu d/s
Figure 5.8 Chloride content v. Depth from surface on the Hawai, Kereu and Mangahauini Bridges.
Notes to Figure 5.7 and 5.8: a The horizontal dotted line represents 0.05% chloride content, which is considered to be the corrosion threshold. b The vertical dotted line at 14 mm on Figure 5.8 represents the minimum cover depth to stirrups measured on the Hawai Bridge and Kereu Bridge beams. The minimum cover on the Mangahauini Bridge was 18 mm. c. The vertical dotted lines at 21 mm and 44 mm on Figure 5.7 represent the minimum and maximum cover depths to stirrups measured on the Hamanatua Stream Bridge beams. d The vertical dotted line at 25 mm represents the specified minimum cover for these beams. e The vertical dotted line at 50 mm represents the minimum cover required by NZS 3101: 2006 for 40 MPa concrete in a structure in the B2 zone with a 100-year specified intended life.
DETERIORATION OF PRESTRESSED CONCRETE BRIDGE BEAMS
48
On the Kereu Bridge, steel with less than the specified 25 mm cover is likely to be
corroding because of the presence of chlorides. Indeed, cracking caused by corroding
reinforcement was observed on the beams on which the cover and chloride contamination
were measured.
On the Mangahauini Bridge, chloride contamination levels at depths greater than 20 mm
were below the threshold level. At less than 20 mm, they were close to the threshold.
Isolated stirrups close to the concrete surface on the beam webs were corroding.
Chloride ion contamination levels on the Kereu and Hawai River Bridges are similar to
those measured on the Hamanatua Stream Bridge, with reinforcement up to a depth of
30 mm likely to corrode because of the presence of chloride ions, particularly steel with
less than the 25 mm specified cover. Some conventional reinforcing steel is already
corroding on these bridges where covers are particularly low. The chloride contamination
levels therefore indicate that the likelihood of current and future corrosion is high.
The measured chloride profiles indicate that chloride induced corrosion is unlikely at a
cover depth of 50 mm, the depth specified by NZS 3101: 2006 for concrete for 40 MPa
concrete in a structure in the B2 zone with a 100-year specified intended life. This is
encouraging for designers building structures in accordance with this standard.
Chloride ion contamination was also measured on the Turihaua Stream Bridge (SH 35,
RP308/3.76). The results are included at the end of Table 5.4. The chloride ion profiles
are very similar to those recorded on the Hamanatua and Kereu Bridges, which are in
similar environments, despite the Turihaua Stream Bridge being 12–14 years younger.
Cover depths to the stirrups for beams of this design were 32 mm to the top and soffit
surfaces, a minimum of 20 mm to the side in the shear key area and a minimum of
58 mm to the exposed side of the outer unit. Actual cover depths were not measured on
the structure during this investigation, or in 1991 when chloride contamination was
previously measured. The difference between the 1991 data and the 2006 data is
discussed in Chapter 6.3.
5. Observations and test results
49
5.4.3 Carbonation depths
Carbonation depths in the beams on the Hamanatua Stream Bridge range from 7 to
15 mm. The only other bridge with a carbonation depth greater than 1 mm was the
Waikohu No.3 Bridge, which is in the A2 exposure zone.
The ongoing carbonation rate can be estimated using the relationship:
X = k.t1/2 [Equation 1]
Where: X = the position of the carbonation front after time t
k = a constant dependant on the porosity of the concrete, the relative
humidity and carbon dioxide content of the environment, and the amount
of reactable calcium hydroxide in the concrete.
Using this relationship and the measured carbonation depths, the minimum total time for
the carbonation front to reach a depth of 21 mm (i.e. the minimum depth of cover) on the
Hamanatua Stream Bridge is 78 years from the time of construction (38 years from the
time of this investigation). This indicates that carbonation is unlikely to cause
reinforcement corrosion now or in the immediate future but may do so in foreseeable life
of the bridge.
Using the same method, the carbonation front was calculated to reach the outermost
reinforcement on the Waikohu No.3 Bridge in approximately 620 years. Therefore,
carbonation on this bridge and on the other five bridges on which carbonation was
measured (which have carbonation depths of 1 mm or less) poses no risk to the
reinforcement, now or in the foreseeable future.
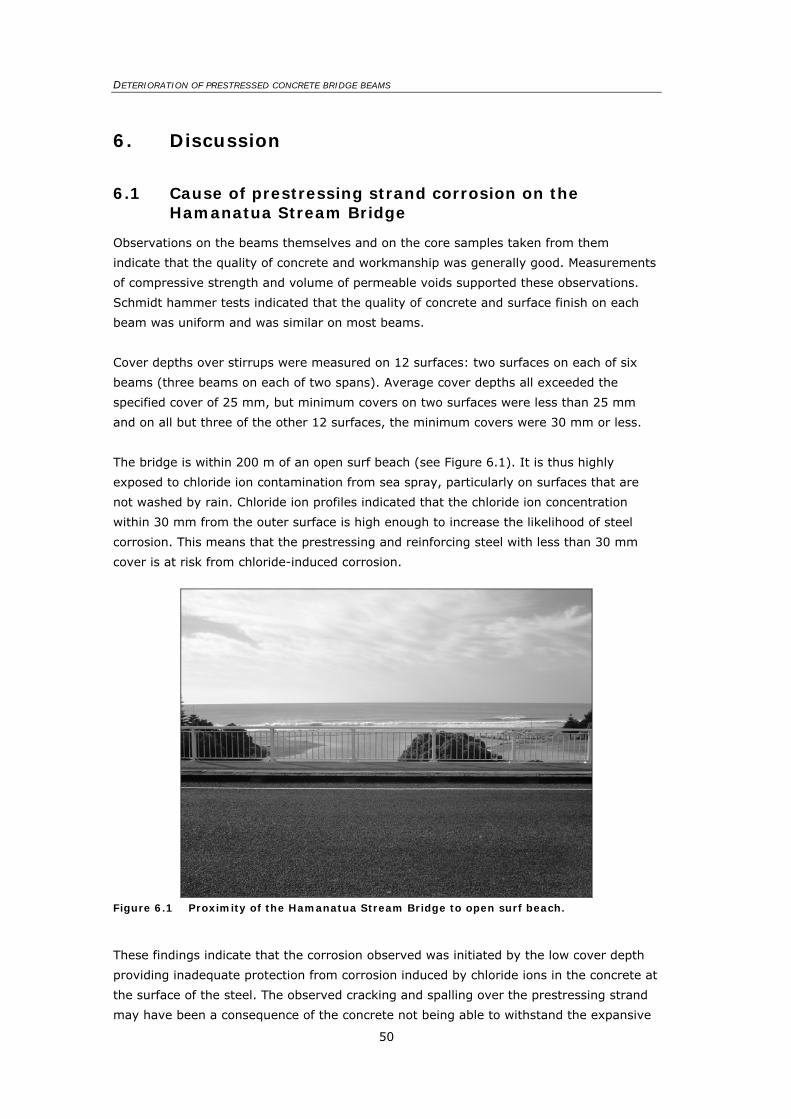
DETERIORATION OF PRESTRESSED CONCRETE BRIDGE BEAMS
50
6. Discussion
6.1 Cause of prestressing strand corrosion on the Hamanatua Stream Bridge
Observations on the beams themselves and on the core samples taken from them
indicate that the quality of concrete and workmanship was generally good. Measurements
of compressive strength and volume of permeable voids supported these observations.
Schmidt hammer tests indicated that the quality of concrete and surface finish on each
beam was uniform and was similar on most beams.
Cover depths over stirrups were measured on 12 surfaces: two surfaces on each of six
beams (three beams on each of two spans). Average cover depths all exceeded the
specified cover of 25 mm, but minimum covers on two surfaces were less than 25 mm
and on all but three of the other 12 surfaces, the minimum covers were 30 mm or less.
The bridge is within 200 m of an open surf beach (see Figure 6.1). It is thus highly
exposed to chloride ion contamination from sea spray, particularly on surfaces that are
not washed by rain. Chloride ion profiles indicated that the chloride ion concentration
within 30 mm from the outer surface is high enough to increase the likelihood of steel
corrosion. This means that the prestressing and reinforcing steel with less than 30 mm
cover is at risk from chloride-induced corrosion.
Figure 6.1 Proximity of the Hamanatua Stream Bridge to open surf beach.
These findings indicate that the corrosion observed was initiated by the low cover depth
providing inadequate protection from corrosion induced by chloride ions in the concrete at
the surface of the steel. The observed cracking and spalling over the prestressing strand
may have been a consequence of the concrete not being able to withstand the expansive
6. Discussion
51
stresses imposed by the development of corrosion products on the steel surface. It may
also have been facilitated by strain effects associated with loss of prestress caused by
failure of the strand-concrete bond.
The cover concrete protects the strand from ingress of chlorides along the length of the
beam, but leaking deck joints may increase the risk of corrosion at the beam ends by
providing a source of moisture. Staining on the pier caps shown in Figure 4.5 suggests
that this may also be a risk on the Hamanatua Stream Bridge, although no evidence of
associated corrosion was seen. Once bond is lost between the strand and the cover
concrete, water may pass more easily along the steel/concrete interface, further
increasing the corrosion risk.
Tensile loads, hydrogen embrittlement, fretting and/or fatigue may eventually cause the
strand to break sooner than conventional reinforcing steel corroding at the same rate (see
Chapter 6.5). The strand on these beams had not yet broken at the time of inspection, so
it was not possible to determine the likely significance of these factors by microscope
analysis, the usual means of analysing failure surfaces.
Similarly, the composition of the prestressing steel may have contributed to its corrosion
resistance, but without being able to sample a piece of the strand from the structure
safely, its composition, and whether it complies with past or current specifications,
remains unknown.
Because the strand could not be sampled, more work than originally planned would have
been needed to ascertain the influence of stress, hydrogen embrittlement, fretting and/or
fatigue on the ultimate failure mode, and to identify whether the prestressing steel used
in this bridge had a particularly low corrosion resistance and whether the same
prestressing steel was used in all bridges of this design. Once the low cover depths and
the high levels of chloride contamination had been identified, it was considered
unnecessary to examine these aspects within the current project. Further investigation of
these topics may help to optimise mitigation techniques but is not essential for
maintaining serviceability.
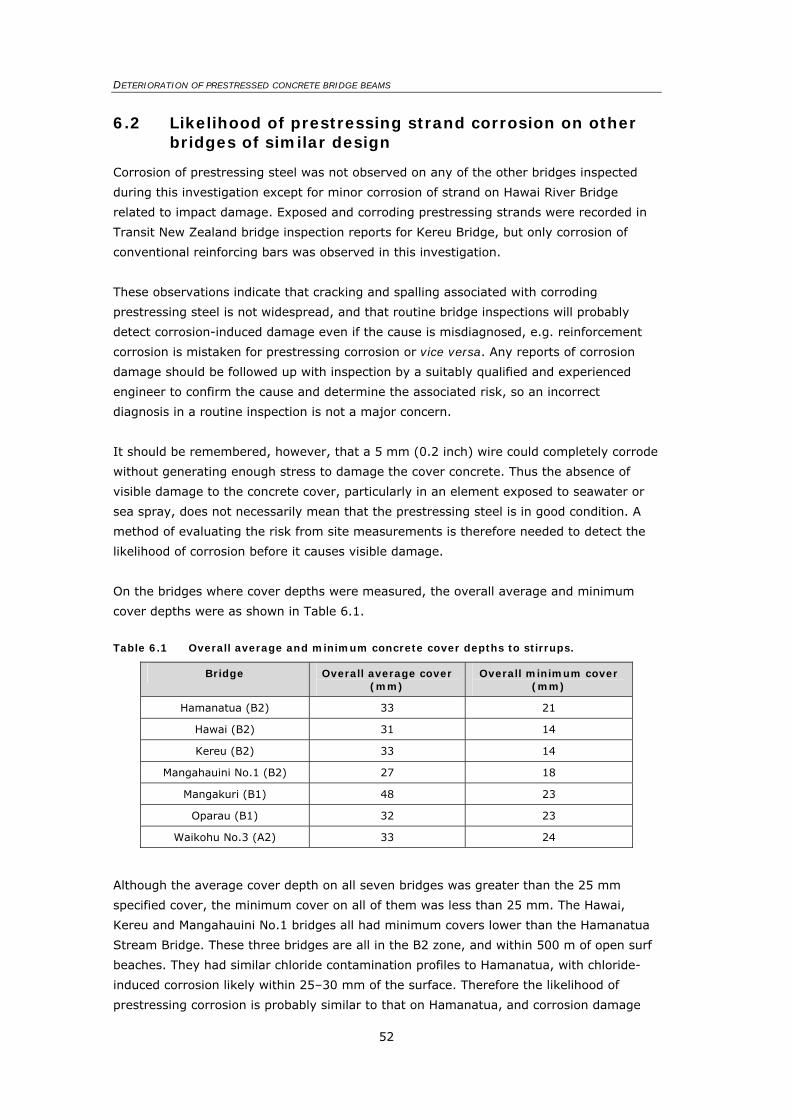
DETERIORATION OF PRESTRESSED CONCRETE BRIDGE BEAMS
52
6.2 Likelihood of prestressing strand corrosion on other bridges of similar design
Corrosion of prestressing steel was not observed on any of the other bridges inspected
during this investigation except for minor corrosion of strand on Hawai River Bridge
related to impact damage. Exposed and corroding prestressing strands were recorded in
Transit New Zealand bridge inspection reports for Kereu Bridge, but only corrosion of
conventional reinforcing bars was observed in this investigation.
These observations indicate that cracking and spalling associated with corroding
prestressing steel is not widespread, and that routine bridge inspections will probably
detect corrosion-induced damage even if the cause is misdiagnosed, e.g. reinforcement
corrosion is mistaken for prestressing corrosion or vice versa. Any reports of corrosion
damage should be followed up with inspection by a suitably qualified and experienced
engineer to confirm the cause and determine the associated risk, so an incorrect
diagnosis in a routine inspection is not a major concern.
It should be remembered, however, that a 5 mm (0.2 inch) wire could completely corrode
without generating enough stress to damage the cover concrete. Thus the absence of
visible damage to the concrete cover, particularly in an element exposed to seawater or
sea spray, does not necessarily mean that the prestressing steel is in good condition. A
method of evaluating the risk from site measurements is therefore needed to detect the
likelihood of corrosion before it causes visible damage.
On the bridges where cover depths were measured, the overall average and minimum
cover depths were as shown in Table 6.1.
Table 6.1 Overall average and minimum concrete cover depths to stirrups.
Bridge Overall average cover (mm)
Overall minimum cover (mm)
Hamanatua (B2) 33 21
Hawai (B2) 31 14
Kereu (B2) 33 14
Mangahauini No.1 (B2) 27 18
Mangakuri (B1) 48 23
Oparau (B1) 32 23
Waikohu No.3 (A2) 33 24
Although the average cover depth on all seven bridges was greater than the 25 mm
specified cover, the minimum cover on all of them was less than 25 mm. The Hawai,
Kereu and Mangahauini No.1 bridges all had minimum covers lower than the Hamanatua
Stream Bridge. These three bridges are all in the B2 zone, and within 500 m of open surf
beaches. They had similar chloride contamination profiles to Hamanatua, with chloride-
induced corrosion likely within 25–30 mm of the surface. Therefore the likelihood of
prestressing corrosion is probably similar to that on Hamanatua, and corrosion damage
6. Discussion
53
may be imminent or the strand may already be corroding but without having yet
damaged the cover concrete. Kereu Bridge, being a ‘first generation’ design, may be at
greater risk than the other three bridges in the B2 zone because the strand in its beams’
web is outside the stirrup, and therefore is both unconfined and subject to higher chloride
concentrations.
Despite having minimum cover depths similar to Hamanatua, the likelihood of corrosion in
the B1 bridges is lower because the concrete in this exposure zone is less exposed to sea
spray and therefore the level of chloride ion contamination in the concrete was much
lower.
This suggests that corrosion caused by the ingress of chloride ions is likely in bridge
beams of this design in the B2 zone (and, by implication, on bridges in the C zone) but
unlikely in bridges in the B1 and A2 zones.
Chloride ion profiles measured in two of the bridges suggested, however, that some
precasters may have used calcium chloride accelerating admixtures in the concrete to
reduce the turnaround time for moulds and/or to allow the beams to be stressed at an
earlier age. In the presence of sufficient moisture, steel in concrete containing calcium
chloride will be more likely to corrode than steel in concrete not containing calcium
chloride, particularly if the concrete is also exposed to external sources of chlorides.
Identification of the precaster that produced the beams for the two bridges that were
found to contain chlorides from such admixtures will help to identify other bridges with
beams from the same source and therefore at similar risk. Measuring chloride profiles on
bridges is probably the only way to identify beams from other manufacturers that may be
affected. No corrosion was seen on the bridge in the A2 zone that was thought to contain
calcium chloride in the concrete, so the risk to such bridges in the A2 and B1 zones may
still be low. The risk to bridges in the B2 zone will, however, be significant.
The results from the Turihaua Stream Bridge, representing a double hollow core HN-HO-
72 design, suggest that bridges of this design in the B2 zone may also be at risk from
chloride-induced corrosion if any reinforcing or prestressing steel has a cover depth less
than 28–30 mm from the surface (see Chapter 6.4). Further investigation is needed to
find out how the overall risk to these bridges compares to the risk to the pre-1973
bridges.
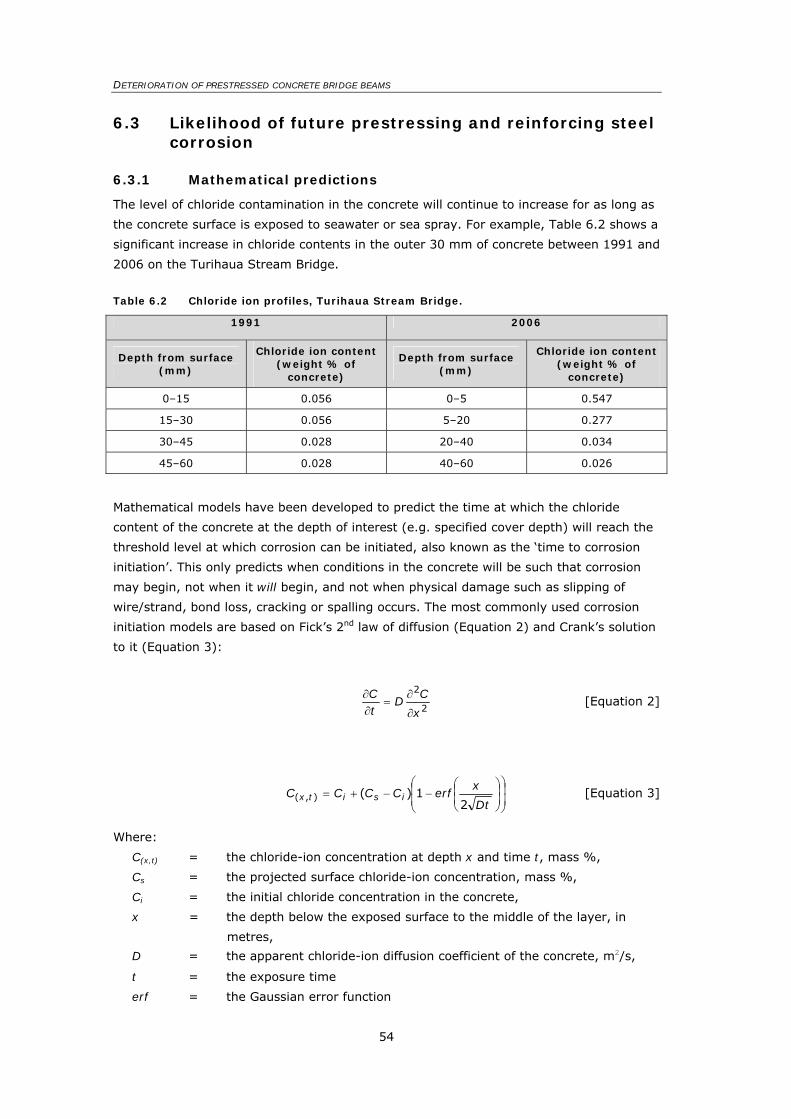
DETERIORATION OF PRESTRESSED CONCRETE BRIDGE BEAMS
54
6.3 Likelihood of future prestressing and reinforcing steel corrosion
6.3.1 Mathematical predictions
The level of chloride contamination in the concrete will continue to increase for as long as
the concrete surface is exposed to seawater or sea spray. For example, Table 6.2 shows a
significant increase in chloride contents in the outer 30 mm of concrete between 1991 and
2006 on the Turihaua Stream Bridge.
Table 6.2 Chloride ion profiles, Turihaua Stream Bridge.
1991 2006
Depth from surface (mm)
Chloride ion content (weight % of
concrete)
Depth from surface (mm)
Chloride ion content (weight % of
concrete)
0–15 0.056 0–5 0.547
15–30 0.056 5–20 0.277
30–45 0.028 20–40 0.034
45–60 0.028 40–60 0.026
Mathematical models have been developed to predict the time at which the chloride
content of the concrete at the depth of interest (e.g. specified cover depth) will reach the
threshold level at which corrosion can be initiated, also known as the ‘time to corrosion
initiation’. This only predicts when conditions in the concrete will be such that corrosion
may begin, not when it will begin, and not when physical damage such as slipping of
wire/strand, bond loss, cracking or spalling occurs. The most commonly used corrosion
initiation models are based on Fick’s 2nd law of diffusion (Equation 2) and Crank’s solution
to it (Equation 3):
2
2
x
CD
tC
∂
∂=
∂∂
[Equation 2]
⎟⎟⎠
⎞⎜⎜⎝
⎛⎟⎟⎠
⎞⎜⎜⎝
⎛−−+=
Dt
xerfCCCC isitx
21)(),( [Equation 3]
Where:
C(x,t) = the chloride-ion concentration at depth x and time t, mass %,
Cs = the projected surface chloride-ion concentration, mass %,
Ci = the initial chloride concentration in the concrete,
x = the depth below the exposed surface to the middle of the layer, in
metres,
D = the apparent chloride-ion diffusion coefficient of the concrete, m2/s,
t = the exposure time
erf = the Gaussian error function
6. Discussion
55
This approach and commercially available models based on it are described by Lee &
Chisholm (2005). Used in its simplest form, i.e. solving equation 3, it introduces several
assumptions that reduce the accuracy of the prediction:
• Diffusion is the only mechanism of chloride ingress.
• Concrete properties are uniform throughout the placement.
• Corrosion is initiated when a critical chloride ion concentration is exceeded at the
steel surface, ignoring other aspects of chemistry that may affect corrosion
initiation.
• Exposure is uniform over the entire surface of an element.
• Chloride ingress is independent of applied stress.
• A particular concentration of chloride ions is present at the concrete surface.
• Concrete properties change with time at a particular rate.
Statistical methods have been proposed to manage the natural variability in the input
values (e.g. Khatri & Sirivivatnanon (2004), Polder & de Rooij (2005), and Zhang &
Lounis (2006)). In most practical applications, however, sufficient information about the
variability is unlikely to be available. Therefore, instead of using Equation 3 to predict a
precise time to corrosion initiation, it may be more appropriate to use it to estimate the
time to corrosion initiation within an interval that reflects the accuracy of the input data.
In addition to models predicting when corrosion will be initiated, models have also been
developed to predict when the first damage will occur. These, however, require more
input data and were considered inappropriate for the general nature of this research.
The use of any modelling technique for strategic management of a bridge network will
involve a bridge-by-bridge evaluation of corrosion risk, similar to the recent seismic
evaluation and the scour risk assessment currently underway. This will require the
confidence limits to be established for any model used. The model and the confidence
limit may vary between prestressed and reinforced concrete. This investigation examined
whether a simple model based on Fick’s Law might, in principle, be suitable for
prestressed beams but did not seek to establish confidence limits associated with the
model.
For prestressed bridge beams such as those examined in this investigation, it is
reasonable to assume that the bond may be lost shortly after corrosion initiation. This
assumption can be used in a simple strength evaluation model to estimate when each
strand/wire can no longer be relied upon in individual elements.
The time to corrosion initiation was calculated from Equation 3 for each element on which
chloride profiles were measured. The cover depths used as the critical value were the
average cover depths to the stirrups as measured on the webs of the beams from which
the samples were taken for chloride analysis. The depth at which the chloride
concentration reached the threshold value of 0.05% by weight of concrete was also
calculated. The results are in shown Table 6.3. Table 6.3 also presents results based on a
chloride threshold of 0.03%.
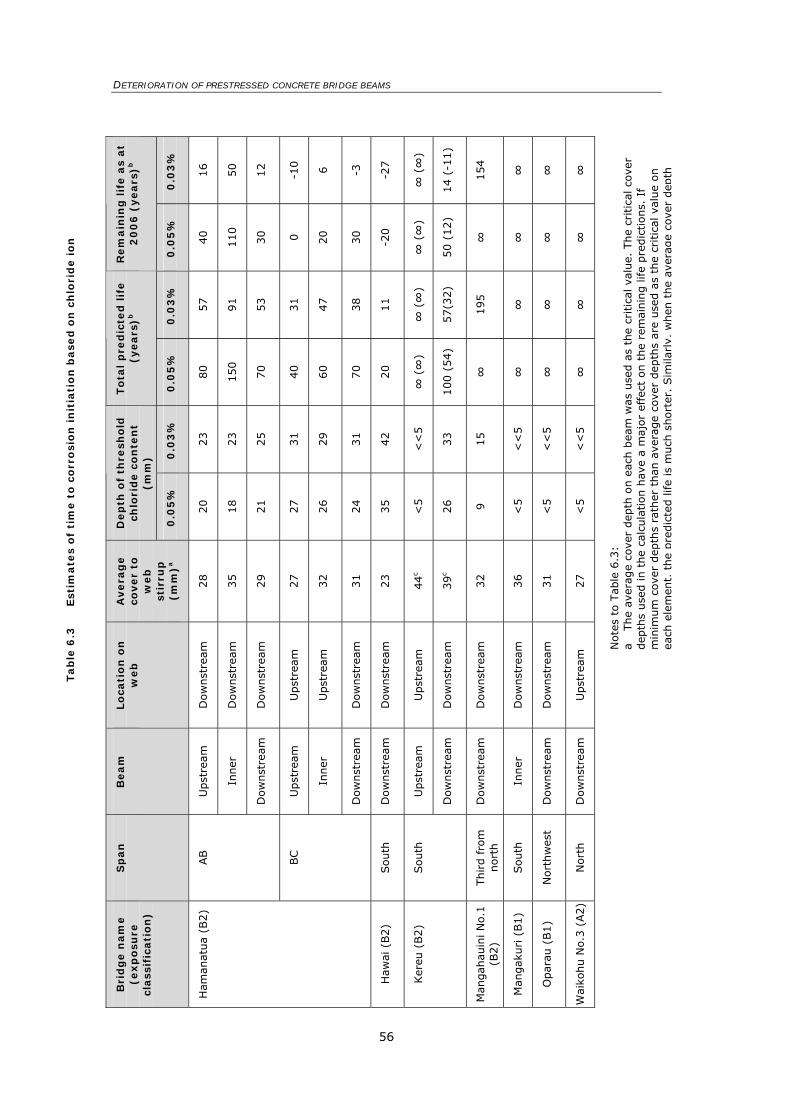
DETERIORATION OF PRESTRESSED CONCRETE BRIDGE BEAMS
56
0.0
3%
16
50
12
-10
6
-3
-27
∞ (∞
)
14 (
-11)
154
∞
∞
∞
Rem
ain
ing
lif
e a
s at
20
06
(years
)b
0.0
5%
40
110
30
0
20
30
-20
∞ (∞
)
50 (
12)
∞
∞
∞
∞
0.0
3%
57
91
53
31
47
38
11
∞ (∞
)
57(3
2)
195
∞
∞
∞
To
tal
pre
dic
ted
lif
e
(years
)b
0.0
5%
80
150
70
40
60
70
20
∞ (∞
)
100 (
54)
∞
∞
∞
∞
0.0
3%
23
23
25
31
29
31
42
<<
5
33
15
<<
5
<<
5
<<
5
Dep
th o
f th
resh
old
ch
lori
de c
on
ten
t (m
m)
0.0
5%
20
18
21
27
26
24
35
<5
26
9
<5
<5
<5
Avera
ge
cover
to
web
st
irru
p
(mm
)a
28
35
29
27
32
31
23
44
c
39
c
32
36
31
27
Lo
cati
on
on
w
eb
Dow
nst
ream
Dow
nst
ream
Dow
nst
ream
Upst
ream
Upst
ream
Dow
nst
ream
Dow
nst
ream
Upst
ream
Dow
nst
ream
Dow
nst
ream
Dow
nst
ream
Dow
nst
ream
Upst
ream
Beam
Upst
ream
Inner
Dow
nst
ream
Upst
ream
Inner
Dow
nst
ream
Dow
nst
ream
Upst
ream
Dow
nst
ream
Dow
nst
ream
Inner
Dow
nst
ream
Dow
nst
ream
Sp
an
AB
BC
South
South
Third f
rom
nort
h
South
Nort
hw
est
Nort
h
Bri
dg
e n
am
e
(exp
osu
re
class
ific
ati
on
)
Ham
anatu
a (B
2)
Haw
ai (
B2)
Ker
eu (
B2)
Man
gah
auin
i N
o.1
(B
2)
Man
gak
uri (
B1)
Opar
au (
B1)
Wai
kohu N
o.3
(A2)
Tab
le 6
.3
Est
imate
s o
f ti
me t
o c
orr
osi
on
in
itia
tio
n b
ase
d o
n c
hlo
rid
e i
on
Note
s to
Tab
le 6
.3:
a The
aver
age
cove
r dep
th o
n e
ach b
eam
was
use
d a
s th
e cr
itic
al v
alue.
The
critic
al c
ove
r dep
ths
use
d in t
he
calc
ula
tion h
ave
a m
ajor
effe
ct o
n t
he
rem
ainin
g life
pre
dic
tions.
If
min
imum
cove
r dep
ths
rath
er t
han
ave
rage
cove
r dep
ths
are
use
d a
s th
e cr
itic
al v
alue
on
each
ele
men
t , t
he
pre
dic
ted life
is m
uch
short
er.
Sim
ilarl
y, w
hen
the
aver
age
cove
r dep
th
6. Discussion
57
6.3.2 Discussion
Although at a very simple level, these predictions support the site observations. They
show that corrosion is unlikely on the three bridges in the B1 and A2 exposure zones
within the foreseeable future. Of the bridges in the B2 zone, corrosion is also unlikely
within the foreseeable future on one element on the Kereu and Mangahauini No.1 Bridges.
Corrosion has already been initiated on one element of the Hawai and Hamanatua
Bridges, and may be initiated on other elements before these bridges are 100 years old.
Corrosion may also be initiated on one element of the Kereu Bridge at around 100 years.
The calculations also show that on many of the beams on bridges in the B2 exposure
zone, the depth at which the chloride content had reached the threshold level of 0.05%
was close to or less than the specified cover depth of 25 mm. Consequently, corrosion
initiation is imminent on many of these beams. On the B1 and A2 bridges, however, the
chloride content was this high only very close to the exposed surface.
Closer examination of the data in Table 6.3 reveals some inconsistencies. For example, on
the Hamanatua Stream Bridge, the model predicts a 40-year service life at the location
where 27 mm minimum cover was recorded. This suggests corrosion of stirrups would be
initiated at 40 years, i.e. in 2006. However, extensive corrosion of prestressing strand
had already been observed in 2004, suggesting that corrosion was initiated earlier than
the model had predicted. The actual cause of the discrepancy was not investigated, but
several factors may have contributed.
The most likely factor is the chloride concentration used as the ‘threshold’ value. In this
investigation, 0.05% chloride ion by weight of concrete was used as the critical chloride
concentration. A lower value, such as 0.03% (see Chapter 3.3.6), may be more
appropriate. Table 6.3 shows that on the basis of a threshold of 0.03%, the corrosion was
initiated about ten years ago, which corresponds with observations. This threshold value
also suggests that corrosion damage is imminent on one beam of the Kereu Bridge.
Further investigation is needed to determine the most appropriate threshold value.
Other factors are as follows:
• The cover depths measured to the lower corroding strand shown in Figure 5.1
were 55 mm from the beam soffit (design cover is approximately 50 mm) and
35 mm from the side of the beam flange (design cover estimated from the
drawing is 43 mm). These measured covers to the strand are both greater than the
27 mm average cover to the web stirrup upon which the prediction was based.
Therefore the discrepancy did not result from overestimation of cover.
• The apparently premature corrosion observed may be a consequence of an
elevated chloride concentration resulting from chloride ingress from both the
side and soffit surface. The flange may be slightly more exposed to chlorides and to
rain, and therefore may be more susceptible than the web to chloride ion ingress and
faster corrosion rates.
• Or it may have been related to the sampling technique used in this investigation.
Although appropriate for determining the approximate depth of chloride contamination
DETERIORATION OF PRESTRESSED CONCRETE BRIDGE BEAMS
58
and background chloride levels, 20 mm is a relatively coarse depth increment to
sample when considering cover depths of 50 mm or less, and smaller increments such
as 15 mm or even 10 mm may be more appropriate for chloride ingress data that are
to be used for predictive modelling.
Several factors will contribute to inherent inaccuracies in any modelling technique, even
when the surface of interest is sampled, the actual cover depths are used and samples
taken at small depth increments. These include the variation in surface chloride contents,
cover depths and concrete permeability over the length and height of an individual
surface, and the relative roles of absorption and diffusion in the ingress of chloride into
the concrete. This variability is not practical to quantify for every surface on every
structure; therefore the apparent discrepancy between the observed and predicted
behaviour may be seen as an indicator of the inherent accuracy of the modelling
approach. Nevertheless, both the observations and the model predict a service life shorter
than 50 years, which although an imprecise interpretation, is still an important one.
6.3.3 Service life requirements
How do these predictions relate to Transit New Zealand’s service life requirements?
Transit New Zealand bridges must be designed to achieve a 100-year service life, which is
defined as the life beyond which the bridge is expected to become functionally obsolete or
uneconomic to maintain in a condition adequate for it to perform its functional
requirements. It is equivalent to the NZS 3101/New Zealand Building Code (1992)
definition of specified intended life, which requires that no major reconstruction or
rehabilitation be required within that period, although routine maintenance may be
carried out. The commentary to NZS 3101:2006 points out that normal maintenance may
include repair of some surface cracking or minor spalling. It recommends using the Bridge
Manual (TNZ 2003) definition of ‘major renovation’, i.e. maintenance that is necessary to
maintain the strength, ductility capacity or serviceability of a bridge to fulfil its functional
requirements and that exceeds 20% of the replacement cost of the bridge. This implies
that significant damage must not be incurred within 100 years, although minor damage
may be acceptable (e.g. isolated spalls over local areas of inadequate cover). Corrosion
initiation within 100 years may therefore be acceptable, but corrosion damage that affects
serviceability within 100 years would not be acceptable. Because of the inaccuracies
inherent in the Fick’s Law approach to predicting corrosion activity, in this investigation, a
time to corrosion initiation of 100 years is considered, for strategic asset management
purposes, to represent a conservative estimate of time to corrosion damage of the rebar
and therefore to the end of design life. It is a less conservative estimate of time to
corrosion damage when considering prestressing steel because of the increased risks
associated with corrosion of prestressing steel.
For conventionally reinforced bridges, the ultimate limit state normally governs structural
limitations; whereas on prestressed structures, the serviceability limit state normally
governs design. Use of the time to corrosion initiation to define the end of ‘service life’ for
prestressed structures is in accordance with this approach.
6. Discussion
59
Overall, the predictions in Table 6.3 show that if a 100-year service life is to be achieved
or exceeded on bridges of this design in the B2 exposure zone, some intervention may be
necessary to prevent or delay corrosion damage, but this intervention is unlikely to be
needed on bridges in the B1 or A2 exposure zones.
Depending on the level of risk the owner is willing to accept, a different approach may be
more appropriate when assessing the needs of an individual structure. For example,
although cover depths to the rebar and strands are similar, the consequences of corrosion
in the prestressing strands are more significant than the consequences of corrosion in
reinforcing bars that has caused a crack or spall. Repair of cracked and spalled concrete is
relatively straightforward, and one or even two cycles of this type of repair may be
considered as normal maintenance and therefore acceptable. Repair of an element
damaged by corrosion of prestressing steel, however, will probably also involve
strengthening the element. If the damage is extensive or the bridge capacity already
insufficient, the repair may be considered as a major renovation and therefore
unacceptable.
6.4 Implications for bridges of more recent design
It had been hoped that the two sets of data collected from the Turihaua Stream Bridge
could be used to ‘calibrate’ the model described in Chapter 6.3 by entering chloride
contents from the same depth collected at different times, thereby improving confidence
in this modelling approach. The sampling profiles used in 1991 and 2006 were different,
and it was felt that the inaccuracies introduced by interpolating chloride contents at given
depths would mask any differences related to the 15-year interval between the sampling
dates. This method of ‘calibration’ was therefore omitted from the analysis of data in this
investigation.
Instead, Equation 3 was used to predict time to corrosion initiation on the Turihaua
Stream Bridge, assuming a range of cover depths and using data collected from the side
of the bridge deck in 1991 and in 2006. The results from the 1991 and 2006 sets of data
were identical, which gives some confidence in this modelling approach. The results are
shown in Table 6.4. The depth at which the chloride content had reached the threshold
value of 0.05% was also calculated and found to have increased from 19 mm in 1991 to
28 mm in 2006.
Table 6.4 Estimates of time to corrosion initiation for the Turihaua Stream Bridge.
Cover Total predicted life (years)*
Remaining life as at 2006 (years)*
15 10 -20
20 10 -20
25 20 -10
30 30 0
* Calculated values rounded to the nearest 10 years.
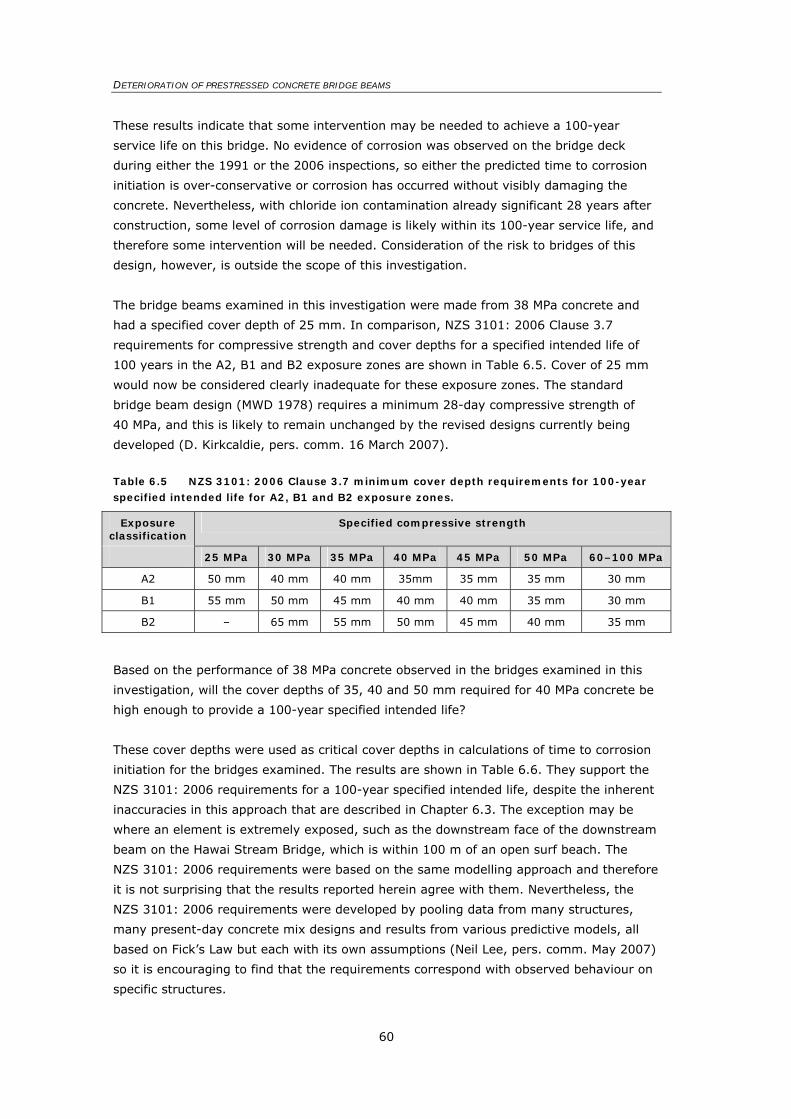
DETERIORATION OF PRESTRESSED CONCRETE BRIDGE BEAMS
60
These results indicate that some intervention may be needed to achieve a 100-year
service life on this bridge. No evidence of corrosion was observed on the bridge deck
during either the 1991 or the 2006 inspections, so either the predicted time to corrosion
initiation is over-conservative or corrosion has occurred without visibly damaging the
concrete. Nevertheless, with chloride ion contamination already significant 28 years after
construction, some level of corrosion damage is likely within its 100-year service life, and
therefore some intervention will be needed. Consideration of the risk to bridges of this
design, however, is outside the scope of this investigation.
The bridge beams examined in this investigation were made from 38 MPa concrete and
had a specified cover depth of 25 mm. In comparison, NZS 3101: 2006 Clause 3.7
requirements for compressive strength and cover depths for a specified intended life of
100 years in the A2, B1 and B2 exposure zones are shown in Table 6.5. Cover of 25 mm
would now be considered clearly inadequate for these exposure zones. The standard
bridge beam design (MWD 1978) requires a minimum 28-day compressive strength of
40 MPa, and this is likely to remain unchanged by the revised designs currently being
developed (D. Kirkcaldie, pers. comm. 16 March 2007).
Table 6.5 NZS 3101: 2006 Clause 3.7 minimum cover depth requirements for 100-year specified intended life for A2, B1 and B2 exposure zones.
Exposure classification
Specified compressive strength
25 MPa 30 MPa 35 MPa 40 MPa 45 MPa 50 MPa 60–100 MPa
A2 50 mm 40 mm 40 mm 35mm 35 mm 35 mm 30 mm
B1 55 mm 50 mm 45 mm 40 mm 40 mm 35 mm 30 mm
B2 – 65 mm 55 mm 50 mm 45 mm 40 mm 35 mm
Based on the performance of 38 MPa concrete observed in the bridges examined in this
investigation, will the cover depths of 35, 40 and 50 mm required for 40 MPa concrete be
high enough to provide a 100-year specified intended life?
These cover depths were used as critical cover depths in calculations of time to corrosion
initiation for the bridges examined. The results are shown in Table 6.6. They support the
NZS 3101: 2006 requirements for a 100-year specified intended life, despite the inherent
inaccuracies in this approach that are described in Chapter 6.3. The exception may be
where an element is extremely exposed, such as the downstream face of the downstream
beam on the Hawai Stream Bridge, which is within 100 m of an open surf beach. The
NZS 3101: 2006 requirements were based on the same modelling approach and therefore
it is not surprising that the results reported herein agree with them. Nevertheless, the
NZS 3101: 2006 requirements were developed by pooling data from many structures,
many present-day concrete mix designs and results from various predictive models, all
based on Fick’s Law but each with its own assumptions (Neil Lee, pers. comm. May 2007)
so it is encouraging to find that the requirements correspond with observed behaviour on
specific structures.
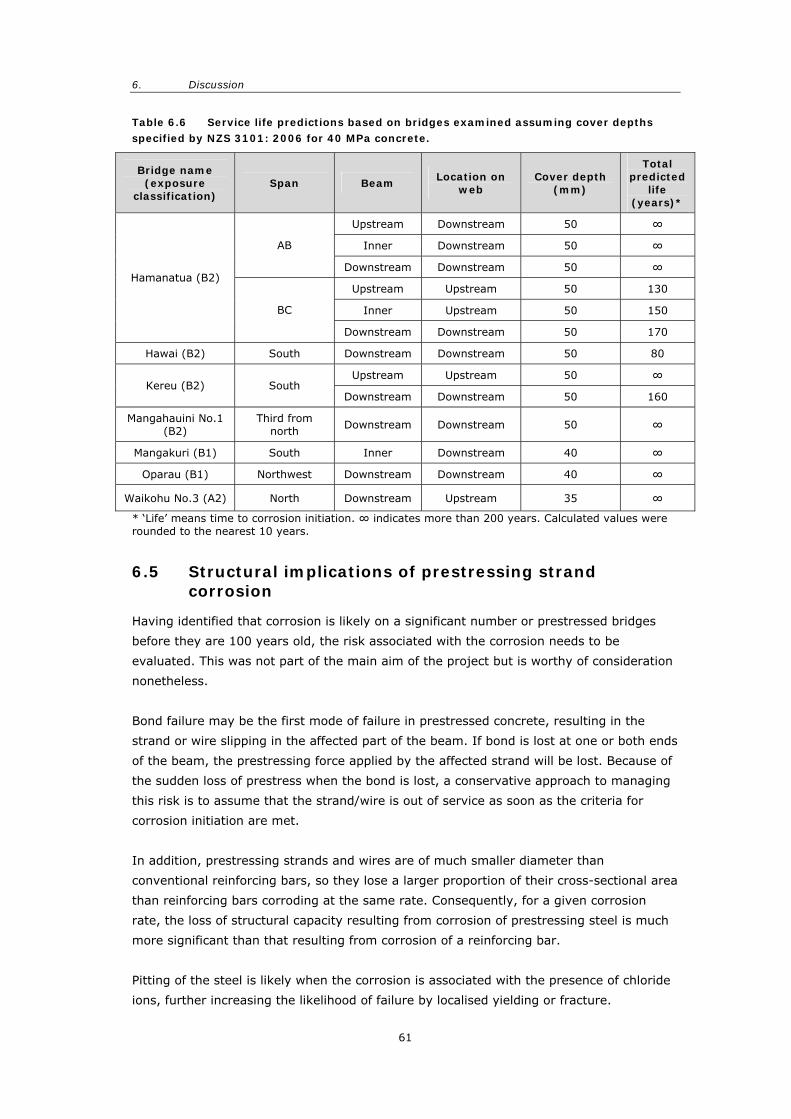
6. Discussion
61
Table 6.6 Service life predictions based on bridges examined assuming cover depths specified by NZS 3101: 2006 for 40 MPa concrete.
Bridge name (exposure
classification) Span Beam
Location on web
Cover depth (mm)
Total predicted
life (years)*
Upstream Downstream 50 ∞
Inner Downstream 50 ∞ AB
Downstream Downstream 50 ∞
Upstream Upstream 50 130
Inner Upstream 50 150
Hamanatua (B2)
BC
Downstream Downstream 50 170
Hawai (B2) South Downstream Downstream 50 80
Upstream Upstream 50 ∞ Kereu (B2) South
Downstream Downstream 50 160
Mangahauini No.1 (B2)
Third from north
Downstream Downstream 50 ∞
Mangakuri (B1) South Inner Downstream 40 ∞
Oparau (B1) Northwest Downstream Downstream 40 ∞
Waikohu No.3 (A2) North Downstream Upstream 35 ∞
* ‘Life’ means time to corrosion initiation. ∞ indicates more than 200 years. Calculated values were rounded to the nearest 10 years.
6.5 Structural implications of prestressing strand corrosion
Having identified that corrosion is likely on a significant number or prestressed bridges
before they are 100 years old, the risk associated with the corrosion needs to be
evaluated. This was not part of the main aim of the project but is worthy of consideration
nonetheless.
Bond failure may be the first mode of failure in prestressed concrete, resulting in the
strand or wire slipping in the affected part of the beam. If bond is lost at one or both ends
of the beam, the prestressing force applied by the affected strand will be lost. Because of
the sudden loss of prestress when the bond is lost, a conservative approach to managing
this risk is to assume that the strand/wire is out of service as soon as the criteria for
corrosion initiation are met.
In addition, prestressing strands and wires are of much smaller diameter than
conventional reinforcing bars, so they lose a larger proportion of their cross-sectional area
than reinforcing bars corroding at the same rate. Consequently, for a given corrosion
rate, the loss of structural capacity resulting from corrosion of prestressing steel is much
more significant than that resulting from corrosion of a reinforcing bar.
Pitting of the steel is likely when the corrosion is associated with the presence of chloride
ions, further increasing the likelihood of failure by localised yielding or fracture.
DETERIORATION OF PRESTRESSED CONCRETE BRIDGE BEAMS
62
The risk is exacerbated by the presence of other corrosion mechanisms that may reduce
the amount of corrosion damage that is needed to cause prestressing steel to fail, e.g.
stress corrosion, hydrogen embrittlement/cracking, fretting and fatigue corrosion.
When steel is under tensile stress, corrosion may induce cracking that causes the steel to
fail in a brittle mode and at lower stress levels than when unloaded. Some steel
compositions are more susceptible to stress corrosion cracking than others (see
Chapter 2.2). Stress corrosion cracking can be identified in failed sections by microscopic
analysis of the failed section but is difficult to detect prior to failure.
Once the bond has been lost, fretting may reduce the corrosion resistance of the steel.
Pitting and crevice corrosion induced by chloride ions both generate hydrogen ions, which
can diffuse into the steel. At low concentrations, this can make the steel brittle; at higher
concentrations, it can crack or blister the steel. Both mechanisms cause the steel to fail at
lower stress levels. The presence of pitting or crevice corrosion indicates the possibility of
these effects, known as hydrogen embrittlement and hydrogen cracking.
The fatigue life of steel is reduced in corrosive environments. The fatigue life of the
prestressing steel in these beams, therefore, has probably been reduced by the chloride
contamination. Fatigue corrosion is readily identified by microscopic analysis of a failed
section, but difficult to detect prior to failure.
Unfortunately, because the strand on the Hamanatua Stream Bridge had not completely
failed, it could not be sampled safely. It is therefore impossible to determine from the
work carried out to date whether the steel is of the type specified and whether it is at
significant risk from stress corrosion, hydrogen embrittlement/cracking or corrosion
fatigue. Even if the risk from any one of these mechanisms is slight, the combination may
increase the overall risk.
Darmawan & Stewart (2007) reported that cold-drawn, stress-relieved prestressing wires
and strands (manufactured in accordance with AS 1310-1987 (Standards Australia
1987a) and AS 1311-1987 (Standards Australia 1987b) respectively) had a lower strain at
failure when corroded than when not corroded. They found no evidence of stress
corrosion cracking or brittle failure, but considered that although the steel yielded, its
failure was less ductile than on uncorroded companion specimens. They suggested that
the failure mode in any particular case was related to the pit geometry, stress level and
chemical environment as well as to the properties of the steel itself. Failure modes may
therefore be determined by the specific materials and conditions on individual structures.
Further work will be needed to identify the most likely strand failure mechanisms in the
prestressing steel used in the beams investigated here. As noted in Chapter 6.1, however,
such a study is not essential for maintaining the serviceability of the bridges.
6. Discussion
63
The consequence of any failure mechanism is a reduced capacity of the beam to
withstand design loads. No measurements were taken on site to assess the residual
prestress and thereby to assess the serviceability of the structure. Nevertheless, on the
basis of the calculated effect of removing the two affected strands, the loss of beam and
superstructure capacity caused by the corrosion observed at the Hamanatua Stream
Bridge was assessed to be up to 10% loss in live load capacity in the individual beam
which has lost the two strands. In this condition, the overall reduction in the live load
capacity of the superstructure is estimated to be up to 5%. This reduction in capacity
from the original design becomes even more significant when considering that the bridge
was designed to a lower standard than currently required by Transit New Zealand.
Because corrosion of as few as two strands can significantly reduce the load-carrying
capacity of bridges of this design, it is important that further work be carried out to
understand and quantify the risks involved.
6.6 Long-term management of pre-1973 prestressed bridges
This investigation has identified that reinforcing and prestressing steel in bridges of this
particular design in the B2 (or C) exposures zones is likely to corrode within 100 years
from the time of construction. The associated structural risk is significant because the
strand most likely to be affected without prior warning is not confined, and because the
design load capacity of these structures is already lower than current Transit New Zealand
requirements.
Further investigation is needed to ascertain the impact of prestressing strand corrosion on
individual bridges such as the Hamanatua Stream Bridge to enable suitable remedial
strategies to be developed. This includes determining the likely strand failure mechanism
and the cross-section loss that corresponds to bond loss, and developing a site sampling
regime that will allow chloride-induced corrosion on individual structures to be modelled
accurately by techniques based on Fick’s Law.
Irrespective of the structural risk, intervention to prevent or delay the onset of corrosion
will be necessary on some bridges. Such intervention may be preventive, such as
applying a water-resistant surface treatment to the concrete surface before chloride
contamination has reached critical levels. Preventive action should be taken before the
predicted time to corrosion initiation. Alternatively, intervention may mean repairing
damaged elements once the concrete has cracked or spalled. Further research is needed
to assess the economic benefits of these two approaches so that the most appropriate
option can be selected, either for individual bridges or for bridge populations.
In the meantime, as the first stage of developing a strategy for managing these bridges,
the risk to prestressed bridges on the roading network needs to be identified. Because the
beam design means visible signs of corrosion are often absent before failure, non-
destructive methods of detecting corrosion activity such as those described by Ali &
Maddocks (2003) would be useful, although, as noted in Chapter 2.5, a combination of

DETERIORATION OF PRESTRESSED CONCRETE BRIDGE BEAMS
64
techniques is required in order to be effective. A more practical approach based on a
simple site investigation of each of the bridges is therefore recommended. The cover
depths and the level of chloride ion contamination should be measured on all pre-1973
prestressed I-beam bridges in the B2 exposure zone (approximately within 1 km of the
coast) in New Zealand. The bridges should be inspected to identify corroding prestressing
and reinforcing steel, and routine inspection reports should be reviewed to find out when
any such corrosion damage first occurred. This will enable bridge owners and asset
managers to determine the potential scope of the problem and to budget for appropriate
remedial or preventive action to ensure that these bridges continue to perform
satisfactorily for the desired service life.
Further work as described above would allow the loss in capacity over a given period (e.g.
10, 20 or 30 years) to be estimated. This would enable asset managers to estimate the
risks and benefits associated with carrying out remedial work at a given time and thus
optimise the time at which such work is done.
Application of an appropriate surface treatment before the steel corrodes will prevent or
delay corrosion damage. Several proprietary surface treatments for this purpose are
available. Further work is required to compare the advantages and limitations offered by
the different products.
Options for repairing concrete damaged by reinforcement corrosion are described by
Freitag & Bruce (2002) and Freitag et al. (2003). Further work is needed to establish the
effectiveness of these techniques for repairing damage caused by corroding prestressing
steel. For example, repairing spalled or cracked areas will not reinstate bond that has
been lost elsewhere on the beam without visibly damaging the cover concrete. It may
also be useful to assess the potential benefits of preloading a beam during repair to put
the exposed strand into tension then releasing the load to put the completed repair into
compression.
Treatments available to restore and improve structural capacity include external post-
tensioning and retrofitting with fibre-reinforced polymer composites. Proprietary
composite systems suitable for bridge applications are available. Further research is
needed to identify the benefits, limitations and constraints on the use of each of these
options for strengthening typical New Zealand concrete bridges damaged by corroding
prestressing steel.
These bridges were built to standards that do not meet the requirements of the current
Transit New Zealand Bridge Manual (TNZ 2003), even though they may be performing
acceptably. Should major structural improvements be needed, the rehabilitation strategy
for each bridge will need to account for the design life of the upgraded structure.
Therefore, future research into strengthening options also needs to consider the future
durability of the structure.
7. Conclusions
65
7. Conclusions
• Cause and extent of prestressing strand corrosion on the Hamanatua
Stream Bridge (built in 1966):
– The bridge is in the B2 ‘coastal frontage’ exposure zone and within 200 m of an
open surf beach.
– Prestressing steel on at least one beam is corroding and has spalled the cover
concrete, but the strand has not yet broken.
– Concrete quality and workmanship is generally good.
– Cover to some of the steel was less than the minimum specified cover of one
inch (25 mm).
– The corrosion was caused by the ingress of chloride ions from sea spray,
resulting in chloride ion concentrations at the steel surface exceeding the
threshold value at which corrosion is initiated.
– The influence of prestressing steel composition and different corrosion
mechanisms on the observed deterioration could not be determined.
• Corrosion observed on other bridges of this design and age:
– Prestressing strand corrosion was not observed on any other bridges of this
design.
– Corrosion of conventional reinforcement was relatively common.
– In some cases, the small volume of corrosion product has not yet generated
sufficient stress to damage the cover concrete.
• Likelihood of future prestressing strand corrosion on bridges of similar
design and age to the Hamanatua Stream Bridge:
– In situ and laboratory testing showed that the same corrosion mechanism is
likely to affect bridges in the B2 exposure zone because the amount of chloride
contamination, the quality of concrete and the depth of cover are similar to
those on the Hamanatua Stream Bridge.
– Corrosion is unlikely in bridges in the B1 and A2 exposure zones because they
are not exposed to external sources of chloride ion contamination.
– Analysis of concrete samples from these bridges revealed that the concrete in
some of them contains calcium chloride accelerating admixture, which increases
the likelihood of corrosion irrespective of exposure conditions.
• Predicted times to corrosion (service life) on bridges of this design and
age:
– The approximate time to corrosion initiation can be predicted by a simple model
based on chloride ion diffusion rates. Bond between the concrete and
prestressing steel may be lost shortly after corrosion initiation, so time to
corrosion initiation is a reasonable approximation of time to corrosion damage;
– The model predicts that bridges in the B2 exposure zone are unlikely to achieve
a 100-year service life without some corrosion damage.
– The model predicts that bridges in the B1 and A2 exposure zones will probably
achieve a 100-year service life with no corrosion damage.
– The model’s predictions broadly correlate with observations.
DETERIORATION OF PRESTRESSED CONCRETE BRIDGE BEAMS
66
– Refinements to the sampling and modelling procedures may allow more precise
predictions.
• Likelihood of corrosion on bridges of more recent design:
– Beams designed to current specifications (NZS 3101: 2006 and Transit New
Zealand’s Bridge Manual (TNZ 2003)) have much greater concrete cover depths
than the pre-1973 bridges investigated during this research.
– The corrosion initiation model indicated that beams made with similar concrete
quality to the Hamanatua Stream Bridge but with cover depths in accordance
with current specifications will probably achieve a 100-year service life without
corrosion damage.
– Beams with similar concrete properties and cover depths to the Hamanatua
Stream Bridge do not comply with current specifications and are just as likely to
be affected by corrosion.
• Structural implications of prestressing strand corrosion:
– For a given corrosion rate, corrosion in the prestressing strand reduces the
structural performance of a beam faster than corrosion of conventional
reinforcing because a greater proportion of the steel cross-section is lost.
– The Hamanatua Stream Bridge beam on which corrosion was observed may
have lost up to 10% of its live load capacity, reducing the overall load capacity
of the superstructure by up to 5%.
– The possible influences of hydrogen embrittlement, stress corrosion cracking,
fretting corrosion and fatigue corrosion on the eventual strand failure mode on
the Hamanatua Stream Bridge could not be determined because the strand
could not be sampled safely for investigation.
• Implications for long-term management of pre-1973 prestressed bridges:
– The risk associated with prestressing steel corrosion in these bridges is greater
than the risk of reinforcing corrosion in bridges of similar age.
– Some intervention will be necessary to ensure that bridges of this particular
design in the B2 exposure zone remain serviceable for a 100-year service life.
– Intervention may involve either preventive maintenance or repair to concrete
once the steel has started to corrode.
– Further work is needed to determine the most effective preventive and remedial
techniques, and the most economic strategy.
8. Recommendations
67
8. Recommendations
8.1 Findings from current research
Transit New Zealand and other bridge controlling authorities should consider the findings
of the research reported herein when assessing the risks to their bridges as part of their
asset management programmes.
8.2 Further work
To enable Transit New Zealand and LTNZ to manage the corrosion risk identified by this
project in pre-1973 prestressed concrete bridges (and in more recent designs) cost-
effectively and proactively, further work is recommended to identify the specific bridges
at risk in the B2 exposure zone and to identify appropriate methods of managing
prestressing corrosion in these bridges. Appendix A indicates what this work should entail.
Once the bridges at risk in the B2 exposure zone have been identified and appropriate
methods of managing prestressing steel corrosion have been identified, the incidence and
severity of this type of corrosion in B1 and A2 exposure zones should be investigated.
This work may not be necessary for another 10–20 years.
To refine the methods of predicting corrosion initiation and to optimise mitigation
strategies, further research may be carried out to improve the precision and accuracy of
corrosion predictions, and ascertain the structural impact of prestressing strand corrosion
on individual bridges. Appendix A suggests topics to be included in such research.
DETERIORATION OF PRESTRESSED CONCRETE BRIDGE BEAMS
68
9. References
AASHO. 1944. Standard specifications for highway bridges. Standard H20-S16-44.
Washington DC, USA: American Association of State Highway Officials.
Ali, M.G., Maddocks, A.R. 2003. Evaluation of prestressing steel in concrete using non-
destructive techniques. Corrosion and Materials v28 no.5–6 Oct-Dec 2003: 42–48.
American Concrete Institute. 2005. Corrosion of prestressing steels ACI 222.2R-01. In
Manual of Concrete Practice Part 1. Farmington Hills: American Concrete Institute.
Andrews-Phaedonos, F. 1997. Recommended durability classification for structural
concrete based on the measurement of permeable voids (VPV). Pp 311–329 in
Proceedings of the 4th CANMET/ACI International Conference on Durability of
Concrete. Sydney, Australia, 1997.
ASTM International. 1959. Tentative specification for uncoated seven-wire stress-relieved
strand for prestressed concrete. A416-57T. Pennsylvania: ASTM International.
ASTM International. 1999. Standard specification for steel strand, uncoated seven-wire
for prestressed concrete. A416/A416M-99. Pennsylvania: ASTM International.
ASTM International. 2006. Standard specification for steel strand, uncoated seven-wire
for prestressed concrete. ASTM A416/A416M-06. Pennsylvania: ASTM International.
Bruce, S.M., McCarten, P.S. 2006. Deterioration of Prestressed Concrete Bridge Beams in
New Zealand. Paper presented at the AUSTROADS 6th Bridge Conference, Perth, 12–15
Sept 2006.
Darmawan, M.S., Stewart, M.G. 2007. Effect of pitting corrosion on capacity of
prestressing wires. Magazine of Concrete Research, March 2007, v 59, no. 2:131–139.
Federation Internationale du Beton. 2003. Influence of material and processing on stress
corrosion cracking of prestressing steel – case studies. FIB Technical Report Bulletin
No.26. 44pp. Lausanne, Switzerland: Federation Internationale du Beton.
Freitag, S.A., Bruce, S.M. 2002. Electrochemical treatments for reinforcement corrosion in
concrete road bridges in New Zealand. Transfund New Zealand Research Report 235.
Wellington: Transfund New Zealand. 80 pp.
Freitag, S.A., Hickman, W.E., Bruce, S.M. 2003. Cost effective remedial techniques for
reinforcement corrosion in concrete road bridges. Transfund New Zealand Research
Report 251. Wellington: Transfund New Zealand. 78 pp.
Khatri, R.P., Sirivivatnanon, V. 2004. Characteristic service life for concrete exposed to
marine environments. Cement and Concrete Research, v34: 745–752.
Lee, N.P., Chisholm, D.H. 2005. Durability of reinforced concrete structures under marine
exposure in New Zealand. BRANZ Study Report SR 145. Judgeford, New Zealand:
BRANZ Ltd.
9 References
69
Ministry of Works. 1956. Bridge Manual. Wellington: Ministry of Works.
Ministry of Works. 1959. Standard Plans for Highway Bridges - Folder No. 2. Wellington:
Ministry of Works.
Ministry of Works. 1962. Specification for the supply and delivery of standard precast
pretensioned bridge units – ten foot to forty foot span. MOW 5920. PW 32/19 1
October 1962. Wellington: Ministry of Works and Development.
Ministry of Works and Development (MWD). 1972, 1973, 1978. Highway design. Civil
Division Publication CDP 701, latest version January 1978. Wellington: Ministry of
Works and Development.
MWD. 1978. Standard Plans for Highway Bridge Components. Civil Division Publication
CDP 901, January 1978. Wellington: Ministry of Works and Development.
Novokshchenov, V. 1994. Brittle fractures of prestresssed bridge steel exposed to chloride
bearing environments caused by caused by corrosion-generated hydrogen. Corrosion,
NACE International, v50. no.6: 477–485.
Novokshchenov, V. 1997. Corrosion surveys of prestressed bridge members using a half
cell technique. Corrosion, NACE International, v53, no.6: 489–498.
Nurnberger, U. 2002. Corrosion induced failures of prestressing steel. Otto-Graf-Journal,
vol 13, 2002. http://www.mpa.uni-stuttgart.de.
Polder, R.B., de Rooij, M.R. 2005. Durability of marine structures – field investigations
and modelling. HERON, v50 no. 3: 133–154.
Rowe, G.H., Freitag, S.A., Stewart, P.F. 1986. Concrete quality in bridges. Gisborne,
Hawkes Bay, Wairarapa, Manawatu, Taranaki and Wellington. National Roads Board,
Roads Research Unit, Bulletin 74. 117 pp.
Standards Association of New Zealand. 1978. Code of Practice for the Design of Concrete
Structures. NZS 3101P. 1978. Wellington: Standards Association of New Zealand.
Standards Association of New Zealand. 1982a. Concrete structures standard – code of
practice for the design of concrete structures. NZS 3101: Part 1:1982. Wellington:
Standards New Zealand.
Standards Association of New Zealand. 1982b. Concrete structures standard –
commentary on the design of concrete structures. NZS 3101: Part 2:1982. Wellington:
Standards New Zealand.
Standards Association of New Zealand. 1986. Methods of test for concrete. Part 2. Tests
relating to the determination of strength of concrete. NZS 3112:Part 2:1986.
Wellington: Standards New Zealand.
Standards Australia. 1987a. Steel wire for tendons in prestressed concrete. AS 1310-
1987. Sydney: Standards Australia.
DETERIORATION OF PRESTRESSED CONCRETE BRIDGE BEAMS
70
Standards Australia. 1987b. Steel tendons for prestressed concrete – 7-wire stress-
relieved steel strand for tendons in prestressed concrete. AS 1311-1987. Sydney:
Standards Australia.
Standards Australia. 1999. Methods of testing concrete. Method 21: Determination of
water absorption and apparent volume of permeable voids in hardened concrete.
AS 1012.21-1999. Sydney: Standards Australia.
Standards Australia. 2007. Steel prestressing metals. Part 1: General requirements.
AS/NZS 4672.1-2007. Sydney: Standards Australia; Wellington: Standards New
Zealand.
Standards New Zealand. 2006. Concrete Structures Standard, Part 1 – the design of
concrete structures; Part 2 - Commentary. NZS 3101:2006. Wellington: Standards
New Zealand.
Stirrat, A.G., Huizing, J.B.S. 1961. Trends in highway bridging. New Zealand
Engineering 16: 391–404
The New Zealand Building Code and Approved Documents. 1992. Building Industry
Authority, Wellington, New Zealand.
Transit New Zealand. 2003. Bridge Manual, 2nd edition 2003. SP/M/022. Wellington:
Transit New Zealand.
UK Concrete Society. 1984. Repair of concrete damaged by reinforced corrosion. Concrete
Society Technical Report 26.
Zhang, J., Lounis, Z. 2006. Sensitivity analysis of simplified diffusion-based corrosion
initiation model of concrete structures exposed to chlorides. Cement and Concrete
Research v36: 1312–1323.

Appendix
71
Appendix A Details of proposed further work
A1 Outline
Chapter 8 of this report presents general recommendations from the findings of this
project. These include carrying out further work to facilitate proactive management of
pre-1973 prestressed concrete bridges, and further research to refine the methods of
predicting corrosion initiation and to optimise mitigation strategies. The suggested
approaches to the recommended work and research are described in this Appendix.
A2 Recommended further work
To enable Transit New Zealand and LTNZ to manage the corrosion risk identified by this
project in pre-1973 prestressed concrete bridges (and in more recent designs) cost-
effectively and proactively, the following work is suggested:
• Identify the bridges at risk by:
– identifying by review of construction records whether the prestressing steel used
in the Hamanatua Stream Bridge had a particularly low corrosion resistance and
whether the same prestressing steel was used in all bridges of this design;
– identifying the precast concrete manufacturer(s) that made the beams believed
to contain calcium chloride accelerating admixture, and identifying other bridges
that have beams from the same source;
– finding out how the overall risk to prestressed concrete bridges of other designs
compares to the risk to the pre-1973 bridges by examining critical design
features such as cover depths and confinement of prestressing wire/strand, and
ascertaining the age and geographical distributions of each design;
– developing a site testing and evaluation procedure that would allow the
corrosion risk on individual bridges to be assessed with a quantified accuracy;
and
– using this procedure to assess the likelihood of current and future corrosion on
all pre-1973 prestressed I-beam bridges in the B2 exposure zone
(approximately within 1 km of the coast) in New Zealand. The bridges should be
inspected to identify corroding prestressing and reinforcing steel, their routine
inspection reports reviewed to find out when any such corrosion damage first
occurred, cover depths and levels of chloride ion contamination on the beams
measured and the time to corrosion initiation should be calculated via the simple
model used in this project. This will enable bridge owners and asset managers to
determine the potential extent of the problem and to budget for appropriate
remedial or preventive action to ensure that these bridges continue to perform
satisfactorily for the desired service life.
DETERIORATION OF PRESTRESSED CONCRETE BRIDGE BEAMS
72
• Identify appropriate methods of managing prestressing corrosion in these
bridges by:
– identifying the benefits and limitations offered by various surface treatments to
inhibit the ingress of moisture and chloride ions into the concrete surface1;
– assessing the benefits and limitations of patch repair techniques and cathodic
protection for repairing damage caused by corrosion in prestressing steel;
– comparing the economic benefits of preventive maintenance and remedial
techniques so that the most appropriate option can be selected, either for
individual bridges or for bridge populations, taking the condition and structural
capacity of the bridges and their environmental exposure conditions into
account;
– identifying the benefits, limitations and constraints on the use of methods such
as post-tensioning and fibre reinforced composites for strengthening typical
New Zealand concrete bridges damaged by corrosion in prestressing steel,
including their impact on durability and the effect of further deterioration on
their integrity.
• Once the bridges at risk in the B2 exposure zone have been identified and
appropriate methods of managing prestressing steel corrosion have been
identified, investigate the incidence and severity of this type of corrosion
in B1 and A2 exposure zones in more detail. This work may not be necessary
for another 10–20 years.
A3 Further research
To refine the methods of predicting corrosion initiation and to optimise mitigation
strategies, the following research is suggested:
• improve the precision and accuracy of corrosion predictions by:
– correlating observations of prestressing condition with measured chloride
contamination to ascertain the most appropriate level of chloride contamination
to use as a ‘threshold’ value when predicting time to corrosion initiation; and
– determining the likely in situ range of concrete properties and other input data
used to model and predict the corrosion initiation from a given element.
• ascertain the structural impact of prestressing strand corrosion on
individual bridges such as the Hamanatua Stream Bridge by:
– determining by laboratory analysis of samples from failed prestressing steel
(should any be encountered) whether the eventual failure mechanism of the
prestressing steel in the pre-1973 bridges is likely to include stress corrosion,
hydrogen embrittlement, fretting and/or corrosion fatigue; and
– ascertaining whether the strand is likely to yield or undergo brittle failure.
1 LTNZ funded research on this topic during 2007/8.
Deterioration of Prestressed Concrete Bridge Beams
Land Transport New Zealand Research Report 337