generate credible information for ngo’s, media and … · 2015-10-04 · generate credible...
TRANSCRIPT

Page 1
Acknowledgements
This report was prepared with technical guidance from the Economic Policy Research
Center – Makerere University. The center ensured the success and institutionalization
of the report and supported all the major proposals by the various actors.
The report is part of the Data Tracking Mechanism (DTM) initiative which was
developed in 2009 to address a growing concern about the lack of credible tools and
methods to track corruption in Uganda.
The report will provide data to citizens and businesses about activities occurring in
Uganda which support or detract from the fight against corruption. The report will further
generate credible information for NGO’s, media and development partners amongst
other stakeholders about the state of corruption and effectiveness of reform effort in
Uganda.
The Inspectorate of Government is greatly indebted to the EPRC, all organizations and
persons who assisted in the compilation of the report. Special thanks go to the team of
researchers who meticulously collected and compiled information for the report.
The Inspectorate of Government would also like to acknowledge the World Bank
through the Governance Partnership Facility and the UK Government through the
Department for International Development (DFID) office for the technical and financial
support provided in the development of the DTM and the production of the first annual
report on tracking corruption in Uganda.
Inspectorate of Government

Page 2
Table of Contents
1. Executive Summary ................................................................................................................................... 5
2. Background on the Data Tracking Mechanism (“DTM”) Initiative .......................................................... 12
2.1 Definition and Objective of the Data Tracking Mechanism (DTM) Initiative .................................... 13
2.2 Rationale for the Selection of the Indicators .................................................................................... 14
2.3 Selection Criteria ............................................................................................................................. 14
2.4 Classification of Indicators .............................................................................................................. 15
2.5 Nature of Data Collection and Review Process ............................................................................... 16
3. Indicators of Thematic Areas (Disaggregated) ....................................................................................... 17
3.1 Political Governance ....................................................................................................................... 17
3.1.1 Regulations Governing Political Financing of Parties and Individual Candidates .................... 17
3.1.2 Access to Records related to Financing of Political Parties and Individual Candidates ........... 19
3.1.3 Regulations Covering Conflict of Interest for the Executive Branch and the National-level
Judiciary .............................................................................................................................................. 20
3.2 Civil Society and Media .................................................................................................................... 21
3.2.1 Censorship of Corruption-related Journalism ........................................................................... 21
3.2.2 Safety of Journalists Investigating Corruption ......................................................................... 22
3.3 Citizens ............................................................................................................................................ 23
4. Functional Indicators (Disaggregated) .................................................................................................. 26
4.1 Budget ............................................................................................................................................. 26
4.2 Audit ................................................................................................................................................ 29
4.3 Parliamentary Scrutiny of External Audit Reports .......................................................................... 36
4.4 Procurement ................................................................................................................................... 37
4.5 Budget Monitoring and Analysis ..................................................................................................... 40
4.6 Human Resource Management ...................................................................................................... 43
5. Sectoral Indicators (Disaggregated) ...................................................................................................... 44
Page 3
5.1 Education, Health, Sub-County, and Local Council II Institutions – Misuse of Funds and
Enforcement ........................................................................................................................................... 44
5.2 Health –The Sale of Drugs ............................................................................................................... 46
5.3 Business Environment – Enterprise Bribery .................................................................................... 46
6. Indicators related to Enforcement of Anti-Corruption (Disaggregated) ................................................ 50
6.1 Reporting and Enforcement of Administrative Corruption ............................................................ 50
6.2 Inspectorate of Government (IG) ..................................................................................................... 52
6.3 Uganda Police Force ......................................................................................................................... 54
7. Aggregated Corruption Indicators – Analysis and Findings ................................................................... 56
7.1 Integrity Indicators Scorecard of the Global Integrity Index and Report.......................................... 56
7.2 Transparency International Global Corruption Barometer ............................................................. 60
7.3 Media Sustainability Index .............................................................................................................. 62
7.4 World Governance Indicators (WGI) ............................................................................................... 63
8. Conclusions and Recommendations ...................................................................................................... 66
Annexes
Annex I—Disaggregated and Aggregated Indicators .................................................................................. 69
Annex II—Indicators to Monitor Anti-Corruption Performance in Uganda ............................................... 71
Annex III—Scoring Systems ......................................................................................................................... 81
Annex IV—Global Integrity Assessment of Political Financing in Uganda .................................................. 84
Annex V—Global Integrity Assessment of Safety of Journalists Investigating Corruption ......................... 91
Annex VI—Data on Domestic Arrears, Outstanding Advances, and Excess Expenditures ......................... 92
Annex VII—Background on the World Governance Indicators (WGI) ...................................................... 100

Page 4
Acronyms
CPI Transparency International’s Corruption Perceptions Index
DTM Data Tracking Mechanism
EPRC Economic Policy Research Centre
GoU Government of Uganda
HRM Human Resource Management
IG Inspectorate of Government
NIS National Integrity Survey
NSDS National Service Delivery Survey
PDEs Procuring and Disposing Entities
PPDA Public Procurement and Disposal of Public Assets Authority
PPMS Procurement Performance Management System
UBOS Ugandan Bureau of Statistics
WGI World Governance Indicators

Page 5
1. EXECUTIVE SUMMARY
Background Corruption remains an impediment to development and a barrier to poverty reduction in Uganda and in many other African countries. This study has defined corruption as “abuse of office for private gain” and recent surveys, coupled with nationally produced data, indicate that corruption in Uganda is a problem, both at national and local government levels. Corruption manifests itself as bribery, financial leakages, conflict of interest, embezzlement, false accounting, fraud, influence peddling, nepotism, theft of public funds or theft of public assets. With the discovery of oil and the prospect of substantial windfall oil revenues coming on stream in the relatively near future, Uganda is bound to face major challenges with regard to the problem of corruption. The Data Tracking Mechanism The Data Tracking Mechanism was launched in 2009 to address a growing concern about the lack of credible tools and methods to track corruption. The initiative aimed to develop a tool, the DTM, to monitor corruption trends in Uganda on an annual basis. The current study provides a baseline for tracking progress over time. Altogether, the DTM comprises 71 indicators which are used to track corruption. Data Collection The choice of the 71 indicators was agreed in a workshop of 7 April 2010 in Kampala. The EPRC was designated the DTM Manager and EPRC collected and analyzed data associated with the 71 indicators. Some of the data sources were from Uganda including the Uganda Bureau of Statistics, the Office of Auditor General, the Inspectorate of Government, Budget Monitoring and Analysis, Procurement Performance Management System, and Uganda Police Force. The rest of the data was sourced from international organizations that collected and compiled data from Uganda, including Global Integrity and Transparency International.
Findings and Recommendations 1. A Large Implementation Gap. Uganda has made great efforts at establishing systems to fight
corruption. By 1970, the Prevention of Corruption Act (1970) had been enacted; then the Inspector General of Government Statute (1988), the Anti-Corruption Act (2009) and the Enforcement of the Leadership Code of Conduct Act (2002) were also put in place. However, the implementation of corruption prevention and detection and of anti-corruption enforcement has been particularly weak. In a recent study of 114 countries, Uganda was found to have had the largest implementation gap, in which it was scored very highly (99%) on having a very good legal framework but was awarded 45% for having weak implementation record, giving an implementation gap of 54% (Global Integrity Report, 2009). Further evidence of the existence of this implementation gap is given in the subsequent sections of the Report.

Page 6
Recommendation: To tackle the challenge posed by anti-corruption enforcement, the Government of Uganda should consider adoption and implementation of good enforcement practices similar to those of other countries which have made a serious commitment in this area: Bangladesh has adopted a 60-day timeline for handling corruption prosecution in Bangladesh; Ghana has established a “fast-track” court for corruption cases in Ghana; and use of speedy and effective prosecutorial methods, including the protection of whistleblowers in Singapore. We would recommend that government study these examples and adopt at least one of the mechanisms as a way to accelerate prosecutions.
2. Weak Performance related to Enforcement of Political Financing Disclosure. On Regulations
governing Political Financing of Parties and Individual candidates, Uganda rates “very weak” in critical areas of political financing which include; (i) Regulatory effectiveness related to political governance, and (ii) Citizen access to information for financing of political parties and individual candidates campaigns. However, regulation of conflict of interest appears more promising and this can be seen against Uganda’s “strong” track record for establishing laws and regulations. But as further evidence will reveal, Uganda has been less successful in implementing its laws and regulations and this has given the country the distinction of having the largest implementation gap in the world.
Recommendation: Enforcement of Political Financing Disclosure – Although no modern state has eliminated corruption from its party and campaign finances, the Government of Uganda could seek to reduce the scope for corruption by strengthening the enforcement of disclosure laws and regulations. There is need to ensure that disclosure laws include clear enforcement guidelines and penalties for non-compliance. In addition, within three months, the Electoral Commission should take the steps necessary to enforce disclosure of financial records of individual candidates and political parties as stipulated by law, and such information should be made publicly available.
3. Substantial Improvement needed to ensure a Safe and Open Climate for Reporting on Corruption.
There are two notable findings related to the role of media in combating corruption.
On censorship of corruption-related Journalism, two elements are assessed to determine if media are able to report on corruption: (i) Whether the government or media owners/distribution groups encourage self-censorship of corruption related stories, and (ii) The extent to which there is no prior government restraint (pre-publication censoring) on publishing corruption-related stories. On the first element, Uganda was “strong” in 2007 but dropped to a “very weak” rating in 2009. On refraining from censoring publication of corruption-related stories, Uganda’s rating fell from “very strong” in 2006 to “very weak” in 2008 but improved marginally to “weak” in 2009.
On Imprisonment of journalists investigating corruption, Uganda had a poor record between 2007 and 2009. On physical harm to journalists investigating corruption, Uganda’s record was good during the four assessment years 2006-2009. On killing of journalists investigating corruption, Uganda’s record was consistently clean.
4. Bribery Continues to be a Factor of Citizen Interactions with Government Officials: The
Afrobarometer data chosen for DTM on the extent to which households had to pay a bribe, give a gift, or do a favor to government officials in respect of obtaining permits, getting water or sanitation

Page 7
and avoiding problems with the police show that bribery in the three areas cuts across sectors and functions equally, affecting one out four households in the country.
Recommendation: The Prime Minister’s Office should direct individual MDA’s responsible for the administrative procedures identified in this report to initiate business process reviews with the aim of reforming functional processes that are subject to bribery and corruption which impact citizens and enterprises. The Prime Minister’s Office would monitor progress on the reviews and reforms. The functional processes might include starting a business, securing a construction permit, registering a property, making tax payments, enforcing contracts, securing a driver’s license, obtaining an educational certificate, securing a land title, and connection and disconnection of utilities.
5. Auditing can be Improved, Particularly as it relates to Involving Citizens. Uganda is doing well In
terms of auditing annual expenditures in a timely manner, but there is still room for improvement. Secondly, there is a positive trend in the release of public audits of extra-budgetary funds – and this could indicate a willingness to improve; however, areas that reflect poor and sometimes very poor performances exist and they increase opportunities for corruption to take hold and continue. These areas include: actions related to the auditing of actual outcomes, maintaining formal mechanisms of communication with the public, reporting to the public on actions taken to address audit recommendations, releasing public audits of extra-budgetary funds and public reporting related to tracking of executive actions to remedy audit recommendations. Nearly all these areas of weakness refer to communication with the public; so Uganda has got to improve on giving and receiving information from the public in budget matters.
Recommendation: Institutionalize Citizen Participation, especially with Auditing – As has been proven in Indonesia, combining auditing with citizen participation can be an important means of strengthening anti-corruption efforts. We recommend that the Auditor General commence a regular process of announcing audits of public infrastructure projects to national and local communities, and hold community-level town meetings to discuss audit findings upon completion of infrastructure projects. Over the next year, we recommend that the Auditor General conducts 20 audits which include the citizen participation approach described above. Results of the audits should be announced in the papers in the relevant district, and this information should be posted at the District’s notice board.
6. Need for Improvement in Quality of Budget Information Provided to Public, and More Citizen
Consultation. Open Budget Initiative’s budget-related indicators attempt to evaluate the quantity of information available to the public in Uganda’s budget documents; the opportunities for public participation in the budget process; as well as the ability of key oversight institutions of Government to hold the Executive accountable. The analysis reveals that there is substantial room for improvement for the government of Uganda to make available high quality, user-friendly relevant budget reports to the public of Uganda, and to consult its citizens in the budget process.
Recommendation: Based on the evaluation results we recommend as follows: (a) There is substantial room for improvement to make available high quality budget reports to the public and (b) The Uganda Government should do more by way of consulting its citizens in the budget process.

Page 8
7. Improvement of Parliamentary Scrutiny of External Audit Reports, yet Need for Executive Follow Through. Legislative scrutiny of external audit report includes three areas of assessment: (i) Timeliness of examination of audit reports by the legislature (for reports received within the last year); (ii) Extent of hearings on key findings undertaken by legislature; and (iii) Issuance of recommended actions by the legislature and implementation by the executive. The results from Public Expenditure and Financial Accountability (PEFA) covering 2005 to 2008 showed consistent poor performance in respect of (i), steady improved performance in respect of (ii) and decline in performance in respect of (iii). However, since 2008 the PAC of Parliament has made notable progress. It has reviewed and adopted recommendations for Central Government reports from 2001/02 to 2006/07, and for Local Governments from 2001/02 to 2004/05. The Public Accounts Committee should be commended for addressing this backlog.
Recommendation: Currently, there is need for MOFPED to issue Treasury Memorandum to implement these findings of the CAG and Parliament. We recommend a target of no more than six months for the issuance of this memorandum.
8. Lack of Available Data to Assess Anti-Corruption Efforts in Procurement. PPDA was asked to
provide information related to the following two procurement indicators (from the PPMS system) which relate to corruption in this area: % of sampled contracts subject to open competition, and % of procurements with disclosed evaluation criteria actually applied. These two criteria are critical components of fighting corruption in procurement. Unfortunately, the data provided was not responsive to this request.
Recommendation: Bolster Competitive Procurement Efforts – PPDA should continue to ensure that procurement processes are transparent and competitive by publishing regular reports to the public at least annually on the status of contractual activity in the government using the PPMS system. Reports should be posted on the PPDA website to ensure accessibility to the public. This reporting should address the extent to which procurements are open and competitive, and the level of procurements which include evaluation criteria. Normally, these practices help reduce corrupt practices and increase the chances of obtaining value for money in public spending. In addition, PPMS should provide to the public and the press a list of all contractors awarded a contract in a given period, the amount of the contract, and the contract purpose. This information should be provided on a quarterly basis.
9. Budget Monitoring Data can be improved to assess Corruption in Roads and other Public Works
Projects. For this report we selected two roads projects from the Budget Monitoring and Analysis Unit (BMAU) Reports of 2008/9 and 2009/10. These were the Kampala Northern By-Pass and the Soroti-Dokolo roads projects. At the time of reporting on them, both had a weighted physical progress of 90% or more. The data showed that the Northern By-Pass was 22 months 11 days beyond the initially agreed completion time of 30 months. It developed cracks along the shoulder and a dispute also arose which led to works stoppage. The projected overrun was 30% of the original price of UGX 83.9 billion (excluding VAT). The Soroti-Dokolo road was ahead of schedule with 26.1% of the contract time remaining to finish 10% of the remaining road works. By that time 90.6% of the revised contract price of UGX73.9 billion had been paid. The original contract price had been revised from UGX 70.6 billion to UGX73.9 billion; and then another revision from UGX73.9 billion to UGX96.1 billion was made; this latter revision was excessive in the light of the good progress made already. Information like this on roads construction did not necessarily point to a

Page 9
specific practice of corruption; however, cost overruns and high per unit costs are flags for the possibilities of corruption and merit special attention.
Recommendation: Curb Corruption in Public Works – A first step for improving data in this area is for BMAU to start immediately to collect data associated with the following indicators for all of its infrastructure project evaluations (including roads, hospitals and other public works): (i) unit prices for construction components at entry (based on the amount at the contract signing) and exit (exit costs include variation of quantities and amendments of contract, etc); and (ii) project costs and the unit costs estimates included in detailed engineering studies (DES).
10. Need for More Data Assessing Corruption in Key Sectors such as Agriculture, Health, Education,
and Transport. Numerous sector indicators reveal notable problems with corruption in education, health, the business environment, as well as with sub-county and local council institutions.
Education, Health, Sub-county and Local Council II Institutions Uganda Bureau of Statistics (NSDS 2008) provided valuable baseline data related to; (i) Misuse of funds in targeted public institutions; results showed that 8.4 % of sub-counties had been involved in misuse of public funds and in 23.1% of those involved no action taken on the culprits; (ii) Enforcement actions related to misuse of funds in these public institutions and facilities; the health sector showed the highest percentage of institutions that were involved in misuse but where no action was taken.
Health – Sale of Drugs Uganda Bureau of Statistics (NSDS 2008) assessed the extent to which patients in government health facilities paid for drugs; the results showed that 15.5% of patients at government health facilities paid for drugs. This information serves as a useful baseline for tracking corruption in the health sector.
Business Environment –Enterprise Bribery Ugandan Data from Doing Business suggests there is substantial room for improvement to eliminate bribery in doing business; streamlining processes and reducing them would minimize opportunities for bribery. In particular, the number of procedures associated with starting a business and registering a property in Uganda far exceed the neighbors’ and sub-Saharan averages.
11. Public Data related to Reporting and Enforcement of Administrative Corruption is Weak and
Fragmented. Anti-corruption efforts reveal that substantial improvements can be made as reflected in the comments below.
The National Integrity Survey (NIS) The National Integrity Survey (NIS) of 2008 provides data on: (i) Number of corruption cases reported in governmental organizations over last four years; the data showed an increase; 16.1% in 2004 and 28.1% in 2007 indicated one or more cases of corruption were reported in their organization; (ii) Number of corruption cases that resulted in suspension or dismissal; data also showed an increase; 22.5% in 2004 and 33.4% in 2007; (iii) Number of reported cases of corruption taken to courts of law which resulted in conviction of culprits; 7.1% in 2004 and 14.3% in 2007.

Page 10
The success of the anti-corruption campaign will depend on the number of corruption cases comprehended and on which action is taken. However, NIS data does not give actual numbers on reported cases, suspensions, dismissals or convictions. It is therefore recommended that Government designates an appropriate entity to manage the collection of this information across government institutions, so that DTM can track actual cases.
Inspectorate of Government (IG) The IG provides data on corruption to parliament twice a year. However, the reporting from IG needs to be revised to show more clearly the number of cases that were brought forward and the length of time a case has spent at the IG; it is also not clear from the IG data whether there is a system to track the outcome of IG cases that are referred to other institutions. The high proportion of cases “still going on” suggests that the IG needs to do more to clear these cases on a biannual basis.
Recommendation: Generate Accurate Data on the Outcomes and Duration of Anti-Corruption Cases – The IG has made great strides to report routinely on its activities related to investigating and prosecuting of corruption cases. Nevertheless, the efforts of the IG could be improved. The IG Reports to Parliament would benefit from improving data accuracy, rigor, and integrity. Additional information which focuses on the outcome of corruption cases over time would be beneficial. This type of focus would assess how long it takes (on average) for corruption cases to be resolved, and the likelihood of a culprit to be sanctioned, administratively or judicially. Determining the outcome of cases over time is of particular importance because many corruption cases unfold over a multi-year period.
Uganda Police Report: The 2008 and 2009 Uganda Police Force Annual Crime Reports show data on (i) Number of corruption cases that were reported to the police; results showed these doubled from 46 cases in 2008 to 95 in 2009; (ii) The percentage of corruption cases reported to police and taken to court - 87% of the reported cases in 2008 were taken to court, but the percentage in 2009 dropped substantially to 38%. More information would be needed – for example to explain the decrease in reported cases that were taken to court; whether it was due to a lower commitment to enforcement or lack of capacity to handle increased workload; or whether it was because of a shift in the type of corruption cases, or another factor.
Recommendation: Strengthen Efforts to Collect and Make Available Corruption Data – Numerous governmental entities generate information which is useful to the DTM. These entities include the IG, the Auditor General, BMAU (MOFPED), the Police (including the Criminal Investigations Division), DPP, Anti-Corruption Division in the High Court, DEI, Public Service Commission, Local Government Commission, Inspectorate of Courts, and UBOS. The data helps citizens understand the nature of governmental efforts to combat corruption, and the areas where corruption is greatest. These entities should be more proactive to collect consistent and frequent data related to corruption, and they should make available their reports or surveys on the Internet for a ten-year period. A specific example of how government can be more pro-active in this area would be for UBOS to collect data on stock-outs in health facilities, a problem which appears to have a linkage to corruption (in addition to other factors) in the health sector.
12. Information related to Outcomes and Duration of Anti-Corruption Cases is Poor, partially due to
Weak Coordination amongst Anti-Corruption Entities. This study has established that there are multiple government agencies involved in the collection of corruption-related data. However, their

Page 11
efforts are not well coordinated, limiting our ability to understand the effectiveness of government anti-corruption efforts, particularly related to public sector corruption.
Recommendation: Ensure all Anti-Corruption Entities Provide Useful Information on Public Sector Corruption – The government should support efforts to ensure that all anti-corruption entities in the government are generating regular and comprehensive reports to the public related to outcomes and performance associated with public sector anti-corruption activities. Activities (or cases) involving public sector officials or resources should be distinguished from strictly private sector corruption activities. The reports should be based upon consistent and frequent data collection. If the entity is involved with anti-corruption cases (such as the IG, CID, DPP, and the Anti-Corruption Division of the High Courts), its reports should emphasize data which reveals the outcome of cases and the average length of time associated with resolution of a corruption case. If the entity is involved in broader efforts to combat corruption (such as DEI, PSC, the Local Government Commission, and the Inspectorate of Courts), data should focus on anti-corruption outcomes. If not already being conducted, annual reports should be developed and posted on the Internet for public dissemination. Reports should remain available on-line for a ten year period, in order to track progress over time. The IG and DEI should conduct specialized broadcasts to disseminate report highlights to rural areas.

Page 12
2. BACKGROUND ON THE DATA TRACKING MECHANISM (“DTM”) INITIATIVE Corruption remains a major impediment to development and a barrier to reducing poverty in Uganda. It also has the potential to be a destabilizing influence. Corruption is closely linked to the distribution and exercise of political power in Uganda and to embedded, long-term, social, political and economic factors. Formal anti-corruption provisions exist alongside strong informal rules associated with personal, geographical, ethnic and historical obligations and expectations. These informal ties often compete with, and undermine, formal systems, including those for combating corruption. Recent international surveys, coupled with nationally produced data, indicate that corruption in Uganda is not a small problem. There is evidence of grand corruption involving high level officials.1 Petty corruption is widespread and is reported to be worsening by many local public opinion polls.2 Such corruption is also supporting and feeding a culture of waste and inefficiency that is causing high levels of financial loss. A close look at the landscape suggests that there are high impact corruption risks on the immediate horizon that have the potential to cause a significant deterioration in the extent and scope of corruption in Uganda. The prospect of substantial windfall oil revenues coming on stream in the relatively near future will pose a major challenge to the current culture and systems of accountability. If this risk materializes a significant deterioration in the trend of corruption can be expected. The implications for development and anti-corruption policy are significant and suggest the need for a more concerted and proactive approach than has been achieved in the past. The Government of Uganda has made efforts to combat corruption, focusing heavily on the establishment of a legal framework – creating laws, regulations and institutions. As early as 1970, Uganda enacted the Prevention of Corruption Act, which has now been superseded by the Anti-Corruption Act of 2009. In addition, in 1988 the IG statute established the IG’s Office. The statute has since been superseded by the IG Act. However, the implementation associated with corruption prevention and detection and anti-corruption enforcement has been weak. Global Integrity, an internationally-recognized authority on public integrity and accountability, has noted that Uganda has the largest “implementation gap” of all countries covered in the Global Integrity Report.3 A key finding from this report indicates that aid dependent countries
1 High level or "grand" corruption takes place at the policy formulation end of politics. It refers not so much to the
amount of money involved as to the level in which it takes place: grand corruption is at the top levels of the public sphere, where policies and rules are formulated in the first place. It is usually (but not always) synonymous to political corruption. 2 Small scale, bureaucratic or petty corruption is the everyday corruption that takes place at the implementation
end of politics, where public officials meet the public. Petty corruption is bribery connected to the implementation of existing laws, rules and regulations, and thus different from "grand" or political corruption. Petty corruption refers to the modest sums of money usually involved, and has also been called "low level" and "street level" to name the kind of corruption that people can experience more or less daily, in their encounter with public administration and services like hospitals, schools, local licensing authorities, police, taxing authorities and others. 3 The implementation gap refers to the difference between the country's legal framework for good
governance and anti-corruption and the actual implementation and enforcement of that same legal framework. The Global Integrity Report covers 114 countries.

Page 13
“are often times adept at engineering laws and institutions to meet foreign donor requirements despite their failure to deliver for ordinary citizens.”4 Efforts to reverse these trends have taken many forms. This initiative confronts the problems associated with corruption data and, in particular, the limited nature of available indices and methodologies which accurately monitor corruption in Uganda. While many of the existing indices are useful, each has its advantages and shortcomings. Those that involve a single numerical score, such as Transparency International’s Corruption Perceptions Index, provide little guidance as to what types of corruption and sectors may be more problematic and, hence, where to focus interventions. Stakeholders do not have a comprehensive tool to determine if efforts to combat corruption are working or not. Furthermore, the lack of an objective monitoring tool restricts opportunities for a robust reform-oriented public dialogue about corruption.
2.1 Definition and Objective of the Data Tracking Mechanism (DTM) Initiative
The Data Tracking Mechanism (“DTM”) Initiative was launched in 2009 to address a growing concern about the lack of credible tools and methods to track corruption in Uganda. The initiative aimed to develop a tool, the DTM, to monitor corruption trends in Uganda on an annual basis. The current report provides a baseline for tracking progress over time. The DTM provides public officials with a wide range of sources of information for developing and monitoring reforms. It provides data to citizens and businesses about activities occurring in Uganda which support or detract from the fight on corruption. It generates credible information for NGOs, media, and donors to ensure they are well-informed about the state of corruption in Uganda, and to support effective reform efforts. In general, the DTM Initiative monitors public reform efforts, illuminates weaknesses in public functions which allow corruption to persist, and promotes an informed public discourse about corruption. The initiative accepts a broad definition of corruption as “the abuse of public office for private gain.” Utilizing this definition, the DTM Initiative involves the collection, analysis, and dissemination of data from a range of data sources including the Government of Uganda, international and regional NGOs, and international public institutions. The data tracks areas where corruption manifests itself, such as bribery, financial leakages, conflict of interest, embezzlement, false accounting, fraud, influence peddling, nepotism, and theft of public funds or assets. The breadth and combination of data sources positions the DTM to be a highly credible source of information on corruption trends in Uganda. An annual report summarizing these trends will be published yearly. The report and the underlying data will be available on the Internet. The Economic Policy Research Centre (“EPRC”) situated at Makerere University is responsible for the ongoing development and operation of the DTM. In this role, the EPRC will continue to consult various stakeholders, drawing from the government, civil society, donor, and academic communities.
4 http://report.globalintegrity.org/globalindex/findings.cfm#ForeignAid

Page 14
2.2 Rationale for the Selection of the Indicators The Data Tracking Mechanism is comprised of approximately 71 indicators which are used to track corruption. The indicators include both aggregated and disaggregated indicators, with greater emphasis placed upon disaggregated indicators. Aggregated corruption indicators are broad instruments which indicate the condition of corruption. They are comprised of a compilation of information from several different sources to construct a general measurement of corruption (and governance). Aggregated indicators are useful for providing an overarching perspective on corruption. They are less helpful for identifying the exact nature and sources of corruption, and for designing specific reform strategies. Disaggregated corruption indicators are instruments which can be viewed as individual components of a corruption condition. We use the term “actionable” in describing disaggregated indicators because these indicators tend to focus on specific and narrowly-defined aspects of corruption (and governance) and, consequently, are more conducive to taking action or reform. Disaggregated corruption indicators are often linked to a defined process of a specific actor. Their specificity makes them valuable for designing and monitoring reforms, but ill-suited for providing a broad picture of corruption in a given country. A brief description of these two types of indicators is provided in Annex I, followed by a complete listing of the indicators in Annex II.
2.3 Selection Criteria The specific indicators selected to comprise the initial version of the DTM were based on a pragmatic approach to monitoring corruption trends in Uganda. The use of existing data, which is collected and reported consistently and frequently, was a critical priority for selecting indicators. Use of this type of data would allow the DTM to become operational quickly, without being burdened by the challenges associated with new data collection. In addition, it was determined that, first and foremost, the DTM should be a useful and relevant tool for framing reform discussion and action; and, secondly, it should provide information on broader corruption trends in the country. These factors provided the foundation for selection of indicators, and were joined by additional criteria to make the DTM a valuable and sustainable national resource for corruption information in Uganda. The complete set of criteria for the selection of DTM indicators is provided below:
Sustainability of DTM effort over time and country ownership of the initiative.
Inclusion of local data collection efforts which focus on improved accountability and transparency.
Data reflects the utilization of broad aggregated indicators and specific actionable disaggregated indicators, with an emphasis on the latter. The actionable disaggregated indicators must be detailed in nature in order to design and monitor the implementation and impact of reforms, and to learn from experience.
Data is accurate, consistent and reliable.
Data for Uganda is readily available and easily accessible.
Data is collected frequently, ideally every 1 or 2 years.

Page 15
Data relates to corruption and governance activities which directly impact corruption prevention, detection, or anti-corruption enforcement.
Preference is given to existing data sources, but selected “developing” data sources are also considered.
Data is relevant to the Ugandan context.
A final set of indicators reflects experiences and views from different stakeholders.
Selecting Useful Indicators for the DTM USEFUL INDICATOR (for the DTM): Global Integrity Indicator 24: Can citizens access records related to the financing of political parties? 24a: In practice, political parties disclose data relating to financial support and expenditures within a reasonable time period. 24b: In practice, citizens can access the financial records of political parties within a reasonable time period. 24c: In practice, citizens can access the financial records of political parties at a reasonable cost. Why is this a useful indicator for the DTM? This indicator addresses a specific activity related to corruption. Data is generated every year associated with this indicator, allowing for annual monitoring. If reform is needed, specific processes and institutions can be targeted for designing an effective reform strategy. NOT USEFUL INDICATOR (for the DTM): Transparency International’s Corruption Perceptions Index (CPI) Why is this not a useful indicator for the DTM? While this indicator generates consistent data annually, the ranking is too broad to be useful for devising reforms. If Uganda’s ranking drops substantially, the indicator does not provide enough information to know why the ranking went down or what type of reform would improve the ranking. Furthermore, movements in Uganda’s rank may reflect a change in Uganda, but may also reflect changes occurring in other countries (other countries are getting better or worse in terms of combating corruption), limiting the usefulness of the CPI for measuring progress in Uganda itself.
2.4 Classification of Indicators The indicators can be classified according to sectors, functions, classes of intervention, and thematic areas of governance. Given the broad nature of corruption, these different methods of classification can be useful for identifying areas of strength and weakness for combating corruption. They are also useful should EPRC decide to strengthen its focus in a given sector, function of government, or area of governance. Below is a brief listing of the existing classification systems. We expect data in these categories to expand over time as the DTM adds additional data. Thematic Areas of Governance. Because corruption is the result of poor governance, the fight against corruption is an integral part of improving governance. Many governance projects which support improved public management also have an efficiency perspective, and their successful implementation will reduce the room for corrupt behaviour. The linkage between governance and corruption gives rise to another approach for classifying corruption indicators, an approach which involves the use of thematic areas of governance. The DTM utilizes seven thematic governance areas which include: public sector management, formal oversight institutions and rules, citizens and firms, civil society and media, political governance, private sector interface, and decentralization and local participation.

Page 16
Functional data. Corruption cuts across governmental sectors and functions. Functional data is useful for understanding the performance associated with a specific government function which can have a substantial effect on preventing or detecting corruption, or enforcing anti-corruption. Examples of these types of functions include auditing, budgeting, revenue collection, and other financial management processes. The DTM has a solid basis of data related to a number of these critical functions of government, but it must build more strength in these areas. Similar to the challenges associated with sectoral data, it will be essential for the DTM to secure functional data that is reported on a frequent and consistent basis. Sectoral data. The DTM currently has data related to certain corruption trends in the education, health, judiciary, and police sectors. In general, this data relates to misuse of funds, misuse of funds where no action is taken on the culprit, and bribery. While this is a useful start for the DTM, sectoral data can be a rich source for understanding numerous types of corruption occurring in a given sector – including corruption which may be occurring centrally, corruption of a more decentralized nature, or “quiet corruption”. Sectoral corruption often has a direct impact on citizens and enterprises. The DTM would benefit from additional data related to corruption in these sectors. The critical challenge is to ensure relevant sectoral data is collected consistently and frequently. In 2011, EPRC will be working with the relevant sectoral institutions in an effort aimed at securing additional sectoral data in these areas, and to expand sectoral coverage when possible.
Quiet Corruption Quiet corruption is the failure of public servants to deliver goods or services of the government. According to a recent World Bank report, it appears to be just as corrosive as other forms of corruption, and has long-term consequences for development. Quiet corruption includes absenteeism, but it also involves lower levels of effort and deliberative bending of rules for personal advantages. The African Development Indicators 2010 report notes that quiet corruption is present in a large share of health-provider–patient and teacher-pupil interactions affecting the poor, who are more vulnerable and more reliant on government services and public systems to satisfy their most basic needs.
Classes of Intervention. The indicators can be grouped into classes of intervention – such as prevention, detection, and enforcement. A successful fight against corruption requires that all three of these classes of intervention are well coordinated and effective. By classifying indicators according to their contribution to corruption prevention and detection and anti-corruption enforcement, the DTM will provide a useful snapshot of strengths and weaknesses in terms of interventions. This system of classification is valuable for identifying large gaps in anti-corruption strategy, such as weak enforcement systems, and developing related reforms.
2.5 Nature of Data Collection and Review Process The EPRC, in its role as DTM Manager, collects and analyzes data associated with the selected indicators. The collection process involves assembling existing data, as well as coordinating with certain data sources to commence new data collection. In general, international and regional data is available via the Internet and, therefore, is accessible to the DTM. When it is not readily available, EPRC makes extra efforts to obtain this data. Some of the Ugandan data, such as the National Service Delivery Survey (“NSDS”) data, is also readily accessible. The role of the DTM in these circumstances is to collect existing

Page 17
data, organize the data in a useful structure, implement a process of updating in order to maintain currency and accuracy, and expand the existing data set. In addition to this existing data, the DTM benefits from additional data which would be valuable for understanding corruption trends in Uganda. Much of this is data does not currently exist in a form that is useful to the DTM. Generally, it is collected infrequently or in an inconsistent manner. A large amount of this data can only be collected by the Government of Uganda. Therefore, the DTM has taken on, as a part of its mission, a willingness to work with institutions in the government to facilitate the collection of data relevant to tracking of corruption trends. This data includes sectoral data (such as data related to corruption in the health, education, transport, public works, water or other sectors), data tracking corruption activities across governmental entities (including monitoring outcomes of administrative and judicial corruption cases. Over time, the EPRC anticipates that this group of data sources will expand substantially both in depth and breadth. Sections 3-6 of this report analyze the DTM data based upon a combination of the classification systems in Section 2.4 above. Section 3 reviews corruption according to certain thematic areas such as political governance, civil society and media, and citizens. Section 4 addresses those focused on a specific governmental function or process. Section 5 reviews the indicators and data which are sectoral in nature. Lastly, Section 6 assesses activity associated with a class of intervention, more specifically, anti-corruption enforcement. Annex III provides information on the data scoring systems for selected data sources.
3. INDICATORS OF THEMATIC AREAS (DISAGGREGATED) This section reviews data associated with key thematic areas of governance. While there are numerous thematic areas of governance described in Section 2.4, this section focuses on political governance, civil society and media, and elections. Other area of governance, such as public sector management and formal oversight institutions, are addressed in Sections 4-6. The analysis below is based upon data collected by Global Integrity and Afrobarometer.
Because corruption is the result of poor governance,
the fight against corruption is an integral part of improving governance.
3.1 Political Governance Global Integrity includes a number of indicators related to the financing of political parties and campaigns, as well as conflict of interest.5 (See Annex IV for the 2009 Global Integrity assessment of political governance.) Political financing and conflict of interest can influence the administration of public monies. Poor regulations and practices in these areas can result in abuse of public office for private gain. The indicators below assess the performance of Uganda as it relates to these important aspects of government accountability.
5 http://report.globalintegrity.org/Uganda/2009/scorecard/26

Page 18
3.1.1 Regulations Governing Political Financing of Parties and Individual Candidates
Global Integrity assesses “the effectiveness of the regulations governing the political financing of parties”. This assessment reviews the actual limits on (i) individual and corporate donations to political parties, (ii) total party expenditures, (iii) the willingness of an agency which monitors the financing of political parties to independently initiate investigations and to impose penalties on offenders, and (iv) to audit political parties. The assessment reflects a very weak rating for Uganda, as well as Kenya (2009) and Tanzania (2007) A similar assessment is conducted evaluating the “effectiveness of the regulations governing the political financing of individual candidates”. The performance for Uganda reflects a consistent downward trend, with the rating for 2009 being the lowest possible.

Page 19
3.1.2 Access to Records related to Financing of Political Parties and Individual Candidates
Another Global Integrity Indicator evaluates “the extent to which citizens can access records related to the financing of political parties”. This indicator reviews the extent to which (i) political parties disclose data relating to financial support and expenditures within a reasonable time period, (ii) citizens can access the financial records of political parties within a reasonable time period, and (iii) citizens can access the financial records of political parties at a reasonable cost. In this area, Uganda’s performance has been more volatile, yet all within the rating category of “very weak.” In 2009, Uganda scored the lowest possible rating in this area.
Uganda’s performance related to “the extent to which citizens can access records related to the financing of individual candidate campaigns” has been consistently abysmal.

Page 20
3.1.3 Regulations Covering Conflict of Interest for the Executive Branch and National-level Judiciary
Global Integrity assesses the effectiveness of regulations governing conflicts of interest by the executive branch. This assessment includes a determination as to whether (i) the regulations restricting post-government private sector employment for heads of state and government and ministers are effective, (ii) the regulations governing gifts and hospitality offered to members of the executive branch are effective, and (iii) the executive branch asset disclosures (defined here as ministers and above) are audited. Uganda has fluctuated between a “moderate” and “weak” rating, and in 2009 has a “moderate” rating in this area. This is consistent with much of Uganda’s legal framework which, generally, is solid. As has been noted before, Uganda’s difficulties appear with implementation of its laws and regulations. Lastly, Global Integrity assesses the effectiveness of regulations governing conflicts of interest for the national-level judiciary. Similar to the rating above, Uganda scores relatively favorably in this area, rating a moderate in 2009.

Page 21
In summary, in the area of political financing, Uganda rates “very weak” in critical areas of political financing, including regulatory effectiveness and citizen access to information for financing of political parties as well as individual candidates campaigns. The country’s record related to conflict of interest appears more promising, although this may well be because the available indicators for assessing conflict of interest focus on the existence of regulations in this area. Uganda has exhibited a strong track record for establishing laws and regulations. It has been substantially less successful in implementing its laws and regulations and, consequently, has received some notoriety for having none of the largest “implementation gaps” in the world.
3.2 Civil Society and Media
3.2.1 Censorship of Corruption-related Journalism
Global Integrity assesses two elements to determine if media are able to report on corruption. The first looks at “whether the government or media owners/distribution groups encourage self-censorship of corruption-related stories.” Global Integrity found that Uganda’s rating in this area has fluctuated over time. While it was very string in 2007, it has dropped substantially to merit a “very weak” rating by 2009. While Kenya received a notably higher rating, Rwanda’s 2009 rating was on par with Uganda, as was Burundi’s 2007 rating. The second element assessed by Global Integrity is “the extent to which there is prior government restraint (pre-publication censoring) on publishing corruption-related stories”. Similar to the factor above, Uganda’s rating has fluctuated over the last few years, dropping to its lowest of “very weak” in 2008. Notably, since 2008, the country’s rating is moving in a positive direction, and by 2009 was simply “weak.”

Page 22
3.2.2 Safety of Journalists Investigating Corruption
Global Integrity also assesses “the extent to which reporters are safe when investigating and reporting on corruption”.6 (See Annex V for the Global Integrity Assessment of the safety of journalists investigating corruption.) In evaluating whether journalists investigating corruption were imprisoned last year, Global Integrity found a poor record for Uganda, noting imprisonment in all three of the last assessment years.
Imprisonment of Journalists Investigating Corruption in the Past Year
Country 2006 2007 2008 2009
Kenya
Uganda
Tanzania
Rwanda
Burundi *Gray box indicates no data available
The second indicator reviewed by Global Integrity relates to “the extent to which journalists investigating and reporting on corruption are physically harmed”. Uganda’s performance looks substantially stronger in this area, reflecting no physical harm to journalists during the four assessment years.
Physical Harm to Journalists Investigating Corruption in the Past Year
*Gray box indicates no data available The final indicator relates to “the killing of journalists who are investigating and reporting on corruption. Fortunately, Uganda’s record in this regard is consistently positive”.
Killing of Journalists Investigating Corruption in the Past Year
Country 2006 2007 2008 2009 Kenya
Uganda
Tanzania
Rwanda
Burundi *Gray box indicates no data available
6 http://report.globalintegrity.org/Uganda/2009/scorecard/7/5b
Country 2006 2007 2008 2009 Kenya
Uganda
Tanzania
Rwanda
Burundi

Page 23
3.3 Citizens
Citizens use public goods and services each and every day. Citizens use roads to get to work, government health clinics to secure drugs, and schools to educate their children. The government rests at the heart of the provision of most of these goods and services. Ideally, government ensures that these interactions are characterized by high quality, low cost, and ease of use. Unfortunately, this is not always the case. In many countries, certain public officials abuse their position by signaling that “business as usual” only occurs with bribery. Evidence indicates that the poorest citizens are the most susceptible to this abuse. The data below, from Afrobarometer (2008), looks at household bribery in Uganda to determine its prevalence and its sectoral characteristics. Afrobarometer includes three indicators associated with household bribery. They involve “the extent to which households had to pay a bribe, give a gift, or do a favour to government officials in order to (i) get a document or a permit, (ii) get water or sanitation services, or (iii) avoid a problem with the police (like passing a checkpoint or avoiding a fine or arrest)”. Below is a brief discussion of the Afrobarometer findings in Uganda. Afrobarometer indicates that 62% of households do not pay bribes to get a document or permit from the government. An additional 13% indicated they had not paid a bribe in the last year. Nevertheless, 24% of Ugandans surveyed indicated that during the past year they had to pay a bribe at least once to get a document or permit. 11% indicated that they had to bribe more than once, “a few times” or even “often”. In Uganda, one out of every 4 citizens seeking a document or permit from the government resort to bribery to secure what they need.

Page 24
The data related to securing water is similar. 66% of households indicate they never bribe, while an additional 11% indicated that they did not bribe in the last year. However, 23% indicated that it was necessary to bribe at least once during the previous year in order to secure water, with 12% indicating that they had to bribe more than once. Bribery still occurs in the water sector in Uganda

Page 25
A common form of bribery experienced by household members is bribes paid to avoid problems with the police. These sorts of bribes can take many forms – securing passage at a checkpoint, avoiding a warranted or unwarranted fine, and others. The data related to this type of bribery in Uganda mirrors the previous data, with 63% indicating they have never paid a bribe, and an additional 12% indicating they had not paid a bribe in the previous year. Similar to the earlier trends, 25% of Ugandan citizens appear to pay bribes to avoid problems with the police. In conclusion, the Afrobarometer data reviews household bribery related to getting a document or permit, securing water, and avoiding the police. The evidence from Afrobarometer indicates that the frequency associated with bribery in Uganda is remarkably consistent, with bribery in these areas cutting across sectors and functions equally, impacting about one out of every four households in the country.
Page 26
EPRC is aware that the NIS 2008 findings reflect higher levels of bribery in many of these sectors. Furthermore, the East African Bribery Index finds more variety in the levels of bribery across sectors in Uganda, indicating the lowest level of 2.3% bribery at the Postal Corporation up to 58.3% bribery with the Police. The divergence in percentages could be attributed to differences in methodologies, and in how the questions are framed in the questionnaires. In 2011, EPRC will review all available data on sectoral bribery in Uganda to better understand the extent to which bribery is a major obstacle in targeted sectors. The results of this assessment will be included in the Second Annual Report on Corruption to be published in November 2011.
Reducing Bribery:
Strong Leadership, Streamlined Procedures, and Less Discretion The prevalence of bribery can be controlled and managed by government. Strong leadership can establish an environment that does not accept bribery as a normal means of doing business. Procedures can be streamlined, reducing opportunities for a bribe to exchange hands. The discretion of public officials can be limited, reducing the incentives for public officials to abuse their power. A serious government effort would implement these approaches by function and by sector.
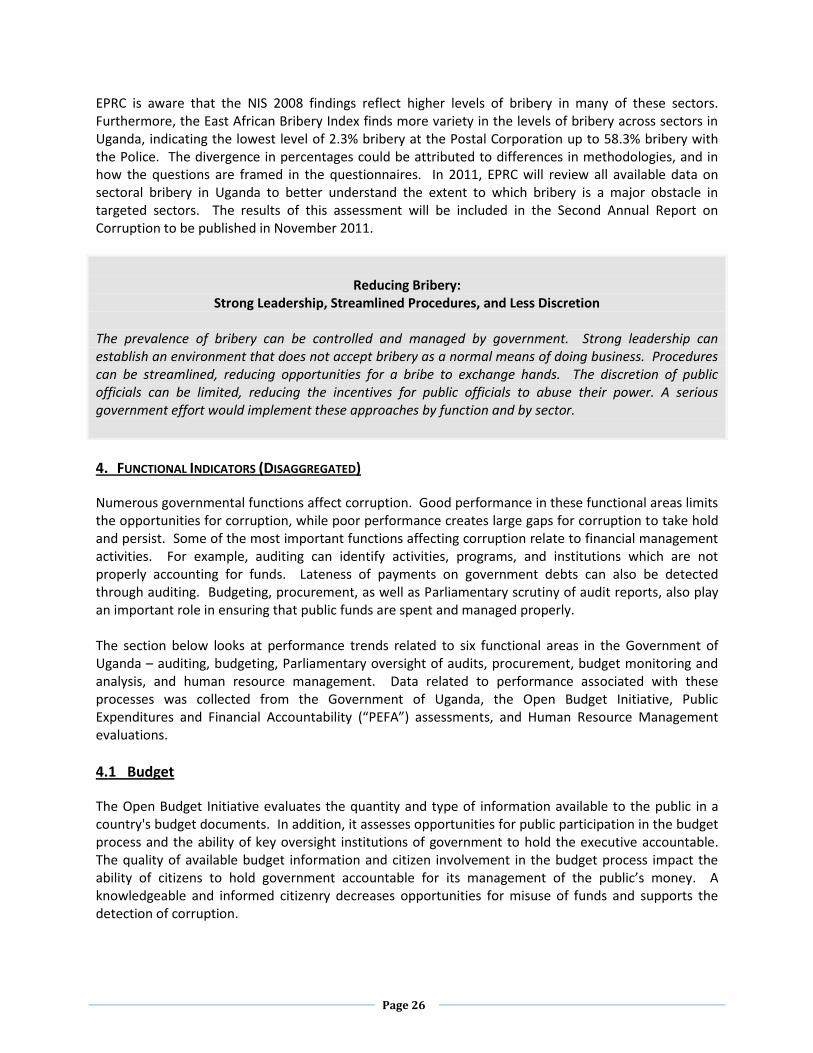
4. FUNCTIONAL INDICATORS (DISAGGREGATED)
Numerous governmental functions affect corruption. Good performance in these functional areas limits the opportunities for corruption, while poor performance creates large gaps for corruption to take hold and persist. Some of the most important functions affecting corruption relate to financial management activities. For example, auditing can identify activities, programs, and institutions which are not properly accounting for funds. Lateness of payments on government debts can also be detected through auditing. Budgeting, procurement, as well as Parliamentary scrutiny of audit reports, also play an important role in ensuring that public funds are spent and managed properly. The section below looks at performance trends related to six functional areas in the Government of Uganda – auditing, budgeting, Parliamentary oversight of audits, procurement, budget monitoring and analysis, and human resource management. Data related to performance associated with these processes was collected from the Government of Uganda, the Open Budget Initiative, Public Expenditures and Financial Accountability (“PEFA”) assessments, and Human Resource Management evaluations.
4.1 Budget
The Open Budget Initiative evaluates the quantity and type of information available to the public in a country's budget documents. In addition, it assesses opportunities for public participation in the budget process and the ability of key oversight institutions of government to hold the executive accountable. The quality of available budget information and citizen involvement in the budget process impact the ability of citizens to hold government accountable for its management of the public’s money. A knowledgeable and informed citizenry decreases opportunities for misuse of funds and supports the detection of corruption.

Page 27
The DTM includes four budget-related indicators from the Open Budget Initiative which relate to prevention and detection of corruption in Uganda. Comparable data for Kenya and Tanzania are provided; however, data was not available for Rwanda and Burundi. A brief discussion of each indicator is included below. The 2006, 2008, and 2010 Open Budget Initiative assessed “the extent to which the Executive holds consultations with the public as part of its process for determining budget priorities”. As reflected in the diagram below, Uganda and Tanzania were rated 33 out of a total of 100, indicating a “poor” performance in this area. Kenya scored 67, reflecting “good practices”. The data, as shown below, indicates that Uganda’s performance in this area has remained constantly “poor” during this time period. (The identical rating of Uganda and Tanzania is reflected in the overlapping red and green lines.)
In addition, the Open Budget Initiative evaluates “the extent to which in-year reports released to the public compare actual year-to-date revenue collections with either the original estimate for that period (based on the enacted budget) or the same period for the previous year”. This indicator assesses the degree to which the in-year reports released to the public compare actual revenue collections with original estimates or with actuals for the previous year. The data indicates that in 2006 Uganda received a 0 (“very poor”), improved in 2008 to 33 (weak) and, receded again in 2010 to “very weak”. Uganda’s performance stands in stark comparison to both Kenya and Tanzania, which currently reflect “very good practices”.

Page 28
The Open Budget Initiative also assesses “the extent to which the year-end report explains the difference between the enacted levels (including in-year changes approved by the legislature) and the actual outcome for expenditures”. This assessment addresses the importance of providing to the public an explanation of the difference between the enacted levels and actual outcomes for expenditures. Significant differences in these levels raise questions, and can signal corruption. The data on this factor indicates that since 2006, Uganda has slightly improved its performance from “very poor” to “poor” practices. Since 2008, little change has occurred in this area in Uganda.
The final Open Budget Initiative indicator used in public sector management is similar to the previous, but the focus is on revenues. This indicator assesses “the extent to which the year-end report explains the difference between the enacted levels (including in-year changes approved by the legislature) and the actual outcome for revenues”. Similar to the indicator above, this assessment addresses the importance of providing to the public and the other branches of government an explanation of the difference between enacted levels and actual outcomes for revenues. Significant differences in these levels can be a sign of corruption. The data on this factor indicates that Uganda’s performance in this area has improved since 2006, and currently merits a “good practices” rating.

Page 29
Uganda’s performance in the areas of budgetary reporting and disclosure, and citizen participation in the budget process is not strong. It is difficult to assess budget performance in Uganda once the budget year is over. A year-end report is produced, allowing comparisons between what was budgeted and what was actually spent and collected, though it lacks some important details. On 3 out of the 4 budget indicators, Uganda scored “poor” or “very poor”, suggesting that the budgets provided to the public are weak when it comes to explaining the difference between the enacted levels (including in-year changes approved by the legislature) and the actual outcome and making useful comparisons. Finally, the Open Budget Initiative indicator related to citizen participation in the budget process reflected that the Executive inclusion of citizens in the budget process in Uganda has been “poor” on a consistent basis since 2006. This gives us great concern as citizen participation is a critical component of increasing accountability and reducing corruption. In summary, there is substantial room for improvement for the government of Uganda to make available high quality, user-friendly relevant budget reports to the public of Uganda, and to consult its citizens in the budget process.
4.2 Audit
The Supreme Audit Institution (in Uganda, the Auditor General) oversees the management of public finances. Broadly, it operates within one of three established institutional models (Westminster, Judicial or Board). Traditionally, the role of the Supreme Audit Institution has been seen as promoting public sector transparency and accountability within a wider climate of good governance. Many commentators therefore assign the role of Supreme Audit Institutions in fighting corruption to be primarily an indirect one, centering on deterrence and prevention of corruption. However, it is important to note that some Supreme Audit Institutions have taken a more active role in combating corruption. Successful approaches include identifying and publicizing areas of corruption risk, working closely with other institutions, and publicizing the recommendations of audit reports more widely. Below is a set of indicators assessing the audit performance in Uganda. As an independent external auditor of Government, the role of the Auditor-General in Uganda is to provide an independent oversight of government operations through financial and other management audits. The objective of the audits conducted by the Auditor General is to:
determine whether public funds are spent efficiently, effectively, and in accordance with applicable laws
evaluate internal controls and help improve governance in Government and in public sector agencies
to undertake investigations to assess whether illegal or improper activities are occurring
determine whether public sector agencies are in compliance with applicable laws and regulations; Rules and procedures and,
To provide assistance to the Parliament and the Public Accounts Committee in support of their oversight and decision-making responsibilities.
The office is headed by the Auditor General who is assisted by the Assistant Auditor General. The OAG has a total workforce of 338 employees of which 254 are technical staff and 84 are administrative and support staff. With 62 professional accountants the office is currently the largest employer in Uganda of qualified accountants working in the profession.

Page 30
We have two significant sources of information related to audit performance in Uganda, data provided directly from the Auditor General, and data collected by the Open Budget Index. A brief discussion of each is below. A key function of the Auditor General is to conduct audits of Ministries, Departments and Agencies (“MDAs”) of Uganda. In the course of these audits, the Auditor General collects and reports on governmental arrears, outstanding advances, and excess expenditures, as these are signs of financial management weaknesses. They denote:
unpaid and overdue debts of the government (arrears),
funds which remain unaccounted for without supporting justification (outstanding advances), and
expenditures made in excess of those funds appropriated by Parliament (excess expenditure).
While none of these problems denote corruption per se, it is important to recognize that poor performance in these areas (i) violates public financial management rules and (ii) creates substantial opportunity for corruption. Thus, these areas merit close monitoring. High levels of arrears, outstanding advances, or excess expenditures may well be a sign of financial leakages, embezzlement, false accounting, fraud, influence peddling, theft of public funds or assets, and other manifestations of corruption. Strong financial management practices serve to both prevent and detect corruption. Below is a brief description of each of these critical areas of public financial management. The analysis is based upon data provided by the Office of the Auditor General, evident in Annex VI. Arrears are unpaid and overdue debts or unfulfilled obligations. As can be seen in the chart below, the percentage of audited Ugandan Ministries, Departments, and Agencies (MDAs) with arrears was very high (more than 70%) for each of FY2005/6, 2006/7 and 2007/8. It should be noted that the percentage dropped substantially during FY2008/9 to 50.5%. The data also reflects an enormous difference between the mean and median, indicating that the distribution of arrears was positively skewed in each financial year. This differentiation reflects that there were one or two MDAs with excessively large arrears compared with the rest. These excessively large amounts are partly shown by the maximum arrears in each financial year from 2005/6 to 2008/9. The positive skewedness was also a characteristic of outstanding advances and of excess expenditure shown below in (b) and (c) respectively. In sum, the data indicates that one or two Ministries, Departments, or Agencies is primarily responsible for the high levels of arrears, outstanding advances or excess expenditure and these MDAs should be targeted for more detailed auditing.

Page 31
Arrears
Financial Year 2005/6 2006/7 2007/8 2008/9 Total number of MDAs audited 85 88 90 93 Number of MDAs without arrears 16 25 19 46 Number of MDAs with arrears 69 63 71 47 % of MDAs with arrears 81.2% 71.6% 78.9% 50.5%
Total arrears from MDAs audited 293,719,904,599 242,726,220,058 423,028,022,727
228,644,104,969
% change in total arrears - -17.4% 74.9% -46.0% Maximum…………………………….. 55,556,680,911 43,978,799,833 55,246,821,737 98,737,133,346
Mean based on MDAs audited. 3,455,528,288 2,758,252,500 4,700,311,363 2,458,538,762 Median based on MDAs audited 144,054,826 203,520,797 111,837,292 6,327,482
Outstanding advances are funds which remain unaccounted for, pertaining to a particular financial year, which lack the supporting justification for their expenditure as of the time the AG audit is undertaken. The percentage of MDAs with outstanding advances rose from 2005/6 to 2006/7, although it appears to be dropping from 2007/8 to 2008/9. The data reflect a notable spike in the maximum of outstanding advances during 2007/2008, an area which could merit further investigation.
Outstanding Advances
Financial Year 2005/6 2006/7 2007/8 2008/9
Total number of MDAs audited 85 88 90 93 Number of MDAs without advances 72 64 66 74 Number of MDAs with advances 13 24 24 19 % of MDAs with advances 15.3% 27.3% 26.7% 20.4%
Total advances from MDAs audited 8,678,034,207 10,721,944,304 75,166,864,487 11,609,233,648 % change in total advances - 24% 601% -85% Maximum 2,392,988,200 3,190,000,000 49,762,682,821 3,666,518,965
Mean based on MDAs audited. 102,094,520 121,840,276 835,187,383 124,830,469 Median based on MDAs audited 0 0 0 0
Excess expenditures are expenditures which are made in excess of those funds appropriated by Parliament. The percentage of MDAs with excess expenditures has increased slightly since 2005/6. The maximum of Excess Expenditures, however, has dramatically increased from 2005/6 to 2008/9, again meriting additional auditing attention. It should be noted that the MDA exhibiting the maximum in arrears is the same as that exhibiting the maximum in excess expenditures.

Page 32
Excess Expenditure
Financial Year 2005/6 2006/7 2007/8 2008/9
Total number of MDAs audited 85 88 90 93 Number of MDAs without EE - 68 72 68 Number of MDAs with EE - 20 18 25 % of MDAs with EE - 22.7% 20.0% 26.9%
Total EE from MDAs audited - 20,936,161,890 35,924,804,810 130,419,256,935 % change in total EE - - 71.6% 263% Maximum - 6,579,715,739 28,426,712,211 98,758,590,051
Mean based on MDAs audited - 237,888,203 399,164,498 1,402,357,601 Median based on MDAs audited - 0 0 0
A second source of information about audit performance in Uganda is the Open Budget Initiative. The Open Budget Initiative (Initiative) promotes public access to budget information and the adoption of accountable budget systems. Its focus on accountability has given rise to a number of indicators related to the conduct of standard auditing practices. A brief discussion of those indicators, in terms of the performance of Uganda’s auditing practices, is below. The Open Budget Initiative of 2010 assesses “the extent to which data on actual outcomes (as reflected in the year-end report) was audited”. This evaluation determines the degree to which Uganda is auditing program and project outcomes which are described in year-end reports. In reviewing the performance of Uganda and its neighbors in this area, the evaluation indicates that since 2006 Uganda and Tanzania have consistently received a rating of “very poor”. Kenya which appears to have had very good practices in 2006, experienced a drop in performance, placing it on par with Uganda and Tanzania at “very poor”.
In addition, the Open Budget Initiative assesses “the percentage of annual expenditures that has been audited and, except for secret programs, the reports released to the public from two years after the completion of a fiscal year”. Uganda’s performance has consistently been scored reflecting “good practices.” Its practices do not rate as high as those of Kenya and Tanzania, which have “very good

Page 33
practices” as of 2010. (The data reflecting Kenya’s performance in 2006-2008 overlaps directly with that of Uganda, which is why Kenya is not visible on the diagram below.)
The assessment also reviews “the extent to which the Supreme Audit Institution releases to the public audits of extra-budgetary funds”. Extra-budgetary funds generally refer to sets of government transactions that are not included in the annual budget presentation. These transactions or funds may not be subject to the same level of scrutiny or accounting standards as the annual budget. Often they are not subject to annual appropriations. One example of extra-budgetary funds is social security funds. In Uganda, certain fees associated with the development of oil (such as signing or concession fees) could fall under this category, underscoring the importance of close scrutiny of extra-budgetary funds. Pertaining to public release of audits of extra-budgetary funds, Uganda, Kenya, and Tanzania have a weak record. While Uganda has improved its performance from “very poor” to “poor”, none of these countries has a “good practices” rating. Both Kenya and Tanzania showed no improvement over the 4 year time period, maintaining a consistent rating of “very poor”.
An additional indicator of the Open Budget Initiative is “the extent to which the Supreme Audit Institution maintains formal mechanisms of communication with the public to receive complaints and suggestions to assist it in determining its audit program (that is, to identify the agencies, programs, or
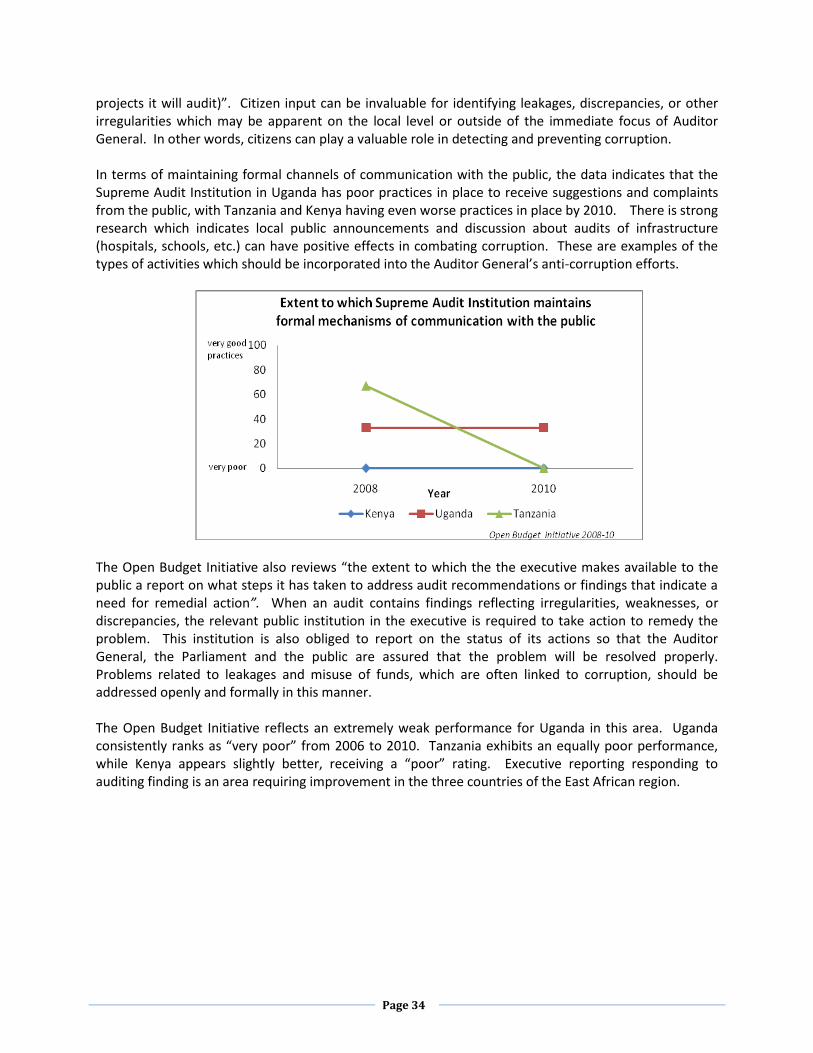
Page 34
projects it will audit)”. Citizen input can be invaluable for identifying leakages, discrepancies, or other irregularities which may be apparent on the local level or outside of the immediate focus of Auditor General. In other words, citizens can play a valuable role in detecting and preventing corruption. In terms of maintaining formal channels of communication with the public, the data indicates that the Supreme Audit Institution in Uganda has poor practices in place to receive suggestions and complaints from the public, with Tanzania and Kenya having even worse practices in place by 2010. There is strong research which indicates local public announcements and discussion about audits of infrastructure (hospitals, schools, etc.) can have positive effects in combating corruption. These are examples of the types of activities which should be incorporated into the Auditor General’s anti-corruption efforts.
The Open Budget Initiative also reviews “the extent to which the the executive makes available to the public a report on what steps it has taken to address audit recommendations or findings that indicate a need for remedial action”. When an audit contains findings reflecting irregularities, weaknesses, or discrepancies, the relevant public institution in the executive is required to take action to remedy the problem. This institution is also obliged to report on the status of its actions so that the Auditor General, the Parliament and the public are assured that the problem will be resolved properly. Problems related to leakages and misuse of funds, which are often linked to corruption, should be addressed openly and formally in this manner. The Open Budget Initiative reflects an extremely weak performance for Uganda in this area. Uganda consistently ranks as “very poor” from 2006 to 2010. Tanzania exhibits an equally poor performance, while Kenya appears slightly better, receiving a “poor” rating. Executive reporting responding to auditing finding is an area requiring improvement in the three countries of the East African region.

Page 35
A final indicator linked to identifying and remedying problems associated with corruption, is “the extent to which the Supreme Audit Institution or the legislature releases to the public a report that tracks actions taken by the executive to address audit recommendations”. Audits contain a multitude of recommendations which require remedial action. If the targeted problems are not addressed, the problems will persist; this is particularly a risk of systemic corruption. To ensure that problems are resolved, the executive must implement and report on its remedial actions. However, the Auditor General or legislature is also bound to monitor and report on executive progress with remedial actions, for all recommendations requiring such action. The data for Uganda and some of its neighbors reflects a weak performance in this area. Uganda and Tanzania reflect a “very poor” rating for the 2006 – 2010 time period. Notably, while Kenya had good practices in 2006, it has now declined to perform on par with Uganda and Tanzania.
The auditing performance of Uganda covers a wide spectrum. In terms of auditing annual expenditures in a timely manner, Uganda’s practices appear to be solid, although there is room for improvement. On the other hand, certain areas reflect poor and exceedingly poor performance and, undoubtedly, increase opportunities for corruption to take hold and continue. These weaknesses include actions

Page 36
related to the auditing of actual outcomes, maintaining formal mechanisms of communication with the public, reporting to the public on actions taken to address audit recommendations, releasing public audits of extra-budgetary funds, and public reporting related to tracking of executive actions to remedy audit recommendation. It is notable that many of these activities relate to involving or informing the public. These areas merit focus and attention if Uganda wants to take seriously its commitment to fight corruption.
4.3 Parliamentary Scrutiny of External Audit Reports Formal oversight institutions, such as the Auditor General and the legislature (Parliament), play an important role in overseeing the management of public monies and programs. Through means of auditing, holding hearings, issuing reports, and using the budget process to allocate resources, oversight institutions can target misuse of funds and leakages linked to corruption. Depending on their exact role, oversight institutions are well-positioned to prevent, detect, and/or enforce corruption within the Executive. Legislative scrutiny of external audit reports is a critical part of the process to ensure proper management of public funds. The role of legislative oversight is critical for identifying and publicizing corruption in the Executive. In Uganda, the Parliament is a central actor for ensuring that the Executive is taking aggressive action to prevent, detect, and enforce corruption. One important means of asserting its role is by examining external audit reports in a timely manner, holding hearings on serious findings, and issuing recommended actions for executive implementation. In the Ugandan Parliament, this role is played by the Public Accounts Committee (PAC). There is one Public Expenditure and Financial Accountability (PEFA) indicator which addresses this important area of oversight of public financial management: PI-28, legislative scrutiny of external audit report. This performance indicator includes three areas of assessment. The data associated with these three dimensions is provided below for Uganda and Kenya, followed by a discussion of each indicator. Comparable data are not available for Tanzania and Rwanda. Uganda – Legislative Scrutiny of External Audit Reports
Assessment Criteria 2005 2008
Timeliness of examination of audit reports by the legislature (for reports received within the last three years)
D D
Extent of hearings on key findings undertaken by the legislature C A
Issuance of recommended actions by the legislature and implementation by the executive
C D
Performance Indicator 28, PEFA 200 and 2008 Kenya – Legislative Scrutiny of External Audit Reports
Assessment Criteria 2006 2009
Timeliness of examination of audit reports by the legislature (for reports received within the last three years)
D D
Extent of hearings on key findings undertaken by the legislature B C
Issuance of recommended actions by the legislature and implementation by the executive
C C
Performance Indicator 28, PEFA 2006 and 2009
The first assessment criterion relates to “the timeliness of examination of audit reports by the legislature (for reports received within the last three years)”. This criterion reviews the extent to which

Page 37
the Parliament responds in a timely manner to audit reports. As noted above, the legislature plays an important role to examine audit findings and recommendations and, subsequently, to hold public hearings to educate citizens and monitor executive actions. Uganda scores poorly in this area, consistently receiving a D in both the 2005 and 2008 PEFA assessment. The second dimension associated with legislative scrutiny of external audit reports is “the extent of legislative hearings on key findings”. In this regard, Uganda should be commended for its progress. In 2005, Uganda received a rating of C, apparently due to lack of technical capacity. In 2008, the Parliament’s Public Accounts Committee met all the criteria required for an A rating. This is a notable improvement of the PAC, and sets a positive precedent for ongoing improvement in the other dimensions of legislative scrutiny and oversight. The final dimension assessed by PEFA in this area is “the issuance of recommended actions by the legislature and implementation by the executive”. In this area, Uganda’s performance dropped from a C to a D rating from 2005 to 2008. In both the 2005 and 2008 assessments, no recommendations had been issued by the legislature in the relevant period (previous 12 months). In summary, there has been recognizable progress in the area of legislative scrutiny of external audit reports. This progress is evidenced by the hearings held by the Public Accounts Committee on key findings in audit reports. In the most recent PEFA assessment (of 2008), Uganda received the top rating (“A”) for its efforts in this area. The two other areas of assessment received the lowest PEFA rating for Uganda in 2008 – those related to timeliness of examining audit reports, and issuing recommended actions for executive implementation – have since shown significant progress. These ratings reflected the backlog on the part of Parliament in reviewing Comptroller and Auditor General reports and providing related recommendations. However, since 2008 the PAC of Parliament has reviewed and adopted recommendations for Central Government reports from 2001/02 to 2006/07, and for Local Governments from 2001/02 to 2004/05. The Public Accounts Committee should be commended for addressing this backlog. Currently, there is need for MOFPED to issue Treasury Memorandum to implement these findings of the CAG and Parliament. We recommend a target of no more than six months for the issuance of this memorandum.
4.4 Procurement
The Government of Uganda’s Procurement Performance Management System (PPMS) is a new system that measures the performance of government entities in procurement. It measures both the efficiency of procurement and compliance with the established laws and procedures. The system looks at the following types of indicators:
1. Preparation and adherence to procurement plans 2. Completeness of procurement records 3. The level of competitiveness of procurement 4. Reporting on procurement 5. Implementation of audit recommendations 6. Contract management
Each government entity is responsible for data collection about its organization and this data is submitted to the Regulatory Agency (PPDA) which collects, analyses and generates national data. The

Page 38
PPMS has the potential to be a strong source of information for the DTM and may serve as a useful model for collecting other useful data related to governance and corruption across governmental entities. Two indicators were identified for the DTM from the Government of Uganda’s Procurement Performance Management System. These are:
“% of sampled contracts subject to open competition by value and number” (all pilot Procuring and Disposing Entities (PDEs); however, in view of the fact that the pilot project had ended by FY2008/09, the Ministry of Finance Planning and Economic Development is now the only PDE).
“% of sampled procurements with disclosed evaluation criteria actually applied” (all PDEs). The first indicator relates to the extent to which procurement in Uganda is based upon open competition. Non-competitive methods of procurement are susceptible to corruption because they are less transparent and more discretionary. The second indicator relates to the disclosure of evaluation criteria. Evaluation criteria are those factors upon which public officials base their procurement decision. Unpublished evaluation criteria contribute to a lack of transparency in the procurement process and, also involve increased subjectivity and discretion. The lack of transparency associated with both of these factors – non-competitive procurement and the lack of publishing evaluation criteria –creates significant opportunities for collusion, bid rigging, bribery and manipulation of records, conflict of interest, influence peddling, fraud, financial leakages, and other forms of corruption. The following data was provided (by MOFPED) to support the assessment of performance related to these two criteria. The first chart below summarizes procurement activity in the government according to method of procurement.
Method of Procurement FY2008/09
This same information can be viewed in the table below.

Page 39
Method of Procurement FY2008/09
Method Number Percent
Open domestic bidding (value > 100 million UgShs) 10 1.56
Open international bidding (value > 100 million UgShs) 0 0
Restricted domestic bidding (30 < value <=70 million) 0 0
Restricted international bidding (value > 70 million) 1 0.16
Quotation and proposal (2 < value <=30 million) 83 12.95
Direct procurement (value unspecified or left open) 114 17.78
Micro procurement (0 < value <=2 million) 411 64.12
Community procurement 0 0
Selective national bidding 0 0
Selective international bidding 0 0
No information (blank or N.I. or invalid category) 22 3.43
TOTAL 641 100
Additional information was provided by MOFPED which depicts the contract values associated with procurement with the Ugandan government.
Contract Value FY2008/09
The same information is evident in the table below.
Contract Value FY2008/09 Value Number Percent
Contract value of 2 million Shillings or less 412 64.27
2 million < value <=30 million 174 27.15
30 million < value <=50 million 23 3.59
50 million < value <=100 million 17 2.65
Value > 100 million 15 2.34
TOTAL 641 100
From the information contained in Tables (a) and (b) on method and contract value, it can be concluded as follows:
According to Table (a) only 1.56% of contracts in FY2008/09 were subjected to open competition. This reflects an exceedingly low level of open competitive procurement, in terms of the number of contracts.

Page 40
The majority of contracts (64%) ranged in value between 0 million and 2 million shillings, and involved a “microprocurement” method of procurement.
The data suggests there is a discrepancy between the number of contracts whose values exceeded 100 million when Table (a) and Table (b) are compared. Table (a) suggests that 10 contracts exceeded 100 million in value but Table (b) mentions 15. The extra 5 could have come about because of the direct procurement method wherein the value is left open or unspecified, or some of the extra 5 contracts could belong to the category of 22 where no information was provided on the method of procurement.
Similarly, Table (b) shows that 17 contracts had a value between 50 and 100 million, but Table (a) suggests only 1, leaving much room for ambiguity and speculation.
Following from what has been observed above, the PPMS should tighten the system of classification of the method of procurement so that the category “No information (blank or N.I. or Invalid Category)” is eliminated altogether. In addition, MOFPED should investigate discrepancies between data related to “method of procurement” and “contract value” and implement a strategy to remedy these sorts of discrepancies. Also, data identifying contract value should always be specified regardless of procurement method. It is notable that no data was provided related to the percentage of sampled procurements with disclosed evaluation criteria actually applied. We recommend that MOFPED provide the DTM with data related to this indicator as soon as it is available. In general, we recommend that PPMS continue to ensure that procurement processes are transparent and competitive, and that it reports regularly to the public on the status of contractual activity in the government, including competitive procurements and the level of procurements which evaluation criteria. Normally, these practices help reduce corrupt practices and increase the chances of obtaining value for money in public spending. In addition, PPMS should provide to the public and the press a list of all contract awarded in a given period, the name of the contractor, the amount of the contract, and the contract purpose. This information should be reported on a quarterly basis on the Internet and for printing in newspapers.
4.5 Budget Monitoring and Analysis In July 2008, the government established the Budget Monitoring and Accountability Unit (BMAU) to enhance monitoring efforts geared towards effective implementation of government programs. The BMAU is concerned with tracking implementation of selected government programs or projects observing how values of different indicators against stated goals and targets change over time. The monitoring is initially focused on programs under Agriculture, Education, Energy, Health, Industrial parks, Roads, and Water and Sanitation. The monitoring focuses on the sector indicators that are listed in the budget framework papers, categorized into short term, medium term and long term indicators as well as performance contracts and work plans from sectors. In its monitoring and evaluation function, the BMAU is in a key position to identify potential areas of corruption. The BMAU provided data to the EPRC related to two significant roads projects, the Kampala Northern By-Pass and the Soroti-Dokolo Road. The table below summarizes the data and an analysis follows.

Page 41
Table1: Project Summary for the Kampala Northern By-Pass and the Soroti-Dokolo Roads Item Reported on
Name of Road Project
Northern By-Pass, Kampala Contractor: SALINI Construttori Supervising Consultant: BCEOM Societe Francaise D’Ingeniere
Soroti-Dokolo Road Contractor: China Road and Bridge Corporation. Supervising Consultant: J. Burrow Ltd.
Distance 35 km including junctions 62.6 km
Works Contract price UGX83,904,464,291 (excluding 22% VAT in UGX)
original price: UGX70,642,241,162 Revised contract price: UGX73,863,487,692
Supervision contract price UGX365,268,396 and EUR1,439,364 (original price)
USD 1,235,264 (Inclusive of taxes)
Commencement date
20 May 2004 1 November 2007
Original construction period 30 months 30 months Original completion period 30 April 2010
Revised completion date 42 months and 8 days
-
Contract time elapsed (as at inspection)
52 months 11 days 673 days or 73.9% time progress
Weighted physical progress 94% 90.4% (as against 76.1% planned cumulative progress – which means the project was ahead of schedule)
Works payment certified 104.8% of original price 90.6% of revised contract price; amount of actual works payment was UGX66,899,473,780
Supervision actual payments UGX6,835,071,779
Comments The contract overrun was projected to exceed 30% of the original contract price including increases due to price revisions, which was yet to be ascertained. Source: BMAU FY2008/09 Annual Report
(a) Claims of interest on delayed payments totaling USD262,849.12 and UGX187,473,075 were recorded (b) The Supervising Consultant Resident Engineer made a projected contract price of UGX96,121,176,530 (c) Final project cost overruns were estimated at UGX25.5 billion above original contract which represented 36.1% increase Source: July-Sep 2009 BMAU Report

Page 42
Kampala Northern By-Pass Road. At the time of inspection, the Northern By-Pass in Kampala had taken 52 months and 11 days, a period which was 22 months and 11 days beyond the originally agreed completion time. This road project faced many hurdles including the fact that cracks had developed along the shoulder and the cracks needed to be explained and fixed. Also, during the period of construction, the contractor filed a dispute which took much time to settle, during which time construction was halted altogether. So, not only was the time of completion extended often, but the weighted physical progress at inspection was still at 94%. Therefore, there were bound to be cost overruns, and these overruns amounted to 30% of the original price. Soroti-Dokolo Road. The Soroti-Dokolo road works were very much ahead of schedule, yet the Resident Engineer calculated a cost overrun of 36.1% of the original price. According to the data contained in the above table, the road project was ahead of schedule with nearly 26.1% of construction time still remaining to finish 10% of the work. The original contract price had been revised from UGX 70.6 billion to UGX 73.9 billion. Only 10% of the work remained to be completed, yet the final projected cost for the entire project was estimated at UGX 96.1 billion, which does not rhyme well with the good progress made on the project. Granted, the project had incurred interest payments of nearly UGX 600 million and claims were still being made for land. But revising the contract price from UGX 70.6 billion to UGX 73.9 billion and then to UGX 96.1 billion when the road construction was well ahead of schedule, leaves room for speculation. No justification was provided for this contract amendment. This analysis could be judged against the fact that already UGX 66.9 billion had been paid to the contractor amounting to 90.6% of the revised contract price of UGX 73.9 billion. Data like that contained in the above table does not necessarily point to a specific practice of corruption in the roads sector. However, cost overruns, extensive delays, and high per unit costs are flags for the possibilities of corruption, and merit special attention accordingly. This is particularly true given the recognized corruption problems associated with procurement in all countries, not just Uganda. These examples underscore the importance of securing better corruption data related to roads and infrastructure development. Specifically, BMAU should consider adopting indicators and collecting data associated with the following for all of its evaluations of infrastructure projects (including roads, hospitals and other public works):
unit prices for construction components at (i) entry (based on the amount at the contract signing) and (ii) exit (exist costs include variation of quantities and amendments of contract, etc).
project costs and the unit costs estimates included in the detailed engineering studies (DES). If the project is a road, the type of the road structure, especially the surface layer (such as asphaltic concrete wearing course, bituminous concrete surface, and so on) must be noted, as it has an impact on the unit costs. These indicators can be used routinely to collect data on each public works project monitored by the BMAU. Effective data which can be used to identify corruption and establish a framework for reform to prevent future corruption, will require a systematic data collection of all BMAU-monitored infrastructure projects using a standard set of indicators.

Page 43
4.6 Human Resource Management Two Human Resource Management (“HRM”) assessments have been conducted in Uganda, in 2009 and 2010. Both focused on the health and education sectors. Human Resource Management (HRM) indicators capture the legal structures, the organizational capacities, as well as the performance dimensions of human resource management systems in low-income countries. The six core objectives addressed by the instrument are: (i) attracting and retaining required human capital within a given cadre; (ii) ensuring a fiscally sustainable wage bill; (iii) ensuring depoliticized, meritocratic management of staff within a given cadre; (iv) ensuring performance-focusing management of staff within a given cadre; (v) ensuring ethical behavior by members of the given cadre; and (vi) ensuring effective collaboration across cadres. Data is captured related to recruitment and selection, promotions, salary setting, performance appraisal, disciplinary procedures and practices, and grievance procedures. HRM data is collected through personal interviews with government officials working in both central HRM units (e.g., Civil Service Commission, Human Resource Management Organization, Ministry of Public Administration), as well as line Ministries, Departments and Agencies (MDAs). The DTM includes 3 indicators which come from the Uganda HRM assessments. They are:
Average quarterly transfer rate for civil servants over the most recent three calendar years
Average quarterly transfer rate for civil servants only for quarters in which or immediately after which the ruling party or coalition changed over the most recent three calendar years
Average quarterly transfer rate for civil servants only for quarters in which or immediately after which the head of Government changed without a change in the ruling party or coalition over the most recent three calendar years
All of these indicators are associated with transfers of civil servants. Transfers often create an opportunity for bribery, as they involve a situation where a civil servant has an incentive to influence his/her own transfer, and a supervisor has an opportunity to personally benefit from influencing the decision. If the supervisor has substantial discretion, an opportunity for bribery exists. Unfortunately, the HRM data for Uganda related to transfers is not clear. Out of seven senior level officials interviewed at the Public Service Commission, the Ministry of Education, the Ministry of Health and at the district level, all indicated that data related to the latter two indicators was not collected within their organizations. For the first indicator, only 2 individuals responded, stating that the average quarterly transfer rate was 3% and 5% respectively. This is not enough data to draw any definitive conclusions about the likelihood of corruption associated with transfers in the Ministries of Health and Education. In 2011, EPRC will assess the relevance of these indicators, and it will also assess the nature of the relationship between transfers and absenteeism. While some claim that absenteeism is affected by transfers, we have been unable to identify any data collected on a systematic basis, related to absenteeism in Uganda, which makes it difficult to understand the extent to which absenteeism contributes to corruption. Nor do we have enough information to determine the characteristics of this form of “quiet corruption”. Additional focus on absenteeism, including its relationship to transfers, would be useful for understanding the extent to which it is a significant manifestation of “quiet corruption” in Uganda.

Page 44
5. SECTORAL INDICATORS (DISAGGREGATED)
This section looks at corruption activity in targeted sectors in Uganda. The section is not intended to cover comprehensively all sectors and public institutions. Instead, it covers those sectors which had available relevant data to the DTM. In the first section, we will review National Service Delivery Survey (NSDS) data to understand which sectors and public institutions have been subject to misuse of funds. Subsequently, we will look at those same sectors and institutions to determine the degree to which enforcement actions are taken when funds are misused. In the second section, we will use NSDS data provided by the Uganda Bureau of Statistics (UBOS) to review the extent to which citizens at government health facilities have paid for drugs, in spite of the legal requirement that these drugs be provided at no charge. In the third section, we will review data from Doing Business to assess specific elements of the business environment which create opportunities for enterprise bribery.
5.1 Education, Health, Sub-County, and Local Council II Institutions – Misuse of Funds and Enforcement The National Service Delivery Survey (NSDS), 2008 provides a valuable baseline of data related to “misuse of funds in targeted public institutions, namely education and health facilities, sub-county institutions, and local councils (II)”. (It should be mentioned that the NSDS does not collect corruption-related data related to other sectors, such as agriculture or transport, although this data would be very useful.) The data, collected from Heads of Departments through the service providers survey, reflects the percentage of public facilities or institutions involving misuse of funds in the previous financial year, and the extent to which action was taken on the culprit. UBOS defines “misuse of funds” as: “ the use of government funds for what they were not planned for”. As is reflected in the chart below, the 2008 NSDS indicates that all four types of institutions were involved in misuse of funds – with 2.9% of respondents reporting misuse of funds at primary education institutions, 3.0% at health facilities, 8.4% at sub-county institutions, and 5.4% at local councils II. The highest level of reporting for misuse appears to be at sub-county institutions.

Page 45
In addition, the National Service Delivery Survey of 2008 provides important insight into enforcement actions related to misuse of funds in these public facilities and institutions. In measuring “the extent to which institutions involved in misuse of funds did not take action on the culprit”, the NSDS indicates that in over 23% of the cases of misuse of funds, no action was taken. In primary education institutions, no action was taken in 35% of the cases. In local councils, no action was taken in 33.8% of the cases. Health facilities appear to have the worst track record, taking no action in 40% of the cases. The NSDS information provides a useful baseline for measuring enforcement progress in these institutions on an ongoing basis.
The NSDS data related to misuse of funds and action taken on the culprit provides a valuable baseline for tracking misuse of funds in specific sectors and types of institutions. This data can be used by the Government and NGOs to set targets for improvement and to implement reforms for reducing misuse of funds and for ensuring proper enforcement actions are taken on the culprit. While the data does not target exact facilities engaged in misuse of funds or poor enforcement, it is useful for identifying high priority sectors or institutions for attention and reform. In particular, misuse of funds appears most prevalent within sub-county institutions, and poor enforcement associated with misuse of funds appears to be a significant problem with all four types of public institutions (education and health facilities, sub-county institutions, and local councils II). DTM monitoring and related reform would benefit from additional data collection which provides more specific information which better identifies and characterizes the public facilities and institutions experiencing misuse of funds. In particular, we recommend that UBOS collect data on misuse of funds and action taken on the culprit for other sectors, especially agriculture (as agriculture funds are designed to support rural farmers.) Additional information related to the nature of effective enforcement actions which have been implemented in each type of facility or institution would also be valuable for the DTM.

Page 46
5.2 Health –The Sale of Drugs
The National Service Delivery Survey 2008 includes additional useful data for determining “the extent to which patients of government health facilities pay for drugs”. By law, drugs at government health facilities are to be dispersed freely at no cost to the patient. To the extent a patient pays for drugs at government health facilities, bribery or fraudulent charging is likely to have been a factor in the transaction. The 2080 NSDS indicates that 15.5% of patients at government health facilities pay for drugs.
The 2008 NSDS data related to drug payment at government health facilities serves as a useful baseline for tracking this important area of health sector corruption. The data reflects that more than 1 out of every 10 patients at government health facilities pay for a public good that should be provided freely. It would be useful for the DTM to have data which better identifies the facilities practicing this form of corruption, the practitioners involved, and the affected patients in order to design effective reforms to reduce this type of corruption in the health sector. In addition, there is evidence that stockouts are another activity affected by corruption in the health sector. The DTM would benefit from systematically collected data related to the extent to which stockouts exist in Uganda. We request that UBOS incorporate this important area into its routine data collection activities associated with the health sector.
5.3 Business Environment – Enterprise Bribery Businesses are regular users of public goods and services. Enterprises need licenses for starting a business, construction permits to build new offices, and authorizations to register property. The government rests at the center of these interactions, wielding substantial control over the ability of a business to grow and flourish. Unfortunately, public officials involved in these processes can abuse their power by indicating that the necessary governmental authorizations can only be secured with bribes. This type of bribery evidences itself in a variety of fashions from lengthy, complex, and costly procedures to procurement-related bribery associated with securing government contracts. Evidence indicates that it is the least experienced businesses that are the most susceptible to this abuse.

Page 47
A well-known source of information about business interaction with the government is Doing Business. Doing Business sheds light on the nature of interactions between enterprises and the government. As it relates to corruption, Doing Business focuses on each point of contact between the entrepreneur and a bureaucrat, recognizing that each contact is an opportunity for a bribe to exchange hands. The DTM Doing Business data focuses on five indicators which are rooted in the concept that each contact between an enterprise and the government creates an opportunity for bribery. They are: i. Number of procedures required to start a business ii. Number of procedures for dealing with construction permits iii. Number of procedures associated with registering a property iv. Number of tax payments per year v. Number of procedures for enforcing contracts The first Doing Business indicator assesses “the number of procedures involved in starting a business”. While many would agree that government should establish a necessary number of procedures for starting a business, lengthy multi-stage authorizations create perverse incentives for public officials and entrepreneurs. Each procedure may involve its own officials, expanding the possibility of the number of officials who request a bribe. Increased procedures also mean there are more hurdles to be crossed, creating an opportunity for public officials to elicit a bribe at each step of the procedure. Lastly, lengthy multi-stage processes tend to be time-consuming and costly, giving enterprises an incentive to offer a bribe or be willing to pay a bribe simply to limit the cost. In summary, more procedures mean more opportunity for corrupt behavior. When reviewing the most recent data from 2010 for Uganda and its neighbors, Uganda, which has 18 procedures for starting a business, appears to have substantially more procedures for this process than its neighbors – approximately 50% more than Tanzania and Kenya (both have 12), and almost 8 times more than Rwanda (only 2). While Rwanda has exhibited enormous ability to reform and change, the other countries in the region, including Uganda, have held fairly constant. The 18 procedures in Uganda is almost twice the average for sub-Saharan Africa. The second Doing Business indicator relates to the “number of procedures dealing with construction permits”. Similar to the previous indicator associated with starting a business, numerous procedures for

Page 48
building and construction can become lucrative opportunities to extract bribes. In this area, Uganda has 16 procedures, almost the same as the sub-Saharan Africa average of 17.3 and the OECD average of 15.1. Uganda’s global ranking in this area is relatively favorable, in spite of a slight drop in ranking in 2010. The third Doing Business indicator relates to “the number of procedures associated with registering a property”. Similar to the first indicator associated with business start-up, Uganda’s number of procedures far exceeds its neighbors. In 2010, the 13 required procedures in Uganda associated with registering property compared with 9 in Tanzania, 8 in Kenya, and 4 in Rwanda. Uganda’s number of procedures far exceeds the average for sub-Saharan Africa of 6.7, as well as OECD of 4.7. The number of taxes paid each year also creates an opportunity for bribery. Uganda has 32 procedures associated with paying taxes, a number below the sub-Saharan average (37.7), but well above the OECD average (12.8). Relative to its neighbors, Uganda performs comparably to Rwanda (34), with Tanzania (48) and Kenya (41) lagging behind.

Page 49
Lastly, Uganda (with 38 procedures for contract enforcement) scores consistently with the sub-Saharan Africa average (39.2), and about 20% above the OECD average of 30.6. In the East Africa region, Uganda is on par with Tanzania and Kenya, all of which lag behind Rwanda which has only 24 procedures associated with contract enforcement Uganda exhibits substantial room for improvement to eliminate bribery between enterprises and public officials. In particular, the number of procedures associated with starting a business and registering a property far exceed its neighbors and the Sub-Saharan average. Streamlining these processes and reducing these procedures would minimize opportunities for bribery in these areas.

Page 50
6. INDICATORS RELATED TO ENFORCEMENT OF ANTI-CORRUPTION (DISAGGREGATED)
The final section which focuses on disaggregated indicators reviews those indicators related to a type of intervention to combat corruption. In this case, we are reviewing data related to anti-corruption enforcement. We look at three different sources of information about anti-corruption enforcement in Uganda – the National Integrity Survey, reports issued by the Inspectorate of Government, and Annual Crime Reports written by the Uganda Police Force. A brief discussion of each is below.
6.1 Reporting and Enforcement of Administrative Corruption
The National Integrity Survey of 2008 provides a useful starting point for understanding the nature of reporting and enforcement of corruption in the civil service. This data is based on a survey administered to public officials covering 670 selected respondents from sectors which included Education, Health, Local Government and Public Service in 80 districts in Uganda. According to the public institutions survey of the 2008 National Integrity Survey, “the number of reported corruption cases in governmental organizations” of the Government of Uganda increased during the period from 2004 to 2007. In 2004, 16.1% of public officials indicated one or more cases of corruption were reported over the past year. In 2007, 28.1% of public officials indicated that one or more cases of corruption were reported. While this data does not reflect actual cases reported, it provides an indication of cases reported based upon the experience and perceptions of civil servants. It should also be noted that the percentage of public officials who indicated that 10 or more cases of corruption were reported increased over the four year period, from 2.1% in 2004 to 3.0% in 2007. The data indicates a trend of increased reporting of corruption. Indications of increased reporting may be explained by a variety of factors including better reporting systems, more awareness about reporting mechanisms, encouragements by leadership to report, or actual increases in actual cases. However, the data also reflects the NIS finding that the reluctance of public officials to report corruption was still significant, i.e. 78.8% between 2004 and 2007, most likely due to no action being taken on reported corruption, the high cost of reporting, and the fear of retribution.

Page 51
The same survey also collected data from public officials related to the “number of reported corruption cases which resulted in suspension or dismissal”. Data from this survey, provided by REEV CONSULT, the consultant which conducted the survey for the NIS, reflected a positive trend of increased suspension or dismissal associated with corruption cases. In 2004, 22.5% of public officials determined that one or more reported corruption case resulted in suspension or dismissal. In 2007, this number rose to 33.4%. It is notable that the number of public officials who knew that 10 or more reported cases of corruption resulted in suspension or dismissal also increased during this time period, from 8.9% to 9.6%. The National Integrity Survey 2008 also reflected an increased “number of public officials who believed that reported cases of corruption were resulting in convictions.” In 2004, 7.1% of public officials indicated that one or more reported cases of corruption were resulting in a conviction. In 2007, this number increased to 14.3%.

Page 52
The available data from the Government of Uganda on reporting and enforcement of civil service corruption provides a window into the perceptions of civil servants on the practices occurring within the government related to corruption reporting and sanctioning. The National Integrity Survey 2008 data is a helpful starting point for understanding this important area of corruption. However, the National Integrity Survey data does not reflect actual cases of corruption that were reported. Nor does it reflect actual suspensions, dismissals, or convictions resulting from administrative corruption cases. Actual data addressing these trends is not available from Governmental sources. It is recommended that the Government of Uganda designate an appropriate entity to manage the collection of this data across governmental organizations so that the DTM can track actual cases of corruption reported, and resulting suspensions, dismissals, and convictions.
6.2 Inspectorate of Government (IG)
In many regards, the IG is the core anti-corruption agency in Uganda. The IG is a constitutional office mandated under the Constitution of Uganda to, amongst other things, eliminate and foster the elimination of corruption and abuse of public office and promote good governance in public office. The IG is also charged with the responsibility to enforce the Leadership Code of Conduct that establishes minimum standards of conduct of public officials which is critical in addressing corruption. The IG receives complaints of allegations of corruption from the public which it then investigates. It is also empowered to initiate similar investigations on its own motion without receiving any complaint from the public. Where the IG finds evidence of wrongdoing, it recommends appropriate action against the public official and this could either be prosecution or administrative. In cases of prosecution, the IG undertakes the prosecution. The IG is obliged by the Constitution to biannually make a report of its activities to Parliament. The following data was provided to EPRC to describe the nature of the anti-corruption activities of the IG. The number of prosecuted cases were reported for the first and second half of 2008 and 2009 through data provided directly by the IG as follows.
Number of Prosecuted Cases – IG
Jan – June 2008 July – Dec. 2008 Jan – June 2009 July – Dec. 2009
No of cases carried over
54 59 58 67
No of new cases 10 04 10 08
Convictions 05 05 00 01
Dismissed 00 00 00 04
Acquittals 02 04 01 00
Awaiting Judgment 00 00 00 02
Withdrawn 00 00 00 05
Acquitted but appealed 02 04 01 19
On-going 59 58 67 58
* Information provided by the IG, Nov 2010

Page 53
Based upon the data provided, there is a low conviction rate associated with prosecutions of corruption cases. In 2008 there were 10 convictions and in 2009 there was only 1 conviction. It is notable that a high percentage of cases are “still on-going”. The information provided by the IG includes inconsistencies. For example, the Jan-June 2009 data reflects inaccuracies. In addition, there should be some correlation between the number of cases awaiting judgment and the number of convictions in the subsequent reporting period. Lastly, for the July-Dec 2009 period, the number of appeals is 5 times the number of acquittals. These issues raise questions about the integrity of the data, suggesting there are problems related to quality control. In addition, in each bi-annual IG Report to Parliament, it would be useful for the IG to create a table on convictions. This table should include the following: the total number of convictions, the nature of the offense, the level or rank of the official concerned, if the official is a political leader or civil servant, if the official is working at the central government or district level, the nature of the conviction, and average length of time taken to conclude the case from commencement of trial. Furthermore, additional tables should be developed which provide detailed information related to reasons for dismissal, acquittal, or withdrawal. The workload data – which describes the type and level of work conducted by the IG – is also reported for the first and second half of 2008 and 2009 in the two half-yearly Reports of the IGG to Parliament as follows.
IG Workload
January-June 2008
July-December 2008
January-June 2009
July-December 2009
Complaints Brought Forward 1721 1639 1834 2572
New Complaints Received 920 854 739 827
Complaints Available for Investigation
2641 2493 2573 3399
Audit Reports Received 0 174 360 189
Total Workload 2641 2667 2933 3588
Referrals to Other Agencies 216 (8%) 230 (8%) 73 (3%) 107 (3%)
Cases Investigated and Completed 786 (30%) 603 (23%) 288 (11%) 543 (15%)
Complaints Concluded 1002 (38%) 833 (32%) 361 (14%) 650 (18%)
Cases In Progress/Carried Forward 1639 (62%) 1834 (69%) 2213 (86%) 2938 (82%) * Reports of the IGG
The IG is to be commended for publishing annually the data related to management of reported cases, pursuit of investigations, and prosecutions. It provides this data bi-annually in a report which is publicly available, providing extensive detail related to geographic regions, gender, and regional office. The level of detail of information provided to the public is noteworthy. This level of data is not provided by any of the other governmental entities which have a mandate to combat corruption – including the CID of the Police, the DPP, or the Anti-Corruption Division of the High Court. Additional improvements could be made in the follows areas.
Improving Data Accuracy. Some IG reports contain data inconsistencies. One such example is the data describing the “Cases in Progress/Carried Forward” for a given reporting period. In the January – June 2009 report, the number of these cases is not the same as the “Complaints Brought Forward”

Page 54
in the subsequent reporting period. In other words, the data from one reporting period should be reflected consistently to the following reporting period. These types of errors reflect quality control problems within the operations of the IG. Given that corruption cases can unfold over a multi-year period, maintaining consistent information from one period to the next is critical.
Securing Data Which Focuses on Outcomes. Improvements could be made to present the data in a more effective and user friendly format. Ideally, the data would be presented in a manner which tells a clear story over time as to what happens with corruption cases. The public is eager to understand the outcome of corruption cases but, because the data does not flow consistently from one reporting period to the next, the overall picture of what happens to corruption cases is lost. For the public, the most important issue is not the specific level of work undertaken by the IG during a six-month period (workload data) but, instead, the outcome of corruption cases over time (often times over years). Is a culprit sanctioned or not? What was the nature of the sanction? How long did it take for justice to be served? Workload data can be useful, but mainly as a means of understanding the outcome of the IG’s anti-corruption efforts. The focus on outcome over time is of particular importance because many corruption cases unfold over a multi-year period.
Better Understanding the Time Required to Resolve a Corruption Case. An additional area of reporting that would be useful for IG reports is the time required for (i) investigation, (ii) prosecution, and (iii) adjudication of corruption cases. For those cases which have been resolved, how much time passed since the case was initiated? This type of information provides the public and policy-makers with critical information about the effectiveness of government anti-corruption efforts.
6.3 Uganda Police Force In Uganda, corruption cases may be reported to (i) the Inspectorate General (IG), or (ii) the Police/Criminal Investigation Department (CID). While there is no central governmental data which tracks reported corruption cases across government, some of individual institutions maintain their own data, and generate reports, on the cases they receive and manage directly. The Uganda Police Force, which manages CID data, is a good example of such an entity. The 2008 and 2009 Uganda Police Force Annual Crime Report includes data related to the number of corruption cases reported to the UPF, the number of those cases taken to court during the past year, and the number of cases still under inquiry. This data is made available to the public each year, for which the UPF should be commended. It provides a useful starting point for tracking enforcement data. This data is critical for determining the degree to which enforcement mechanisms are or are not working. If corruption reporting does not result in administrative or judicial sanctions, the reporting process becomes meaningless – and fighting corruption is only a commitment of words. As indicated below, “the number of reported cases of corruption to the Uganda Police Force more than doubled from 2008 to 2009”, increasing from 46 to 95.

Page 55
In addition, the manner in which these cases were handled also appears to have shifted in this time period. In 2008, 87% of the reported corruption cases to the Uganda Police Force were taken to court, with only 13% remaining under inquiry. In 2009, the percentage of cases taken to court dropped substantially, to 38%, resulting in a much higher level of cases (62%) which were still under inquiry.
The 2008 to 2009 time period reflects a notable shift in the number of corruption cases, and in how they were handled, by the Uganda Police Force. This shift may or may not be significant, as it is difficult to interpret this data without additional information. The substantial increase in cases from 2008 to 2009 could be the result of increased reporting or better reporting systems. A drop in cases that were taken to court could indicate a lower commitment to enforcement. However, it could also reflect a lack of capacity to handle the increased case load, a shift in the type of corruption case reported, or another factor. It would be useful to collect additional information to explain the changes in the management of corruption cases by the UPF.

Page 56
7. AGGREGATED CORRUPTION INDICATORS – ANALYSIS AND FINDINGS We reviewed four sources of aggregated indicators related to corruption in Uganda:
The Global Integrity Index and Report
The Transparency International Global Corruption Barometer
The Media Sustainability Index
World Governance Indicators With some of these sources, such as Global Integrity, all aggregated indicators were relevant to corruption and, thus, all were included in our review. For others, such as the Media Sustainability Index, only one aggregated indicator was relevant; therefore, only the one indicator was included in the analysis. A brief discuss of these indicators is included below.
7.1 Integrity Indicators Scorecard of the Global Integrity Index and Report The Global Integrity Index and Report provides an overall score for Uganda of “Weak” (69 of 100). Nevertheless, one must be careful in viewing the overall Global Integrity score for Uganda. Many aid dependant countries have forged a knack for demonstrating solid anti-corruption infrastructure, without the ability to actually support these structures in practice. In 2007, Global Integrity introduced the ‘implementation gap’ metric to capture the gap between a country’s anti-corruption laws "on the books" and the actual enforcement of those same laws. Uganda has the largest “implementation gap” of all countries covered in the Global Integrity Report.7 A key finding from this report indicates that aid dependent countries “are often times adept at engineering laws and institutions to meet foreign donor requirements despite their failure to deliver for ordinary citizens.”8. (Note Uganda’s ‘implementation gap’ score of ‘Huge’ (54), in the diagram below.)
7 The implementation gap refers to the difference between the country's legal framework for good
governance and anti-corruption and the actual implementation and enforcement of that same legal framework. The Global Integrity Report covers 114 countries. 8 http://report.globalintegrity.org/globalindex/findings.cfm#ForeignAid

Page 57
Uganda has fine tuned its anti-corruption framework to look flawless in the eyes of any legal observer. Since the early nineties, key safeguard institutions such as the Inspectorate of Government have been created. Similarly, the Directorate of Public Prosecution has been given autonomy, and government accountability and transparency laws have been strengthened and expanded. Despite these legal reforms, the Uganda scorecards reveal serious issues when it comes to enforcement. In 2009, Uganda received a perfect score for anti-corruption law; yet its scores for scores for law enforcement and the effectiveness of the anti-corruption agency were deplorable. Ghana, which contrary to popular expectation, scores lower than Uganda on the overall on the Global Integrity Report, has scores that are not as polarized. Ghana, though also host to a flawless anti-corruption legal framework, has much stronger law enforcement. Furthermore, although mandated by law, appointments to the law enforcement agency in Uganda are often not made on strictly professional criteria. The government has been criticized repeatedly for practicing tribalism and nepotism while appointing lower level police officers. The recruitment of 350 cadet assistant superintendents of police (CASP) three years ago raised a lot of controversy; according to media reports 130 of the 350 recruited officers allegedly came from the same region of western Uganda. The breakdown of Uganda’s scorecard reveals a telling narrative. Uganda’s anti-corruption laws elicit the highest scores possible. Because the Integrity Indicators reflect a balance of de jure and de facto indicators, the precision of Uganda’s legal framework pulls up the county’s overall performance on the scorecards. In fact, out of all the countries evaluated by Global Integrity, Uganda has the best anti-corruption legal framework. But the strength of this framework only highlights the wide gap associated with implementation of actual measures to prevent, detect, and enforce anti-corruption. Below is a scorecard of Uganda which reflects a total score of 69, a rating of “weak”. It should be noted that Uganda has a “very strong” anti-corruption legal framework, which is commendable. However, Uganda has two areas reflecting a “very weak” rating: (i) political financing, and (ii) law enforcement.

Page 58
Integrity Indicators Scorecard of the Global Integrity Index and Report Uganda: Integrity Indicators Scorecard 2009
Overall Score: 69 – Weak Implementation Gap:54
Category I Civil Society, Public Information and Media 69 Weak I-1 Civil Society Organizations 69 Weak I-2 Media 78 Moderate I-3 Public Access to Information 60 Weak Category II Elections 61 Weak II-1 Voting & Citizen Participation 82 Strong II-2 Election Integrity 65 Weak II-3 Political Financing 35 Very Weak Category III Government Accountability 71 Moderate III-1 Executive Accountability 55 Very Weak III-2 Legislative Accountability 74 Moderate III-3 Judicial Accountability 80 Strong III-4 Budget Processes 75 Moderate Category IV Administration and Civil Service 72 Moderate IV-1 Civil Service Regulations 57 Very Weak IV-2 Whistle-blowing Measures 75 Moderate IV-3 Procurement 75 Moderate IV-4 Privatization 79 Moderate Category V Oversight and Regulation 73 Moderate V-1 National Ombudsman 81 Strong V-2 Supreme Audit Institution 77 Moderate V-3 Taxes and Customs 63 Weak V-4 State-Owned Enterprises 73 Moderate V-5 Business Licensing and Regulation 69 Weak Category VI Anti-Corruption and Rule of Law 71 Moderate VI-1 Anti-Corruption Law 100 Very Strong VI-2 Anti-Corruption Agency 69 Weak VI-3 Rule of Law 75 Moderate VI-4 Law Enforcement 40 Very Weak

Page 59
The Global Integrity data also allow for cross-country comparisons. Below are tables reflecting Global Integrity ratings for East African countries between 2006 and 2009. A gray box indicates data is not available. Civil Society, Public Information and Media
Country 2006 2007 2008 2009
Uganda 81 69 75 69
Kenya 68 75 68 61
Tanzania 63 53
Rwanda 63
Burundi 57
*Gray box indicates data not available
Elections Country 2006 2007 2008 2009
Uganda 74 58 65 61
Kenya 64 64 62 61
Tanzania 56 53
Rwanda 57
Burundi 58
*Gray box indicates data not available
Government Accountability Country 2006 2007 2008 2009
Uganda 76 65 70 71
Kenya 56 54 53 54
Tanzania 48 53
Rwanda 56
Burundi 44
*Gray box indicates data not available
Administration and Civil Service Country 2006 2007 2008 2009
Uganda 71 77 77 72
Kenya 70 78 77 77
Tanzania 55 65
Rwanda 80
Burundi 45
*Gray box indicates data not available
Oversight and Regulation Country 2006 2007 2008 2009
Uganda 81 78 72 73
Kenya 89 85 74 79
Tanzania 67 71
Rwanda 88
Burundi 66
*Gray box indicates data not available
Anti-Corruption and Rule of Law Country 2006 2007 2008 2009
Uganda 72 73 73 71
Kenya 79 80 82 81
Tanzania 66 66
Rwanda 81
Burundi 58
*Gray box indicates data not available

Page 60
7.2 Transparency International Global Corruption Barometer Transparency International Global Corruption Barometer is based on a survey that assesses the general public’s perception and experience of corruption in more than 60 countries around the world. In Uganda, the data was collected from 723 respondents. As is evident in the table below, when Ugandan respondents were asked if they had paid a bribe in any form, 53% responded “yes”, substantially higher than the 30% of Kenyans and 14% of Nigerians who claimed to have paid a bribe.
In the past 12 months have you or anyone living with you paid a bribe in any form?
Total Sample
Africa
CMR GHA KYA LBE NGA SEN SLE UGA ZAM TOTAL
Yes 12% 52% 40% 30% 78% 14% 35% 57% 53% 38% 23
No 81% 43% 56% 50% 12% 68% 53% 35% 44% 1% 61
DK 7% 5% 5% 20% 10% 18% 12% 8% 4% 60% 16
Global Population
1340249 7123 13000 19000 1252 141874 11000 2986 10734 4300 211269
Sample size
71610 519 1190 2007 1000 5007 1480 1000 1000 902 14105
*TI - Global Corruption Barometer 2008
The percentage of households that claimed to have paid a bribe to the police in Uganda was 53%, 2 percentage points lower than Kenya which has a Police Force that ranks the most corrupt institution in East Africa, according to East African Bribery Index. However, Uganda had a higher percentage of Police bribery compared to Nigeria where 40% admitted to paying a bribe to the police.
In the past 12 months have you or anyone living with you paid a bribe in any form to the Police?
Total Sample
Africa
CMR GHA KYA LBE NGA SEN SLE UGA ZAM TOTAL
Yes 23% 51 63 55 78 40 32 56 53 54 46
No 74 41 34 41 22 52 58 39 46 46 48
DK 2 8 1 2 0 8 4 4 6
NA 2 2 2 0 5 1 0 1
Global Population
274484 2720 3933 6362 697 28927 4593 1454 5181 1676 55544
Sample size
15784 183 360 687 557 1127 618 487 490 372 4881
*TI - Global Corruption Barometer 2008
The findings show that the percentage of citizens claimed to have paid a bribe to access Medical services is three times greater than Kenya and Nigeria. Relative to many other African countries, the bribery rate related to medical services in Uganda is notably high.

Page 61
In the past 12 months have you or anyone living with you paid a bribe in any form to Medical services? Total
Sample Africa
CMR GHA KYA LBE NGA SEN SLE UGA ZAM TOTAL
Yes 9% 24% 12% 11% 44% 8% 19% 36% 33% 12% 14%
No 88% 71% 85% 86% 55% 84% 77% 51% 67% 88% 80%
DK 1% 5% 1% 1% 0 8% 3% 11% 5%
NA 1% 3% 2% 1% 0 2% 3% 1%
Global Population
757239 5256 8739 12465 958 46013 7366 2472 8936 3051 95256
Sample size
44714 377 800 1313 765 1781 991 828 822 660 8337
*TI - Global Corruption Barometer 2008 In Uganda, 34% of citizens admitted to having paid a bribe to the Judiciary, a comparable rate to Kenya’s 35%. According to Transparency international’s regional aggregate index (of Sub-Saharan Africa), the judiciary in the East African region has performed dismally, with Kenya ranking 8th and Uganda 14th in region.
In the past 12 months have you or anyone living with you paid a bribe in any form to the Judiciary?
Total Sample
Africa
CMR GHA KYA LBE NGA SEN SLE UGA ZAM TOTAL
Yes 16% 44% 44% 35% 71% 18% 30% 42% 34% 39% 29%
No 80% 52% 51% 62% 29% 64% 61% 52% 66% 61% 61%
DK 2% 3% 2% 1% 0 17% 6% 5% 9%
NA 2% 1% 2% 2% 0 4% 2% 1%
Global Population
146424 1962 2382 2488 473 11711 3181 1036 2529 939 26700
Sample size 9141 142 218 268 378 472 428 347 230 196 2679 *TI - Global Corruption Barometer 2008
When respondents were asked if they had paid a bribe to the Educational System during the last 12 months, 15% of the respondents in Uganda indicated “yes”, an identical rating to Nigeria. The rate is substantially higher than the 9% of Kenya. In the past 12 months have you or anyone living with you paid a bribe in any form to the Education System
Total Sample
Africa
CMR GHA KYA LBE NGA SEN SLE UGA ZAM TOTAL
Yes 9% 34% 20% 9% 65% 15% 18% 49% 15% 16% 17%
No 88% 63% 78% 87% 35% 80% 75% 41% 85% 84% 79%
DK 1% 3% 2% 1% 5% 4% 8% 4%
NA 1% 1% 3% 0 3% 2% 1%
Global Population
538862 5425 7527 10746 1045 62272 6645 2329 7744 2492 106225
Sample size
32419 390 689 1134 835 2402 894 780 723 536 8383
*TI - Global Corruption Barometer 2008

Page 62
7.3 Media Sustainability Index
The Media Sustainability Index (“MSI”) is a tool to assess the development of media systems over time and across countries. It includes 5 indicators, one of which is directly relevant to the DTM. The MSI indicator related to “Free Speech” evaluates the following aspects of a media system: i. Legal and social protections of free speech exist and are enforced; ii. Licensing of broadcast media is fair, competitive, and political; iii. Market entry and tax structure for media are fair and comparable to other industries; iv. Crimes against journalists or media outlets are prosecuted vigorously, but occurrences of such
crimes are rare; v. State or public media do not receive preferential legal treatment, and law guarantees editorial
independence; vi. Libel is civil law issue; public officials are held to higher standards, and offended parties must prove
falsity and malice; vii. Public information is easily accessible; right of access to information is equally enforced for media
and journalists; viii. Media outlets have unrestricted access to information; this is equally enforced for media and
journalists; ix. Entry into journalism profession is free, and government imposes no licensing, restrictions, or
special rights for journalists. Anti-corruption requires that information be readily available and accessible to the public. As a primary source of public information, the media must have access to information, and must be encouraged to investigate and report on information which holds government accountable to the public. Below is a table of ratings associated with MSI’s Free Speech indicator. Uganda’s rating increased slightly from 2007 to 2008, from 2.27 to 2.36. Uganda’s score reflects that its performance “has begun to meet many aspects of Free Speech, but progress may be too recent to judge or still dependent on current government or political forces.” Should Uganda’s rating continue to improve over time, and become closer to 3.0, its rating will reflect an improvement in implementation and sustainability of Free Speech aspects of the media system.
Media Sustainability Index – Free Speech
Country 2007 2008
Uganda 2.27 2.36
Kenya 1.99 2.08
Tanzania 2.31 2.65
Rwanda 2.53 2.65
Burundi 2.13 2.13

Page 63
7.4 World Governance Indicators (WGI)
The World Governance Indicators assess six dimensions of governance. The DTM includes three of these, as defined below. More information on the background of the World Governance Indicators can be found in Annex VII. 1. Voice and Accountability (VA) – This dimension reviews the process by which governments are
selected, monitored, and replaced by capturing perceptions of the extent to which a country's citizens are able to participate in selecting their government, as well as freedom of expression, freedom of association, and a free media.
Uganda scores in approximately the 30th percentile in terms of voice and accountability. This ranking is slightly lower than Tanzania and Kenya, and higher than Rwanda and Burundi.

Page 64
2. Government Effectiveness (GE) – This dimension reviews the capacity of the government to effectively formulate and implement sound policies by capturing perceptions of the quality of public services, the quality of the civil service and the degree of its independence from political pressures, the quality of policy formulation and implementation, and the credibility of the government's commitment to such policies.
Uganda scores in the 30th percentile in terms of Government Effectiveness. This ranking is slightly lower than Rwanda and Tanzania, although above Kenya and Burundi.
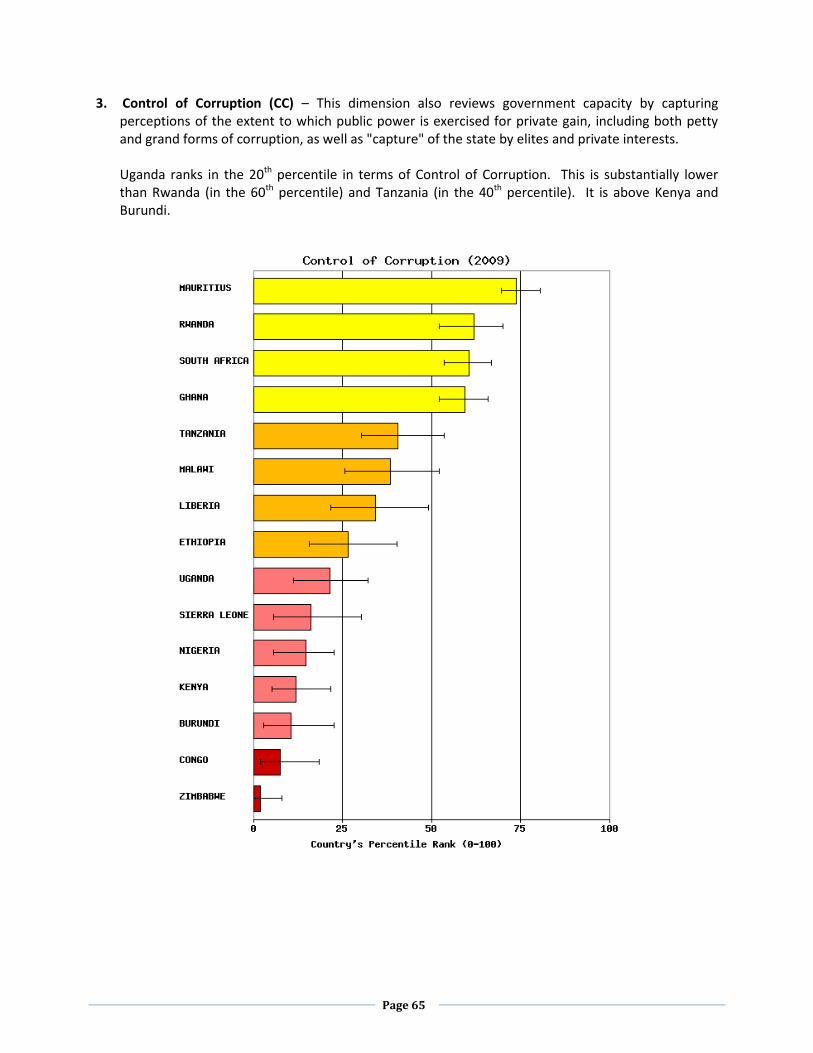
Page 65
3. Control of Corruption (CC) – This dimension also reviews government capacity by capturing perceptions of the extent to which public power is exercised for private gain, including both petty and grand forms of corruption, as well as "capture" of the state by elites and private interests.
Uganda ranks in the 20th percentile in terms of Control of Corruption. This is substantially lower than Rwanda (in the 60th percentile) and Tanzania (in the 40th percentile). It is above Kenya and Burundi.

Page 66
8. CONCLUSIONS AND RECOMMENDATIONS
This report has reviewed multiple sources of data which shed light on corruption in Uganda. While some areas of anti-corruption activity reveal strong performance – particularly those related to the legal and regulatory framework– other areas indicate weak performance of government, in particular, political governance, procurement, enforcement of anticorruption laws, and citizen and enterprise bribery. In addition, some data merits additional investigation, such as bribery data which varies depending on source and methodology. These particular sets of data will undergo further evaluation as we monitor corruption trends in 2011. It is important to note that a number of GoU entities have taken it upon themselves to track data related to corruption on a consistent and frequent basis. This is a critical first step for establishing a foundation for expanding government activities to understand and combat public sector corruption, and to design reforms with stronger safeguards for public resources. The IG, UBOS, DPP, and the Police merit recognition in this area. Our recommendations below involve broader proposals associated with the government’s anti-corruption effort, as well as more specific suggestions associated with individual Ministry, Department, or Agency activities or supporting governmental efforts. More specific recommendations are made in the individual sections of this report. We recommend that relevant functional and sectoral governmental institutions review the sections of the report which are pertinent to their mandate. The more general recommendations below are made with the aim of working collaboratively with the Government and other stakeholders to reduce corruption at a critical time in the development of Uganda. 1. Address the Implementation Gap – Focus on Enforcement. The implementation gap in Uganda is
“huge” reflecting the sizable gap between Uganda’s anti-corruption laws "on the books" and the actual enforcement of those same laws.
a. We recommend that Parliament and the Executive recognize that implementation efforts of
what is otherwise a strong legal framework that allows for the prevention, detection, and enforcement of corruption reflects a lack of commitment to real change in this area and that implementation efforts should be redoubled.
b. To tackle the challenge posed by anti-corruption enforcement, the Government of Uganda
should consider adoption and implementation of good enforcement practices similar to those of other countries which have made a serious commitment in this area. One important area of strong model practices relates to the acceleration of processing of corruption-related prosecutions in courts. These accelerated processes reduce/eliminate the phenomenon of unpunished corruption that tends to deepen its institutionalization. Evidence of strong practices can be seen in Bangladesh, Ghana, and Singapore. In this area, Bangladesh has adopted a 60-day timeline for handling corruption prosecution. Ghana has established “fast-track” courts for corruption cases. Singapore uses speedy and effective prosecutorial methods, including the protection of whistleblowers. The key is not just designing new programs and institutions but ensuring that actual practices conform to the intent. We would recommend that government study these examples and adopt at least one of the mechanisms tested elsewhere as a way to accelerate prosecutions.

Page 67
2. Bolster Competitive Procurement Efforts. PPDA should continue to ensure that procurement processes are transparent and competitive by publishing regular reports to the public at least annually on the status of contractual activity in the government using the PPMS system. Reports should be posted on the PPDA website to ensure accessibility to the public. This reporting should address the extent to which procurements are open and competitive, and the level of procurements which include evaluation criteria. Normally, these practices help reduce corrupt practices and increase the chances of obtaining value for money in public spending. These methods are considered to be critical aspects of reducing corruption in infrastructure-related procurement. In addition, PPMS should provide to the public and the press a list of all contractors awarded a contract in a given period, the amount of the contract, and the contract purpose. This information should be provided on a quarterly basis.
3. Institutionalize Citizen Participation, especially with Auditing. Citizen participation can minimize the
opportunities for corruption. As has been proven in Indonesia, combining auditing with citizen participation can be an important means of strengthening anti-corruption efforts. We recommend that the Auditor General commence a regular process of announcing audits of public infrastructure projects to national and local communities, and hold community-level town meetings to discuss audit findings upon completion of infrastructure projects. Over the next year, we recommend that the Auditor General conduct 20 audits which include the citizen participation approach described above. Results of the audits should be announced in the papers in the relevant district, and this information should be posted at the District’s notice board.
4. Streamline Procedures and Minimize Discretion. Minimizing discretion of public officials and streamlining procedures can have a big impact on reducing bribery. A serious government effort to minimize bribery would involve implementing these approaches by function and by sector. We recommend that the Prime Minister’s Office direct individual MDA’s responsible for the administrative procedures identified in this report to initiate business process reviews with the aim of reforming these procedures. The Prime Minister’s Office would monitor progress on the reviews and reforms. Those procedures might include starting a business, securing a construction permit, registering a property, making tax payments, enforcing contracts, securing a driver’s license, obtaining an educational certificate, securing a land title, and connection and disconnection of utilities.
5. Curb Corruption in Public Works. Without consistent and frequently reported data on
infrastructure projects, it will be difficult to curb corruption in the public works sector. A first step for improving data in this area is for BMAU to start immediately to collect data associated with the following indicators for all of its infrastructure project evaluations (including roads, hospitals and other public works): (i) unit prices for construction components at entry (based on the amount at the contract signing) and exit (exist costs include variation of quantities and amendments of contract, etc); and (ii) project costs and the unit costs estimates included in detailed engineering studies (DES).
6. Generate Accurate Data on the Outcomes and Duration of Anti-Corruption Cases. The IG is a central
actor in the fight against corruption. It has made great strides to report routinely on its activities related to investigating and prosecuting of corruption cases. Nevertheless, the efforts of the IG could be improved. The IG Reports to Parliament would benefit from improving data accuracy, rigor, and integrity. Additional information which focuses on the outcome of corruption cases over

Page 68
time would be beneficial. This type of focus would assess how long it takes (on average) for corruption cases to be resolved, and the likelihood of a culprit to be sanctioned, administratively or judicially. Determining the outcome of cases over time is of particular importance because many corruption cases unfold over a multi-year period.
7. Ensure all Anti-Corruption Entities Provide Useful Information on Public Sector Corruption. The
government should support efforts to ensure that all anti-corruption entities in the government are generating regular and comprehensive reports to the public related to outcomes and performance associated with public sector anti-corruption activities. Activities (or cases) involving public sector officials or resources should be distinguished from strictly private sector corruption activities. The reports should be based upon consistent and frequent data collection. If the entity is involved with anti-corruption cases (such as the IG, CID, DPP, and the Anti-Corruption Division of the High Courts), its reports should emphasize data which reveals the outcome of cases and the average length of time associated with resolution of a corruption case. If the entity is involved in broader efforts to combat corruption (such as DEI, PSC, the Local Government Commission, and the Inspectorate of Courts), data should focus on anti-corruption outcomes. If not already being conducted, annual reports should be developed and posted on the Internet for public dissemination. Reports should remain available on-line for a ten year period, in order to track progress over time. The IG and DEI should conduct specialized broadcasts to disseminate report highlights to rural areas.
8. Strengthen Efforts to Collect and Make Available Corruption Data. Numerous governmental entities
generate information which is useful to the DTM. These entities include the IG, the Auditor General,
BMAU (MOFPED), the Police (including the Criminal Investigations Division), DPP, Anti-Corruption Division in the High Court, DEI, Public Service Commission, Local Government Commission, Inspectorate of Courts, and UBOS. This data helps citizens understand the nature of governmental efforts to combat corruption, and the areas where corruption is greatest. These entities should be more proactive to collect consistent and frequent data related to corruption, and should make available their reports or surveys on the Internet for a ten-year period. A specific example of how government can be more pro-active in this area is to collect corruption data by sector. One such example would be for UBOS to collect data on stockouts in health facilities, a problem which appears to have a linkage to corruption (in addition to other factors) in the health sector.
9. Understand the Extent to Which Absenteeism Contributes to Corruption in Uganda. Absenteeism, a
key form of “quiet corruption”, may be an important part of the corruption landscape in Uganda, yet data in this area is contested. We recommend that the Government of Uganda request UBOS to collect data which is focused on absenteeism in the health and education sectors. Possible approaches to understanding this problem include conducting surveys at health and education facilities of users, as well as surveying public officials serving at the District Service Commissions (which are charged with recruitment and disciplinary actions). This data has now been included in existing surveys conducted by UBOS and should be made public.
10. Enforcement of Political Financing Disclosure. Although no modern state has eliminated corruption
from its party and campaign finances, the Government of Uganda could seek to reduce the scope for corruption by strengthening the enforcement of disclosure laws and regulations. There is need to ensure that disclosure laws include clear enforcement guidelines and penalties for non-compliance. In addition, within 3 months, the Electoral Commission should take the steps necessary to enforce disclosure of financial records of individual candidates and political parties as stipulated by law, and such information should be made publicly available.

Page 69
Annex I—Disaggregated and Aggregated Indicators Below is a brief description of disaggregated and aggregated indicators.
Disaggregated “Actionable” Indicators. “Actionable” indicators focus on specific and narrowly-defined aspects of corruption (and governance) to produce a measurement that points to possible reform action. They are often referred to as disaggregated, since they may be used in the compilation of aggregated indicators. The advantages of actionable indicators stem from their specificity. They are narrowly-defined disaggregated indicators that offer greater clarity regarding the steps governments can take to improve their scores or ratings. Actionable indicators provide evidence on, and aim to establish links between, the design and performance of governance systems. Because of their specificity, actionable indicators can measure inputs, processes, outputs, performance, and other elements of governance systems with less ambiguity about what is being measured. The drawbacks of actionable indicators are a consequence of their narrow focus and they should, therefore, be viewed in conjunction with aggregated indicators to judge the overall quality of corruption (or governance) systems. Actionable indicators must be carefully constructed to reflect the actionability of an indicator, i.e., to establish the link between actions and indicator values. As the DTM continues to draw on researched data and findings, we should start to see clearly how the AGIs ultimately influence governance outcomes.
For the DTM, disaggregated actionable indicators aim to generate specific information about the sources and nature of corruption in Uganda. These indicators support the evaluation of corruption prevention, detection, and enforcement. They cover a wide range of functions and sectors prone to corruption including service delivery in the health and education sectors, procurement, budgeting, auditing, civil service payroll and management, public disclosure of information, promotion of free press, legislative scrutiny, and bribery.
Aggregated Indicators. Aggregated (or composite) indicators related to corruption compile information from several different sources to construct a broad measurement of corruption (and governance). The advantages of aggregated indicators relate to their composition and extensive scope. Aggregated indicators provide a helpful way to summarize, combine, and organize information and, as such, they allow for the inclusion of complementary measures of corruption (and governance) in a single indicator. They also offer a more informative picture of the overall corruption (and governance) in an area than indicators focusing on specific matters of corruption. Margins of error can be calculated for aggregated indicators, and measurement errors often cancel out, provided that the information used to construct the underlying indicators is gathered from independent sources. Drawbacks of aggregated indicators involve issues with comparability and specificity. Comparisons over time could be problematic, as the methodologies and sources of many aggregated indicators change from year to year, either due to improvements in the construction of indicators or the (un) availability of data sources. Although aggregated indicators do not provide information on precise aspects of corruption (or governance), thus leaving policymakers uncertain of the steps needed to improve governance, the role that they play in providing the overall picture of corruption in certain situations tends to compensate for their weaknesses. Moreover, if it is required, indicators that are combined in an aggregated indicator can themselves be analysed separately to provide some insight into the individual effects that they have on the overall aggregated indicator.

Page 70
In Uganda, the aggregated indicators which have been selected for the DTM are designed to “take the pulse” of corruption in the country. Data generated by these aggregated indicators provides a useful snapshot of overall progress made in the country related to corruption. Collectively, these indicators will take into account transparency, accountability, public dissemination of information and public participation, free speech, bribery, rule of law, civil service management, and elections. This data can be used to determine if the country is improving, regressing, or holding constant in its efforts to combat corruption.
The selected disaggregated and aggregated indicators serve as a starting point for the DTM. We anticipate ongoing refinement of these indicators, and constant expansion of the DTM. The selected indicators were deemed to serve as a useful first step for monitoring corruption trends in Uganda and for providing useful information for reform. This latter objective – of being a reform-oriented tool – is a critical element of the DTM. The selected indicators are, in no way or form, a complete set of corruption indicators. Corruption covers a wide span of public and private activity. The DTM effort focuses mainly on public activity. In addition, while 76 indicators may seem a plentiful number, in reality this is a modest number of indicators, given that corruption is evident in multiple sectors and functions across government. The aim of the DTM is to start modestly, and build over time. Once comfortably operational, the DTM will expand to meet stakeholder demand for additional corruption data relevant to Uganda.

Page 71
Annex II—Indicators to Monitor Anti-Corruption Performance in Uganda Indicators for the Data Tracking Mechanism (DTM) – 71 in Total
Actionable Disaggregated Indicators (Total: 56)
Thematic Areas:
Public Sector Management
Oversight Institutions and Rules
Citizens/Firms
Civil Society/Media
Political Governance
Thematic Area
Indicator Data Source (including Most Recent Year and Selected
Data) Public Sector Management
Depoliticized, Meritocratic Civil Service Management - Transfers and Bribery
Average quarterly transfer rate for civil servants over the most recent three calendar years
World Bank - Human Resource Management (“HRM”) Most Recent Year: (2008) DETECTION
Depoliticized, Meritocratic Civil Service Management - Transfers and Bribery
Average quarterly transfer rate for civil servants only for quarters in which or immediately after which the ruling party or coalition changed over the most recent three calendar years
World Bank - Human Resource Management (“HRM”) Most Recent Year: (2008) DETECTION
Depoliticized, Meritocratic Civil Service Management - Transfers and Bribery
Average quarterly transfer rate for civil servants only for quarters in which or immediately after which the head of Government changed without a change in the ruling party or coalition over the most recent three calendar years
World Bank - Human Resource Management (“HRM”) Most Recent Year: (2008) DETECTION
% of sampled contracts subject to open competition: Percentage of sampled procurements Procurement Performance Measurement System (PPMS)

Page 72
subject to open competition by value and number (all pilot PDEs) Most Recent Year: 2008/2009 PREVENTION
Compliance with evaluation process criteria: Percentage sampled procurements with disclosed evaluation criteria actually applied (all pilot PDEs)
Procurement Performance Measurement System (PPMS) Most Recent Year: 2008/2009 PREVENTION
Question 70.
Indicator: The extent to which the executive holds consultations with the public as part of its
process of determining budget priorities.
Open Budget Initiative - Open Budget Index Most Recent Year: 2008 PREVENTION
Question 88.
Indicator: The extent to which in-year reports released to the public compare actual year-to-
date revenue collections with either the original estimate for that period (based on the
enacted budget) or the same period in the previous year.
Open Budget Initiative - Open Budget Index Most Recent Year: 2008 DETECTION
Question 103.
Indicator: The extent to which the year-end report explains the difference between the
enacted levels (including in-year changes approved by the legislature) and the actual outcome
for expenditures.
Open Budget Initiative - Open Budget Index Most Recent Year: 2008 DETECTION
Question 105.
Indicator: The extent to which the year-end report explains the difference between the
enacted levels (including in-year changes approved by the legislature) and the actual outcome
for revenues.
Open Budget Initiative - Open Budget Index Most Recent Year: 2008 DETECTION
Questions 701-704. Number of cases of corruption reported in your organization over the last 4 years:
Year Options None - 1 1-4 - 2 5-9 - 3 10 & above - 4
2004
2005
2006
2007
National Integrity Survey Most Recent Year: 2008 DETECTION
Questions 709-712. Number of reported cases of corruption which result in suspension or dismissal:
Year Options None - 1 1-4 - 2
2004
2005
National Integrity Survey Most Recent Year: 2008 ENFORCEMENT

Page 73
2006 5-9 - 3 10 & above - 4 2007
Question 714-717. Number of reported cases of corruption taken to courts of law which resulted in conviction of culprits:
Year Options None - 1 1-4 - 2 5-9 - 3 10 & above - 4
2004
2005
2006
2007
National Integrity Survey Most Recent Year: 2008 ENFORCEMENT
Section 2A: Education Primary, Question 224(2) pg 8 – Accountability in the School: % of
primary education facilities involving misuse of funds in last financial year. (NSDS, 2008)
National Service Delivery Survey Service Providers Questionnaire Most Recent Year: 2008 DETECTION
Section 2A: Education Primary, Question 224(5) pg 8 – Accountability in the School: % of
primary education facilities involving misuse of funds in the last financial year where no action
was taken on the culprit. (NSDS, 2008)
National Service Delivery Survey Service Providers Questionnaire Most Recent Year: 2008 ENFORCEMENT
Section 2B: Education Secondary, Question 224(2) page 14 – Accountability in the School: %
of secondary education facilities involving misuse of funds in last financial year. (NSDS, 2008)
National Service Delivery Survey Service Providers Questionnaire Most Recent Year: 2008 DETECTION
Section 2B: Education Secondary, Question 224(5) page 14 – Accountability in the School: %
of secondary education facilities involving misuse of funds in the last financial year where no
action was taken on the culprit (NSDS, 2008)
National Service Delivery Survey Service Providers Questionnaire Most Recent Year: 2008 ENFORCEMENT
Section 3: Health, Question 307(3) page 16 – Services offered by this health facility (note list
of alternative service options): % of patients paying for drugs in government health facilities.
(NSDS, 2008)
National Service Delivery Survey Service Providers Questionnaire Most Recent Year: 2008 DETECTION
Section 3: Health Services, Question 321 (2): Accountability in the Health facility: % of
health facilities involving misuse of funds in last financial year. (NSDS, 2008)
National Service Delivery Survey Service Providers Questionnaire Most Recent Year: 2008

Page 74
DETECTION
Section 3(5): Health Services, Question 321: Accountability in the Health facility: % of health
facilities involving misuse of funds in last financial year where no action was taken on the
culprit. (NSDS, 2008)
National Service Delivery Survey Service Providers Questionnaire Most Recent Year: 2008 ENFORCEMENT
Section 8: Governance, Question 808(2): Accountability in the Sub County and rating of
overall performance of the sub county Administration: % of sub-counties involving misuse of
funds in last financial year. (NSDS, 2008)
National Service Delivery Survey Service Providers Questionnaire Most Recent Year: 2008 DETECTION
Section 8: Governance, Question 808(5): Accountability in the Sub County and rating of
overall performance of the sub county Administration: % of sub-counties involving misuse of
funds in last financial year where no action was taken on the culprit. (NSDS, 2008)
National Service Delivery Survey Service Providers Questionnaire Most Recent Year: 2008 ENFORCEMENT
Section 9: Justice, Law and Order, Question 902(2): Accountability in institutions and rating
of overall performance: % of Local Council II involved in misuse of funds (NSDS, 2008)
National Service Delivery Survey Service Providers Questionnaire Most Recent Year: 2008 DETECTION
Section 9: Justice, Law and Order, Question 902(2): Accountability in institutions and rating
of overall performance: % of Local Council II involved in misuse of funds where no action was
taken on the culprit. (NSDS, 2008)
National Service Delivery Survey Service Providers Questionnaire Most Recent Year: 2008 ENFORCEMENT
Formal Oversight Institutions
Information related to Judicial Sanctions resulting from IG-related Cases: number of
complaints, number of arrests, prosecutions and status of prosecution, and judicial outcome.
Bi-Annual Report of the Inspectorate of Government (IG) Most Recent Year: Jan-July 2009 PREVENTION, DETECTION, ENFORCEMENT
Question 102.
Indicator: The extent to which the data on actual outcomes (as reflected in the year-end
report) been audited.
Open Budget Initiative - Open Budget Index Most Recent Year: 2008 DETECTION
Question 112.
Indicator: The percentage of annual expenditures that has been audited and, except for
secret programs, the reports released to the public from two years after the completion of a
fiscal year.
Open Budget Initiative - Open Budget Index Most Recent Year: 2008 DETECTION
Question 115. Open Budget Initiative - Open Budget Index

Page 75
Indicator: The extent to which the Supreme Audit Institution releases to the public audits of
extra-budgetary funds.
Most Recent Year: 2008 DETECTION
Question 119.
Indicator: The extent to which the Supreme Audit Institution maintains formal mechanisms of
communication with the public to receive complaints and suggestions to assist it in
determining its audit program (that is, to identify the agencies, programs, or projects it will
audit).
Open Budget Initiative - Open Budget Index Most Recent Year: 2008 DETECTION
Question 121.
Indicator: The extent to which the executive makes available to the public a report on what
steps it has taken to address audit recommendations or findings that indicate a need for
remedial action.
Open Budget Initiative - Open Budget Index Most Recent Year: 2008 DETECTION
Question 122.
Indicator: The extent to which the Supreme Audit Institution or the legislature releases to the
public a report that tracks actions taken by the executive to address audit recommendations.
Open Budget Initiative - Open Budget Index Most Recent Year: 2008 DETECTION
Performance Indicator 28 - Legislative scrutiny of external audit reports Timeliness of examination of audit reports by the legislature (for reports received within the last three years)
World Bank - Public Expenditure and Financial Accountability (“PEFA”) Most Recent Years: 2005, 2008 PREVENTION AND DETECTION
Performance Indicator 28 - Legislative scrutiny of external audit reports Extent of hearings on key findings undertaken by the legislature
World Bank - Public Expenditure and Financial Accountability (“PEFA”) Most Recent Years: 2005, 2008 PREVENTION AND DETECTION
Performance Indicator 28 - Legislative scrutiny of external audit reports Issuance of recommended actions by the legislature and implementation by the executive
World Bank - Public Expenditure and Financial Accountability (“PEFA”) Most Recent Years: 2005, 2008 PREVENTION AND DETECTION
Annual Audit Reports: • unaccounted for funds • payments in arrears • wastage of public resources • theft of public resources (for discussion)
Annual Audit Reports, Auditor General DETECTION

Page 76
Value for Money Audits
diversion of public funds
wastage of public resources (for discussion)
Value for Money Audits, Auditor General DETECTION
Forensic Reports
fraud or embezzlement indicator (for discussion)
Forensic Reports, Auditor General DETECTION
Annual % increase of evaluations (for discussion)
Quarterly Budget Monitoring and Analysis Unit (BMAU) Progress Reports, MoFPED DETECTION
Number of cases of corruption registered and investigated by the police
Ugandan Police – Annual Crime Report Most Recent Data and Year: 46 (in 2008) and 12 (in 2007) DETECTION
Number of reported cases to the police which were taken to court
Ugandan Police – Annual Crime Report Most Recent Data and Year: 40 (2008) ENFORCEMENT
Number of reported cases to the police which were still under inquiry by the close of the year
Ugandan Police – Annual Crime Report Most Recent Data: 6 (2008) ENFORCEMENT
Citizens/Firms Question 51a. In the past year, how often (if ever) have you had to pay a bribe, give a gift, or
do a favour to government officials in order to get a document or a permit?
Afrobarometer Indicators/Afrobarometer Survey Most Recent Year: 2008, Round 4 DETECTION
Question 51b. In the past year, how often (if ever) have you had to pay a bribe, give a gift, or do a favour to government officials in order to get water or sanitation services?
Afrobarometer Indicators/Afrobarometer Survey Most Recent Year: 2008, Round 4 DETECTION
Question 51c. In the past year, how often (if ever) have you had to pay a bribe, give a gift, or Afrobarometer Indicators/Afrobarometer

Page 77
do a favour to government officials in order to avoid a problem with the police (like passing a checkpoint or avoiding a fine or arrest)?
Survey, Round 4 Most Recent Year: 2008 DETECTION
Starting a Business
Procedures (number) of Starting a Business
World Bank – Doing Business Most Recent Year: 2010 DETECTION
Dealing with Construction Permits
Procedures (number) of Dealing with Construction Permits
World Bank – Doing Business Most Recent Year: 2010 DETECTION
Registering Property
Number of procedures associated with registering a property
World Bank – Doing Business Most Recent Year: 2010 DETECTION
Paying Taxes Payments (number per year)
World Bank – Doing Business Most Recent Year: 2010 DETECTION
Enforcing Contracts
Procedures (number)
World Bank – Doing Business Most Recent Year: 2010 DETECTION
Civil Society and Media
Indicator 9. Are the media able to report on corruption? 9b: In practice, the government or media owners/distribution groups do not encourage self-censorship of corruption-related stories. 9c: In practice, there is no prior government restraint (pre-publication censoring) on
publishing corruption-related stories.
Integrity Indicators Scorecard of the Global Integrity Index and Report Most Recent Data and Year: 67 (2008) DETECTION
Indicator 11. Are journalists safe when investigating corruption? 11a: In practice, in the past year, no journalists investigating corruption have been imprisoned. 11b: In practice, in the past year, no journalists investigating corruption have been physically harmed. 11c: In practice, in the past year, no journalists investigating corruption have been killed.
Integrity Indicators Scorecard of the Global Integrity Index and Report Most Recent Data and Year: 67 (2008) DETECTION

Page 78
Political Governance
Indicator 22. Are the regulations governing the political financing of parties effective? 22a: In practice, the limits on individual donations to political parties are effective in regulating an individual's ability to financially support a political party. 22b: In practice, the limits on corporate donations to political parties are effective in regulating a company's ability to financially support a political party. 22c: In practice, the limits on total party expenditures are effective in regulating a political party's ability to fund campaigns or politically-related activities. 22d: In practice, when necessary, an agency or entity monitoring the financing of political parties independently initiates investigations. 22e: In practice, when necessary, an agency or entity monitoring the financing of political parties imposes penalties on offenders. 22f: In practice, contributions to political parties are audited.
Integrity Indicators Scorecard of the Global Integrity Index and Report Most Recent Data and Year: 17 (2008) PREVENTION AND DETECTION
Indicator 23. Are the regulations governing the political financing of individual candidates effective? 23a: In practice, the limits on individual donations to political candidates are effective in regulating an individual's ability to financially support a particular candidate. 23b: In practice, the limits on corporate donations to individual candidates are effective in regulating a company's ability to financially support a candidate. 23c: In practice, when necessary, an agency or entity monitoring the financing of individual candidates' campaigns independently initiates investigations. 23d: In practice, when necessary, an agency or entity monitoring the financing of individual candidates' campaigns imposes penalties on offenders. 23e: In practice, the finances of individual candidates' campaigns are audited.
Integrity Indicators Scorecard of the Global Integrity Index and Report Most Recent Data and Year: 25 (2008) PREVENTION AND DETECTION
Indicator 24. Can citizens access records related to the financing of political parties? 24a: In practice, political parties disclose data relating to financial support and expenditures within a reasonable time period. 24b: In practice, citizens can access the financial records of political parties within a reasonable time period. 24c: In practice, citizens can access the financial records of political parties at a reasonable
cost.
Integrity Indicators Scorecard of the Global Integrity Index and Report Most Recent Data and Year: 17 (2008) DETECTION

Page 79
Indicator 25. Can citizens access records related to the financing of individual candidates' campaigns? 25a: In practice, individual political candidates disclose data relating to financial support and expenditures within a reasonable time period. 25b: In practice, citizens can access the financial records of individual candidates (their campaign revenues and expenditures) within a reasonable time period. 25c: In practice, citizens can access the financial records of individual candidates (their
campaign revenues and expenditures) at a reasonable cost.
Integrity Indicators Scorecard of the Global Integrity Index and Report Most Recent Data and Year: 0 (2008) DETECTION
Indicator 29. Are there regulations governing conflicts of interest by the executive branch? 29f: In practice, the regulations restricting post-government private sector employment for heads of state and government and ministers are effective. 29g: In practice, the regulations governing gifts and hospitality offered to members of the executive branch are effective. 29h: In practice, executive branch asset disclosures (defined here as ministers and above) are
audited.
Integrity Indicators Scorecard of the Global Integrity Index and Report Most Recent Data and Year: 75 (2008) PREVENTION AND DETECTION
Indicator 38. Are there regulations governing conflicts of interest for the national-level judiciary? 38e: In practice, the regulations restricting post-government private sector employment for national-level judges are effective. 38f: In practice, the regulations governing gifts and hospitality offered to members of the national-level judiciary are effective. 38g: In practice, national-level judiciary asset disclosures are audited.
Integrity Indicators Scorecard of the Global Integrity Index and Report Most Recent Data and Year: 71 (2008) PREVENTION AND DETECTION

Page 80
Aggregated Indicators (Total: 15)
World Governance Indicators (World Bank)
Control of Corruption
Voice and Accountability
Government Effectiveness Integrity Indicators Scorecard of the Global Integrity Index and Report (Global Integrity)
• Anti-Corruption and Rule of Law • Civil Society, Public Information and Media • Elections • Government Accountability • Administration and Civil Service • Oversight and Regulation
Transparency International Global Corruption Barometer (Transparency International) • % of respondents reporting that they had paid a bribe in the previous 12 months • % of households which have paid a bribe for Medical Services during the past 12 months • % of households which have paid a bribe to the Judiciary during the past 12 months • % of households which have paid a bribe to the Police during the past 12 months • % of households which have paid a bribe to the Educational System during the past 12 months
Media Sustainability Index (IREX)
Free Speech

Page 81
Annex III—Scoring Systems
Global Integrity Index The Global Integrity Index groups countries into five performance "tiers" according to a country's overall aggregated score:
Very strong (90+)
Strong (80+)
Moderate (70+)
Weak (60+)
Very Weak (< 60) For binary yes/no "in law" indicators, scoring criteria are provided for both "yes (100)" and "no (0)" responses.
Media Sustainability Index Each indicator is scored on a scale of 0 to 4 using the following system: 0 = Country does not meet the indicator; government or social forces may actively oppose its implementation. 1 = Country minimally meets aspects of the indicator; forces may not actively oppose its implementation, but business environment may not support it and government or profession do not fully and actively support change. 2 = Country has begun to meet many aspects of the indicator, but progress may be too recent to judge or still dependent on current government or political forces. 3 = Country meets most aspects of the indicator; implementation of the indicator has occurred over several years and/or through changes in government, indicating likely sustainability. 4 = Country meets the aspects of the indicator; implementation has remained intact over multiple changes in government, economic fluctuations, changes in public opinion, and/or changing social conventions.

Page 82
Open Budget Initiative Responses “a” or “b” describe a situation or condition that represents good practice regarding the subject matter of the question. The responses “c” or “d” correspond to practices that are considered poor. An “a” response indicates that a standard is fully met, while a “d” response indicates a standard is not met at all. The fifth response is “e,” or not applicable. For the purposes of aggregating the responses, the numeric score of 100 percent was awarded for an “a” response, 67 percent for a “b”, 33 percent for a “c”, and zero for a “d.” The response of “e” caused the question not to be counted as part of the aggregated category.
Public Expenditure and Financial Accountability (PEFA)
Score Minimum requirements (Scoring methodology: M1)
A (i) Scrutiny of audit reports is usually completed by the legislature within 3 months from receipt of the reports. (ii) In-depth hearings on key findings take place consistently with responsible officers from all or most audited entities, which receive a qualified or adverse audit opinion. (iii) The legislature usually issues recommendations on action to be implemented by the executive, and evidence exists that they are generally implemented.
B (i) Scrutiny of audit reports is usually completed by the legislature within 6 months from receipt of the reports. (ii) In-depth hearings on key findings take place with responsible officers from the audited entities as a routine, but may cover only some of the entities, which received a qualified or adverse audit opinion. (iii) Actions are recommended to the executive, some of which are implemented, according to existing evidence.
C (i) Scrutiny of audit reports is usually completed by the legislature within 12 months from receipt of the reports. (ii) In-depth hearings on key findings take place occasionally, cover only a few audited entities or may include with ministry of finance officials only. (iii) Actions are recommended, but are rarely acted upon by the executive.

Page 83
D (i) Examination of audit reports by the legislature does not take place or usually takes more than 12 months to complete. (ii) No in-depth hearings are conducted by the legislature. (iii) No recommendations are being issued by the legislature.

Page 84
Annex IV—Global Integrity Assessment of Political Financing in Uganda http://report.globalintegrity.org/Uganda/2009/scorecard/26
20 Are there regulations governing the financing of political parties?
20a: In law, there are limits on individual donations to political parties.
Score: YES NO
Comments:
References: Parties and Organizations Act, 2005, Section 14 (1).
The persons or bodies referred to in subsections (2) of the act shall not directly or indirectly make a contribution, donation or loan whether in cash or in kind in excess of the value of 20,000 currency points within any period of 12 months, to funds held or to be held by or for the benefit of a
political party or organization. Persons specified in subsection 2, include a non-Ugandan citizen, a foreign government or diplomatic mission, a non-Ugandan nongovernmental organization, registered in Uganda under the NGO Registration Act.
20b: In law, there are limits on corporate donations to political parties. Score: YES NO
Comments:
References: Political Parties and Organizations Act, 2005, Section 14 (1). A foreign person or body cannot make a contribution to a political party or organization in excess of the value 400 million shillings (US$212,539).
Section 14 (3) of the Political Parties and Organizations Act, 2005, a political party or organization cannot ask for or receive a contribution in excess of the value of 4 billion shillings (US$2.1 million) from one or more foreign sources.
20c: In law, there are limits on total political party expenditures.
Score: YES NO
Comments:
References: Section 20, Political Parties and Organizations Act (PPOA), 2005 (Amended). 20d: In law, there are requirements for the disclosure of donations to political parties.
Score: YES NO
Comments:
References: Political Parties and Organizations Act, 2005 (amended), Section 9 (3) states:

Page 85
A declaration submitted to the electoral commission under subsections (1) or (2) shall state the sources of funds and other assets of the political party or organization.
Section 12 (1)(b) requires that every political party or organization maintains........a statement of its accounts, showing the sources of its funds and names of any person who has contributed to the funds including contributions by persons who are not citizens of Uganda, membership dues paid, donations in cash or kind and all the financial transactions of the political party or organization which are conducted through, by, or with the
head or national office of the party or organization. 20e: In law, there are requirements for the independent auditing of the finances and expenditures of political parties when financial
irregularities are uncovered. Score: YES NO
Comments:
References: Section 12 (3) of the Political Parties and Organizations Act, 2005 (Amended) states that the accounts of every political party or organization shall be audited once in every year but not later than six months after its financial year by an auditor from a recognized professional
body. 20f: In law, there is an agency or entity that monitors the financing of political parties.
Score: YES NO
Comments:
References: Section 12(4) of the Political Parties and Organizations Act, 2005 (Amended) (PPOA) requires political parties to file with the electoral commission audited statement of accounts, including a written declaration of assets and liabilities within 60 days after the first year of registration,
audited statements of accounts within six months from the end of the financial year of a political party or organization
21 Are there regulations governing the financing of individual political candidates?
21a: In law, there are limits on individual donations to political candidates. Score: YES NO
Comments: However, the law doesn't list or define what the lawful means are, except that it provides on on asking for and receiving funds for campaign from a foreign government, institution body or person (sec.22(4)).
There is no requirement to disclose the source of a candidate's electoral campaign finances except that a candidate is to keep a record of all funds
he/she asked for and received and their sources (sec.22(6)) and account, within 30 days after the election, for the use of public resources including 20 million shillings (US$10,678) made as contribution from the electoral commission to all candidates (Handbook for civil society on
elections and electoral campaigns under the multiparty political system, January 2006, Transparency International Uganda.)
References: Presidential Elections Act, 2005, section 22 (2)-(3). This provides that a candidate or his agents may raise additional funding for a candidate's campaign through lawful means.
(Handbook for civil society on elections and electoral campaigns under the multiparty political system, January 2006, Transparency International Uganda.)
Peer Review Comments: But the limits on individual donations to political candidates are not so effective. 21b: In law, there are limits on corporate donations to individual political candidates.

Page 86
Score: YES NO
Comments: However, the law doesn't list or define what the lawful means are, except that it provides on on asking for and receiving funds for campaign from a foreign government, institution body or person (sec.22(4)).
There is no requirement to disclose the source of a candidate's electoral campaign finances except that a candidate is to keep a record of all funds
he/she asked for and received and their sources (sec.22(6)) and account, within 30 days after the election, for the use of public resources including 20 million shillings (US$10,678) made as contribution from the electoral commission to all candidates (Handbook for civil society on
elections and electoral campaigns under the multiparty political system, January 2006, Transparency International Uganda.)
References: Presidential Elections Act, 2005, section 22 (2)-(3). This provides that a candidate or his agents may raise additional funding for a candidate's campaign through lawful means.
(Handbook for civil society on elections and electoral campaigns under the multiparty political system, January 2006, Transparency International Uganda.)
Peer Review Comments: There are limitations, but candidates get support from many undisclosed sources. 21c: In law, there are requirements for the disclosure of donations to individual political candidates. Score: YES NO
Comments: The legal regulation and restrictions on financing of candidates in elections are provided under the Presidential Elections Act 2005 and the Parliamentary Elections Act 2005.
With regard to presidential elections, the law requires a presidential candidate to submit an account for campaign finances to the Electoral
Commission in terms of all funds he or she asked for and received and their sources ( Sec. 22 (6) of the Presidential Elections Act 2005). However, more attention is put to the presidential elections than parliamentary elections. The only challenge is that these declarations are only made to the
Electoral Commission with a lot of restrictions for the public to access copies of the declarations.
References: Handbook for civil society on elections and electoral campaigns under the multiparty political system, January 2006, Transparency International Uganda.)
The Presidential Elections Act 2005 and the Parliamentary Elections Act 2005
Section 12, Political Parties and Organizations Act (PPOA), 2005 (Amended). 21d: In law, there are requirements for the independent auditing of the campaign finances of individual political candidates when
irregularities are uncovered.
Score: YES NO
Comments: The accounting to the Electoral Commission is to be done within 30 days after the elections are held.
References: Section 26 (6) of the Presidential Elections Act, 2005 requires that a candidate submits an account for campaign finances to the
Electoral Commission for the use of the public resources (20 million shillings (US$10,678)) and other facilities. 21e: In law, there is an agency or entity that monitors the financing of individual political candidates' campaigns. Score: YES NO

Page 87
Comments: The accounting to the Electoral Commission is to be done within 30 days after the elections are held. Accounts for campaign financing also include keeping a record of all funds a candidate asked for and received (and their sources).
References: Section 26 (6) of the Presidential Elections Act, 2005 requires that a candidate submits an account for campaign finances to the
Electoral Commission for the use of the public resources (including the 20 million shillings (US$10,678) contribution made to all candidates) and other facilities.
22 Are the regulations governing the political financing of parties effective?
22a: In practice, the limits on individual donations to political parties are effective in regulating an individual's ability to financially support a political party.
Score: 100 75 50 25 0
Comments: The enforcing organization (Electoral Commission) has failed to enforce penalties on violating political parties on declarations of assets, liabilities as well as audited accounts which has thus rendered provisions on funding to political parties unenforcible.
References: The EC Bulletin, Volume 6, Issue 1, May 2008 www.ec.or.ug
Peer Review Comments: The limits on individual donations to political parties provide minimal control.
Peer Review Comments: In practice, it there is no where it has been recorded to stop individual donations to political parties or even candidates. 22b: In practice, the limits on corporate donations to political parties are effective in regulating a company's ability to financially
support a political party. Score: 100 75 50 25 0
Comments: The enforcing organization (Electoral Commission) has failed to enforce penalties on violating political parties on declarations of
assets, liabilities as well as audited accounts which has thus rendered provisions on funding to political parties unenforcible.
References: The EC Bulletin, Volume 6, Issue, May 2008 www.ec.or.ug
Peer Review Comments: Limitations on corporate donations to political parties offer minimal control. 22c: In practice, the limits on total party expenditures are effective in regulating a political party's ability to fund campaigns or
politically-related activities. Score: 100 75 50 25 0
Comments: The enforcing organization (Electoral Commission) has failed to enforce penalties on violating political parties on declarations of
assets, liabilities as well as audited accounts which has thus rendered provisions on funding to political parties unenforcible.
References: www.ec.or.ug The EC Bulletin, Volume 6, Issue 1, May 2008 22d: In practice, when necessary, an agency or entity monitoring the financing of political parties independently initiates
investigations.
Score: 100 75 50 25 0
Comments: The Electoral Commission has never initiated any investigations even when it is clear that some political parties, including the NRM, have deviated from the provision requiring declaration of assets and liabilities, including audited accounts on an annual basis.

Page 88
References: www. EC Bulletin, Volume 6, Issue 1, May 2008 www.ec.or.ug Interview with an official from the Electoral Commission, Aug. 14,
2009 22e: In practice, when necessary, an agency or entity monitoring the financing of political parties imposes penalties on offenders. Score: 100 75 50 25 0
Comments:
References: Interview with an official from the Electoral Commission, Aug. 14, 2009 Media Reports (New Vision, Daily Monitor, The Weekly
Observer) 22f: In practice, contributions to political parties are audited. Score: 100 75 50 25 0
Comments: According to available reports, the political parties have failed to submit audited accounts on an annual basis to the electoral commission, so in essence they are indicating that their accounts are not audited.
References: Interview with an official from the Electoral Commission, Aug. 14, 2009 The EC Bulletin, Volume 6, Issue 1, May 2008
Peer Review Comments: Not practically done - theoratically recognised
23 Are the regulations governing the political financing of individual candidates effective?
23a: In practice, the limits on individual donations to political candidates are effective in regulating an individual's ability to financially support a particular candidate.
Score: 100 75 50 25 0
Comments: The Electoral Commission had failed to enforce penalties on candidates who fail to comply with the law.
References: Interview with the Electoral Commission www.ec.or.uf 23b: In practice, the limits on corporate donations to individual candidates are effective in regulating a company's ability to
financially support a candidate.
Score: 100 75 50 25 0
Comments: The electoral commission has failed to impose penalities on offenders, thus rendering the law ineffective.
References: Interview with the Electoral Commission www.ec.or.ug
Peer Review Comments: There is a lack of of enforcement of regulations on corporate donations to individual candidates. 23c: In practice, when necessary, an agency or entity monitoring the financing of individual candidates' campaigns independently
initiates investigations. Score: 100 75 50 25 0
Comments: The Electoral Commission has never imposed any penalty on offenders.
References: Interview with an Electoral Commission official, Aug. 14, 2009

Page 89
Peer Review Comments: Opposition parties have tried to initiate the auditing of election financing . For instance, the Democratic Party (DP) and Forum for Democratic Change (FDC) have been trying to initiate the auditing of NRM election financing.
23d: In practice, when necessary, an agency or entity monitoring the financing of individual candidates' campaigns imposes penalties on offenders.
Score: 100 75 50 25 0
Comments:
References: Interview with an official from the Electoral Commission 23e: In practice, the finances of individual candidates' campaigns are audited. Score: 100 75 50 25 0
Comments: Audits are not conducted because audited accounts have not been submitted to the Electoral Commission.
References: Interview with an official from the Electoral Commission The EC Bulletin, Volume 6, Issue 1, May 2009
24 Can citizens access records related to the financing of political parties?
24a: In practice, political parties disclose data relating to financial support and expenditures within a reasonable time period. Score: 100 75 50 25 0
Comments: Political parties have grossly failed to comply with the provisions of the law relating to declaration of assets and liabilities as well as audited accounts that indicate their finances and expenditures.
References: Interview with an official from the Electoral Commission The EC Bulletin, Volume 6, Issue 1, May 2008
Peer Review Comments: It never happens that political parties disclose data relating to financial support and expenditures within a reasonable
time period. 24b: In practice, citizens can access the financial records of political parties within a reasonable time period. Score: 100 75 50 25 0
Comments: The reports are not filed with the enforcing body (the Electoral Commission), and are not published on the respective party's website. On the other hand, citizens have not been educated enough to demand for this information, thus leaving them with no option for accessing
financial records of political parties, except through media reports.
References: Interview with an official from the Electoral Commission, Aug. 14, 2009
24c: In practice, citizens can access the financial records of political parties at a reasonable cost. Score: 100 75 50 25 0
Comments: The records are not available, so there is no cost incurred.
References: Interview with an official from the Electoral Commission, Aug. 14, 2009
24d: In practice, the publicly available records of political parties' finances are of high quality. Score: 100 75 50 25 0
Comments: There are no records available.

Page 90
References: Interview with an official from the Electoral Commission, Aug. 14, 2009
25 Can citizens access records related to the financing of individual candidates' campaigns?
25a: In practice, individual political candidates disclose data relating to financial support and expenditures within a reasonable time period.
Score: 100 75 50 25 0
Comments: No candidate has ever disclosed data relating to financial support and expenditure to the Electoral Commission.
References: www.ec.or.ug Interview with an official from the Electoral Commission, Aug. 14, 2009 25b: In practice, citizens can access the financial records of individual candidates (their campaign revenues and expenditures)
within a reasonable time period. Score: 100 75 50 25 0
Comments: There are no records available at the Electoral Commission.
References: www.ec.or.ug 25c: In practice, citizens can access the financial records of individual candidates (their campaign revenues and expenditures) at a
reasonable cost.
Score: 100 75 50 25 0
Comments: There are no records available to be accessed.
References: www.ec.or.ug
Peer Review Comments: It has never happened that citizens access the financial records of individual candidates (their campaign revenues and expenditures) at a reasonable cost.
25d: In practice, the publicly available records of political candidates' campaign finances are of high quality. Score: 100 75 50 25 0
Comments: There are no records available.
References: www.ec.or.ug Interview with an official from the Electoral Commission
Peer Review Comments: There is no evidence of the quality as the records of political candidates' campaign finances have not been submitted.

Page 91
Annex V—Global Integrity Assessment of Safety of Journalists Investigating Corruption
11 Are journalists safe when investigating corruption?
11a: In practice, in the past year, no journalists investigating corruption have been imprisoned.
Score: YES NO
Comments: On Tuesday, Aug. 11, 2009, Mr. Moses Akena, a Daily Monitor reporter based in northern Uganda was arrested and detained on
charges of criminal defamation following a story he wrote quoting the Gulu deputy Speaker Mr. Patrick Lumumba who alleged that Mr. Odongo had
abused the distribution of iron sheets to Internally Displaced Persons ( IDPs) in Gulu.
The article from which the charges are drawn was published in the Daily Monitor on July 8, 2009, and quoted that Mr. Odongo collected 30 iron sheets from Micheal Ojara, a disabled man, who gave them to his unidentified girlfriend.
References: The Daily Monitor, Wednesday, Aug. 12, 2009
Peer Review Comments: Journalist intimidation is a common feature. Andrew Mwenda often takes the spotlight in being arrested. 11b: In practice, in the past year, no journalists investigating corruption have been physically harmed.
Score: YES NO
Comments:
References: Media Reports (New Vision, Daily Monitor, the Weekly Observer) 11c: In practice, in the past year, no journalists investigating corruption have been killed.
Score: YES NO
Comments:
References: Media Reports (New Vision, Daily Monitor, The Weekly Observer)

Page 92
Annex VI—Data on Domestic Arrears, Outstanding Advances, and Excess
Expenditures
ANALYSIS OF DOMESTIC ARREARS FOR THE YEARS 2005/6, 2006/7, 2007/8 AND 2008/9
MDAs 2005/06 2006/07 2007/08 2008/09
Amount (Shs) Amount (Shs) Amount (Shs) Amount (Shs)
Min of Finance 55,556,680,911 23,945,104,070 25,636,669,577
Min of Defence 33,134,719,227 43,978,799,833 49,426,794,754 12,989,743,476
Min of Foreign Affairs 30,420,566,352 24,859,666,378 30,521,355,645 3,059,754
Min of East African Affairs 29,501,703 2,731,081
Min of Justice 20,766,605,675 3,512,717,895 55,246,821,739 112,221,219
State House 16,781,091,412 4,488,339,468 5,214,343,142 98,737,133,346
Min of Works, Housing 14,845,682,057 7,138,979,930 47,449,373,097 14,473,079,554
Min of Lands, Housing & Urban Devt 12,962,323,590 9,071,183,529 24,367,151,960 542,491,000
Electoral Commission 12,695,679,770 5,729,311,229 1,122,167,137
Min of Water & Environment - 11,396,099,000 15,763,616,148 748,173
ICT - 197,795,376 53,128,000
Min of Agriculture 10,971,662,717 9,466,469,142 16,447,967,015
Police 9,455,293,769 4,942,826,959 33,924,088,499 13,363,622,189
Min of Tuorism, Trade & Industry 8,396,924,111 7,902,942,430 8,112,620,332 6,230,783,682
Min of Gender 5,566,200,759 4,968,807,747 7,138,620,024 906,895,017
Min of Energy 5,400,354,306 4,867,560,174 4,865,471,136
Office of Auditor General 36,567,512 36,567,512
Mass Mobilisation 5,152,234,843
Uganda Prison 4,132,892,981 5,413,996,398 6,492,978,997 2,739,552,297
NARO 3,947,276,882 2,284,567,687 1,883,000 1,152,431,336
Min of Health 3,478,485,499 2,959,836,104 4,403,709,751 427,217,042
Min of Education 3,357,670,934 4,349,495,936 2,568,280,526 517,497,727
Office of the President 3,286,820,387 5,795,796,452 6,320,766,052 2,459,575,913
Min of Local Government 2,140,104 1,489,754
Judiciary 3,259,463,925 5,686,766,752 7,611,626,914 1,222,310,799

Page 93
Directorate of Public Prosecution 2,454,674,162 231,232,095 127,566,110
PPDA 1,878,685,409 - 584,531,085
Office of Prime Minister 817,923,236 901,533,958 6,497,274,926 363,405,596
Min of Public Service 618,875,877 346,666,533 376,440,689 80,833,340
UHRC 505,210,987 1,934,592,630 1,235,112,558 48,973,573
Inspectorae of Govt 187,712,770 1,544,004,360 617,111,000 732,032,013
National Planning Authority 116,608,143
NEMA 209,246,217 371,327,339
Uganda Land Commission 648,865,014 1,665,785,317 534,798,819
PSC 149,556,701
ESC 57,559,186
ESO 1,198,000,000 2,080,980,000 900,980,000
LGFC 936,816 726,420 416,000
JSC 39,112,420 25,598,319 22,807,769 97,283,550
HSC 38,759,773 19,317,377 49,613,848
Ethics & Integrity 63,560,106
Min of Internal Affairs 26,343,499 1,929,658,675 2,949,028,547
Uganda Aids Comm - 115,113,962 110,388,747
Parliamentary Commission 18,626,731
Law Reform Commission 2,971,970
UNRA 5,802,398,992
Mulago Hospital 1,687,789,880 2,969,363,421 3,716,547,881 6,180,660,527
Butabika Hospital 1,409,599,443 3,000 3,000
Jinja Hospital 452,532,304 249,997,135 61,781,563 107,217,753
Mbale Hospital 321,531,834 230,000,433 383,213,890 138,828,313
Soroti Hospital 144,054,826 616,155,410 771,707,300 123,522,104
Gulu Hospital 83,906,060 32,572,760 90,956,181 197,254,629
Masaka Hospital 56,028,045 36,185,455 287,519,609 366,399,897
Fort Portal Hospital 41,207,700 79,902,087 60,902,087 370,633,503
Lira Hospital 32,798,001 75,398,594 45,855,096
Hoima Hospital - 17,626,208 56,946,294 91,280,908
Kabale Hospital 25,666,990 31,924,727 89,097,807
Mbarara Hospital 20,665,112 119,580,780 307,570,056 161,255,136
Arua Hospital 15,925,365 21,743,597 39,490,695

Page 94
Uganda Embassy in Italy 1,505,186,526 1,249,515,265 1,412,610,685 322,537,097
Uganda Mission in New York 1,244,340,623 1,267,084,856 799,730,292
Uganda Embassy in Washington 56,750,502
Uganda Embassy in Ethiopia 219,912,412 13,644,161 2,419,050 84,858,954
Uganda High Comm in Tanzania 209,270,661 210,318,967 5,316,566 41,119,740
Uganda Embassy in China 187,104,772 136,281,089 136,281,089
Uganda Embassy in Kenya 182,022,765 210,935,207 232,870,462 2,890,982
Uganda Embassy in Rwanda 163,414,192 42,075,618 46,062,587 12,720,000
Uganda High Comm in Canada 126,460,542 126,460,542 113,285,837
Uganda High Comm in India 97,227,939 10,438,019 43,382,719
Uganda High Comm in Egypt 48,000,000
Uganda Embassy in Riyadh 95,860,027 55,123,070
Uganda Embassy in Belgium 87,637,270 399,904,917 83,336,275
Uganda Embassy in Berlin 82,253,060 61,722,019
Uganda Embassy in the US 70,553,818 122,597,214
Uganda High Comm in Nigeria 65,650,381 56,191,885 53,312,854
Uganda Embassy in Libya 50,670,357 13,583,483
Uganda Embassy in Khartoum 28,771,290
Uganda Embassy in Paris 11,950,728
Uganda Embassy in Geneva 838,827
Uganda Embassy in Japan 24,430,375 6,327,482
Uganda Embassy in Moscow 25,443,750 91,284,205
Uganda Embassy in Juba 13,793,060
Makerere University 10,140,704,494 26,530,920,895 35,196,243,555 36,623,444,478
Kyambogo University 1,697,045,966 2,666,271,188 4,723,984,865 13,464,724,169
MUBS 1,346,636,868 910,622,283 787,916,501 1,846,873,099
Uganda Management Institute 846,927,096 874,347,942 1,135,474,839 1,135,474,839
Gulu University 625,679,149 888,278,281 2,420,389,473 1,873,462,619
Mbarara University 10,385,006 312,496,972 622,127,920 420,000,000
GRAND TOTAL**** 293,719,904,599 242,726,220,058 423,028,022,727 228,644,104,969
Percentage increase/(decrease) -17.36% 74.28% -45.95%
Total no. of MDAs audited 85 88 90 93

Page 95
MDAs with Domestic arrears 69 63 71 47
Percentage 81.18% 71.59% 78.89% 50.54%
**** excluding pension arrears

Page 96
ANALYSIS OF OUTSTANDING ADVANCES FOR THE YEARS 2005/6, 2006/7, 2007/8 AND 2008/9
MDAs 2005/06 2006/07 2007/08 2008/09
Amount (Shs) Amount (Shs) Amount (Shs) Amount (Shs)
Min of Finance 2,175,583,993 5,828,635,530
Min of Defence 671,454,764 1,287,140,000 842,395,935
Min of Foreign Affairs 1,474,528,041 1,453,358,900 83,910,100
Min of East African Affairs 85,960,000
Min of Justice 486,647,298
State House 1,320,568,400 8,886,400
Min of Works, Housing 455,415,000 445,000,000
Min of Lands, Water & Environment 131,922,000 19,306,000
Electoral Commission 2,392,988,200 329,815,000 534,392,510
Min of Water & Environment 13,734,000 782,292,207 509,990,977
ICT
Min of Agriculture 231,352,333 366,308,000 8,185,165 322,941,310
Police 143,150,000
Min of Tuorism, Trade & Industry 10,887,750 98,582,740
Min of Gender 388,915,833 23,698,000 162,490,000 65,150,237
Uganda Prison 50,000,000
NARO 31,540,200 64,978,914
Min of Health 1,005,989,537 774,027,753 1,659,051,200 427,714,818
Min of Education 372,512,324 774,674,611 524,304,000
Office of the President 30,845,000 88,220,460
Min of Local Government 43,158,940 11,553,000
Judiciary 10,608,412 222,850,000
Directorate of Public Prosecution 41,681,000
Office of Prime Minister 235,384,775 49,762,682,821 3,666,518,965
Min of Public Service 60,914,470
UHRC 8,000,000
Uganda Land Commission 7,450,000
JSC 1,393,000,000
Parliamentary Commission 3,190,000,000 3,190,000,000 511,492,500
UIRI 2,720,000 248,875,690
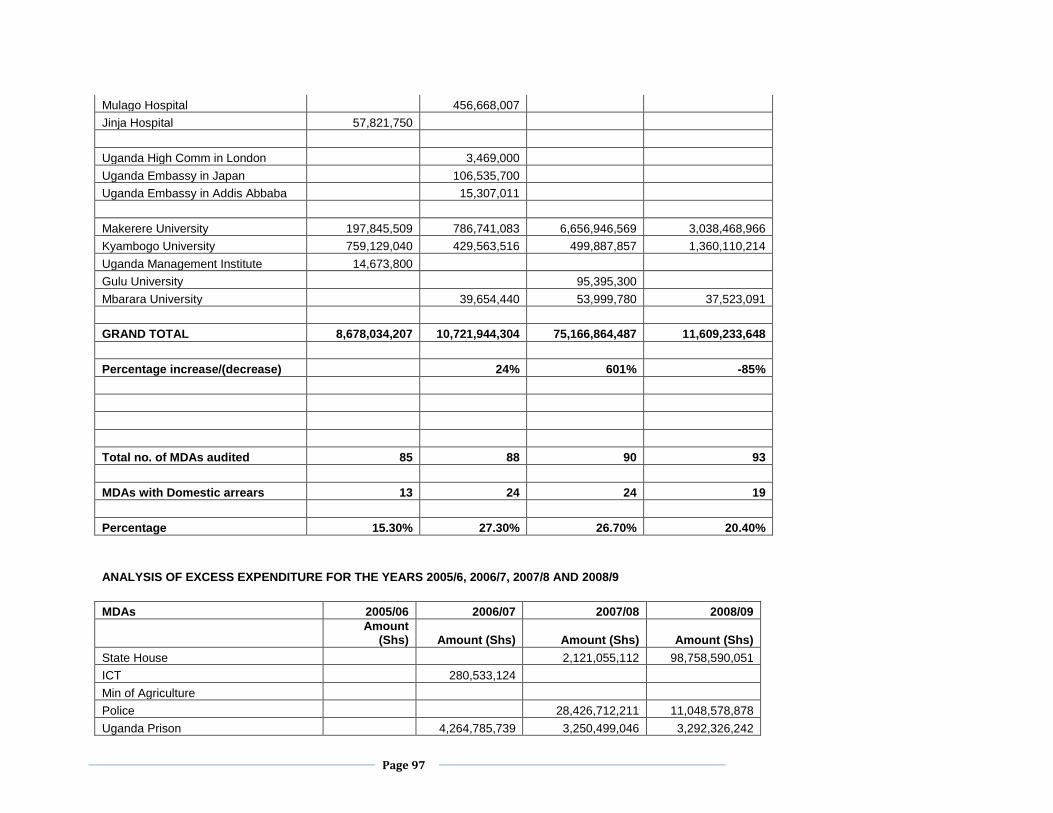
Page 97
Mulago Hospital 456,668,007
Jinja Hospital 57,821,750
Uganda High Comm in London 3,469,000
Uganda Embassy in Japan 106,535,700
Uganda Embassy in Addis Abbaba 15,307,011
Makerere University 197,845,509 786,741,083 6,656,946,569 3,038,468,966
Kyambogo University 759,129,040 429,563,516 499,887,857 1,360,110,214
Uganda Management Institute 14,673,800
Gulu University 95,395,300
Mbarara University 39,654,440 53,999,780 37,523,091
GRAND TOTAL 8,678,034,207 10,721,944,304 75,166,864,487 11,609,233,648
Percentage increase/(decrease) 24% 601% -85%
Total no. of MDAs audited 85 88 90 93
MDAs with Domestic arrears 13 24 24 19
Percentage 15.30% 27.30% 26.70% 20.40%
ANALYSIS OF EXCESS EXPENDITURE FOR THE YEARS 2005/6, 2006/7, 2007/8 AND 2008/9
MDAs 2005/06 2006/07 2007/08 2008/09
Amount (Shs) Amount (Shs) Amount (Shs) Amount (Shs)
State House 2,121,055,112 98,758,590,051
ICT 280,533,124
Min of Agriculture
Police 28,426,712,211 11,048,578,878
Uganda Prison 4,264,785,739 3,250,499,046 3,292,326,242

Page 98
NARO 5,680,266,220
UHRC 50,690,699
National Planning Authority 241,368,177
Uganda Land Commission 892,511,712
Uganda Aids Comm 575,367,865
Uganda Burreau of Statistics 6,579,715,739
Mulago Hospital 1,053,156,972
Jinja Hospital 288,359,580
Mbale Hospital 38,872,285
Lira Hospital 197,601,227
Mbarara Hospital 178,100,306
Uganda Embassy in Italy 159,023,524 53,734,007
Uganda Mission in New York 1,918,845,170 2,997,362,65 3,680,152,509
Uganda Embassy in Washington 212,702,753 819,385,635
Uganda Embassy in China 148,334,145
Uganda Embassy in Kenya 391,867,639 55,233,922 195,772,021
Uganda High Comm in Canada 27,364,153
Uganda Embassy in Riyadh 14,214,965
Uganda Embassy in Belgium 159,412,151 90,599,063
Uganda Embassy in Kigali 39,725,648
Uganda Embassy in the US 120,862,401
Uganda High Comm in Dar es Salaam 123,842,710
Uganda Embassy in Khartoum 5,145,040 188,955,091
Uganda Embassy in Paris 122,302,553 338,533,377 227,979,733
Uganda Embassy in Geneva 59,795,523
Uganda Embassy in Japan 8,819,752 108,453,107
Uganda Embassy in Moscow 107,706,879 261,749,835
Uganda Embassy in Juba 39,296,664
Uganda Embassy in Denmark 51,353,841
Uganda Embassy in Canberra 76,872,813 115,439,219
Uganda Embassy in Cairo 83,803,148 204,111,441
Uganda Embassy in Kinshasha 247,078,130
Uganda Embassy in Tehran 248,985,820
Uganda Embassy in Tripoli 50,232,766 125,150,613
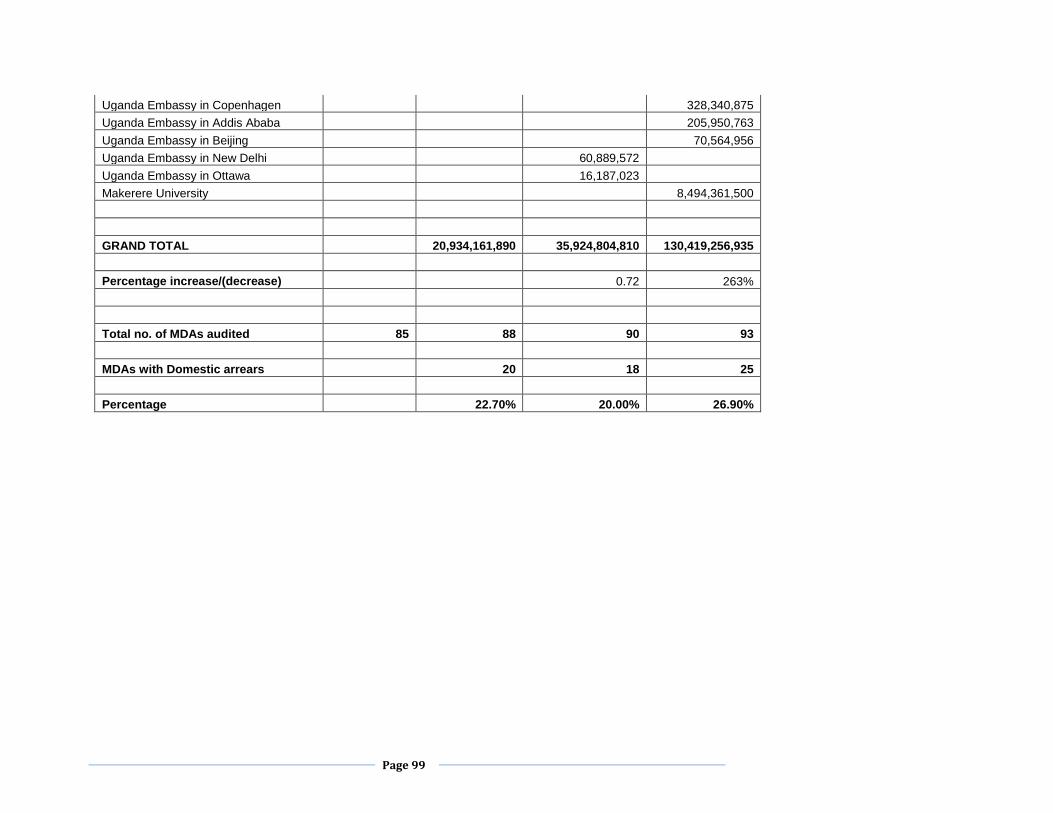
Page 99
Uganda Embassy in Copenhagen 328,340,875
Uganda Embassy in Addis Ababa 205,950,763
Uganda Embassy in Beijing 70,564,956
Uganda Embassy in New Delhi 60,889,572
Uganda Embassy in Ottawa 16,187,023
Makerere University 8,494,361,500
GRAND TOTAL 20,934,161,890 35,924,804,810 130,419,256,935
Percentage increase/(decrease) 0.72 263%
Total no. of MDAs audited 85 88 90 93
MDAs with Domestic arrears 20 18 25
Percentage 22.70% 20.00% 26.90%

Page 100
Annex VII—Background on the World Governance Indicators
(WGI) The 2010 WGI relies exclusively on perceptions‐based governance data sources. The WGI project is based exclusively on subjective or perceptions-based measures of governance, taken from surveys of households and firms as well as expert assessments produced by various organizations. The WGI uses perceptions-based data for the following reasons:
agents base their actions on their perceptions, impression, and views. If citizens believe that the courts are inefficient or the police are corrupt, they are unlikely to avail themselves of their services. Similarly, enterprises base their investment decisions ‐ and citizens their voting decisions ‐ on their perceived view of the investment climate and the government's performance.
in many areas of governance, there are few alternatives to relying on perceptions data. For instance, this has been particularly the case for corruption, which almost by definition leaves no “paper trail” that can be captured by purely objective measures.
even when objective or fact‐based data are available, often such data may capture the de jure notion of laws “on the books”, which often differs substantially from the de facto reality that exists “on the ground”.
The data sources include surveys of firms and households, as well as the subjective assessments of a variety of commercial business information providers, non‐governmental organizations, and a number of multilateral organizations and other public‐sector bodies. The WGI data sources reflect the perceptions of a very diverse group of respondents. Several are surveys of individuals or domestic firms with first‐hand knowledge of the governance situation in the country. These include the World Economic Forum’s Global Competitiveness Report, the Institute for Management Development’s World Competitiveness Yearbook, the World Bank / EBRD’s Business Environment and Enterprise Performance surveys, the Gallup World Poll, Latinobarometro, Afrobarometro, and the AmericasBarometer. The WGI also captures the views of country analysts at the major multilateral development agencies (the European Bank for Reconstruction and Development, the African Development Bank, the Asian Development Bank, and the World Bank), reflecting these individuals’ in‐depth experience working on the countries they assess. Together with some expert assessments provided by the United States Department of State and France’s Ministry of Finance, Industry and Employment. A number of data sources provided by various nongovernmental organizations, such as Reporters Without Borders, Freedom House, and the Bertelsmann Foundation, are also included. Finally, an important category of data sources for us are commercial business information providers, such as the Economist Intelligence Unit, Global Insight, and Political Risk Services. These last two types of data providers typically base their assessments on a global network of correspondents with extensive experience in the countries they are rating.

Page 101
WGI – Uganda 1998, 2004, and 2009

Page 102
WGI Data Sources (1996 – 2009) ADB African Development Bank Country Policy and Institutional Assessments Expert (GOV) AFR Afrobarometer Survey ASD Asian Development Bank Country Policy and Institutional Assessments Expert (GOV) BPS Business Enterprise Environment Survey Survey BTI Bertelsmann Transformation Index Expert (NGO) CCR Freedom House Countries at the Crossroads Expert (NGO) DRI Global Insight Global Risk Service Expert (CBIP) EBR European Bank for Reconstruction and Development Transition Report Expert (GOV) EIU Economist Intelligence Unit Riskwire & Democracy Index Expert (CBIP) FRH Freedom House Expert (NGO) GCB Transparency International Global Corruption Barometer Survey Survey GCS World Economic Forum Global Competitiveness Report Survey GII Global Integrity Index Expert (NGO) GWP Gallup World Poll Survey HER Heritage Foundation Index of Economic Freedom Expert (NGO) HUM Cingranelli Richards Human Rights Database and Political Terror Scale Expert (GOV) IFD IFAD Rural Sector Performance Assessments Expert (GOV) IJT iJET Country Security Risk Ratings Expert (CBIP) IPD Institutional Profiles Database Expert (GOV) IRP IREEP African Electoral Index Expert (NGO) LBO Latinobarometro Survey MSI International Research and Exchanges Board Media Sustainability Index Expert (NGO) OBI International Budget Project Open Budget Index Expert (NGO) PIA World Bank Country Policy and Institutional Assessments Expert (GOV) PRC Political Economic Risk Consultancy Corruption in Asia Survey PRS Political Risk Services International Country Risk Guide Expert (CBIP) RSF Reporters Without Borders Press Freedom Index Expert (NGO) TPR US State Department Trafficking in People report Expert (GOV) VAB Vanderbilt University Americas Barometer Survey WCY Institute for Management and Development World Competitiveness Yearbook Survey WMO Global Insight Business Conditions and Risk Indicators Expert (CBIP) *Types of Expert Assessments: CBIP -- Commercial Business Information Provider, GOV -- Public Sector Data Provider, NGO -- Nongovernmental Organization Data Provider