generation of spatial distribution maps of gonystylus bancanus
TRANSCRIPT

HHiigghh RReessoolluuttiioonn AAiirrbboorrnnee HHyyppeerrssppeeccttrraall DDaattaa ffoorr MMaappppiinngg ooff RRaammiinn DDiissttrriibbuuttiioonn iinn PPeeaatt SSwwaammpp FFoorreesstt

HHiigghh RReessoolluuttiioonn AAiirrbboorrnnee HHyyppeerrssppeeccttrraall DDaattaa ffoorr MMaappppiinngg ooff RRaammiinn DDiissttrriibbuuttiioonn iinn PPeeaatt SSwwaammpp FFoorreesstt
ii
High Resolution AirborneHyperspectral Data for Mapping ofRamin Distribution in Peat Swamp
Forest
Mohd Azahari, F., Khali Aziz, H., & Hamdan, O.
2011

HHiigghh RReessoolluuttiioonn AAiirrbboorrnnee HHyyppeerrssppeeccttrraall DDaattaa ffoorr MMaappppiinngg ooff RRaammiinn DDiissttrriibbuuttiioonn iinn PPeeaatt SSwwaammpp FFoorreesstt
iiii
© 2011 Copyright Forest Research Institute Malaysia, International TropicalTimber Organization and Convention on International Trade in EndangeredSpecies of Wild Fauna and Flora 2011
First Printing 2011
All enquiries should be forwarded to:
Director-GeneralForest Research Institute Malaysia (FRIM)52109 Kepong, Selangor Darul Ehsan, MalaysiaNo. Tel: 603-62797000Fax: 603 62731314http://frim.gov.my
Perpustakaan Negara Malaysia Cataloguing-in-Publication Data
High Resolution Airborne Hyperspectral Data for Mapping of RaminDistribution in Peat Swamp Forest / editors Mohd Azahari, F., Khali Aziz,H., and Hamdan, O.
I. Institut Penyelidikan Perhutanan MalaysiaII. Title
Set in Cambria/11 point
Printed in Malaysia by Gemilang Press Sdn. Bhd., Sungai Buloh

HHiigghh RReessoolluuttiioonn AAiirrbboorrnnee HHyyppeerrssppeeccttrraall DDaattaa ffoorr MMaappppiinngg ooff RRaammiinn DDiissttrriibbuuttiioonn iinn PPeeaatt SSwwaammpp FFoorreesstt
iiiiii
List of Figures iv
List of Tables v
Preface vi
Acknowledgements vii
Project Identification viii
CHAPTER 1: INTRODUCTION 1
CHAPTER 2: HYPERSPECTRAL IMAGING 2
Hyperspectral Remote Sensing 2
Vegetation Spectral Signature 4
CHAPTER 3: APPLIED METHODOLOGIES 6
Introduction 6
Project Area 7
Test Plot Area 8
HySpex VNIR 1600 Hyperspectral DataAcquisition
9
On-Site Data Collection 11
Datum Verification 11
Spectral Signature Measurement 12
Tree Inventory 13
Spectroradiometer for SpectralSignature Measurement
19
Data Pre-processing 14
Data Classification 14
Map Production 15
CHAPTER 4: RESULTS AND ANALYSIS 17
Introduction 17
Hyperspectral Band Combination 17
Tree Inventory 21
Ramin Classification Using HyperspectralData
23
Validation and Verification 26
Ramin Tree Volume Estimation 28
CHAPTER 5: OVERVIEW AND RECOMMENDATIONS 30
Problems and limitations 30
Conclusion 31
REFERENCES 33
APPENDIXES 34 - 39
CCOONNTTEENNTTSS

HHiigghh RReessoolluuttiioonn AAiirrbboorrnnee HHyyppeerrssppeeccttrraall DDaattaa ffoorr MMaappppiinngg ooff RRaammiinn DDiissttrriibbuuttiioonn iinn PPeeaatt SSwwaammpp FFoorreesstt
iivv
List of Figures
Figure 1 Peat swamp forest profile showing G. bancanus(ramin) as a canopy layer tree
1
Figure 2 Airborne Hyperspectral data acquisition technique 2
Figure 3 Hyperspectral data cube 3
Figure 4 Spectral signatures of selected peat swamp forestfeatures
4
Figure 5 Flowchart of general methodology for raminmapping using airborne hyperspectral data
6
Figure 6 Location of the study area 7
Figure 7 Test plot area 8
Figure 8 Airborne HySpex VNIR 1600 systems installations 9
Figure 9 Planned flight path 10
Figure 10 Chronology of hyperspectral data acquisition 11
Figure 11 GER 1500 Spectroradiometer 13
Figure 12 Field survey activities 13
Figure 13 Two-dimensional spectral angle 15
Figure 14 Selection of hyperspectral data in the study area 18
Figure 15 Hyperspectral band combination: (a) Natural colour55, 41, 12 (b) Pseudo colour 159, 38, 13
19
Figure 16 Spectroradiometer data measurement activities 19
Figure 17 Spectral signatures of ramin (Gonystylus bancanus)and bintangor (Calopyllum ferrugineum)
20
Figure 18 Correlation between hyperspectral andspectroradiometer reflectance’s of ramin
21
Figure 19 Ramin GIS database 23
Figure 20 Example of identified ramin tree selected as samplepoint
24
Figure 21 Signatures of different ramin blooming stages: (a)blooming, (b) semi blooming and (c) non-blooming
25
Figure 22 Ramin classification using hyperspectral data 26
Figure 23 Comparison between field survey mapping andhyperspectral mapping
28
Figure 24 Correlation between crown size and stem volume 29

HHiigghh RReessoolluuttiioonn AAiirrbboorrnnee HHyyppeerrssppeeccttrraall DDaattaa ffoorr MMaappppiinngg ooff RRaammiinn DDiissttrriibbuuttiioonn iinn PPeeaatt SSwwaammpp FFoorreesstt
vv
List of Tables
Table 1 HySpex VNIR 1600 characteristic 9
Table 2 FRIM DGPS monument position 12
Table 3 Specifications for GER 1500 Spectroradiometer 12
Table 4 Statistics of spectral signature measurement 20
Table 5 Example of tree inventory worksheet 22
Table 6 Accuracy of the predicted ramin trees 27
Table 7 Accuracy of tree volume estimation 29

HHiigghh RReessoolluuttiioonn AAiirrbboorrnnee HHyyppeerrssppeeccttrraall DDaattaa ffoorr MMaappppiinngg ooff RRaammiinn DDiissttrriibbuuttiioonn iinn PPeeaatt SSwwaammpp FFoorreesstt
vvii
PPrreeffaaccee
Peat swamp forest (PSF) is the largest of the wetland forests in Malaysia andconsists of some of Malaysia's endangered tree species such as Gonystylusbancanus. This species has been listed in Appendix II of the Convention onInternational Trade in Endangered Species of Wild Fauna and Flora (CITES)and as such needs better management and control. Among others, spatialdistribution information on the species in the natural environments need tobe identified and mapped. The developments of airborne hyperspectralremote sensing have provided new opportunities for mapping this treespecies at a landscape scale. A recently concluded study in Malaysia’stropical peat swamp forest exhibited a promising use of airbornehyperspectral data for mapping G. bancanus distribution. The study wasconducted in Pekan Forest Reserve, Pahang, using HySpex VNIR-1600airborne hyperspectral data with the spatial resolution of 0.5 meter andspectral range of 400 nm to 1000 nm. It was found that the HySpex airbornehyperspectral data have good capability to discriminate individual canopylayer tree species in mixed peat swamp forest. The distribution of G.bancanus in the natural peat swamp forest could be mapped with anaccuracy of 86%. It is anticipated that with the availability of accurateinformation on the G. bancanus population derived from airbornehyperspectral data, better management of the species for both conservationand sustainable use can be undertaken.
Mohd Azahari FaidiKhali Aziz HamzahHamdan Omar

HHiigghh RReessoolluuttiioonn AAiirrbboorrnnee HHyyppeerrssppeeccttrraall DDaattaa ffoorr MMaappppiinngg ooff RRaammiinn DDiissttrriibbuuttiioonn iinn PPeeaatt SSwwaammpp FFoorreesstt
vviiii
AAcckknnoowwlleeddggeemmeennttss
This work was made possible by a grant from the International TropicalTimber Organization (ITTO) under its collaborative programme with theConvention on International Trade in Endangered Species of Wild Fauna andFlora (CITES) to build capacity for implementing timber listings. Donors tothis collaborative programme include the European Union (EU) (primarydonor), the USA, Japan, Norway, New Zealand and Switzerland.
We would like to extend our thanks to the Ministry of Natural Resources andEnvironment (NRE) for their full support throughout the project. Our specialthanks also go to all the collaborating agency, namely the ForestryDepartment Peninsular Malaysia (FDPM) includes the Headquarters and theState Forestry Department of Pahang. Without which their full support, thecollection of data in the peat swamp forest would not have been possible.
Last but not least, our gratitude also goes to Dato’ Dr Abd. Latif Mohmod, theDirector General of FRIM for giving us his support and encouragementduring the preparation of this manuscript.

HHiigghh RReessoolluuttiioonn AAiirrbboorrnnee HHyyppeerrssppeeccttrraall DDaattaa ffoorr MMaappppiinngg ooff RRaammiinn DDiissttrriibbuuttiioonn iinn PPeeaatt SSwwaammpp FFoorreesstt
vviiiiii
Project Identification
Project number: Activity 3Host Government: The Government of Malaysia (GOM)Name of the Executing Agency and Project Coordinator: Ministry of NaturalResources and Environment (NRE)Starting date of the Project: September 2008Duration of the Project (month): 24 months

HHiigghh RReessoolluuttiioonn AAiirrbboorrnnee HHyyppeerrssppeeccttrraall DDaattaa ffoorr MMaappppiinngg ooff RRaammiinn DDiissttrriibbuuttiioonn iinn PPeeaatt SSwwaammpp FFoorreesstt
11
CCHHAAPPTTEERR 11INTRODUCTION
With the advancement of new technology in remote sensing such as highresolution and multi-spectral images, discrimination of forest species usingthis technology is emerging. Several efforts have been initiated anddemonstrated on the potential of using the hyperspectral images for tropicalrainforest tree species identification while others have used aerialphotographs and high spatial resolution multispectral data such as IKONOS(1 m and 4 m) and Quickbird (0.7 m and 2.8 m) for the same purposes.Hyperspectral imagery is a significant technology used in remote sensingand plays an important role in the success of image classification because itprovides valuable spectral information on the objects of interest captured inthe imagery.
A study to test the applicability of airborne hyperspectral remote sensingdata for peat swamp forest tree species mapping was carried out in atropical peat swamp forest of Malaysia. This study was undertaken todiscriminate individual G. bancanus in the natural environment withintention of mapping its population distribution. Further information on G.bancanus was given in detail by Khali et al. (2010) in a book entitled“Gonystylus bancanus – Jewel of the Peat Swamp Forest”. Based on the peatswamp forest profile (Figure 1), G. bancanus can be classified as a canopylayer tree (Khali et al. 2009). Thus it gives an advantage to delineate G.bancanus using airborne hyperspectral data.
Figure 1 Peat swamp forest profile showing G. bancanus (ramin) as acanopy layer tree

HHiigghh RReessoolluuttiioonn AAiirrbboorrnnee HHyyppeerrssppeeccttrraall DDaattaa ffoorr MMaappppiinngg ooff RRaammiinn DDiissttrriibbuuttiioonn iinn PPeeaatt SSwwaammpp FFoorreesstt
22
CCHHAAPPTTEERR 22HYPERSPECTRAL IMAGING
Hyperspectral Remote Sensing
The importance of remote sensing in providing information for forestmanagement has been widely recognized. It is one of the ways to acquirerepetitive forest biophysical data for large geographic area at reasonablecost, accuracy and effort. In forestry, the use of remote sensing is generallybased on the assumption that spectral response of forest canopy is highlycorrelated with the forest parameters such as tree density, height anddiameter breast height. Hence, those forest variables can be indirectlymeasured from the spectral response of the forest canopy (Danson 1995).
Multi-spectral remote sensing images have been used in forest classificationfor many years. The multi-spectral sensors include the AdvancedSpaceborne Thermal Emission and Reflection Radiometer (ASTER), theLandsat Thematic Mapper (TM), and Satellite Pour l'Observation de la Terre5 (SPOT 5). However, multi-spectral images have poor capability ofdiscriminating forest species precisely. With the development ofhyperspectral remote sensing system (Figure 2), it has been used to improvethe classification accuracy. Studies have shown that hyperspectral remotesensing is a powerful diagnostic tool for agriculture, environment andecology, aquaculture, forestry, geosciences, and other disciplines of studies(Buckingham et al. 2002).
Figure 2 Airborne Hyperspectral data acquisition technique

HHiigghh RReessoolluuttiioonn AAiirrbboorrnnee HHyyppeerrssppeeccttrraall DDaattaa ffoorr MMaappppiinngg ooff RRaammiinn DDiissttrriibbuuttiioonn iinn PPeeaatt SSwwaammpp FFoorreesstt
33
The naming of hyperspectral images is suitable from the perspective of thisdefinition when one considers their attributes in relation to a traditionalcolour image. A standard computer representation of an image simplycontains red, green, and blue components that can be combined to create acolor image. In contrast, hyperspectral images can be thought of as a set ofmany images that represent measurements of the reflectance of light atclosely spaced wavelengths, often including data outside of the visiblespectrum. Hyperspectral sensors measure energy in narrower and morenumerous bands than multispectral sensors. In hyperspectral images, eachspatial element has a continuous spectrum that is used to analyse thefeatures in the images (Figure 3).
Hyperspectral images can contain as many as 200 (or more) contiguousspectral bands. The numerous narrow bands of hyperspectral sensorsprovide a continuous spectral measurement across the entireelectromagnetic spectrum and therefore are more sensitive to subtlevariations in reflected energy. Images produced from hyperspectral sensorscontain much more data than images from multispectral sensors and have agreater potential to detect differences among land and water features. Forexample, multispectral imagery can be used to map forested areas, whilehyperspectral imagery can be used to map tree species within the forest.
Figure 3 Hyperspectral data cube
Spectraldimension
Spatial dimension
Pixel
Pixel
Pixel
Pixel

HHiigghh RReessoolluuttiioonn AAiirrbboorrnnee HHyyppeerrssppeeccttrraall DDaattaa ffoorr MMaappppiinngg ooff RRaammiinn DDiissttrriibbuuttiioonn iinn PPeeaatt SSwwaammpp FFoorreesstt
44
Vegetation Spectral Signature
Features on the Earth reflect, absorb, transmit and emit electromagneticenergy from the sun. Hyperspectral imaging system has been developed tomeasure all types of electromagnetic energy as it interacts with objects. Ameasurement of energy commonly used in remote sensing forestryapplication is reflected energy such as visible light and near infrared thatcome from forest canopy surfaces. The amount of energy reflected fromthese surfaces is usually expressed as a percentage of the amount of energystriking the objects. Across any range of wavelengths, the percentreflectance values for peat swamp forest features can be plotted andcompared. Such plots are called “spectral response curves” or “spectralsignatures”.
Figure 4 shows the spectral curves of five selected peat swamp forestfeatures namely; water, understory vegetation, bintangor (Calophyllumferrugineum), meranti paya (Shorea platycarpa) and ramin (Gonystylusbancanus). This demonstrates that the selected spectra exhibit minimalvariability in terms of magnitude in the visible wavelengths and a large risein variability as the wavelengths increase towards the near-infraredwavelengths, especially the bands between 0.75 and 0.850 µm. A distinctseparation between ramin and the other features is shown at 0.55 µm.
Figure 4 Spectral signatures of selected peat swamp forest features

HHiigghh RReessoolluuttiioonn AAiirrbboorrnnee HHyyppeerrssppeeccttrraall DDaattaa ffoorr MMaappppiinngg ooff RRaammiinn DDiissttrriibbuuttiioonn iinn PPeeaatt SSwwaammpp FFoorreesstt
55
Reflectance is 100% if all of the light striking objects, bounces off and isdetected by the sensor. If none of the light returns from the surface,reflectance is said to be 0%. Generally, the reflectance value of forest speciesis different between each other. Differences among spectral signatures areused to help classify remotely sensed images into classes of landscapefeatures since the spectral signatures of like features have similar shapes.The more detailed the spectral information is recorded by a sensor, themore information that can be extracted from the spectral signatures.Hyperspectral sensors have much more detailed signatures thanmultispectral sensors and thus provide the ability to detect more slightdifferences in terrestrial features.
Hyperspectral image has great potential to be used to extract information ina fairly uniform landscape such as peat swamp forest. One would expect thatthe increment in the number of bands in hyperspectral image will result inan increase in the classification accuracy in comparison with multispectralsensors. On the other hand, application of hyperspectral images also bringssome problems. High-dimensional datasets of hyperspectral imageprominantly contains huge data volume and the narrow band tends to bestrongly related with the adjacent ones, leading to mixed and useless signals.However, with the right approach and processing and analysis procedures,variations within peat swamp can be discriminated and classifiedaccordingly in the hyperspectral image.

HHiigghh RReessoolluuttiioonn AAiirrbboorrnnee HHyyppeerrssppeeccttrraall DDaattaa ffoorr MMaappppiinngg ooff RRaammiinn DDiissttrriibbuuttiioonn iinn PPeeaatt SSwwaammpp FFoorreesstt
66
CCHHAAPPTTEERR 33APPLIED METHODOLOGIES
Introduction
To identify and locate ramin trees in a highly mixed heterogeneousrainforest is a challenging task. The most promising tool or method toovercome the problem is by applying airborne remote sensing hyperspectraltechnique. The introduction of hyperspectral technology, which producesmuch more complex imagery, provides the abilities to distinguish individualtree species in mixed forest ecosystem. However, it insists on more complexand sophisticated data analysis procedures before the full potential use ofthe hyperspectral data can be achieved. The flowchart of the generalmethodology for ramin mapping using airborne hyperspectral technology ispresented in Figure 5.
Figure 5 Flowchart of general methodology for ramin mapping usingairborne hyperspectral data
Field survey
Ramin distribution map
Yes
No
Airborne data acquisition
Data pre-processing
Data classification
Discriminating ramin
Vectorization
Accuracyassessment
Spectrallibrary

HHiigghh RReessoolluuttiioonn AAiirrbboorrnnee HHyyppeerrssppeeccttrraall DDaattaa ffoorr MMaappppiinngg ooff RRaammiinn DDiissttrriibbuuttiioonn iinn PPeeaatt SSwwaammpp FFoorreesstt
77
Project Area
The study area, Pekan Forest Reserve is located at 593637.380 E and379195.379 N in the South-East Pahang Peat Swamp Forest, Pahang (Figure6). The project area experiences a relatively dry period lasting about eightmonths from February to September, followed by four months of heavy rainbetween October and January, the peaks being in December and January(Abdul Rahim, et al. 2007). The management of the forest reserve isundertaken by the state Forestry Department (FD) and complies with theMalaysian Criteria and Indicators for Forest Management Certification [MC &I (2002)] requirements.
Figure 6 Location of the study area

HHiigghh RReessoolluuttiioonn AAiirrbboorrnnee HHyyppeerrssppeeccttrraall DDaattaa ffoorr MMaappppiinngg ooff RRaammiinn DDiissttrriibbuuttiioonn iinn PPeeaatt SSwwaammpp FFoorreesstt
88
The Pekan Forest Reserve has 106 species of trees belonging to 72 generaand 32 families (Abdul Rahim et al. 2007). The dominant families in terms ofrelative numbers in the reserve are Guttiferae (bintangor), Myrtaceae(kelat), Myristicaceae (penarahan) and Burseraceaee (kedondong). Otherimportant families are Leguminonasae (kempas), Thymelaeaceace (ramin),Ebeneceace (kayu arang) and Annonaceace (mempisang). In term of basalarea, Calophyllum ferrugineum (Guttiferae) records the highest, followed byGonystylus bancanus, Tetramerista glabra, Koompassia malaccensis and Duriocarinatus.
Test Plot Area
The test plot area of 6.25 ha was selected from the total 200 ha of projectarea (Compartment 77, Pekan Forest Reserve). This test plot consists ofabout 53 test blocks (30 m x 30 m) (Figure 7). Data collections through fieldinventory and data verification through spectral signature sampling werecarried out within this test plot.
Figure 7 Test plot area
250 m
250 m
N
0--4 Plot
Image boundary0--4 0--5 0--6 0--7
1--3 1--4 1--5 1--6 1--7
2--0 2--1 2--2 2--3 2--4 2--5 2--6 2--7
3--0 3--1 3--2 3--3 3--4 3--5 3--6 3--7
4--0 4--1 4--2 4--3 4--4 4--5 4--6 4--7
5--0 5--1 5--2 5--3 5--4 5--5 5--6 5--7
6--0 6--1 6--2 6--3 6--4 6--5 6--6
7--0 7--1 7--2 7--3 7--4

HHiigghh RReessoolluuttiioonn AAiirrbboorrnnee HHyyppeerrssppeeccttrraall DDaattaa ffoorr MMaappppiinngg ooff RRaammiinn DDiissttrriibbuuttiioonn iinn PPeeaatt SSwwaammpp FFoorreesstt
99
HySpex VNIR 1600 Hyperspectral Data Acquisition
The HySpex VNIR-1600 sensor (Figure 8) is an airborne sensor producedand operated by the company Norsk Electro Optic (NEO). The HySpexcamera images the scene line by line using a so-called "pushbroom"scanning mode. In the VNIR mode, HySpex acquires radiance in 160 bands,ranging from 400 nm to 1000 nm, each with a bandwidth of 3.7 nm (Table1). The hyperspectral data that was acquired on 15 January 2010 along thetest plot lines in the project area was used as the primary input for thisstudy.
Table 1 HySpex VNIR 1600 characteristic
Specifications Characteristic
Module VNIR-1600
Sensor Type Pushbroom Si CCD 1600
Spectral range 0.4 – 1 µm
Spatial pixels 1600
FOV across track 17°
Pixel FOV across track/along track ~0.185 mrad / 0.37 mrad
Spectral sampling 3.7 nm
Spectral bands 160
Data format 12 bit
Frame frequency 120 fts
Figure 8 Airborne HySpex VNIR 1600 systems installations

HHiigghh RReessoolluuttiioonn AAiirrbboorrnnee HHyyppeerrssppeeccttrraall DDaattaa ffoorr MMaappppiinngg ooff RRaammiinn DDiissttrriibbuuttiioonn iinn PPeeaatt SSwwaammpp FFoorreesstt
1100
Figure 9 Planned flight path
By scanning over the scene, the HySpex camera collects slices from adjacentlines that have been planned (Figure 9), forming a hyperspectral image or"cube", with two spatial dimensions and one spectral dimension. TheHySpex sensor is also capable of recording in the SWIR (Short WaveInfraRed) mode, but this mode was not available for this project. The SWIRmode ranges from 1000 to 1700 nm. The pixel size of the image capturedwas 0.5 meter.
Pekan Forest Reserve
Planned acquisition area

HHiigghh RReessoolluuttiioonn AAiirrbboorrnnee HHyyppeerrssppeeccttrraall DDaattaa ffoorr MMaappppiinngg ooff RRaammiinn DDiissttrriibbuuttiioonn iinn PPeeaatt SSwwaammpp FFoorreesstt
1111
Acquisition of hyperspectral data which is the core activity in this study wasdone by a team of experts engaged by the project. The chronology of dataacquisition activity is summarized in Figure 10 below.
Figure 10 Chronology of hyperspectral data acquisition
On-Site Data Collection
There are at least three aspects of airborne hyperspectral imagery dataprocessing that often require on-site data collection. First is the validation ofthe spatial integrity of the imagery through the datum position (x,y)verification, second is the spectral signature measurement usingSpectroradiometer equipment for creation of a custom spectral library andthe third is the tree inventory activity for sampling and output verification.
Datum Verification
A Differential Global Positioning System (DGPS) monument in Compartment77, Pekan Forest Reserve, established by Forest Research Institute Malaysia(FRIM), was used as reference point for airborne track planning during thehyperspectral data acquisition (Table 2). This monument was also used for
Site visit and datum verification
Flight path planning
Hyperspectral system installation
Hyperspectral data acquisition
Preliminary planning
Aircraft preparation
Yes
NoSensor testing

HHiigghh RReessoolluuttiioonn AAiirrbboorrnnee HHyyppeerrssppeeccttrraall DDaattaa ffoorr MMaappppiinngg ooff RRaammiinn DDiissttrriibbuuttiioonn iinn PPeeaatt SSwwaammpp FFoorreesstt
1122
the determination of ramin tree positions in the field during the fieldinventory. The verification survey was done within the Position Dilution ofPrecision (PDOP) value of 3 – 12. PDOP is a measure of the quality of the GPSdata being received from the satellites. DOP is a mathematicalrepresentation for the quality of the GPS position. The main factors affectingDOP are the number of tracking satellites and where these satellites arepositioned in the sky.
Table 2 FRIM DGPS monument position
Point East (x) North (y) Height (z)
FRIM DGPS Monument 593637.380 379195.379 7.836
Spectral Signature Measurement
In attempting to study the spectral signature of ramin, it is very crucial toassess and compare its spectral reflections between laboratory and on-sitemeasurements. The process will give better understanding of the effects ofenvironment on the ramin spectral reflectance patterns. In this project, ahandheld GER 1500 Spectroradiometer (Table 3 and Figure 11) deviceacquired by FRIM on September 2009 was used to measure the spectralsignature of ramin leaf.
The ideal way to measure and collect the spectral signature on the groundusing handheld spectroradiometer is to conduct the measurements andcollection at the same time as the airborne hyperspectral sensor is flown.However, in most cases this is difficult to, do and as such collection atapproximately the same atmospheric conditions as the hyperspectral datacollection on a different day is sufficient.
Table 3 Specifications for GER 1500 Spectroradiometer
Detail Specifications
Spectral Range 350 nm to 1050 nm
Internal Memory 400 scans
Band 512
Bandwidth Sampling 1.5 nm
Scan Time 5 ms and up (selectable)
FOV 4 degree
Weight 2 kg
Battery Type 6 Volt NiMH

HHiigghh RReessoolluuttiioonn AAiirrbboorrnnee HHyyppeerrssppeeccttrraall DDaattaa ffoorr MMaappppiinngg ooff RRaammiinn DDiissttrriibbuuttiioonn iinn PPeeaatt SSwwaammpp FFoorreesstt
1133
Figure 11 GER 1500 Spectroradiometer
Tree Inventory
Field inventory to collect ramin tree information was carried out in the testsite (Figure 12).
Figure 12 Field survey activities

HHiigghh RReessoolluuttiioonn AAiirrbboorrnnee HHyyppeerrssppeeccttrraall DDaattaa ffoorr MMaappppiinngg ooff RRaammiinn DDiissttrriibbuuttiioonn iinn PPeeaatt SSwwaammpp FFoorreesstt
1144
Plot blocks, each with an area of 30 m x 30 m were established in the testarea and within this block parameters including the x,y location, diameterbreast height (dbh), total height, 1st branch height and crown width of allramin trees with dbh above 20 cm were measured and recorded. Thecollected data were kept in a GIS database for future reference. Besidesramin, a bintangor species (Calophyllum ferrugineum) in the test plot wasalso enumerated and recorded as a reference to the ramin tree distribution.
Data Preprocessing
Two image pre-processing routines, namely geometric and radiometriccorrection were performed on the hyperspectral data. The data weregeometrically corrected and rectified and conformed to the MalaysianRectified Skew Orthomorphic (RSO) projection system. The hyperspectraldata were not mosaic in order to keep the authenticity of each individualhyperspectral stripe. With 160 different channels of hyperspectral data, itwas necessary to do some data reduction before the analyses.
The reduction of the dimensionality of the hyperspectral data is based on aforward MNF (Minimum Noise Fraction) rotation. The MNF rotationtransforms are normally used to determine the inherent dimensionality ofimage data, to segregate noise in the data, and to reduce the computationalrequirements for subsequent processing. The reduction of the channels wasbased on a threshold of 2 and reduced the 160 bands to 23 bands with anacceptable noise ratio and variability.
Data Classification
Spectral characteristic of vegetation from hyperspectral images are closelyrelated to the physical properties of tree leaves. Each vegetation species willgive a different spectral response to electromagnetic radiation in terms ofreflectance and absorption in visible near infrared (VNIR) and short waveinfrared (SWIR) regions. In this study, the Spectral Angle Mapper (SAM)technique was used to classify ramin in the study area. The SAM technique isa physically based spectral classification that uses an n-dimensional angle tomatch pixels to reference spectral. This is shown in Figure 13, where a two-band “spectrum” will lie somewhere along a line passing through the originof a two-dimensional space.

HHiigghh RReessoolluuttiioonn AAiirrbboorrnnee HHyyppeerrssppeeccttrraall DDaattaa ffoorr MMaappppiinngg ooff RRaammiinn DDiissttrriibbuuttiioonn iinn PPeeaatt SSwwaammpp FFoorreesstt
1155
Figure 13 Two-dimensional spectral angle
The SAM technique is based on the idea that an observed reflectancespectrum can be considered as a vector in a multi-dimensional space, wherethe number of dimensions equals the number of spectral bands (Shafri et al.2007). SAM compares the angle between the end member spectrum vectorand each pixel vector in n-dimensional space. Smaller angles representcloser matches to the reference spectral. Pixels further away than thespecified maximum angle threshold in radians are not classified.
In this study, identified pixels that represent patterns of individual raminspecies were selected with the help of the ramin position information fromfield survey activity. In this process, knowledge of the tree species classes isrequired before the classification process can be performed. The selectedramin tree that has been identified will be use as a sample point to generateramin spectral signature in the SAM classification technique. Based on thespectral signature pattern, the computer system will be instructed toidentify and classify pixels with similar characteristics. The output from thisprocess is a ramin distribution map in raster format.
Map Production
The raster format map generated from the above process is furtherconverted to vector format. In order to have the vector polygons availablefor use in a GIS, the vectors were exported to the Shapefile format polygonregion coverage. To ensure the classification accuracy of the ramindistribution information derived from the hyperspectral data, an accuracyassessment of the map is carried out. Accuracy can be defined as a degree ofcorrespondence between observation and reality (true data). Usually, the
Spectra angle
Band 1
Band 2Dark point
Features A
Features B

HHiigghh RReessoolluuttiioonn AAiirrbboorrnnee HHyyppeerrssppeeccttrraall DDaattaa ffoorr MMaappppiinngg ooff RRaammiinn DDiissttrriibbuuttiioonn iinn PPeeaatt SSwwaammpp FFoorreesstt
1166
assumed true data are derived from ground survey data. However, it is notpractical to undertake hundred percent ground truth survey or to test everypixel of the classified image. Therefore, a set of reference points is usuallyused. In this project, the reference point selected is based on referenceinformation or ground data using a systematic sampling method. Errormatrices will be produced from the classification results based on theindividual ramin tree position.

HHiigghh RReessoolluuttiioonn AAiirrbboorrnnee HHyyppeerrssppeeccttrraall DDaattaa ffoorr MMaappppiinngg ooff RRaammiinn DDiissttrriibbuuttiioonn iinn PPeeaatt SSwwaammpp FFoorreesstt
1177
CCHHAAPPTTEERR 44RESULTS AND ANALYSIS
Introduction
The airborne HySpex VNIR 1600 hyperspectral data that were acquired on15 January 2010 along the test plot lines in the project area were used asthe primary input for this study. It is important to understand the dataacquisition process in order to process the hyperspectral data properlybefore useful information is extracted. In total about 20 scenes ofhyperspectral images had been captured to cover the 2000 ha of the studyarea. However, only one scene had been processed to discriminate G.bancanus in the study area. Figure 14 shows the subset of thehyperspectral data that were analyzed in this study.
Hyperspectral Band combination
With 160 different channels of hyperspectral imagery, it is necessary toget the best band combination to enhance the imagery. For the HySpexVNIR 1600 airborne hyperspectral data, the best "natural" colour (truecolour) representation is in the form of bands 55, 41 and 12 (R,G,B)combination. Visual comparison of combination bands 55, 41, and 12 (truecolour) with the pseudo colour combination of bands 159, 43, 13 showsthat the pseudo colour combination discriminates more features. Hence,in this project, the pseudo-colour combination was used in preparing theindividual canopy tree sample for classification of the hyperspectral data.Figure 15 shows the difference between natural colour and pseudo-colourband combinations.

HHiigghh RReessoolluuttiioonn AAiirrbboorrnnee HHyyppeerrssppeeccttrraall DDaattaa ffoorr MMaappppiinngg ooff RRaammiinn DDiissttrriibbuuttiioonn iinn PPeeaatt SSwwaammpp FFoorreesstt
1188
Figure 14 Selection of hyperspectral data in the study area
(a)

HHiigghh RReessoolluuttiioonn AAiirrbboorrnnee HHyyppeerrssppeeccttrraall DDaattaa ffoorr MMaappppiinngg ooff RRaammiinn DDiissttrriibbuuttiioonn iinn PPeeaatt SSwwaammpp FFoorreesstt
1199
(b)
Figure 15 Hyperspectral band combination: (a) Natural colour 55, 41, 12(b) Pseudo-colour 159, 38, 13
Spectroradiometer for Spectral Signature Measurement
Spectral signatures of ramin and bintangor in the study area weremeasured using spectroradiometer. This is necessary in order todetermine the spectral reflectance values of both species as a guide priorto classification of the hyperspectral image.
Figure 16 Spectroradiometer data measurement activities

HHiigghh RReessoolluuttiioonn AAiirrbboorrnnee HHyyppeerrssppeeccttrraall DDaattaa ffoorr MMaappppiinngg ooff RRaammiinn DDiissttrriibbuuttiioonn iinn PPeeaatt SSwwaammpp FFoorreesstt
2200
The spectral reflectance data of ramin and bintangor that had beenmeasured in the field survey (Figure 16) were plotted as spectral curves.These spectral curves were analysed and assessed in order to determinetree species separability. Figure 17 below shows the different spectralsignature curves for ramin and bintangor.
Table 4 Statistics of spectral signature measurement
Figure 17 Spectral signatures of ramin (Gonystylus bancanus) andbintangor (Calopyllum ferrugineum)
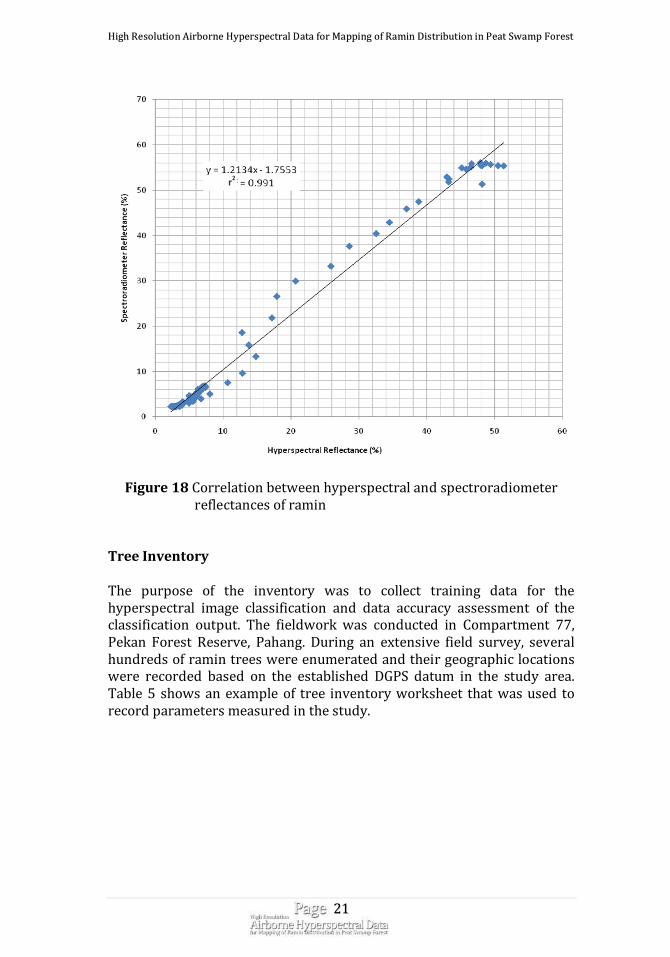
To make sure that the sample of ramin trees that was selected inhyperspectral imagery was a true ramin tree, the data were correlatedwith the field survey data measurement. The result shows a goodcorrelation (with R2 of 0.991) between ramin spectral signature measuredusing spectroradiometer and the selected ramin spectral signature fromhyperspectral data as shown in Figure 18.
Statistic Ramin (%) Bintangor (%)
Minimum 2.2 6.2
Maximum 57.9 59.6
Mean 26.9 31.7
HHiigghh RReessoolluuttiioonn AAiirrbboorrnnee HHyyppeerrssppeeccttrraall DDaattaa ffoorr MMaappppiinngg ooff RRaammiinn DDiissttrriibbuuttiioonn iinn PPeeaatt SSwwaammpp FFoorreesstt
2211
Figure 18 Correlation between hyperspectral and spectroradiometerreflectances of ramin
Tree Inventory
The purpose of the inventory was to collect training data for thehyperspectral image classification and data accuracy assessment of theclassification output. The fieldwork was conducted in Compartment 77,Pekan Forest Reserve, Pahang. During an extensive field survey, severalhundreds of ramin trees were enumerated and their geographic locationswere recorded based on the established DGPS datum in the study area.Table 5 shows an example of tree inventory worksheet that was used torecord parameters measured in the study.
r2

HHiigghh RReessoolluuttiioonn AAiirrbboorrnnee HHyyppeerrssppeeccttrraall DDaattaa ffoorr MMaappppiinngg ooff RRaammiinn DDiissttrriibbuuttiioonn iinn PPeeaatt SSwwaammpp FFoorreesstt
2222
Table 5 Example of tree inventory worksheet
Startpoint
To/TreeID
Azimuth(Degree)
Distance(m)
DBH(cm)
1stbranch
(m)
Totalheight
(m)
Canopy(m)
Note
CP1 CP2 71.9 16.10
CP2 R1 64.4 13.60 40.00 26.5 32.00 8x4
R2 76.4 11.80 29.50 14.2 19.30 3x4
CP3 250.9 16.50
CP3 CP4 265.5 17.30
CP4 R3 254.1 16.80 50.00 22.0 32.80 6x5
CP5 258.5 16.20
CP5 R4 292.1 12.10 46.90 28.6 45.40 4x5
CP6 289.6 11.50
CP6 R5 355.3 12.80 57.10 35.8 46.60 5x4
CP7 234.4 24.70
CP7 CP8 357.4 5.00
CP8 R6 66.2 23.50 61.50 25.4 44.40 6x6
CP9 281.7 17.80
CP9 R7 279.6 11.70 46.50 28.6 47.30 5x4
CP10 276.1 11.40
CP10 R8 250.3 14.80 54.10 19.6 29.20 4x5
R9 294.8 16.10 37.50 19.3 26.50 6x5
R10 265.4 26.70 58.80 22.2 32.90 7x7
CP8 CP11 356.5 13.70
R11 337.1 11.00 50.00 23.3 44.70 6x5
CP12 264.7 19.40
CP12 R12 269.3 18.40 56.10 19.0 38.70 6x4
CP13 356.1 11.20
CP13 R13 301.5 13.90 36.50 23.5 31.80 5x6
In this project, ramin tree inventory data were collected from field surveyin the test site as described in Section Tree Inventory (Chapter 3). A totalof 670 ramin trees were enumerated in the study area. This included 491trees from 25 ha of virgin PSF and 179 trees from the 30 ha of logged overPSF. The average densities of ramin trees in the virgin and logged-over PSFplots were 19.54 and 5.97 trees/ha respectively. The mean height of theramin trees was about 34.7 m, while the dbh ranged from 21.6 to 83.5 cm.All parameters and data collected from the field inventory were kept in aGeographic Information System (GIS) database (Figure 19).

HHiigghh RReessoolluuttiioonn AAiirrbboorrnnee HHyyppeerrssppeeccttrraall DDaattaa ffoorr MMaappppiinngg ooff RRaammiinn DDiissttrriibbuuttiioonn iinn PPeeaatt SSwwaammpp FFoorreesstt
2233
Figure 19 Ramin GIS database
Ramin Classification Using Hyperspectral Data
Having general information on the subject to be classified in the remotesensing image will help to increase the accuracy of the data to be classified.In this study the classification of ramin in the hyperspectral data was donewith the help of information on ramin position collected from the fieldsurvey. The selected ramin tree that has been identified was used as asample to generate ramin spectral signature in the SAM classificationtechnique and consequently to identify all pixels with similarcharacteristics (Figure 20). Finally the information was used to map theramin distribution in the entire image.
Virgin forest Logged over forest

HHiigghh RReessoolluuttiioonn AAiirrbboorrnnee HHyyppeerrssppeeccttrraall DDaattaa ffoorr MMaappppiinngg ooff RRaammiinn DDiissttrriibbuuttiioonn iinn PPeeaatt SSwwaammpp FFoorreesstt
2244
Figure 20 Example of identified ramin tree selected as sample point
Vegetation classification in the hyperspectral image can be regarded as atechnique of object identification and mapping. The unknown pixels in theimage are identified as among several vegetation types whose referencespectra are derived from the hyperspectral imagery by means of Regionsof Interest (ROI). Ideally, the reflectance spectra of each vegetation typeshould not vary, but in reality it does, due to a number of factors, includingthe phenological stage, weather conditions, soil conditions, shadows, andBidirectional Reflectance Distribution Function (BRDF) effects. One of themost frequently applied strategies for object mapping is the use ofsimilarity measures. This study makes use of a deterministic similaritymeasure to compare an unknown pixel spectrum with a library ofreference spectra using SAM.
The end member spectra of ramin used by the SAM technique in this studywere obtained from the selected ramin signature sample from HySpeximages that have been identified from the field survey. Strong spectraldifferences between ramin and other tree species classes are the mainfactor to discriminate this species in mixed peat swamp forest using theSAM technique. In this study, each of the selected ramin signatures thathave been identified in hyperspectral data was treated as an individual
Identified ramin tree

HHiigghh RReessoolluuttiioonn AAiirrbboorrnnee HHyyppeerrssppeeccttrraall DDaattaa ffoorr MMaappppiinngg ooff RRaammiinn DDiissttrriibbuuttiioonn iinn PPeeaatt SSwwaammpp FFoorreesstt
2255
end member in the SAM classification technique. In other words, theycontain only one representative spectrum per target. This is because theramin trees in the area were showing different blooming stages during thedata acquisition (Figure 21).
The different blooming stages of ramin in the study area lead to thevariation of reflectance magnitude of some ramin trees in thehyperspectral data. Instinctively this could explain some of the difficultiesin distinguishing ramin in the peat swamp forest in this study.
Figure 21 Signatures of different ramin blooming stages: (a) blooming, (b)semi blooming and (c) non-blooming
After separation of the spectral bands that are dominated by noise usingMNF transformation, the standard SAM classification was performed onthe hyperspectral image. To clean up the initial classification result, astandard majority 3x3 filter was applied. This filter uses a 3x3 pixelskernel and replaces the center pixel in the kernel with the class value thatthe majority of the pixels in the kernel have. Figure 22 shows the result oframin tree classification after post-classification clean-up by a majority3x3 filter.
(a)
(b)
(c)

HHiigghh RReessoolluuttiioonn AAiirrbboorrnnee HHyyppeerrssppeeccttrraall DDaattaa ffoorr MMaappppiinngg ooff RRaammiinn DDiissttrriibbuuttiioonn iinn PPeeaatt SSwwaammpp FFoorreesstt
2266
Figure 22 Ramin classification using hyperspectral data
Validation and Verification
In order to validate the results, 37 systematic plots within the study areawere established. An absolute accuracy was calculated for the resultedramin tree distributions from hyperspectral data. Absolute accuracy is ameasure of the error between a derived/predicted ramin tree fromairborne hyperspectral image and the actual ramin tree measured on theground. In this study, absolute accuracy (as shown in Table 6) is expressedas the vertical root mean square error (RMSE). It was found that thedistribution of ramin within the study area was about 21 trees existing in1 ha area, with an accuracy of 86% or ± 4 trees ha-1.

HHiigghh RReessoolluuttiioonn AAiirrbboorrnnee HHyyppeerrssppeeccttrraall DDaattaa ffoorr MMaappppiinngg ooff RRaammiinn DDiissttrriibbuuttiioonn iinn PPeeaatt SSwwaammpp FFoorreesstt
2277
Table 6 Accuracy of the predicted ramin trees
Plotnumber
Number of trees(ramin)Magnitude of
errorsMean square
errorsPredicted
(b)Measured
(b')(b - b') ((b - b')-µ)2
1-3 0 0 0 0.02
1-4 1 1 0 0.02
1-5 1 3 -2 3.46
1-6 1 1 0 0.02
2-0 2 1 1 1.30
2-1 2 2 0 0.02
2-2 2 8 -6 34.35
2-3 2 4 -2 3.46
2-4 2 1 1 1.30
2-5 1 0 1 1.30
2-6 0 0 0 0.02
3-1 1 3 -2 3.46
3-2 2 2 0 0.02
3-3 0 0 0 0.02
3-4 1 1 0 0.02
3-5 1 0 1 1.30
3-6 4 4 0 0.02
4-0 1 4 -3 8.19
4-1 2 0 2 4.57
4-2 2 0 2 4.57
4-3 0 0 0 0.02
4-4 1 4 -3 8.19
4-5 2 1 1 1.30
4-6 0 1 -1 0.74
5-0 3 3 0 0.02
5-1 1 0 1 1.30
5-2 5 2 3 9.85
5-4 0 6 -6 34.35
5-5 0 0 0 0.02
6-0 3 5 -2 3.46
6-1 6 0 6 37.69
6-3 4 2 2 4.57
6-5 0 2 -2 3.46
6-6 4 5 -1 0.74
7-0 4 4 0 0.02
7-2 6 2 4 17.13
µ = 0.14RMSE = ± 4.1
tree/ha

HHiigghh RReessoolluuttiioonn AAiirrbboorrnnee HHyyppeerrssppeeccttrraall DDaattaa ffoorr MMaappppiinngg ooff RRaammiinn DDiissttrriibbuuttiioonn iinn PPeeaatt SSwwaammpp FFoorreesstt
2288
Figure 23 Comparison between field survey mapping and hyperspectralmapping
Ramin Tree Volume Estimation
Volume estimation can be made from the information derived fromhyperspectral image analysis as a value-added product of hyperspectraldata. In this study, the estimation of ramin tree volume has been done bydelineating the individual tree crown areas from hyperspectral data. Asingle crown or canopy is treated as a single tree. The volume wasestimated from the correlation between tree dbh and tree crown size.Volume of each tree was calculated using the equation from Ismail (2009).
Ln (V) = -7.2213 + 2.1057 x Ln (dbh (cm)) - Equation 1
where,
V = volume (m3)dbh = Diameter at breast height
A simple linear regression model for predicting volume from the crownarea was developed using the 20 samples of tree crown with dbh ranging25 - 64 cm. The value for r2 was 0.728 for this fit of the model (Figure 24).The equation developed in this study was V = 0.0311 (crown size) -0.0435, where it provided a means for predicting volume from the crownsize measurement using the hyperspectral images. A comparison of treevolume estimation between volume measured using equation developed

HHiigghh RReessoolluuttiioonn AAiirrbboorrnnee HHyyppeerrssppeeccttrraall DDaattaa ffoorr MMaappppiinngg ooff RRaammiinn DDiissttrriibbuuttiioonn iinn PPeeaatt SSwwaammpp FFoorreesstt
2299
by Ismail (2009) and volume estimated using hyperspectral images ispresented in Table 7. The high accuracy of the volume estimated usinghyperspectral images indicates the usefulness of the data for raminvolume estimation in the natural forest environment.
Figure 24 Correlation between crown size and stem volume
Table 7 Accuracy of tree volume estimation
DBH(cm)
Crown Area(m2)
Measured Volume (usingEquation 1) (m3 tree-1)
Estimated Volume(m3 tree-1)
52.3 102.91 3.04 3.1664.0 143.48 4.65 4.42
64.5 133.58 4.72 4.11
32.6 87.40 1.12 2.67
33.2 35.14 1.17 1.05
25.0 40.93 0.64 1.23
49.5 71.15 2.7 2.17
49.8 107.9 2.74 3.31
55.6 105.4 3.45 3.24
39.1 74.31 1.65 2.27
50.0 93.94 2.76 2.88
47.0 84.02 2.43 2.57
37.5 48.03 1.51 1.45
28.6 30.60 0.85 0.91
51.2 78.43 2.90 2.40
52.8 105.4 3.10 3.24
28.7 27.35 0.86 0.81
Standard error: ±1.6 m3 tree-1
Accuracy: 97.3%

HHiigghh RReessoolluuttiioonn AAiirrbboorrnnee HHyyppeerrssppeeccttrraall DDaattaa ffoorr MMaappppiinngg ooff RRaammiinn DDiissttrriibbuuttiioonn iinn PPeeaatt SSwwaammpp FFoorreesstt
3300
CCHHAAPPTTEERR 55OVERVIEW AND RECOMMENDATIONS
Problems and limitations
Various studies in temperate conifer and mixed deciduous forests havedemonstrated accurate empirical estimates of canopy chemistry fromairborne hyperspectral technology. However, this application is relativelynew in tropical forests, thus may introduce new challenges, i.e. weatherconditions and varying forest composition.
The airborne hyperspectral technology is a relatively new technology inforestry and only few companies offer such services in Malaysia. As suchonly limited options are available in choosing a suitable and reliablecompany to acquire hyperspectral data. In addition there is a standardprocurement process to be followed by government agencies, and thisneeds to be taken into consideration at the early stage of project planningin order to avoid unnecessary data acquisition delay. The acquisition ofthe airborne hyperspectral data also requires approval from theDepartment of Civil Aviation (DCA), Malaysia because the installation ofhyperspectral system equipment needs some modification to the aircraftwhich will further prolongs the process of getting the hyperspectral data.Together with unpredictable weather condition, all these factors maycontribute to the delay in getting hyperspectral data in a developingtropical country like Malaysia.
During the acquisition of airborne hyperspectral data in the study area,ramin trees were in the floral phase. In the perspective of ecology, this treeblooming phase is very important. However, this situation causeddifficulty in processing the hyperspectral data. As such for better treespecies differentiation in the hyperspectral images, proper dataacquisition timing is important and whenever possible try to avoid theflower blooming as well as fruiting seasons as to avoid unnecessaryspectra signature interferences caused by the flowers and fruits of thetrees.
This study shows that the hyperspectral remote sensing technique is apotential tool to extract information from a forest with fairly homogenousfeatures such as peat swamp forest. With the right approach andprocessing and analysis procedures, variations within peat swamp can bediscriminated and classified accordingly. These variations may reflect thebiophysical properties of the peat swamp such as forest composition, tree

HHiigghh RReessoolluuttiioonn AAiirrbboorrnnee HHyyppeerrssppeeccttrraall DDaattaa ffoorr MMaappppiinngg ooff RRaammiinn DDiissttrriibbuuttiioonn iinn PPeeaatt SSwwaammpp FFoorreesstt
3311
density as well as vegetation status. This study also helps in forestmanagement and monitoring.
Conclusion
From the classification of HySpex hyperspectral image in the study area, itwas found that the ability to discriminate ramin as an individual canopytree from peat swamp forest was high. Strong spectral differencesbetween ramin and the other tree species are the main factor todiscriminate this species in mixed peat swamp forest using the SAMtechnique. A spectral library of the ramin trees has been developed andcan be used as reference spectral library for future research projects. Inthis study, the ramin spectral signature has been developed using 160 ofHySpex hyperspectral band. By using this spectral signature, ramin treescan be identified faster using HySpex hyperspectral data with acceptablemapping accuracy.
It was noted in the field that a large proportion of the tree crownsappearing to be single individual stands were in fact a combinations ofmixed species in HySpex image. Instinctively this could explain some of thedifficulties in distinguishing ramin species in the peat swamp forest. Oneof the more interesting results arising from this study is the effectivenessof species discrimination of individual ramin using only a few spectralbands of airborne HySpex hyperspectral data. It was found that thedistribution of ramin within the study area was about 21 trees in 1 haarea, with an accuracy of 86% or ± 4 tree ha-1. This study hasdemonstrated the Hyspex data can be used to classify an individual speciesas well as distinguish ramin tree crowns in mixed peat swamp forest. Thediscrimination of ramin using the SAM technique was robust withconsistently high classification accuracies. The availability of accurateinformation on ramin population from this study can be used to assist indesigning rehabilitation and conservation programme in order to conserveand sustainably manage this species. By lowering costs and increasingavailability, such remote sensing technology could become operational forlarge-scale forest classification and mapping projects.
To further increase the accuracy, some actions can be taken. Firstly, theimprovement of geometric accuracy of ramin sample from field surveyactivity. Because of wrongly selected ground data, pixels result in badclassification performance. The area of interest (AOI) for development ofspectral signature need to be manually selected to make sure the selectionis correct compared with ground survey data. There are three main factorsdetermining the quality of ground survey data. The first is complexity ofthe classes and the landscape. The second is the amount of survey data
HHiigghh RReessoolluuttiioonn AAiirrbboorrnnee HHyyppeerrssppeeccttrraall DDaattaa ffoorr MMaappppiinngg ooff RRaammiinn DDiissttrriibbuuttiioonn iinn PPeeaatt SSwwaammpp FFoorreesstt
3322
that are taken. The third is the amount of errors made when collecting theground survey data.
Secondly, using Individual Tree Crown delineation could be anothermethod to improve classification results. This approach delineatesindividual trees from aerial or satellite images and classifies the treespecies. The Individual Tree Crown functions best performs on not toodense forest, which means no overlapping of crowns. However, the treecrowns should be large and dense enough to be detected, but this is mainlydependent on the image characteristics. On the other hand, LiDAR (LightDetection and Ranging) data and optical images may form a powerfulcombination of remote sensing techniques which may improveclassification results. Optical images are best for classifying tree speciesand vegetation health, while LiDAR is best for measuring heights anddensities. These two sensor types complement each other and couldreduce the classification errors encountered in this study: the confusion ofground vegetation, bushes and mixed tree crowns. Incorporating heightclasses information captured from LiDAR data would reduce theseproblems. A future study focusing on this particular aspect isrecommended.

HHiigghh RReessoolluuttiioonn AAiirrbboorrnnee HHyyppeerrssppeeccttrraall DDaattaa ffoorr MMaappppiinngg ooff RRaammiinn DDiissttrriibbuuttiioonn iinn PPeeaatt SSwwaammpp FFoorreesstt
3333
REFERENCES
ABDUL RAHIM, N., EFRANSJAH, KHALI AZIZ, H., & SHAHARUDDIN, M.I.2007. Intergrated Management Plan of the South East Pahang PeatSwamp Forest. Peat Swamp Forest Project, UNDP/GEF funded, incollaboration with the Pahang Forestry Department. 232 pp.
BUCKINGHAM, R., STAENZ, K. & HOLLINGER, A. 2002. Review ofCanadian airborne and space activities in hyperspectralremote sensing. Canadian Aeronautics and Space Journal. Vol. 48.
DANSON, F. M. 1995. Development in the remote sensing of forest canopystructure. Advance in Environmental Remote Sensing : 53-69.
ISMAIL, P., ABD RAHMAN, K., WAN MOHD SHUKRI, W.A., SAMSUDIN, M. &HARFENDY, O. 2010. Development of local volume table (LVT) forpeat swamp in Pekan Forest Reserve, Pahang with specialreference to Gonystylus bancanus (ramin melawis). Paperpresented at MAJURUS, 21/9/10. 14pp.
ITTO. 2007. ITTO Expert Meeting on the Effective Implementation ofInclusion of Ramin (Gonystylus spp.) in Appendix II of CITES –Report of the Expert Meeting, 16-19 May 2006. Aminah, H., Chen,H.K., Chua, L.S.L. & Khoo, K.C (Eds.), Kuala Lumpur, Malaysia. 176pp.
KHALI AZIZ, H., ISMAIL, P., ANI S., MOHD AZAHARI, F., HARRY, Y., & IHSANSABRI, K. 2010. Gonystylus bancanus – Jewel of the Peat SwampForest. FRIM special publication. 84 pp.
KHALI AZIZ, H., ISMAIL, P., ABD RAHMAN, K., CHE HASHIM, H., GRIPPIN, A.& NIZAM, M.S. 2009. Stand characteristics of one hectare peatswamp forest ecological plot in Pahang, Malaysia. Journal ofTropical Life Sciences Research, USM 20(2): 23-35.
MC & I. 2002. The Malaysian Criteria and Indicators for ForestManagement Certification, 2002. Forestry Department PeninsularMalaysia. Unpublished report. 55 pp.
SHAFRI, H.Z.M., AFFENDI S. & SHATTRI, M. 2007. The performance ofmaximum likelihood, spectral angle mapper, neural network anddecision tree classifiers in hyperspectral image analysis. Journal ofComputer Science 3 (6): 419-423.

HHiigghh RReessoolluuttiioonn AAiirrbboorrnnee HHyyppeerrssppeeccttrraall DDaattaa ffoorr MMaappppiinngg ooff RRaammiinn DDiissttrriibbuuttiioonn iinn PPeeaatt SSwwaammpp FFoorreesstt
3344
APPENDIX 1 Ramin (Gonystylus bancanus)

HHiigghh RReessoolluuttiioonn AAiirrbboorrnnee HHyyppeerrssppeeccttrraall DDaattaa ffoorr MMaappppiinngg ooff RRaammiinn DDiissttrriibbuuttiioonn iinn PPeeaatt SSwwaammpp FFoorreesstt
3355
APPENDIX 2 Nature of peat swamp forest in Pekan Forest Reserve

HHiigghh RReessoolluuttiioonn AAiirrbboorrnnee HHyyppeerrssppeeccttrraall DDaattaa ffoorr MMaappppiinngg ooff RRaammiinn DDiissttrriibbuuttiioonn iinn PPeeaatt SSwwaammpp FFoorreesstt
3366
APPENDIX 3 Ramin distribution map using hyperspectral data

HHiigghh RReessoolluuttiioonn AAiirrbboorrnnee HHyyppeerrssppeeccttrraall DDaattaa ffoorr MMaappppiinngg ooff RRaammiinn DDiissttrriibbuuttiioonn iinn PPeeaatt SSwwaammpp FFoorreesstt
3377
APPENDIX 4 Crown delineation and sampling points for stem volumeestimation

HHiigghh RReessoolluuttiioonn AAiirrbboorrnnee HHyyppeerrssppeeccttrraall DDaattaa ffoorr MMaappppiinngg ooff RRaammiinn DDiissttrriibbuuttiioonn iinn PPeeaatt SSwwaammpp FFoorreesstt
3388
APPENDIX 5 Ramin spectral signature (reflectance) of hyperspectral andspectroradiometer data
No.Wavelength
(µm)
Reflectance (%)
Hyperspectral Spectroradiometer
1 0.4085 2.41 2.23
2 0.4121 2.34 2.25
3 0.4157 2.51 2.22
4 0.4194 2.65 2.23
5 0.423 2.79 2.22
6 0.4266 2.44 2.24
7 0.4302 3.58 2.23
8 0.4339 2.90 2.20
9 0.4375 3.07 2.23
10 0.4411 2.97 2.23
11 0.4447 2.84 2.23
12 0.4484 3.14 2.27
13 0.452 2.81 2.24
14 0.4556 3.09 2.27
15 0.4593 3.02 2.28
16 0.4629 2.96 2.28
17 0.4665 2.98 2.28
18 0.4701 3.13 2.29
19 0.4738 3.04 2.29
20 0.4774 3.17 2.30
21 0.481 2.69 2.30
22 0.4846 2.86 2.29
23 0.4883 3.27 2.37
24 0.4919 3.20 2.36
25 0.4955 3.21 2.38
26 0.4991 3.30 2.45
27 0.5028 3.58 2.54
28 0.5064 3.62 2.66
29 0.51 4.11 2.91
30 0.5137 4.06 3.15
31 0.5173 5.11 3.52
32 0.5209 5.79 3.93
33 0.5245 6.08 4.60
34 0.5282 6.31 5.05
35 0.5318 6.47 5.42

HHiigghh RReessoolluuttiioonn AAiirrbboorrnnee HHyyppeerrssppeeccttrraall DDaattaa ffoorr MMaappppiinngg ooff RRaammiinn DDiissttrriibbuuttiioonn iinn PPeeaatt SSwwaammpp FFoorreesstt
3399
36 0.5354 6.73 5.71
37 0.539 6.69 6.05
38 0.5427 7.00 6.23
39 0.5463 7.40 6.43
40 0.5499 7.27 6.61
41 0.5535 7.39 6.76
42 0.5572 7.20 6.78
43 0.5608 6.96 6.68
44 0.5644 6.89 6.49
45 0.5681 6.30 6.04
46 0.5717 6.45 5.67
47 0.5753 6.09 5.32
48 0.5789 6.05 5.04
49 0.5826 5.75 4.74
50 0.5862 4.99 4.61
51 0.5898 5.06 4.54
52 0.5934 5.41 4.41
53 0.5971 5.24 4.35
54 0.6007 5.85 4.31
55 0.6043 5.47 4.23
56 0.6079 5.52 4.12
57 0.6116 5.18 3.92
58 0.6152 5.25 3.77
59 0.6188 5.01 3.64
60 0.6225 5.19 3.51
61 0.6261 4.84 3.48
62 0.6297 5.13 3.45
63 0.6333 4.91 3.44
64 0.637 4.76 3.38
65 0.6406 4.08 3.30
66 0.6442 3.98 3.18
67 0.6478 3.92 3.03
68 0.6515 3.81 2.94
69 0.6551 3.92 2.86
70 0.6587 3.89 2.80
71 0.6624 3.76 2.70
72 0.666 3.50 2.58
73 0.6696 3.50 2.53
74 0.6732 3.56 2.52
75 0.6769 3.94 2.54

HHiigghh RReessoolluuttiioonn AAiirrbboorrnnee HHyyppeerrssppeeccttrraall DDaattaa ffoorr MMaappppiinngg ooff RRaammiinn DDiissttrriibbuuttiioonn iinn PPeeaatt SSwwaammpp FFoorreesstt
4400
76 0.6805 3.47 2.60
77 0.6841 3.66 2.63
78 0.6877 4.99 2.99
79 0.6914 5.58 3.36
80 0.695 6.76 3.95
81 0.6986 8.07 5.01
82 0.7022 10.69 7.50
83 0.7059 12.86 9.59
84 0.7095 14.85 13.29
85 0.7131 13.79 15.82
86 0.7168 12.80 18.57
87 0.7204 17.21 21.81
88 0.724 17.93 26.55
89 0.7276 20.70 29.94
90 0.7313 25.90 33.24
91 0.7349 28.62 37.64
92 0.7385 32.57 40.43
93 0.7421 34.52 42.89
94 0.7458 37.05 45.89
95 0.7494 38.83 47.47
96 0.7675 48.17 51.34
97 0.7711 43.24 51.83
98 0.7748 43.28 52.49
99 0.7784 42.98 52.93
100 0.8401 45.84 54.61
101 0.8437 45.18 54.94
102 0.8473 46.54 55.15
103 0.8546 51.36 55.38
104 0.8582 48.00 55.49
105 0.8618 48.19 55.45
106 0.8654 50.52 55.43
107 0.8691 48.18 55.56
108 0.8727 49.42 55.68
109 0.88 48.73 55.97
110 0.8836 46.63 55.86
111 0.8872 47.92 56.07

HHiigghh RReessoolluuttiioonn AAiirrbboorrnnee HHyyppeerrssppeeccttrraall DDaattaa ffoorr MMaappppiinngg ooff RRaammiinn DDiissttrriibbuuttiioonn iinn PPeeaatt SSwwaammpp FFoorreesstt
4411