genesis energy hy17 results presentation - nzx · hy17 results presentation 1 hy17 highlights and...
TRANSCRIPT

GENESIS ENERGY
HY17Results Presentation

Agenda
HY17 Results Presentation
1 HY17 Highlights and Strategy Update__
Marc England
Chief Executive
2 Financial Performance__
Chris Jewell
Chief Financial Officer
4 Outlook and Guidance Update__
Marc England
Chief Executive
3 Operational Performance__
Marc England
Chief Executive
2

____
HY17 Highlights and Strategy Update
Marc England
1
Chief Executive
____

HY17 Results Presentation
HY17 Highlights
A reinvigorated strategy in place
4
Reset Vision and Strategy
Transformation Journey Underway
Announced Acquisition of an Additional 15% Interest in Kupe
22% Growth in LPG Sector Customers
StrongHealth & Safety
Performance with TRIFR down 70%
Cost Optimisation Delivers $6 Million
in Savings

HY17 Results Presentation
Strategy Update
Our plan on a page
5
REIMAGINING ENERGYto be customers’ first choice for energy managementV
isio
n
OPTIMISETo improve short term return
INNOVATEIn long-term value creation
INVESTFor medium term growth
Stra
tegi
c Th
em
es
Lean start up product
development
Cri
tica
l Fu
ture
cap
abili
tie
s Data driven decision making
Field force management
Scaled agile ways of working
Stra
tegi
c P
rio
riti
es
Create enduring customer
relationships
Leverage data, analysis and
insight
Maximise return from
core activities
Deploy technology to
build trust
Enhance experience with
new business models
Commercial relationship
management
Distributed asset management
Software development
Sales capabilities
Organise for best in class
strategic execution

HY17 Results Presentation
Strategy Update
InnovateFor medium term
growth
InvestIn long-term value
creation
OptimiseTo improve short term
return
Transformation journey underway
6
HY17 Achievements
Total cost savings of $6 million, $4.5 million annualised
Cost to acquire down 15%
6% reduction in employee costs
Driving efficiency throughout the
business
Segment growth and defining the future of energy
management
Investment into data and systems
and increased influence over Kupe
LPG customers up 22%
SME field force in place for Q3,
Spark contract secured
Launched the ‘Local Energy
Project’
Acquisition of 15% interest in Kupe for $168 million
Phase 1 of Salesforce being
implemented
Growth capex of $6.1 million
HY17 Results Presentation
Strategy Update
7
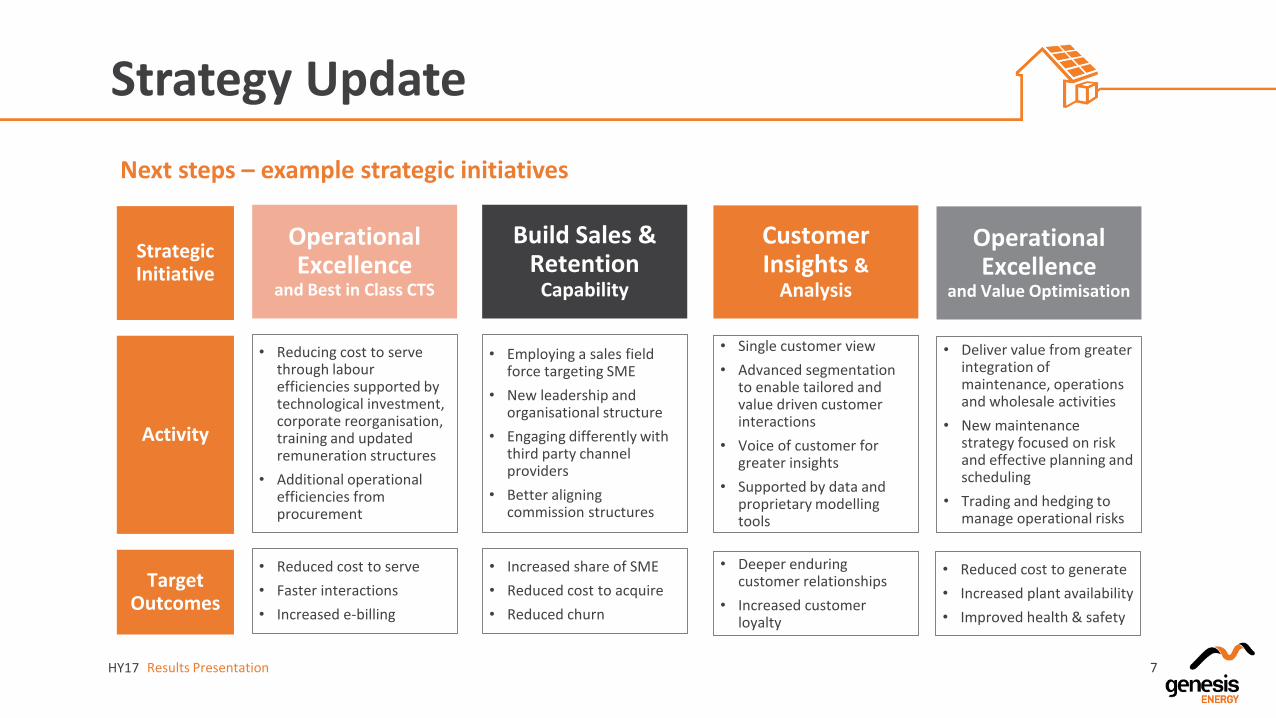
Next steps – example strategic initiatives
• Reducing cost to serve through labour efficiencies supported by technological investment, corporate reorganisation, training and updated remuneration structures
• Additional operational efficiencies from procurement
Operational Excellence
and Best in Class CTS
Build Sales & Retention
Capability
Customer Insights &
Analysis
• Employing a sales field force targeting SME
• New leadership and organisational structure
• Engaging differently with third party channel providers
• Better aligning commission structures
• Single customer view
• Advanced segmentation to enable tailored and value driven customer interactions
• Voice of customer for greater insights
• Supported by data and proprietary modelling tools
Operational Excellence
and Value Optimisation
• Deliver value from greaterintegration of maintenance, operations and wholesale activities
• New maintenance strategy focused on risk and effective planning and scheduling
• Trading and hedging to manage operational risks
• Reduced cost to serve
• Faster interactions
• Increased e-billing
• Increased share of SME
• Reduced cost to acquire
• Reduced churn
• Deeper enduring customer relationships
• Increased customer loyalty
• Reduced cost to generate
• Increased plant availability
• Improved health & safety
Activity
Strategic Initiative
Target Outcomes

____
Financial Performance
Chris Jewell
2
Chief Financial Officer
____

HY17 Results Presentation
HY17 Financial Highlights
Performance in line with expectations and guidance
9
EBITDAF
$155.7m11% lower year on year but
performance stable excluding market impacts and one off
transformation activities
ADJUSTED NET DEBT
$845m2.2% Lower on HY16
FREE CASH FLOW
$94.7mConsistent with lower EBITDAF
NPAT
$37.4m4% higher driven by fair value
changes in financial instruments
COST SAVINGS
$4.5mAnnualised
TOTAL DIVIDENDS
8.2cpsConsistent with HY16

HY17 Results Presentation
Financial Summary
• EBITDAF down 11% but taking account of market impacts and one off transformation activities underlying operating performance was stable (and in line with previous guidance)
• Key drivers:
− Adverse oil prices and yield decline at Kupe
− Adverse long fuel volume sale prices
− Reduced spot prices and less thermal volume
− Warm weather and reduced retail consumption; offset by
− Higher prices in both MM and TOU markets
− Cost saving initiatives
• NPAT up 4% due to fair value movements in financial instruments
• EPS also up 4% whilst net debt is down 2%
Stable operating performance when market impacts are excluded
10
Key Financial Performance HY17($m)
HY16($m)
Variance
EBITDAF $ 155.7 175.5 (11.3%)
Net Profit After Tax $ 37.4 35.9 4.2%
Earnings Per Share cps 3.74 3.59 4.2%
Stay in Business Capital Expenditure
$ 16.8 15.7 7.0%
Free Cash Flow $ 94.7 114.2 (17.1%)
Dividends Per Share cps 8.2 8.2 0.0%
Dividends Declared as a % of FCF
86.6% 71.8% 20.6%
Adjusted Net Debt $ 844.9 864.3 (2.2%)

HY17 Results Presentation
EBITDAF HY17 vs HY16
Focusing on controllable activities to offset market factors
11
$176
$156
$9
$6 $1
$3
$2$7
$3$2$4
$6
$3
HY16 EBITDAF Lower Oil Priceand Yield
LowerWholesale Fuel
Prices
ReducedConsumption
One-offRestructuring
Costs
RevenueImprovement
Reduced RetailVolumes
Reduction inOverhead Costs
Kupe outages Generation andTrading
Activities
AccountingMovements
OtherMovements
HY17 EBITDAF
HY17 vs HY16 EBITDAF
Controllable ActivitiesMarket Adverse ConditionsTransformation
Activities$ MILLIONS
1
1. Represents changes in bad debts and deferred acquisition costs

HY17 Results Presentation
Customer Performance Summary
• EBITDAF increased $5.7 million relative to HY16 up 10%
• Key drivers:
− 1.8% increase in MM and 5.1% increase in TOU prices
− Cost optimisation savings of $1 million
− Cost to acquire declined by 15%
− Offset by volume declines due to lower consumption from unusually warm weather and reduced customer numbers down 0.9%
Price growth and reduced cost to acquire sets a strong foundation for future growth
12
Key Information HY17 HY16 Variance
EBITDAF ($ millions) 62.7 57.0 10.0%
Electricity Customers 514,155 522,586 (1.6%)
Gas Customers 106,388 106,809 (0.4%)
LPG Customers 17,513 14,326 22.2%
Total Customer Accounts 638,056 643,721 (0.9%)
Customer Electricity Sales (GWh) 2,916 3,015 (3.3%)
Customer Gas Sales (PJ) 4.3 4.2 0.9%
Customer LPG Sales (tonnes) 2,570 2,202 16.7%

HY17 Results Presentation
Wholesale Performance Summary
• EBITDAF impacted by lower spot electricity prices and lower wholesale fuel prices declining 10.3% on a like for like basis
• Key Drivers:
− $5.1 million in cost savings from optimisation initiatives and lower coal burn. Offset by:
− GWAP down 13.6% to $53.36 although margin impact reduced by lower fuel costs down 12.7%
− Thermal generation down 23%
− Reduced oil, LPG and methanol prices
− Lower consumption from warmer weather and delayed irrigation
Cost saving benefits offset by wet weather and global fuel conditions
13
Key Information HY17 HY16 Variance
EBITDAF ($ millions) 82.8 98.0 (15.5%)
Thermal Generation (GWh) 1,485 1,933 (23.2%)
Renewable Generation (GWh) 1,625 1,444 12.5%
Total Generation (GWh) 3,110 3,377 (7.9%)
GWAP ($/MWh) 53.36 61.78 (13.6%)
LWAP ($/MWh) 53.43 61.90 (13.7%)
LWAP/GWAP Ratio 100% 100%
Weighted Average Fuel Cost ($/MWh) 30.04 34.40 (12.7%)
Coal/Gas Mix (Rankines only) 30/70 78/22

HY17 Results Presentation
Kupe Performance Summary
• Gas production up on prior year despite unplanned 12 day outage in HY17
• EBITDAF continues to be impacted by external factors:
− HY17 oil sales hedged at an average of US$57/bbl led to $8m decline relative to HY16 where oil prices were hedged at an average US$86/bbl
− LPG production down due to plant corrosion issues which were resolved in late 2016
• Remaining FY17 oil sales volume are 88% hedged at USD$57/bbl
Increased production is offset by continuing low oil prices
14
Key Information HY17 HY16 Variance
EBITDAF ($ millions) 31.9 39.4 (19.0%)
Gas Sales (PJ) 3.8 3.4 10.8%
Oil Production (kbbl) 195.8 207.3 (5.6%)
Oil Sales (kbbl) 146.8 158.6 (7.4%)
LPG Sales (PJ) 11.5 14.1 (18.0%)
Average Brent Crude Oil (USD/bbl) 48 47 2.1%
Average Hedged Price (USD/bbl) 57 86 (33.7%)

HY17 Results Presentation
Operating Expenses
• $6 million of cost savings were delivered in HY17, predominantly due to reduced headcount, lower plant operating expenses and lower coal burn reducing handling and emission costs
− Annualised cost saving of $4.5 million delivered with further optimisation activities underway
• Direct operating and allocated costs down $4 million net of one-off transformation activities
Significant cost savings delivered in first half
15
Annualised
HY17
Customer Wholesale
COST SAVINGS DELIVERED
$113 $112
$3
$3$3
$2
HY16 DOA Costs LowerContracting
Costs
ReducedStaff Costs
One-offRestructuring
Costs
AccountingOne-Offs
HY17 DOA Costs
$MILLIONS
HY16 vs HY17 DIRECT AND ALLOCATED COSTS

HY17 Results Presentation
Cashflow and Capital Expenditure
• Operating cash flow reduced by $36 million due to reduced EBITDAF, a one off tax credit paid in FY16, a lower reduction in the coal stockpile offset by a reduction in carbon credits on hand
• Investing cash flow higher from increased capital expenditure
− Stay in business capex consistent with prior year with additional capex of $6.1 million on strategic growth initiatives
− Key investments include customer relationship management system and CIC call system
• Financing cash flow impacted by cash on hand required to settle Kupe acquisition and repayment of borrowings
− Excluding $168 million acquisition funding net cash increase was $5.7 million
Free cash flow in line with EBITDAF movement
16
Cash Information HY17($m)
HY16($m)
Variance
Net Operating Cashflow $ 126.5 162.5
Net Investing Cashflow $ (29.8) (13.0)
Net Financing Cashflow $ 78.1 (133.0)
Net Increase in Cash $ 174.8 16.5 NA
EBITDAF $ 155.7 175.5 (11.3%)
Less: Finance Expense $ (28.7) (31.4) 8.6%
Less: Income Tax Expense $ (15.5) (14.2) (9.2%)
Less: Stay in Business Capital Expenditure
$ (16.8) (15.7) (7.0%)
Free Cash Flow $ 94.7 114.2 (17.1%)

HY17 Results Presentation
Funding Profile
• Adjusted gearing has increased to 34.9% due to additional bank facilities required for Kupe acquisition
• Average tenor of 7.9 years with an average cost of debt of 5.5%
Increased gearing from Kupe investment but headroom remains for growth
17
Debt Information HY17($m)
HY16($m)
Variance (%)
Total Debt $ 1,084.7 938.8
Cash and Cash Equivalents $ 209.7 37.5
Headline Net Debt $ 875.0 901.3 (2.9%)
USPP FX and FV Adjustments $ 30.1 37.0
Adjusted Net Debt $ 844.9 864.3 (2.2%)
Headline Gearing 35.6% 33.7% 1.9%
Adjusted Gearing 34.9% 32.8% 2.1%
Net Debt/EBITDAF 2.7 2.5 8.0%
EBITDAF Interest Cover 6.5 6.6 1.5%
Average cost of debt 5.5% 6.3% 0.8%
0
50
100
150
200
250
FY17 FY18 FY19 FY20 FY21 FY22 FY23 FY24 FY25 FY26 FY27 FY42
$MILLIONS
Retailable Bonds Wholesale Domestic Drawn Bank
Undrawn Bank Capital Bonds USPP
1. Net debt has been adjusted for foreign currency translation and fair value movements related to USD denominated borrowings which have been fully hedged with cross currency swaps
2. HY17 EBITDAF annualised for calculation
GENESIS ENERGY DEBT PROFILE1
1. Pro forma for Kupe acquisition

HY17 Results Presentation
Dividends
• Interim dividend of 8.2cps declared same as HY16 with 80% imputation
• Dividends have increased in real terms over past two years by 2.5% relative to inflation of 1.3%
Consistent with prior year as capital prioritised towards growth opportunities
18
64
80 82 8283
92
114
94
HY14 HY15 HY16 HY17
$ MILLIONS
DIVIDENDS DECLARED AND FREE CASH FLOW
Dividends Free Cash Flow

____
Operational Highlights
Marc England
3
Chief Executive
____

HY17 Results Presentation 20
EBITDAFUp 10%
LPG CustomersUp 22%
Value Strategy Underway
• EBITDAF growth excluding one-offs1 of 16%
• Increase in price for both Mass Market and TOU offset volume related declines
• Cost optimisation delivering $1 million of savings
• LPG sales volumes up 25%
• Commercial and Industrial business unit established, Spark contract secured
• Bobtail truck delivered and is already over 50% committed on a volume basis
• Focus on increasing multi product customers and growing new channels
• Tactical pricing initiatives favourable to margins
• Foundation technology investment underway to support growth
First half performance sets a strong foundation for further value creation
Customer Key Highlights
1. One-offs include accounting adjustments and redundancy costs

HY17 Results Presentation 21
Reduced consumption and high level of switching
HY17 Customer Market Conditions
• Weather conditions were warmer than normal, reducing consumption
− 2016 was New Zealand’s warmest year on record with average temperatures being between 0.5 to 1.2degrees above annual average
− Residential demand down 4.5% on the same period last year
• Electricity customer switching continues to remain at a high level although there was a 3.8% reduction in the total customer switches in HY17 compared with the prior year
-6%-4%-2%0%2%4%6%8%
10%12%14%
Jul Aug Sep Oct Nov Dec
WARMER
COLDER
ROLLING 12 MONTH INDUSTRY SWITCHING
TEMPERATURE PERCENTAGE CHANGE vs PRIOR YEAR
0%
5%
10%
15%
20%
25%
De
c-1
4
Jan
-15
Feb
-15
Mar
-15
Ap
r-1
5
May
-15
Jun
-15
Jul-
15
Au
g-1
5
Sep
-15
Oct
-15
No
v-1
5
De
c-1
5
Jan
-16
Feb
-16
Mar
-16
Ap
r-1
6
May
-16
Jun
-16
Jul-
16
Au
g-1
6
Sep
-16
Oct
-16
No
v-1
6
De
c-1
6
Home Move Retailer Switch Total Market Switch

Reducing cost to acquire
HY17 Results Presentation 22
• Tactical sales initiatives are improving margins
• Lower and less frequent discounts reducing cost to acquire down 15%, variable cost to acquire down 5%
• Online acquisition channel continues to dominate
• Focused initiatives around sales and retention being put in place to reward value maximising behaviours
Cheaper and more targeted acquisition and retention channels
60 80 100 120 140
HY16
HY17
$ Variable CTA Total CTA
COST TO ACQUIRE PER CUSTOMER
Jun
-12
Sep
-12
De
c-1
2
Mar
-13
Jun
-13
Sep
-13
De
c-1
3
Mar
-14
Jun
-14
Sep
-14
De
c-1
4
Mar
-15
Jun
-15
Sep
-15
De
c-1
5
Mar
-16
Jun
-16
Sep
-16
De
c-1
6
Door-to-door Outbound Online Kiosks
GROSS MONTHLY SALES BY ACQUISITION CHAENNEL

Optimising cost to serve
HY17 Results Presentation 23
• 11% reduction in FTE over past 18 months as business streamlined
• Significant movement towards lower cost self service and digital interactions improving customer service with call volumes down 9% over the 12 months and self service transactions up 47%
• New call routing system has been implemented to improve handling performance
Driving efficiency with a customer centric approach
CUSTOMER INTERACTIONS (ROLLING 12 MONTHS)
360
370
380
390
400
410
420
430
440
Au
g-1
5
Sep
-15
Oct
-15
No
v-1
5
De
c-1
5
Jan
-16
Feb
-16
Mar
-16
Ap
r-1
6
May
-16
Jun
-16
Jul-
16
Au
g-1
6
Sep
-16
Oct
-16
No
v-1
6
De
c-1
6
RETAIL FULL TIME EQUIVALENT
Jan Feb Mar Apr May Jun Jul Aug Sept Oct Nov Dec
Self Service Transactions Digitial Usage

Growing Our Customer Base
HY17 Results Presentation 24
• Rapid growth in LPG segment
− 9% residential customer growth in 6 months, adding over 1,700 accounts
− Energy Online bottled gas up strongly since launch in April 2016 with over 1,200 customers
− Built and received first on site customer refilling truck with over 50% utilisation pre-sold
• Leveraging technology to increase customer loyalty
− 26% increase in LPG bottle ordering via the app
− Implemented C&I bottle management solution to automate scheduling and ordering
− Developing a similar solution for residential customers
• Leveraging EOL as a alternative channel with customers up 6% over 12 months for electricity and 92% for gas
Continued strong growth in LPG and EOL channels ESTIMATED RESIDENTIAL LPG 45KG MARKET SHARE BY VOLUMES
7.8%
8.0%
8.2%
8.4%
8.6%
8.8%
9.0%
9.2%
9.4%
3.33.43.53.63.73.83.94.04.14.24.3
De
c-1
5
Jan
-16
Feb
-16
Mar
-16
Ap
r-1
6
May
-16
Jun
-16
Jul-
16
Au
g-1
6
Sep
-16
Oct
-16
No
v-1
6
De
c-1
6
Market Share %Kilotonnes
Rolling 12m SalesRolling 12m Market Share (RHS)
50,000
60,000
70,000
80,000
90,000
100,000
Jun
-14
Au
g-1
4
Oct
-14
De
c-1
4
Feb
-15
Ap
r-1
5
Jun
-15
Au
g-1
5
Oct
-15
De
c-1
5
Feb
-16
Ap
r-1
6
Jun
-16
Au
g-1
6
Oct
-16
De
c-1
6
Electricity Customer Connections Gas Customer Connections
EOL CUSTOMER CONNECTIONS GROWTH
Driving Energy Insights
HY17 Results Presentation 25
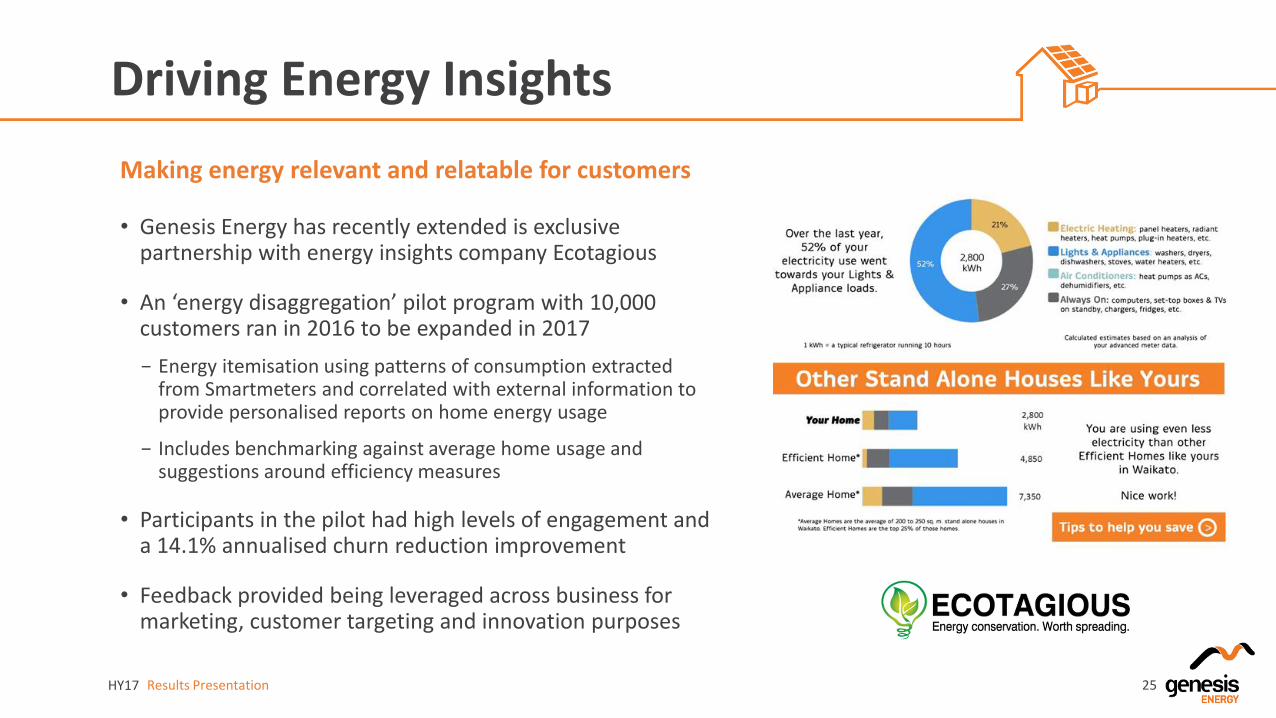
• Genesis Energy has recently extended is exclusive partnership with energy insights company Ecotagious
• An ‘energy disaggregation’ pilot program with 10,000 customers ran in 2016 to be expanded in 2017
− Energy itemisation using patterns of consumption extracted from Smartmeters and correlated with external information to provide personalised reports on home energy usage
− Includes benchmarking against average home usage and suggestions around efficiency measures
• Participants in the pilot had high levels of engagement and a 14.1% annualised churn reduction improvement
• Feedback provided being leveraged across business for marketing, customer targeting and innovation purposes
Making energy relevant and relatable for customers

The ‘Local Energy Project’
HY17 Results Presentation 26
Bringing the seven flows of electrons to life
• Genesis has launched a community project in Martinborough and surrounds to accelerate the journey to energy management supplier
• Key benefits for the community:
− Increased visibility of energy usage
− Access to distributed energy with reduced price barriers
− Participation in an energy community leading early change
• Key benefits for Genesis:
− Building internal capability around intellectual property and data analytics
− Smaller scale trial with a representative community of the New Zealand demographic enables faster refinement before larger scale build out
− Access to data to enhance understanding of customer behaviours
• Less than 2 months from origination to working software prototype demonstrates speed to market

EBITDAF$82.8 million
Cost Savings$5.1 million
UniqueMarket position
• In line with expectations as macro factors impacted wholesale fuel prices
• Weather conditions reduced consumption and favoured renewable generation
• Increased hydro and lower fuel burn reduced costs
• 8% reduction in FTE’s
• Low coal burn led to lower handling and emissions costs
• New maintenance approach being rolled out across assets
• Mix of thermal and hydro offers downside protection
• Underlying business performance demonstrates flexibility to maximise generation activities to market environment
Significant focus on business optimisation
Wholesale Key Highlights
1. One-offs include market related factors
HY17 Results Presentation 27

HY17 Results Presentation 28
Wet conditions favoured renewable generation
HY17 Wholesale Market Conditions
• Above average rain in 2016 led to low spot prices, high storage levels resulting in renewable being favoured over thermal generation in HY17
− Storage levels were 19% above long term averages
− 31% reduction in thermal generation in the market relative to the prior period
• Agricultural irrigation started very late in the season, impacting industrial demand levels
• Warmer than average weather also impacted residential demand
MONTHLY AVERAGE SPOT PRICE AT OTAHUHU (2016)
2,000
2,500
3,000
3,500
4,000
Jan Feb Mar Apr May Jun Jul Aug Sep Oct Nov Dec
91 year average 2016
NEW ZEALAND DAILY STORAGE
$40
$45
$50
$55
$60
$65
$70
$75
Jul Aug Sep Oct Nov Dec
$/MWh Monthly Average 10 Year Average

HY17 Results Presentation
Generation Flexibility Advantage
• Genesis Energy has a unique position to flex its thermal and hydro generation or conserve its higher cost units and buy on market to match market conditions
• Less coal has been consumed due to strategic use of the gas book giving fuel flexibility and lower carbon emissions
− Highlights benefit of integrated fuel position
− Changing LPG demand profile from wholesale to retail improving margins
− Gas book offers material upside post 2020 when legacy contracts expire
Reduces downside risk from macro conditions
29
GAS POSITION SUMMARY
0100200300400500600700
Jul-
14
Sep
-14
No
v-1
4
Jan
-15
Mar
-15
May
-15
Jul-
15
Sep
-15
No
v-1
5
Jan
-16
Mar
-16
May
-16
Jul-
16
Sep
-16
No
v-1
6
Coal Gas
COAL vs GAS USE
GWh
0
10
20
30
40
50
2016 2017 2018 2019 2020 2021 2022 2023 2024
PJ
Kupe Contract Flexible + MUG KupeUncontracted Kupe Third party contractOther contracted gas Gas DemandGas Demand Plus Contracted Gas Sales
HY17 Results Presentation
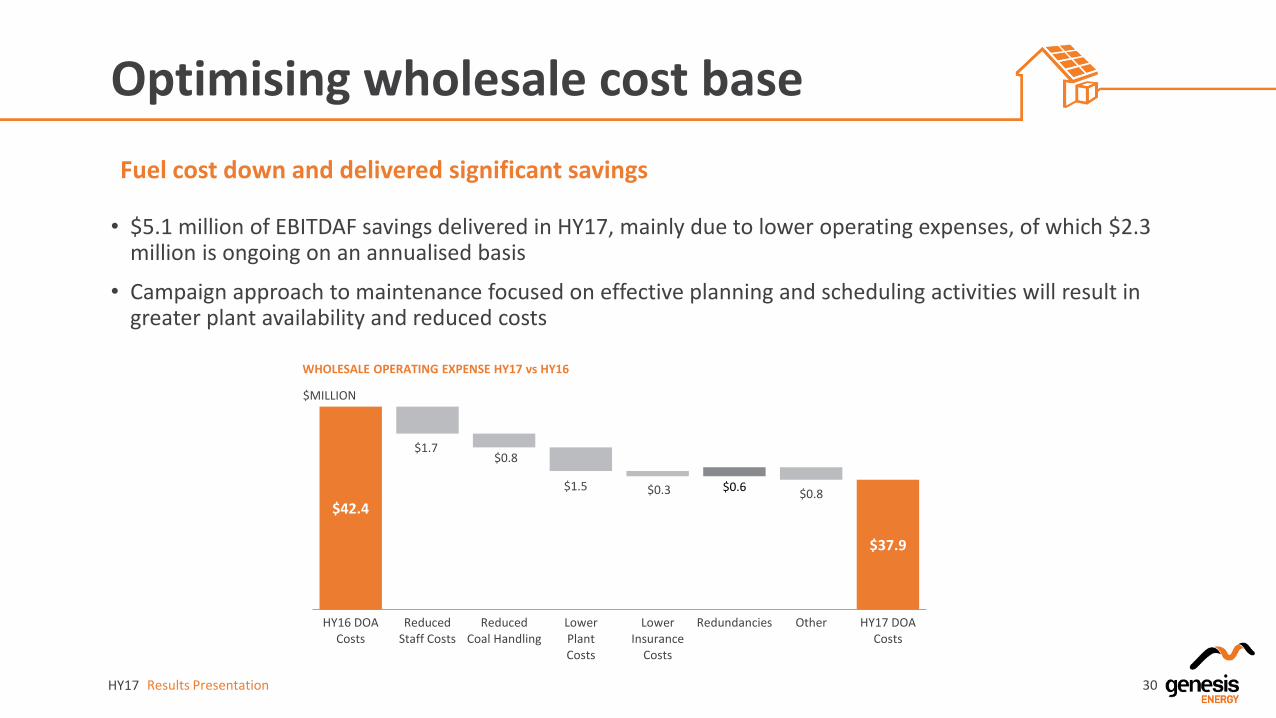
Optimising wholesale cost base
• $5.1 million of EBITDAF savings delivered in HY17, mainly due to lower operating expenses, of which $2.3 million is ongoing on an annualised basis
• Campaign approach to maintenance focused on effective planning and scheduling activities will result in greater plant availability and reduced costs
Fuel cost down and delivered significant savings
30
$42.4
$37.9
$1.7$0.8
$1.5 $0.3 $0.8$0.6
HY16 DOACosts
ReducedStaff Costs
ReducedCoal Handling
LowerPlantCosts
LowerInsurance
Costs
Redundancies Other HY17 DOACosts
$MILLION
WHOLESALE OPERATING EXPENSE HY17 vs HY16

EBITDAF$31.9 million
AcquiredAdditional 15%
Integrated FuelBenefits
• Gas production up 11% on the prior year
• Offset by macro oil price impacts
• LPG production issues resolved for the second half
• Increased exposure to a high performing field in a declining gas reserve market
• Influence over timing and scale of Phase II development
• Additional EBITDAF supports free cash flow for investment
• Priority access to uncontracted gas
• Additional supply of LPG to support growth in a market heading towards a net import position
Increased Kupe ownership further integrates fuel position
Kupe Key Highlights
HY17 Results Presentation 31

HY17 Results Presentation
Kupe Outage Update
• Kupe was offline for 14 days in HY17, 12 of which were unplanned
− Propane compressor failure which occurred after a planned outage
− Net impact to HY17 performance of $2.6 million
• LPG production down 18% for HY17 due to an LPG plant outage caused by corrosion under insulation which was identified in FY16. Plant was back near full capacity in late 2016
12 day unplanned outage in HY17
32
HY17 Results Presentation
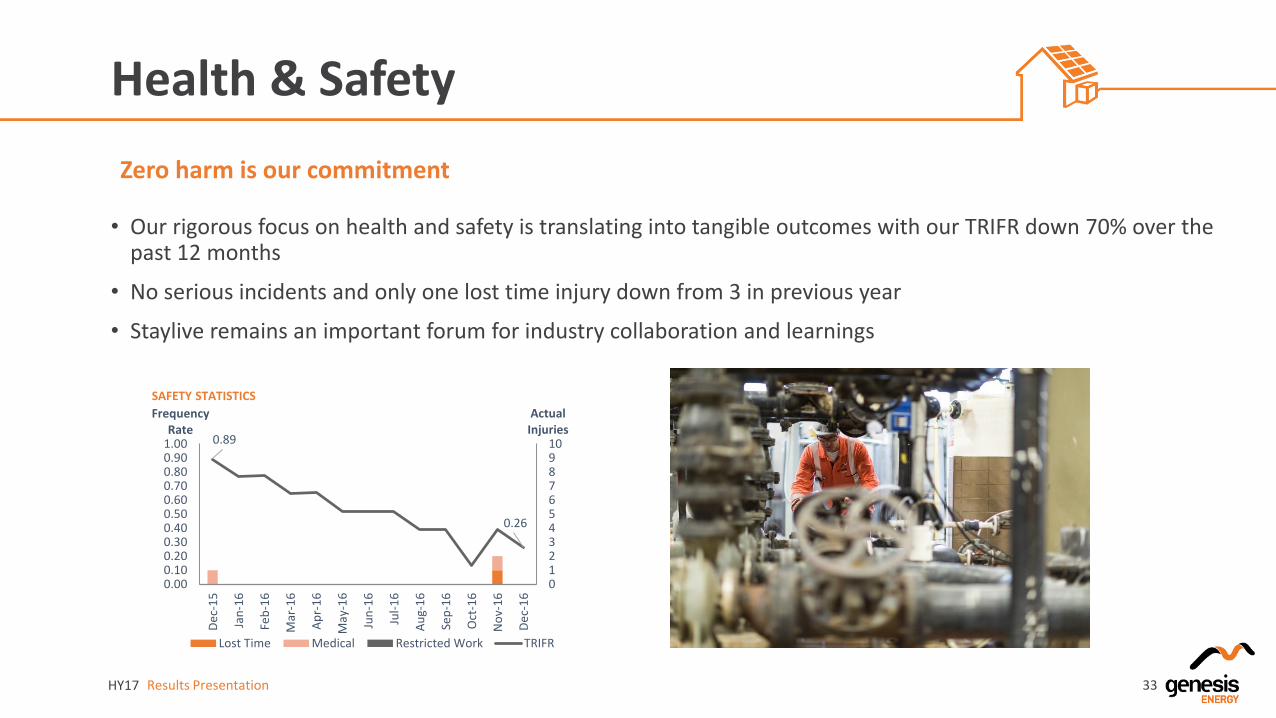
Health & Safety
• Our rigorous focus on health and safety is translating into tangible outcomes with our TRIFR down 70% over the past 12 months
• No serious incidents and only one lost time injury down from 3 in previous year
• Staylive remains an important forum for industry collaboration and learnings
Zero harm is our commitment
33
SAFETY STATISTICS
0.89
0.26
012345678910
0.000.100.200.300.400.500.600.700.800.901.00
De
c-1
5
Jan
-16
Feb
-16
Mar
-16
Ap
r-1
6
May
-16
Jun
-16
Jul-
16
Au
g-1
6
Sep
-16
Oct
-16
No
v-1
6
De
c-1
6
Actual Injuries
Frequency Rate
Lost Time Medical Restricted Work TRIFR

Outlook
Marc England
4
Chief Executive
____
HY17 Results Presentation
Outlook
• FY17 EBITDAF updated guidance range of $320 to $330 million including increased share of Kupe1
• Target earnings profile remains to deliver $400+ million of EBITDAF in FY21 (with a range of $375 - $425 million)
FY guidance range updated
35
1. Subject to any material events, significant one-off expenses or other unforeseen circumstances
HY17 Results Presentation
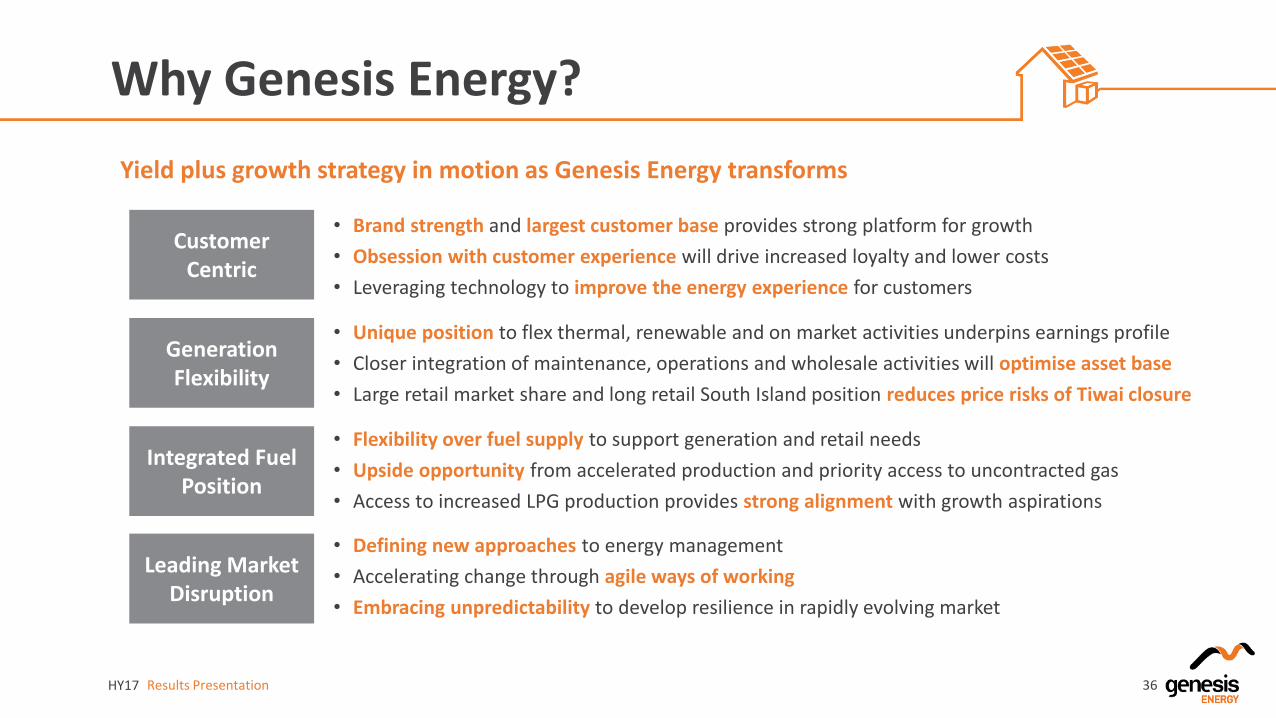
Why Genesis Energy?
Yield plus growth strategy in motion as Genesis Energy transforms
36
Customer Centric
Generation Flexibility
Integrated Fuel Position
Leading Market Disruption
• Brand strength and largest customer base provides strong platform for growth
• Obsession with customer experience will drive increased loyalty and lower costs
• Leveraging technology to improve the energy experience for customers
• Unique position to flex thermal, renewable and on market activities underpins earnings profile
• Closer integration of maintenance, operations and wholesale activities will optimise asset base
• Large retail market share and long retail South Island position reduces price risks of Tiwai closure
• Flexibility over fuel supply to support generation and retail needs
• Upside opportunity from accelerated production and priority access to uncontracted gas
• Access to increased LPG production provides strong alignment with growth aspirations
• Defining new approaches to energy management
• Accelerating change through agile ways of working
• Embracing unpredictability to develop resilience in rapidly evolving market

Supplementary Information

HY17 Results Presentation
Financial Statements
38
Balance Sheet HY17($m)
HY16($m)
Variance
Cash and Cash Equivalents 209.7 37.5
Other Current Assets 273.1 298.2
Non-Current Assets 3,383.6 3,097.5
Total Assets 3,866.4 3,433.2 12.6%
Total Borrowings 1,084.7 938.8
Other Liabilities 818.6 724.8
Total Equity 1,963.1 1,769.6 10.9%
Adjusted Net Debt 844.9 864.3 (2.2%)
Gearing 35.6% 32.8% 2.8%
EBITDAF Interest Cover 6.5 6.6 1.5%
Net Debt/EBITDAF 2.7 2.5 8.0%
Income Statement HY17($m)
HY16($m)
Variance
Revenue $965.3 $1,041.6 (7.3%)
Total Operating Expenses (809.6) (866.1)
EBITDAF 155.7 175.5 (11.3%)
Depreciation, Depletion & Amortisation (73.6) (73.1)
Impairment (0.8) 0.0
Fair Value Change 1.9 (21.0)
Other Gains (Losses) (1.6) 0.1
Earnings Before Interest & Tax 81.6 81.5 0.1%
Interest (28.7) (31.4)
Tax (15.5) (14.2)
Net Profit After Tax 37.4 35.9 4.2%
Earnings Per Share 3.74 3.59 4.2%
Stay in Business Capital Expenditure 16.8 15.7 7.0%
Free Cash Flow 94.7 114.2 (17.1%)
Dividends Per Share (cps) 82.0 82.0 Flat
Dividends Per Share 8.2 8.2 Flat
Dividends Declared as a % of FCF 93.5% 71.8% 21.7%
Cash Flow Summary HY17($m)
FY16($m)
Variance
Net Operating Cashflow 126.5 162.5
Net Investing Cashflow (29.8) (13.0)
Net Financing Cashflow 78.1 (133.0)
Net Increase (Decrease) in Cash 174.8 16.5 NA

HY17 Results Presentation
Reconciliation of EBITDAF to NPAT
39
Income Statement HY17($m)
HY16($m)
Variance
EBITDAF 155.7 175.5 (11.3%)
Depreciation, Depletion & Amortisation (73.6) (73.1)
Impairment of Non-Current Assets (0.8) 0.0
Change in Fair Value of Financial Instruments
1.9 (21.0)
Other Gains (Losses) (1.6) 0.1
Profit Before Net Finance Expense and Income Tax
81.6 81.5 0.1%
Finance Revenue 0.9 1.4
Finance Expense (29.6) (32.8)
Profit Before Income Tax 52.9 50.1 5.6%
Income Tax Expense (15.5) (14.2)
Net Profit After Tax 37.4 35.9 4.2%
• EBITDAF is a non-GAAP item but is used as a key metric by management to monitor performance at a business segment and group level
• Genesis Energy believes that reporting EBITDAF assists stakeholders and investors in understanding the Company’s operational performance
• In HY17 EBITDAF was down 11.3% on HY16
• HY Net Profit After Tax is up 4.2%
• Key variance in changes in fair value of financial instruments due to a movement in USPP

Thank You

HY17 Results Presentation
Disclaimer
41
This presentation has been prepared by Genesis Energy Limited (‘Genesis Energy’) for information purposes only. The information in this presentation is of a general nature and does not purport to be complete nor does it contain all the information required for an investor to evaluate an investment. This presentation may contain projections or forward-looking statements regarding a variety of items. Such forward-looking statements are based upon current expectations and involve risks and uncertainties. Actual results may differ materially from those stated in any forward looking statement based on a number of important factors and risks.
Although management may indicate and believe that the assumptions underlying the forward-looking statements are reasonable, any of the assumptions could prove inaccurate or incorrect and, therefore, there can be no assurance that the results contemplated in the forward looking statements will be realised. EBITDAF, underlying profit and free cash flow are non-GAAP (generally accepted accounting practice) measures. Information regarding the usefulness, calculation and reconciliation of these measures is provided in the supporting material. Furthermore, while all reasonable care has been taken in compiling this presentation, to the maximum extent permitted by law Genesis Energy accepts no responsibility for any errors or omissions and no representation is made as to the accuracy, completeness or reliability of the information. This presentation does not constitute investment advice