genome-wide association studies in economics and ... · association study (gwas) design enables the...
TRANSCRIPT
Genome-wide association studies in economicsand entrepreneurship research: promises and limitations
Philipp D. Koellinger • Matthijs J. H. M. van der Loos •
Patrick J. F. Groenen • A. Roy Thurik • Fernando Rivadeneira •
Frank J. A. van Rooij • Andre G. Uitterlinden • Albert Hofman
Accepted: 20 April 2010 / Published online: 13 May 2010
� The Author(s) 2010. This article is published with open access at Springerlink.com
Abstract The recently developed genome-wide
association study (GWAS) design enables the iden-
tification of genes specifically associated with eco-
nomic outcomes such as occupational and other
choices. This is a promising new approach for
economics research which we aim to apply to the
choice for entrepreneurship. However, due to multi-
ple testing issues, very large sample sizes are needed
to differentiate between true and false positives. For a
GWAS on entrepreneurship, we expect that a sample
size of at least 30,000 observations is required.
Keywords Genetics � Microeconomics �Entrepreneurship
JEL Classifications L26 � J24 � B40 � C10
1 Introduction
There are two popular views on what makes an
entrepreneur. The first is that anyone can learn the
necessary skills provided (s)he puts in enough time
P. D. Koellinger (&) � M. J. H. M. van der Loos �A. R. Thurik
Department of Applied Economics, Erasmus School
of Economics, Erasmus University Rotterdam,
P.O. Box 1738, 3000 DR Rotterdam, The Netherlands
e-mail: [email protected]
M. J. H. M. van der Loos
e-mail: [email protected]
A. R. Thurik
e-mail: [email protected]
P. J. F. Groenen
Econometric Institute, Erasmus School of Economics,
Erasmus University Rotterdam, P.O. Box 1738,
3000 DR Rotterdam, The Netherlands
e-mail: [email protected]
F. Rivadeneira � F. J. A. van Rooij �A. G. Uitterlinden � A. Hofman
Department of Epidemiology, Erasmus Medical Center,
P.O. Box 2040, 3000 CA Rotterdam, The Netherlands
e-mail: [email protected]
F. J. A. van Rooij
e-mail: [email protected]
A. G. Uitterlinden
e-mail: [email protected]
A. Hofman
e-mail: [email protected]
F. Rivadeneira � A. G. Uitterlinden
Department of Internal Medicine, Erasmus Medical
Center, P.O. Box 2040, 3000 CA Rotterdam,
The Netherlands
123
Small Bus Econ (2010) 35:1–18
DOI 10.1007/s11187-010-9286-3

and effort. The second is that people are either born
with the right personality and skills or they are not,
and there is not much that one can do about it.
Obviously, which of these two stories is true has far-
reaching implications for individual behavior and
economic policies. As we discuss below, there is
increasing evidence that inherited qualities play a role
in occupational choice with recent scientific advances
showing different pathways through which genes can
influence entrepreneurial behavior. However, in con-
trast to popular views, a genetic influence does not
imply any kind of determinism, irrelevance of the
environment, or of free will, as we discuss later.
The recent scientific breakthroughs that make it
possible to discover the genetic basis of human
behavior and traits are linked to the results of the
Human Genome (Collins et al. 2003) and HapMap
projects (The International HapMap Consortium
2005). These projects decoded the human genome
and identified those genetic regions where humans
frequently exhibit differences, which is only a very
small part of the entire genome. This resulted in new
technological developments that allow the genotyp-
ing1 of hundreds of thousands of markers in large
samples at reasonable costs. In particular, a new
generation of studies of variations across the entire
human genome, called genome-wide association
studies (GWAS), have launched an unprecedented
era of genetic discoveries, already resulting in more
than 500 published studies, identifying common
variants associated with numerous complex quantita-
tive traits and diseases (Hindorff et al. 2009). GWASs
focus on so-called single nucleotide polymorphisms
(SNPs, pronounced ‘snips’), base pairs that differ
between members of a species, which cover a high
proportion of the common genetic variation within
the genome. This study design provides insights into
biological processes and improves our understanding
of the biological origins of differences among human
beings. This is an important step toward putting the
old debate about whether entrepreneurs are born or
made through a rigorous scientific test focusing on
the genes. Furthermore, this study design is also
applicable to various other outcomes of economic
relevance, such as educational attainment, risk pref-
erences, and income.
From an economics perspective, the idea that
genes influence behavior seems far-fetched at first
glance. Typically economists focus on understanding
the role of the environment in shaping human
behavior, the interactions of people, and the conse-
quences of these interactions. Economists sometimes
find it convenient to study the behavior of ‘represen-
tative agents’ (Kirman 1992; Hartley 1996). How-
ever, there is ample scope for individuality in
economic models, which is typically formalized in
the form of preferences2 or productivity values3 that
depend on personal characteristics. Such individual
differences are likely to have important economic
implications. For example, we know that occupa-
tional choice depends on risk and uncertainty pref-
erences (Knight 1921; Kihlstrom and Laffont 1979;
Iyigun and Owen 1998), as well as on non-monetary
preference for independence (Benz and Frey 2008;
Block and Koellinger 2009), educational attainment
(Evans and Leighton 1989), skills (Jovanovic 1994;
Lazear 2004, 2005; Laussel and Le Breton 1995;
Roessler and Koellinger 2009), gender (Grilo and
Thurik 2008) and a tendency to be overconfident and
overly optimistic (Camerer and Lovallo 1999; Koel-
linger et al. 2007). All these individual attributes are
candidates for an indirect genetic influence on
occupational choice.4
In fact, there is growing empirical evidence from
studies of twins that individual characteristics, which
can affect the tendency to become an entrepreneur,
are indeed at least partially due to genetic differences.
Examples include preferences for risk seeking
(Cesarini et al. 2009a), altruism in dictator games
(Knafo et al. 2008; Israel et al. 2008), job satisfaction
1 Genotyping refers to determining the genotype of an
individual by the use of biological assays which are also
called DNA microarrays. These microarrays integrate several
laboratory functions on a single chip that is suitable for high-
throughput screening methods.
2 In economics, the term preference typically refers to
theoretical assumptions about the rank order between different
choices according to the degree of desirability to an individual.3 For example, the labor productivity of a person measures
output per labor-hour, given a particular production technology
and capital input. Differences in labor productivity are often
attributed to personal characteristics such as education or
experience.4 Other attributes of an environmental nature such as (the
threat of) unemployment (Thurik et al. 2008) and the
institutional environment (Freytag and Thurik 2007) may play
moderating roles.
2 P. D. Koellinger et al.
123
(Arvey et al. 1989), vocational interests (Betsworth
et al. 1994), work values (Keller et al. 1992), novelty
seeking (Ebstein et al. 1996; Kluger et al. 2002),
gambling (Perez de Castro et al. 1997; Comings et al.
1996), general cognitive ability and intelligence
(Deary et al. 2006; Plomin 1999; Plomin and Kosslyn
2001; Plomin and Spinath 2004), educational attain-
ment (Miller et al. 2001), and overconfidence (Cesa-
rini et al. 2009b).
In addition, empirical evidence suggests that
entrepreneurship tends to run in families. Lentz and
Laband (1990) observe that around half of all US self-
employed proprietors are second-generation business
owners. Evans and Leighton (1989) find that the
likelihood of self-employment increases if the father
is a manager, and decreases if the father is unskilled.
Furthermore, Dunn and Holtz-Eakin (2000) find that
parental self-employment both increases the fraction
of time that offspring spend in self-employment and
reduces the age at which they enter. Colombier and
Masclet (2008) find intergenerational correlation for
self-employment in France. Andersson and Hammar-
stedt (2010) show that having both a self-employed
father and a self-employed grandfather positively
effects self-employment propensities for third-gener-
ation male immigrants in Sweden. Finally, Van der
Zwan et al. (2010) show that people with self-
employed parents climb the ‘entrepreneurial ladder’
more quickly than those without such parents. It
seems likely that self-employed parents transfer
relevant skills and familiarity with entrepreneurial
behavior to children. But it could also be that inherited
characteristics explain the observed intergenerational
effects. Indeed, several comparative twin studies
suggest a potential genetic influence on the propensity
to become self-employed (Nicolaou et al. 2008a, b;
Nicolaou and Shane 2009; Zhang et al. 2009).
In late 2007, these thoughts and findings encour-
aged us to start investigating the human genome to
identify genetic causes of entrepreneurial behavior
using GWAS. We assembled a multidisciplinary
research group of economists and genetic epidemiol-
ogists, establishing the Gentrepreneur Consortium
(Van der Loos et al. 2010). To the best of our
knowledge, this is the earliest attempt to apply
GWAS to an economic outcome of a relatively
general, and hence complex, nature. We are aware
that the entrepreneurial choice is possibly a very
complex one to explain because entrepreneurship is a
multidimensional phenomenon about which there is
no general agreement. Not only have psychology,
economics, anthropology, and business studies
widely different views but also the more popular
view of what entrepreneurship is, seems to vary with
time and space (Bygrave and Hofer 1991; Wennekers
and Thurik 1999; Verheul et al. 2005). In the present
study we measure entrepreneurial activity with self-
employment which is an established and widely used
measure.
Our GWAS uses data from the Rotterdam Study
(Hofman et al. 2009). The Rotterdam Study is a
prospective cohort study, hosted at the Erasmus
University Rotterdam Medical Center. The majority
of the genotyped individuals in the Rotterdam Study
provided data on their occupational status, allowing us
to study entrepreneurial behavior by looking at self-
employment. The present article is inspired by our
ongoing work with this data and employs simulations
to illustrate important identification issues in GWAS
in general. Our simulations mimic several character-
istics of the Rotterdam Study, such as sample size
(N * 10,000), the prevalence of self-employment
(*10% of the sample) and the number of SNPs
(*550,000).
We presented preliminary results using RS-I at the
Behavior Genetics Association June 2008 conference
in Louisville, Kentucky (Groenen et al. 2008). Since
then our work has focused on replicating results using
independent samples and we have now embedded our
effort to assemble a working group (Gentrepreneur)
within the Cohorts for Heart and Aging Research in
Genomic Epidemiology (CHARGE) consortium
(Psaty et al. 2009). As we discuss below, replication
is crucial for this type of research and our efforts to
replicate the findings from our discovery cohort are
ongoing.
In this article, we describe the GWAS design and
how it can be applied to study economic outcomes.
We illustrate the statistical multiple testing problem
that arises in this context when using simulation
studies that closely mimic a GWAS setting on
entrepreneurship. Following current best practice in
genetics research, we discuss how strict confidence
levels in combination with large sample sizes are
required to identify genes that are truly associated
with entrepreneurship or other economic outcomes.
Furthermore, the interpretation of findings from
GWAS on economic outcomes is not straightforward
Genome-wide association studies 3
123

and this article provides several guidelines in this
regard.
We begin by describing some basic genetic
concepts and the principles underlying genome-wide
association studies (GWAS) in Sect. 2. From the set-
up of GWAS, the multiple testing problem arises,
which we describe in detail and illustrate with a series
of simulations in Sect. 3. The interpretation of results
from GWAS is discussed in Sect. 4. Section 5
concludes and outlines some possible future potential
of GWAS for economics and entrepreneurship
research.
2 Basic genetic concepts and genome-wide
association studies
The human genome comprises all genetic information
in human cells and consists of 23 chromosomal pairs
(46 in total); half is inherited from the mother and half
from the father. These chromosomes ‘package’ DNA
molecules encode the genetic information in a linear
sequence of chemical bases along two DNA strands. A
DNA strand is a polymer of nucleotides. Each
nucleotide is a building block consisting out of a
phosphate, a sugar, and a base. The base in a nucleotide
can be Adenine (A), Cytosine (C), Guanine (G), or
Thymine (T); thus there are four distinct nucleotides.
DNA is structured as a double helix in which two DNA
strands are held together by weak hydrogen bonds to
form a DNA duplex. Hydrogen bonding occurs
between the bases of opposing nucleotides along the
two strands: Adenine always binds to Thymine and
Cytosine always binds to Guanine. Consequently, two
DNA strands of a DNA duplex are said to have
complementary sequences and the sequence of one
DNA strand can easily be inferred if the DNA
sequence of its complementary strand is already
known. It is usual, therefore, to describe a DNA
sequence by writing the sequence of bases for only one
strand. For example, one individual may have inher-
ited the AA nucleotides for one particular position on a
pair of chromosomes (i.e. a genotype). This would
imply the individual inherited an A base from the
paternal chromosome and an A base from the maternal
chromosome. Another individual may have inherited
AG nucleotides at the same position, a different base
from each of the two parents, while a third may have
inherited both GG nucleotides from each parent.
Alternative bases in a nucleotide at the same physical
locus are called alleles. A DNA sequence on one
position of the genome that exhibits at least 1%
variation between members of a species is called a
Single Nucleotide Polymorphism (SNP). The minor
allele frequency (MAF) refers to the frequency of the
less common allele of a SNP in a population. People
having two copies of the same allele are said to be
homozygous for this allele. On the other hand,
individuals having two different alleles are called
heterozygous.
Almost all human DNA—99.9% of the three
billion nucleotides that make up the human gen-
ome—is identical from person to person. The
remaining 0.1% of the genome varies by SNPs (and
other types of genomic variation), which is what
makes humans different from each other. The total
number and locations of SNP markers that need to be
genotyped in order to detect an association between
common genetic variants and an outcome of interest
(also know as the ‘phenotype’ of an individual) was
identified by the HapMap project (The International
HapMap Consortium 2005). Facilitated by the results
of the HapMap project, high throughput array-based
technologies for whole-genome SNP analysis were
recently developed.
GWAS is facilitated by a phenomenon called
linkage disequilibrium (LD). LD refers to the non-
random way SNPs are inherited together, i.e. many
SNPs on the human genome are systematically
correlated. SNPs in perfect linkage disequilibrium
are inherited together, while SNPs in perfect linkage
equilibrium are inherited randomly. LD makes it
possible to discover which SNP is causing an
outcome even if the SNP is not genotyped. In this
case SNPs that are genotyped and in LD with the
causal SNP are associated with the outcome. Thus,
when a significant association is found between a
SNP and an outcome, the association is not neces-
sarily causal. However, the known systematic corre-
lations of SNPs may still enable researchers to
identify the causal gene by looking up SNPs that
are in LD to the candidate loci.5 LD patterns in the
human genome have been charted by the HapMap
project and are used to reduce the number of SNPs
5 In practice, the identification of the true causal gene is
limited by the fact that the biological function of most SNPs is
still not well understood.
4 P. D. Koellinger et al.
123
that need to be included in an assay to cover a broad
spectrum of the genome.
Typically, genotyping is currently done with
550,000 SNP arrays that, after data cleaning, tend
to deliver information about the specific alleles for
around 500,000 SNPs that are available for statistical
analysis. Although this already gives a high resolu-
tion image of the human genome, next generation
microarrays will allow researchers to assay 2-12
million markers per sample, including comprehensive
coverage of both common and rare variants.
The basic GWAS design is to associate an outcome
of interest, such as the presence of a disease, an IQ
score, or the employment status of an individual
(called ‘phenotype’), with SNPs on the chip, usually
by carrying out a bivariate statistical test for each
SNP. Hence, GWAS is an exploratory method that
does not rely on prior hypotheses about expected
relationships. For a binary outcome like entrepreneur-
ship (with y = 1 meaning the individual is an
entrepreneur, and y = 0 otherwise), the bivariate test
performed for each SNP typically consists of a
Pearson’s chi-square test for independence within a
two-by-two contingency table. The columns in this
table indicate the status of the outcome, while the
rows indicate one of two alleles for a certain SNP. The
table is constructed by collapsing a three-by-two table
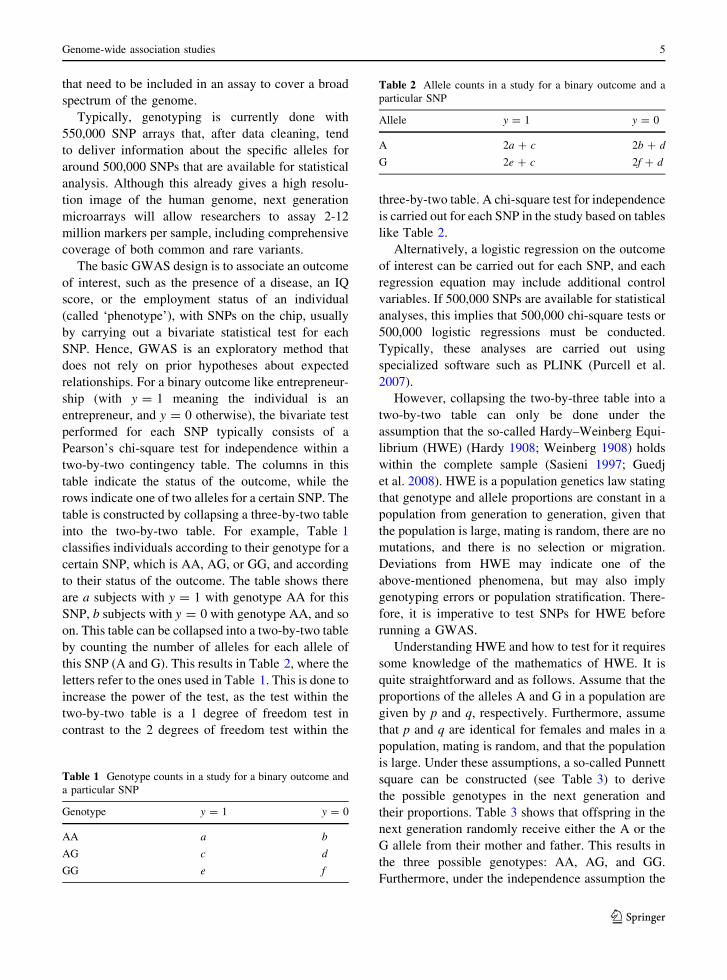
into the two-by-two table. For example, Table 1
classifies individuals according to their genotype for a
certain SNP, which is AA, AG, or GG, and according
to their status of the outcome. The table shows there
are a subjects with y = 1 with genotype AA for this
SNP, b subjects with y = 0 with genotype AA, and so
on. This table can be collapsed into a two-by-two table
by counting the number of alleles for each allele of
this SNP (A and G). This results in Table 2, where the
letters refer to the ones used in Table 1. This is done to
increase the power of the test, as the test within the
two-by-two table is a 1 degree of freedom test in
contrast to the 2 degrees of freedom test within the
three-by-two table. A chi-square test for independence
is carried out for each SNP in the study based on tables
like Table 2.
Alternatively, a logistic regression on the outcome
of interest can be carried out for each SNP, and each
regression equation may include additional control
variables. If 500,000 SNPs are available for statistical
analyses, this implies that 500,000 chi-square tests or
500,000 logistic regressions must be conducted.
Typically, these analyses are carried out using
specialized software such as PLINK (Purcell et al.
2007).
However, collapsing the two-by-three table into a
two-by-two table can only be done under the
assumption that the so-called Hardy–Weinberg Equi-
librium (HWE) (Hardy 1908; Weinberg 1908) holds
within the complete sample (Sasieni 1997; Guedj
et al. 2008). HWE is a population genetics law stating
that genotype and allele proportions are constant in a
population from generation to generation, given that
the population is large, mating is random, there are no
mutations, and there is no selection or migration.
Deviations from HWE may indicate one of the
above-mentioned phenomena, but may also imply
genotyping errors or population stratification. There-
fore, it is imperative to test SNPs for HWE before
running a GWAS.
Understanding HWE and how to test for it requires
some knowledge of the mathematics of HWE. It is
quite straightforward and as follows. Assume that the
proportions of the alleles A and G in a population are
given by p and q, respectively. Furthermore, assume
that p and q are identical for females and males in a
population, mating is random, and that the population
is large. Under these assumptions, a so-called Punnett
square can be constructed (see Table 3) to derive
the possible genotypes in the next generation and
their proportions. Table 3 shows that offspring in the
next generation randomly receive either the A or the
G allele from their mother and father. This results in
the three possible genotypes: AA, AG, and GG.
Furthermore, under the independence assumption the
Table 1 Genotype counts in a study for a binary outcome and
a particular SNP
Genotype y = 1 y = 0
AA a b
AG c d
GG e f
Table 2 Allele counts in a study for a binary outcome and a
particular SNP
Allele y = 1 y = 0
A 2a ? c 2b ? d
G 2e ? c 2f ? d
Genome-wide association studies 5
123
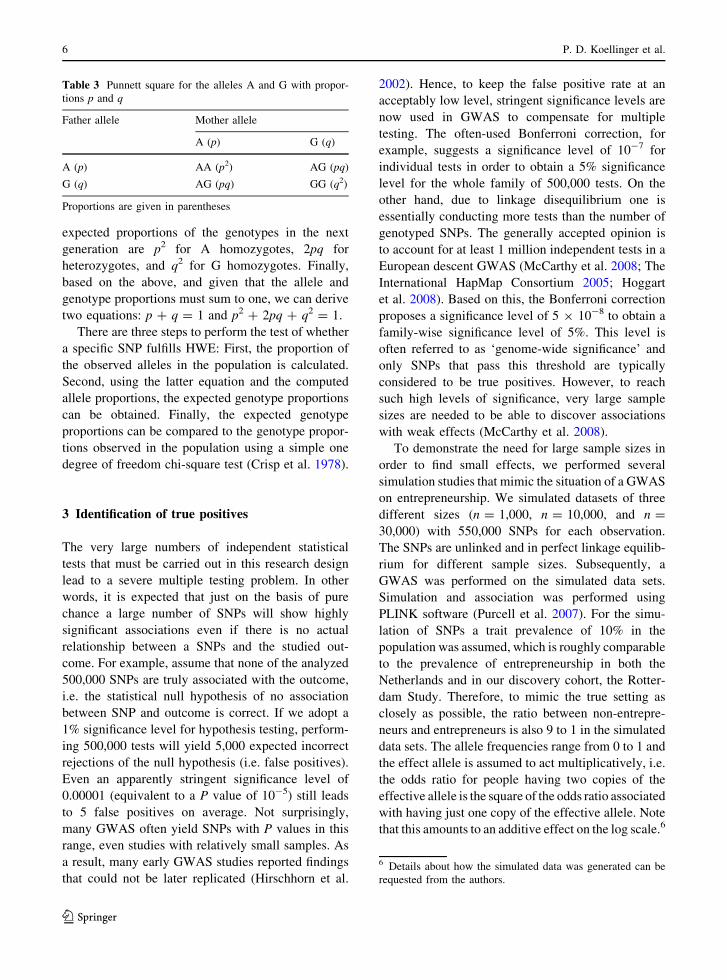
expected proportions of the genotypes in the next
generation are p2 for A homozygotes, 2pq for
heterozygotes, and q2 for G homozygotes. Finally,
based on the above, and given that the allele and
genotype proportions must sum to one, we can derive
two equations: p ? q = 1 and p2 ? 2pq ? q2 = 1.
There are three steps to perform the test of whether
a specific SNP fulfills HWE: First, the proportion of
the observed alleles in the population is calculated.
Second, using the latter equation and the computed
allele proportions, the expected genotype proportions
can be obtained. Finally, the expected genotype
proportions can be compared to the genotype propor-
tions observed in the population using a simple one
degree of freedom chi-square test (Crisp et al. 1978).
3 Identification of true positives
The very large numbers of independent statistical
tests that must be carried out in this research design
lead to a severe multiple testing problem. In other
words, it is expected that just on the basis of pure
chance a large number of SNPs will show highly
significant associations even if there is no actual
relationship between a SNPs and the studied out-
come. For example, assume that none of the analyzed
500,000 SNPs are truly associated with the outcome,
i.e. the statistical null hypothesis of no association
between SNP and outcome is correct. If we adopt a
1% significance level for hypothesis testing, perform-
ing 500,000 tests will yield 5,000 expected incorrect
rejections of the null hypothesis (i.e. false positives).
Even an apparently stringent significance level of
0.00001 (equivalent to a P value of 10-5) still leads
to 5 false positives on average. Not surprisingly,
many GWAS often yield SNPs with P values in this
range, even studies with relatively small samples. As
a result, many early GWAS studies reported findings
that could not be later replicated (Hirschhorn et al.
2002). Hence, to keep the false positive rate at an
acceptably low level, stringent significance levels are
now used in GWAS to compensate for multiple
testing. The often-used Bonferroni correction, for
example, suggests a significance level of 10-7 for
individual tests in order to obtain a 5% significance
level for the whole family of 500,000 tests. On the
other hand, due to linkage disequilibrium one is
essentially conducting more tests than the number of
genotyped SNPs. The generally accepted opinion is
to account for at least 1 million independent tests in a
European descent GWAS (McCarthy et al. 2008; The
International HapMap Consortium 2005; Hoggart
et al. 2008). Based on this, the Bonferroni correction
proposes a significance level of 5 9 10-8 to obtain a
family-wise significance level of 5%. This level is
often referred to as ‘genome-wide significance’ and
only SNPs that pass this threshold are typically
considered to be true positives. However, to reach
such high levels of significance, very large sample
sizes are needed to be able to discover associations
with weak effects (McCarthy et al. 2008).
To demonstrate the need for large sample sizes in
order to find small effects, we performed several
simulation studies that mimic the situation of a GWAS
on entrepreneurship. We simulated datasets of three
different sizes (n = 1,000, n = 10,000, and n =
30,000) with 550,000 SNPs for each observation.
The SNPs are unlinked and in perfect linkage equilib-
rium for different sample sizes. Subsequently, a
GWAS was performed on the simulated data sets.
Simulation and association was performed using
PLINK software (Purcell et al. 2007). For the simu-
lation of SNPs a trait prevalence of 10% in the
population was assumed, which is roughly comparable
to the prevalence of entrepreneurship in both the
Netherlands and in our discovery cohort, the Rotter-
dam Study. Therefore, to mimic the true setting as
closely as possible, the ratio between non-entrepre-
neurs and entrepreneurs is also 9 to 1 in the simulated
data sets. The allele frequencies range from 0 to 1 and
the effect allele is assumed to act multiplicatively, i.e.
the odds ratio for people having two copies of the
effective allele is the square of the odds ratio associated
with having just one copy of the effective allele. Note
that this amounts to an additive effect on the log scale.6
Table 3 Punnett square for the alleles A and G with propor-
tions p and q
Father allele Mother allele
A (p) G (q)
A (p) AA (p2) AG (pq)
G (q) AG (pq) GG (q2)
Proportions are given in parentheses
6 Details about how the simulated data was generated can be
requested from the authors.
6 P. D. Koellinger et al.
123
Before the association analysis, SNPs that failed a
test of Hardy–Weinberg equilibrium (HWE) at the
10-6 level in subjects with y = 0 were dropped. In
the data sets for n = 10,000 and n = 30,000 this
resulted in 1 and 18 SNPs, respectively, being
dropped. No SNPs were dropped due to HWE testing
in the other data set. After that, alleles with a minor
allele frequency (MAF) smaller than 5% were also
filtered out. For all three data sets approximately
55,000 SNPs failed the MAF filter and were dropped
from the analysis. As said, testing for HWE in
subjects with y = 0 is necessary for the chi-square
test within a two-by-two table to be valid. SNPs in the
simulation study can be out of HWE because they are
generated randomly not taking HWE into account,
whereas in practice, in absence of true association,
deviation from HWE proportions will very likely
reflect genotyping errors.
Of the 550,000 SNPs, five sets of each thirty SNPs
were simulated with a known association with the
trait with odds ratios of 1.2, 1.5, 1.7, 2 and 3. The
remaining SNPs (549,850 in total) were simulated
with an odds ratio of exactly one and, consequently,
are not associated with the trait. Finally, the analysis
was performed using chi-square tests for indepen-
dence in a two-by-two table for each SNP, as
described above.
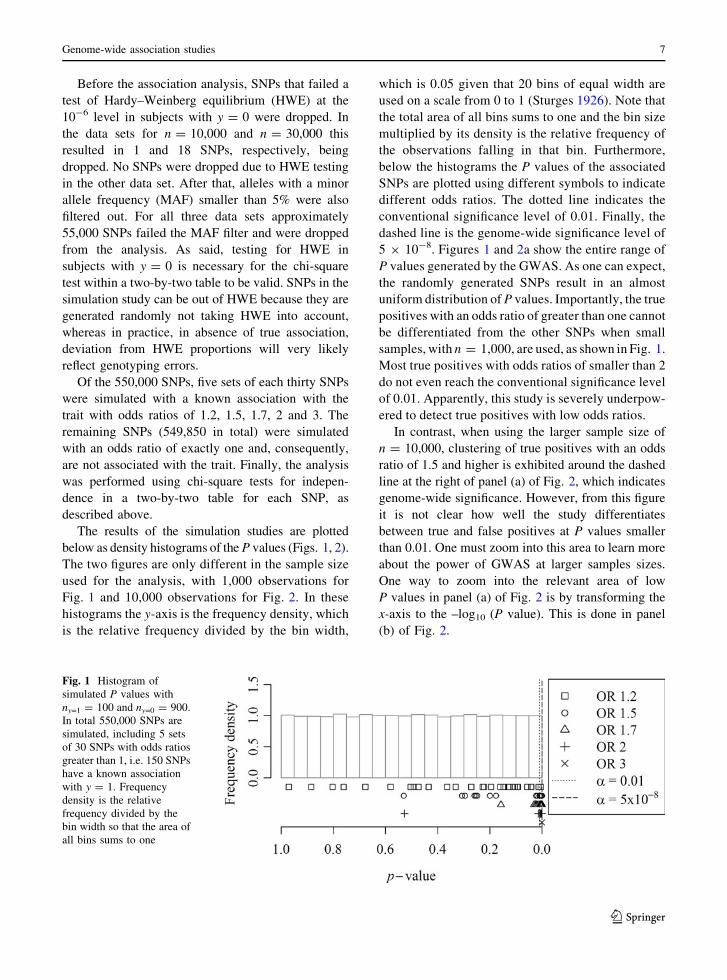
The results of the simulation studies are plotted
below as density histograms of the P values (Figs. 1, 2).
The two figures are only different in the sample size
used for the analysis, with 1,000 observations for
Fig. 1 and 10,000 observations for Fig. 2. In these
histograms the y-axis is the frequency density, which
is the relative frequency divided by the bin width,
which is 0.05 given that 20 bins of equal width are
used on a scale from 0 to 1 (Sturges 1926). Note that
the total area of all bins sums to one and the bin size
multiplied by its density is the relative frequency of
the observations falling in that bin. Furthermore,
below the histograms the P values of the associated
SNPs are plotted using different symbols to indicate
different odds ratios. The dotted line indicates the
conventional significance level of 0.01. Finally, the
dashed line is the genome-wide significance level of
5 9 10-8. Figures 1 and 2a show the entire range of
P values generated by the GWAS. As one can expect,
the randomly generated SNPs result in an almost
uniform distribution of P values. Importantly, the true
positives with an odds ratio of greater than one cannot
be differentiated from the other SNPs when small
samples, with n = 1,000, are used, as shown in Fig. 1.
Most true positives with odds ratios of smaller than 2
do not even reach the conventional significance level
of 0.01. Apparently, this study is severely underpow-
ered to detect true positives with low odds ratios.
In contrast, when using the larger sample size of
n = 10,000, clustering of true positives with an odds
ratio of 1.5 and higher is exhibited around the dashed
line at the right of panel (a) of Fig. 2, which indicates
genome-wide significance. However, from this figure
it is not clear how well the study differentiates
between true and false positives at P values smaller
than 0.01. One must zoom into this area to learn more
about the power of GWAS at larger samples sizes.
One way to zoom into the relevant area of low
P values in panel (a) of Fig. 2 is by transforming the
x-axis to the –log10 (P value). This is done in panel
(b) of Fig. 2.
Fig. 1 Histogram of
simulated P values with
ny=1 = 100 and ny=0 = 900.
In total 550,000 SNPs are
simulated, including 5 sets
of 30 SNPs with odds ratios
greater than 1, i.e. 150 SNPs
have a known association
with y = 1. Frequency
density is the relative
frequency divided by the
bin width so that the area of
all bins sums to one
Genome-wide association studies 7
123

Another way to better visualize false and true
positives is to plot the different odds ratios against the
P values using a –log10 scale on the x-axis (Fig. 3a–c).
These plots make it possible to see how associated
SNPs compare to un-associated SNPs at different
sample sizes and odds ratios. Again, the conventional
confidence level of 0.01 is indicated by a dotted line
and genome-wide significance at 5 9 10-8 with a
dashed line.
Figure 3a plots the results of the GWAS with a
sample size of n = 1,000, similar to Fig. 1. Appar-
ently it is impossible to differentiate between false
positives and true positives with an odds ratio less
than 3 with this sample size, while true positives with
an odds ratio greater than or equal to 3 will probably
be detected. In addition, most true positives with an
odds ratio smaller than 1.7 do not even reach the
conventional significance level of 0.01 and will
remain undetected. A GWAS on entrepreneurship
with a sample size of n = 1,000 is severely under-
powered to detect true positives with low odds ratios.
A tenfold increase in sample to n = 10,000
resolves these problems for most SNPs with an odds
ratio of 1.5 or higher, as shown in Fig. 3b. However,
the low odds ratios of 1.2 still cannot be differentiated
from false positives because they are unlikely to
reach the threshold level of genome-wide signifi-
cance. Furthermore, we see that the genome-wide
significance threshold is rather conservative: No false
positives cross this threshold, but a few true positives
with odds ratios of 1.4 and higher fall slightly below
the cut-off significance level. Hence, these SNPs will
be reported as false negatives although they have
very low P values between 10-6 and 5 9 10-8.
Figure 3c repeats the same exercise with a sample
size of n = 30,000. This time, all SNPs with an odds
ratio of 1.5 or higher are correctly identified. Also, a
majority of SNPs with an odds ratio of 1.2 are
detected and can be differentiated from ineffective
SNPs.
In addition to the effect size (odds ratio) of
the effective allele, other factors also influence the
power of genetic association studies, such as the
chosen type 1 error, the minor allele frequency
(MAF), the linkage disequilibrium of the marker, and
the true-associated variant. There are also confound-
ing factors such as population structure and geogra-
phy, misclassification errors, and selection biases
Fig. 2 Histograms of
simulated P values with
ny=1 = 1,000 and
ny=0 = 9,000. In total
550,000 SNPs are
simulated, including 5 sets
of 30 SNPs with odds ratios
greater than 1, i.e. 150 SNPs
have a known association
with y = 1. Frequency
density is the relative
frequency divided by the
bin width so that the area of
all bins sums to one. Panels
a and b show the same data,
except that in panel b the xaxis is transformed to the
–log10 scale
8 P. D. Koellinger et al.
123

(Wang et al. 2005). Based on the genetic power
calculator by Purcell et al. (2003), Fig. 4 illustrates
the joint influence of MAF and odds ratios on the
required sample size that is needed to detect true
positives in a sample with a 10% share of individuals
who exhibit y = 1, again closely matching the typical
set-up of a GWAS on entrepreneurship. For example,
with a MAF of 20% and an odds ratio of 1.3, the
figure shows that a sample of approximately
n = 15,000 is needed to have an 80% probability of
detecting a true association. It is obvious that the
sample size required to detect true positives can
easily become enormous if the effective minor allele
has a frequency of less than 0.2 and if the odds ratio
is smaller than 1.3. Unfortunately, there is no way of
ruling out that most or even all true positives lie in
this range of parameters, ex ante.
How likely is it that the genetic factors associated
with economic behavior such as entrepreneurship will
have small odds ratios? Medicine has already
discovered many genetic disorders that are complex,
multifactorial, or polygenic; disorders likely to be
associated with multiple genes in combination with
lifestyle and environmental factors. Some examples
of such genetically complex diseases identified under
GWAS on are listed in Table 4. Frequently, weak
effects of single loci are found with odds ratios that
are in the range of, or smaller than, 1.2 (e.g.
Alzheimer’s disease, bipolar disorder, breast cancer,
lung cancer, multiple sclerosis, and type 2 diabetes).
If these genetically complex diseases are any guide-
line, we should expect that the SNPs associated with
entrepreneurship and other complex behaviors will
also have weak effects.
This demonstrates that very large sample sizes are
needed to find small effects. Not only are such large
genotyped samples very costly to obtain, but most
datasets of genotyped cohorts that are currently
available are not nearly large enough for this purpose.
At this point in time, the best available solution lies in
Fig. 3 P values versus
odds ratios for three
different sample sizes.
Panel a ny=1 = 100 and
ny=0 = 900, panel bny=1 = 1,000 and
ny=0 = 9,000, and panel cny=1 = 3,000 and
ny=0 = 27,000. For each
panel 550,000 SNPs are
simulated, including 30
SNPs with odds ratios
greater than 1, i.e. 150 SNPs
have a known association
with y = 1. Some SNPs
with high odds ratios
achieved P values smaller
than 10-160 and are
therefore not shown
Genome-wide association studies 9
123

the meta-analysis of several independent cohorts. In
this study design, a consortium of different cohorts is
formed that includes genotyped individuals and
sufficient information on the outcome of interest
such as the presence of a disease or an economic
outcome like self-employment or educational attain-
ment. Within the consortium, independent GWAS are
performed on each sample, following harmonized
standards for the phenotype definition, SNP filtering,
and model specification. The results of each GWAS
are then meta-analyzed using software such as
Metal.7
Given the typical sample size of genotyped cohorts
used in medical research, often more than five large
independent cohorts must be included for a meta-
analysis to reach sufficient statistical power. This
implies that setting up and managing a consortium
requires substantial time investments and a long-term
commitment to the research project before publish-
able findings become available. An additional chal-
lenge is that any two GWASs will typically use
overlapping but non-identical SNP maps due to the
variety of genotyping technologies available. Thus,
not every SNP is genotyped in every study, but one
still wants to obtain a measure of statistical signif-
icance for each individual SNP, taking into account
all evidence (‘direct’ and ‘indirect’) from all studies.
The typical strategy in such cases is to impute
genotypes for all ‘missing’ SNPs in all cohorts, and
carrying out the analysis as if the imputed data were
observed. This is possible because the HapMap
project provides independent samples of haplotypes8
that can be used as reference to impute missing
alleles in a study using software such as MACH (Li
and Abecasis 2006) or IMPUTE (Marchini et al.
2007). The resulting imputed samples often have
more than 2 million SNPs, which decreases the power
of the analysis even further and in principal requires
the use of even stricter confidence levels to avoid
false positive according to the Bonferroni correction
(4 9 10-9 if 2 million tests are carried out and a
significance level of 1% is desired for the entire
Fig. 4 Effects of allele
frequency and allelic odds
ratio on sample-size
requirements. Numbers
shown are for a statistical
power of 80% for a chi-
square test within a two-by-
two table at a significance
level of P value \5 9 10-8
for a sample with 10% of
y = 1
7 http://www.sph.umich.edu/csg/abecasis/metal/index.html.
8 A haplotype is the specific combination of alleles at several
loci on a single chromosome that are inherited together.
10 P. D. Koellinger et al.
123

family of tests). Nevertheless, there are several
degrees of correlation (linkage disequilibrium)
between markers resulting in the use of a significance
threshold of 5 9 10-8 which takes into account the
number of independent common variants (tests) in the
genome.
Hence, the replication and meta-analysis of several
samples in one study is often necessary to identify
small genetic effects. In addition to addressing the
multiple testing problem, the meta-analysis study
design has a secondary effect that may be either
desirable or undesirable from the point of view of an
economist interested in genetic causes of behavior:
meta-analysis has a bias for identifying loci that have
a similar association with economic behavior in
different environments. This is because the cohorts
included in a meta-analysis are unlikely to be
collected from identical geographic, economic and
cultural settings. For example, to conduct a meta-
analysis on entrepreneurship it is necessary to include
cohorts from various regions since no single homog-
enous region is likely to have a sufficient number of
genotyped individuals available. In the Gentrepreneur
Consortium we are currently running (Van der Loos
et al. 2010), cohorts from the Netherlands, the United
States, Great Britain, Germany, and Iceland are
included. This study design tends to suppress alleles
that are effective in only one country, but ineffective
in any of the other countries. This is desirable if the
research objective is to identify genetic factors that
are characteristic of entrepreneurs across different
economic and cultural environments. However, if the
objective is to identify and to compare different
genetic determinants of entrepreneurship in different
environments, very large samples in each country
will be needed that allow the identification of true
positives, with or without the application of meta-
analysis. At this point of time, this will only be
possible for very few countries, if at all.
One final factor aggravating the need for large
samples is that one cannot assume that the economic
behavior of men and women are triggered by the same
SNPs. For example, in an empirical study on the
correlates of nascent entrepreneurship Wagner (2007)
demonstrates that men and women cannot be pooled
in one sample because the estimated coefficients of
the unpooled samples differ significantly from each
other, in particular with respect to the effect of fear of
failure. Grilo et al. (2007) present similar results using
the concept of the entrepreneurial ladder. Arguably,
men and women face different demands and con-
straints when making decisions, whether about edu-
cation, the formal job market, the amount of time to
invest in money earning activities, and whether to
choose self-employment or a wage job (Cowling and
Taylor 2001; Verheul et al. 2009). If men and women
face different environmental circumstances that
require different skills and attitudes to cope with to
achieve a particular economic outcome, the same
genes would not necessarily be linked to this
economic outcome. An example is entrepreneurship
because both genders may face different motivations
and environmental constraints in their occupational
choice, which may lead to different genes being
Table 4 Sample of results from GWAS studies on genetically complex traits
Trait/disease y = 1 y = 0 Sample
size
Lowest
overall
odds ratioa
Associated
P value
Highest
overall
odds ratioa
Associated
P value
Reference
Alzheimer’s disease 5,964 10,188 16,152 1.16 10-9 2.53 2 9 10-157 Harold et al. (2009)
Bipolar disorder 1,868 2,938 4,806 1.03 7 9 10-6 2.08 6 9 10-8 Wellcome Trust Case
Control Consortium
(2007)
Breast cancer 27,036 25,253 52,289 1.04 9 9 10-6 1.26 2 9 10-76 Easton et al. (2007)
Lung cancer 9,531 9,674 19,205 1.15 8 9 10-9 1.24 5 9 10-10 Wang et al. (2008)
Multiple sclerosis 4,839 9,336 14,175 1.10 2 9 10-7 2.75 4 9 10-225 De Jager et al. (2009)
Type 2 diabetes 3,836 12,562 16,398 1.15 3 9 10-6 1.20 8 9 10-9 Steinthorsdottir
et al. (2007)
a Overall odds ratio refers to the odds ratio achieved by combining the discovery and replication samples
Genome-wide association studies 11
123
associated with entrepreneurship for men and women.
As a result, separate GWAS should be conducted on
entrepreneurship for both genders. However, this
requires even larger samples to identify SNPs with
relatively small effects.
In summary, the required sample size for a GWAS
on an economic outcome of interest can easily get
very large ([50,000 observations) if the effective
alleles have odds ratios of 1.2 or lower; if the
frequency of the effective minor allele is low
(\20%), if the outcome of interest is rare (\20% of
the population), and if there is an interaction between
genes and the environment that leads to country-,
time-, or gender-specific associations. On the other
hand, strong genetic effects with odds ratios of 3 or
greater can already be detected with sample sizes of
around 1,000 observations. However, given previous
findings on genetically complex behaviors, it is
unlikely that many economic outcomes will be found
that can be clearly linked to a limited number of
genes with strong effects. Based on our discussion,
we expect sample sizes of at least 30,000 observa-
tions will be required to identify SNPs associated
with economic outcomes such as entrepreneurship.
4 How to interpret GWAS results
Given the discussion above, it is obvious that GWAS
results below the threshold of genome-wide signifi-
cance are likely to be false positives. But what does it
mean if a particular study does not find SNPs that
reach genome-wide significance? Does this mean that
genes are not important? Although this is one of the
possible causes for not finding genome-wide signif-
icance, it is certainly not the only one. Our simula-
tions demonstrate that a plausible alternative
explanation is that the study is underpowered: it does
not have enough observations to find SNPs with weak
effects. In addition, it could be that different genes
are associated with an economic outcome in different
environments, which will make it difficult to detect
the SNPs with meta-analysis using data from differ-
ent regions or time periods. For example, let us
assume that one way genes influence the propensity
to become an entrepreneur is via risk preferences.
Generally, greater willingness to tolerate risk should
increase the probability that an individual will choose
self-employment over wage work (Kihlstrom and
Laffont 1979; Cramer et al. 2002). However, the risk
of entrepreneurship for the individual may depend on
the cultural and economic context. To illustrate,
assume that entrepreneurship is less risky in the USA
than in Japan because failing with an entrepreneurial
business may be more severely punished in Japan
than in the USA. While failure may result in severely
restricted job offers and lower wages in Japan, it may
actually be regarded as positive in the USA, which
could lead to better job offers following the entre-
preneurial episode of an individual. Consequently,
genes influencing risk preferences may be more
strongly associated with entrepreneurial behavior in
Japan than in the USA. In fact, the relationship may
be completely absent or even reversed in the USA, if
the above assumptions are true. Hence, a meta-
analysis pooling observations from both countries
would tend to ‘overlook’ genes associated with risk
preferences although they may be highly relevant in
the Japanese context.
Furthermore, there are a number of limitations in
current SNP arrays that could be responsible for not
finding the true genetic determinants of behavior. For
example, rare SNPs (i.e. base pairs that vary in only a
very small part of a population) are not covered by
current SNP arrays and the most effective SNPs may
be found there.
In addition, there are exceptions to the rule that
people carry exactly two copies of each SNP, one
inherited from each parent (Redon et al. 2006).
Instead, there are regions in the genome where people
have copy number variants, ranging from zero to 14
copies of a gene. Such copy number variants are not
yet recorded in most SNP arrays although they occur
frequently throughout the genome and cover hun-
dreds of genes, disease loci, functional elements, and
segmental duplications. These copy number variants
could not only influence the susceptibility to diseases
(Freeman et al. 2006; Estivill and Armengol 2007),
but also the tendency to become an entrepreneur or
other economic outcomes.
Another way how inherited changes could influ-
ence economic behavior is via epigenetics. Epige-
netics refers to the fact that changes in phenotype
(appearance) or gene expression can be caused by
mechanisms other than changes in the underlying
DNA sequence. These changes may persist through
cell divisions for the remainder of the cell’s life and
may also be passed on for numerous generations
12 P. D. Koellinger et al.
123

without any change in the underlying DNA sequence.
An example of epigenetic effects is the process of cell
differentiation: a single fertilized egg cell changes
into the many cell types including bones, muscles,
blood vessels, organs, etc. as it continues to divide. It
does so by activating some genes while inhibiting
others (Reik 2007). Epigenetic effects occur via
several mechanisms, including changes in nutrition.
For example, an experiment on agouti mice, which
are yellow, fat, and susceptible to life-shortening
diseases like cancer and diabetes, found that a change
in diet of mother mice could have far-reaching
consequences for their offspring (Waterland and Jirtle
2003). In the experiment, a test group of mother mice
were fed a diet rich in methyl donors, small chemical
clusters that can attach to, and turn off, a gene.
Although these mother mice passed on the agouti
gene to their offspring, their children were slender
and mousy brown instead of yellow and fat. Further-
more, in addition to living longer, the offspring did
not display the susceptibility to cancer and diabetes
found in the parents.
Epigenetic effects can also be induced after birth
and can be long lasting, passing through several
generations without changing the underlying DNA
sequence. Medical scientists are still coming to
understand the many ways that epigenetic changes
unfold. However, there is increasing evidence that
genes are not necessarily fate and genetic func-
tions can be switched on and off through nutrition
or exposure to environmental risk factors. Of
course epigenetic effects that cause heritable dif-
ferences in behavior are not revealed by the GWAS
design.
Rare SNPs, copy number variants, and epigenetic
effects are just examples illustrating that the GWAS
design does not cover all the potential pathways in
which traits and economic outcomes can be heritable.
In addition, the vast sample sizes required to identify
SNPs with small effective could be prohibitively
large. Consequently, not finding any genome-wide
significant hits in a GWAS does not allow for the
conclusion that genes are not relevant for the
outcome under investigation.
This is an important insight because it helps
reconcile findings from GWAS and from twin studies
that appear conflicting at first glance. For example,
numerous studies of twins find that intelligence and
general cognitive ability are heritable to a significant
extent (Deary et al. 2006; Plomin 1999; Plomin and
Kosslyn 2001; Plomin and Spinath 2004). Yet, until
now GWAS have not been successful at identifying
loci associated with IQ scores; even though this is
one of the most intensively researched traits in
behavioral genetics.
As discussed in Sect. 3, one reason for this
discrepancy is that it is very difficult to identify
effective SNPs with low odds ratios in GWAS since
very large samples are required. However, if intelli-
gence, entrepreneurship and many other human traits
and behaviors are genetically complex traits, then it is
reasonable to expect that many SNPs with low odds
ratios will be found once sufficiently large sample
sizes have been gathered. Furthermore, numerous
small genetic effects can easily add up in total
importance, especially if the effective SNPs interact
with each other. This could help to explain the
discrepancy between relatively weak effects of SNPs
discovered in GWAS and the strong estimated
importance of genes often reported in studies of
twins. However, it could also be that particular SNPs
are only effective in narrowly defined environments.
In this case, it is unlikely that even extremely large
scale GWAS meta-analyses will discover genome-
wide significant SNPs although different genes may
be important for the behavior of individuals in their
particular environment.
Another reason for the discrepancy between the
results in twin studies and GWAS are shortcomings
in the design of twin studies that may lead to an
overestimation of the importance of genes. First, twin
studies require the assumption of a shared, identical
environment for twins. A violation of this assumption
can lead to an overestimation of genetic effects
(Rutter 2006). A second potential shortcoming of
twin studies is the assumption that MZ twins are
genetically identical. It was recently found that this is
not true as even MZ twin pairs often exhibit different
copy number variation profiles (Bruder et al. 2008).
Not much is known about how these different profiles
can influence behavior and if these differences are
more pronounced among MZ or DZ twin pairs. Not
accounting for such genetic differences among twins
introduces a potential bias into the twin study design.
Finally, the structural equation models (SEM) used in
twin studies only indicate one possible explanation of
the underlying correlation matrix. They do not allow
one to conclude that the model is true or unique
Genome-wide association studies 13
123

because other SEM models may also fit the same
data.
Given the methodological difficulties of GWAS
and twin studies, it is possible that twin studies tend
to give an ‘upper bound’ for the relevance of genes
in explaining an outcome of interest, while GWAS
give a ‘lower bound’, potentially overlooking many
important heritable factors. We emphasize here that
GWAS is designed to identify common factors, i.e.
those with a population frequency of at least 5%.
For the identification of rarer genetic risk factors
different technology and study designs are neces-
sary. Furthermore, most, if not all, current GWAS
analyses are focused on identifying genetic risk
factors with an additive effect (rather than dominant
or recessive effects), and on identifying individual
genetic risk factors (rather than gene–gene and
gene–environment interactions). In other words,
effects departing from these assumptions are easily
missed and require particular attention and suffi-
ciently powered samples.
The essential question is what does it mean if a
GWAS finds genome-wide significance for one or
several loci. Does this imply genetic determinism
together with environmental irrelevance and lack of
free will? Luckily, such interpretation is usually not
warranted. Firstly, ongoing epigenetic research has
identified various mechanisms that affect how genes,
the environment, and behavior can interact, thus
leading to long-lasting differences in cell functions.
Secondly, so far most research on behavioral genetics
and on the genetics of diseases does not find a strict
determinism between a particular gene and a specific
outcome. In most cases, genes are neither a necessary
nor sufficient condition for an outcome to occur.
Rather, genes influence the probability that an event
occurs, often conditional on non-genetic factors such
as the exposition to an environmental risk factor or
choice (Rutter 2006). For example, there are genes
associated with smoking (Caporaso et al. 2009) and
with lung cancer (Wang et al. 2008). Not everyone
with these genes smokes or gets lung cancer, and
many people who smoke and get lung cancer do not
have these genes. Yet, having these genes signifi-
cantly increases the probability of smoking and lung
cancer. In particular, a genetic predisposition to lung
cancer is likely to be amplified by smoking, while an
absence of the exposure to smoke is likely to reduce
the risk of lung cancer even for those with the genetic
predisposition. Similar interactions between genes,
the environment, and free will can be expected for
economic outcomes such as entrepreneurship. Hence,
if GWAS finds effective alleles for entrepreneurship,
this will most probably indicate a genetic predispo-
sition to an outcome that will only materialize in the
presence of appropriate environmental conditions and
conscious choice. It is then necessary to understand
the causal pathway of the genetic effect to draw
economically valuable conclusions. Is the genetic
effect present in different environments? Is it linked
to other well-known characteristics of entrepreneurs
such as a low degree of risk aversion or overconfi-
dence? Are there differences in the way genes
influence the entrepreneurial propensity of men and
women? And how do the biological, psychological
and economic mechanisms work that lead to these
associations?
From our point of view, the absence of genome-
wide significant results in GWAS on entrepreneur-
ship does not necessarily contradict results from twin
studies that suggest a high importance of heritability.
Rather, it most likely means that the available sample
sizes are not large enough or that the most important
factors cannot be found among common SNPs.
Increasing sample size and looking at other places
such as rare SNPs, copy number variants and
epigenetic effects would be the next step. While the
discovery of specific SNPs associated with entrepre-
neurship would be an important finding, it would not
be the end of the quest. The next step would be
understanding how the causal pathway from genes to
behavior works and how robust these findings are in
different environments. Only then could one start
drawing conclusions regarding optimal individual
behavior and economic policy.
5 Conclusion: genetics in economics research?
For economists who believe that a better understand-
ing of economic behavior is an end in itself, the
virtues of GWAS and genetics in economic research
are evident. Genetics can help us understand the root
of individual differences, for example with respect to
preferences and productivity values. Also, genetics
can help discover new dimensions of individuality
that influence economic behavior; those not yet part
of established theory. We find this prospect exciting
14 P. D. Koellinger et al.
123
and promising enough to justify this time-consuming
and risky endeavor using this approach.
But beyond curiosity as a motivation, are there
clear, tangible results economists could expect to get
out of this approach? Arguably, the history of science
teaches us that the social relevance of many discov-
eries is not readily and rapidly apparent. Also, most
discoveries have little if any social relevance and it is
difficult to determine ex ante which research agenda
is the most promising. Yet, we dare to speculate
about some potential benefits of economists looking
at genes here.
First, genetic differences across populations may
be discovered that will help to explain aggregate
economic outcomes. For example, Global Entrepre-
neurship Monitor data shows that immigrant coun-
tries have a higher share of nascent entrepreneurs
than other countries (Levie 2007; Ali et al. 2008).
One potential explanation, from a genetic point of
view, are founder effects (a special case of genetic
drift): if a small group from a population splinters off
and founds a new population in a geographically
distant area, the new population is likely to exhibit
different shares of alleles at specific loci in the DNA.
In this case, the genetic predisposition of the founders
will have very strong and long-lasting effects on the
genetic make-up of the new population far into the
future that could influence their behavior.9 If the spin-
off population is very small, it will not be possible to
represent all genetic variants found in the original
population. Furthermore, the spin-off decision could
have genetic determinants. For example, if there are
genetic predispositions to low risk aversion and
novelty seeking, these genes will tend to be overrep-
resented in immigrant nations that were initially
populated by mavericks and explorers. Consequently,
there could be a higher average genetic predisposition
to entrepreneurial behavior in such countries, inde-
pendent from the institutional framework conditions
or push effects resulting from social marginalization
or isolation. This higher level of (genetically induced)
entrepreneurial behavior could then have further
repercussions in productivity figures, available job
offers, wages, and the ability of the economy to adapt
quickly to structural changes.
Second, detailed insights into the genetics of
economic behavior and its causal pathways may
improve our understanding of the scope and potential
boundaries for economic policies. For example, a
poor fit between genetic predisposition and occupa-
tional choice may result in lower monetary income.
In addition, not attaining desired social status can
affect life expectancy (Rablen and Oswald 2008) and
potentially other non-monetary determinants of utility
such as general health. Hence, people may have a
genetic predisposition for a particular occupation and
there may be a price tag on not finding one’s
‘occupational destiny’. Insights along these lines may
enable more targeted, maybe even personalized
support for people during their educational and work
life.
Our conclusion is that GWAS is a promising
approach to investigate the genetic causes of eco-
nomic outcomes. However, as with other genetically
complex traits, we expect that very large sample sizes
will be needed: in the magnitude of several ten
thousand observations, which will lead to a high cost
for each true positive discovered. Doubtless the
financial and administrative resources necessary to
gather the necessary data are beyond the means of
most economics departments and research institutes.
This, and the rapid progress in the fields of genetics,
implies that close cooperation between economics
and medical departments will be imperative for
finding genetic determinants of economic outcomes.
Finally, it is worth emphasizing that genetics is
still a young and rapidly developing research field.
GWAS are a significant improvement to earlier
approaches in genetics; approaches that have already
delivered a wealth of invaluable new insights.
However, it is unlikely to be the final word. Rapid
scientific and technological progress will enable even
better and cheaper insights in the human genome in
the future. This will lead to more and better data
availability and methodological improvements that
can also be used for studying economic outcomes of
interest, with entrepreneurship being just one prom-
inent example. Hence our belief that economists can
and will learn something useful by looking at genes.
9 A well-known example for this effect is the high prevalence
of people suffering the Ellis van Creveld syndrome in the
North American Amish population, which can be traced back
to two members of the new colony started in Pennsylvania in
1744 (Cavalli-Sforza et al. 1996).
Genome-wide association studies 15
123

Acknowledgements Comments by Adam Lederer and
Jonathan Beauchamp are gratefully acknowledged. For
Matthijs van der Loos and Roy Thurik this note has been
written in cooperation with the research program SCALES,
carried out by EIM and financed by the Dutch Ministry of
Economic Affairs.
Open Access This article is distributed under the terms of the
Creative Commons Attribution Noncommercial License which
permits any noncommercial use, distribution, and reproduction
in any medium, provided the original author(s) and source are
credited.
References
Ali, A., Allen, I. E., Brush, C., Bygrave, W. D., De Castro, J.,
Lange, J., et al. (2008). What entrepreneurs are up to:2008 National entrepreneurial assessment for the UnitedStates of America. Wellesley, MA: Babson College.
Andersson, L., & Hammarstedt, M. (2010). Intergenerational
transmissions in immigrant self-employment: Evidence
from three generations. Small Business Economics, 34,
261–276.
Arvey, R. D., Bouchard, T. J., Jr., Segal, N. L., & Abraham, L.
M. (1989). Job satisfaction: Environmental and genetic
components. Journal of Applied Psychology, 74, 187–192.
Benz, M., & Frey, B. S. (2008). Being independent is a great
thing: Subjective evaluations of self-employment and
hierarchy. Economica, 75, 362–383.
Betsworth, D. G., Bouchard, T. J., Jr., Cooper, C. R., Grote-
vant, H. D., Hansen, J.-I. C., Scarr, S., et al. (1994).
Genetic and environmental influences on vocational
interests assessed using adoptive and biological families
and twins reared together and apart. Journal of VocationalBehavior, 44, 263–278.
Block, J., & Koellinger, P. (2009). I can’t get no satisfaction—
Necessity entrepreneurship and procedural utility. Kyklos,62, 191–209.
Bruder, C. E. G., Piotrowski, A., Gijsbers, A. A. C. J., An-
dersson, R., Erickson, S., Dıaz de Stahl, T., et al. (2008).
Phenotypically concordant and discordant monozygotic
twins display different DNA copy-number-variation pro-
files. American Journal of Human Genetics, 82, 763–771.
Bygrave, W. D., & Hofer, C. W. (1991). Theorizing about
entrepreneurship. Entrepreneurship: Theory and Practice,16, 13–22.
Camerer, C., & Lovallo, D. (1999). Overconfidence and excess
entry: An experimental approach. American EconomicReview, 89, 306–318.
Caporaso, N., Gu, F., Chatterjee, N., Sheng-Chih, J., Yu, K.,
Yeager, M., et al. (2009). Genome-wide and candidate
gene association study of cigarette smoking behaviors.
PLoS ONE, 4, 1–10.
Cavalli-Sforza, L. L., Menozzi, P., & Piazza, A. (1996). Thehistory and geography of human genes (p. 413). Prince-
ton, N.J.: Princeton University Press.
Cesarini, D., Dawes, C. T., Johannesson, M., Lichtenstein, P.,
& Wallace, B. (2009a). Genetic variation in preferences
for giving and risk taking. Quarterly Journal of Eco-nomics, 124, 809–842.
Cesarini, D., Lichtenstein, P., Johannesson, M., & Wallace, B.
(2009b). Heritability of overconfidence. Journal of theEuropean Economic Association, 7, 617–627.
Collins, F. S., Morgan, M., & Patrinos, A. (2003). The human
genome project: Lessons from large-scale biology. Sci-ence, 300, 286–290.
Colombier, N., & Masclet, D. (2008). Intergenerational cor-
relation in self employment: Some further evidence from
French ECHP data. Small Business Economics, 30, 423–
437.
Comings, D. E., Rosenthal, R. J., Lesieur, H. R., Rugle, L. J.,
Muhleman, D., Chiu, C., et al. (1996). A study of the
dopamine D2 receptor gene in pathological gambling.
Pharmacogenetics, 6, 223–234.
Cowling, M., & Taylor, M. (2001). Entrepreneurial women and
men: Two different species? Small Business Economics,16, 167–175.
Cramer, J. S., Hartog, J., Jonker, N., & van Praag, C. M.
(2002). Low risk aversion encourages the choice for
entrepreneurship: An empirical test of a truism. Journal ofEconomic Behavior & Organization, 48, 29–36.
Crisp, D. J., Beaumont, A. R., Flowerdew, M. W., & Vardy, A.
(1978). The Hardy–Weinberg test—A correction. MarineBiology, 46, 181–183.
De Jager, P. L., Jia, X., Wang, J., de Bakker, P. I. W., Ottoboni,
L., Aggarwal, N. T., et al. (2009). Meta-analysis of gen-
ome scans and replication identify CD6, IRF8 and
TNFRSF1A as new multiple sclerosis susceptibility loci.
Nature Genetics, 41, 776–782.
Deary, I. J., Spinath, F. M., & Bates, T. C. (2006). Genetics of
intelligence. European Journal of Human Genetics, 14,
690–700.
Dunn, T., & Holtz-Eakin, D. (2000). Financial capital, human
capital, and the transition to self-employment: Evidence
from intergenerational links. Journal of Labor Economics,18, 282–305.
Easton, D. F., Pooley, K. A., Dunning, A. M., Pharoah, P. D.
P., Thompson, D., Ballinger, D. G., et al. (2007). Gen-
ome-wide association study identifies novel breast cancer
susceptibility loci. Nature, 447, 1087–1093.
Ebstein, R. P., Novick, O., Umansky, R., Priel, B., Osher, Y.,
Blaine, D., et al. (1996). Dopamine D4 receptor (D4DR)
exon III polymorphism associated with the human per-
sonality trait of novelty seeking. Nature Genetics, 12, 78–
80.
Estivill, X., & Armengol, L. (2007). Copy number variants and
common disorders: Filling the gaps and exploring com-
plexity in genome-wide association studies. PLoS Genet-ics, 3, 1787–1799.
Evans, D. S., & Leighton, L. S. (1989). Some empirical aspects
of entrepreneurship. American Economic Review, 79,
519–535.
Freeman, J. L., Perry, G. H., Feuk, L., Redon, R., McCarroll, S.
A., Altshuler, D. M., et al. (2006). Copy number variation:
New insights in genome diversity. Genome Research, 16,
949–961.
Freytag, A., & Thurik, A. R. (2007). Entrepreneurship and its
determinants in a cross-country setting. Journal of Evo-lutionary Economics, 17, 117–131.
16 P. D. Koellinger et al.
123
Grilo, I., & Thurik, R. (2008). Determinants of entrepreneurial
engagement levels in Europe and the US. Industrial andCorporate Change, 17, 1113–1145.
Grilo, I., Thurik, R., Verheul, I., & van der Zwan, P. (2007).
Climbing the entrepreneurial ladder: The role of gender(ERIM Report Series in Management ERS-2007-098-
ORG). Rotterdam, The Netherlands: Erasmus Research
Institute of Management.
Groenen, P. J. F., Hofman, A., Koellinger, P., van der Loos, M.
J. H. M., Rivadeneira, F., van Rooij, F., et al. (2008).
Genome-wide association for loci influencing entrepre-
neurial behavior: The Rotterdam Study. Behavior Genet-ics, 38, 628–629.
Guedj, M., Nuel, G., & Prum, B. (2008). A note on allelic tests
in case-control association studies. Annals of HumanGenetics, 72, 407–409.
Hardy, G. H. (1908). Mendelian proportions in a mixed pop-
ulation. Science, 28, 49–50.
Harold, D., Abraham, R., Hollingworth, P., Sims, R., Gerrish,
A., Hamshere, M. L., et al. (2009). Genome-wide asso-
ciation study identifies variants at CLU and PICALM
associated with Alzheimer’s disease. Nature Genetics, 41,
1088–1093.
Hartley, J. E. (1996). Retrospectives: The origins of the rep-
resentative agent. Journal of Economic Perspectives, 10,
169–177.
Hindorff, L. A., Sethupathy, P., Junkins, H. A., Ramos, E. M.,
Mehta, J. P., Collins, F. S., et al. (2009). Potential etio-
logic and functional implications of genome-wide asso-
ciation loci for human diseases and traits. Proceedings ofthe National Academy of Sciences USA, 106, 9362–9367.
Hirschhorn, J. N., Lohmueller, K., Byrne, E., & Hirschhorn, K.
(2002). A comprehensive review of genetic association
studies. Genetics in Medicine, 4, 45–61.
Hofman, A., Breteler, M. M. B., van Duijn, C. M., Janssen, H.
L. A., Krestin, G. P., Kuipers, E. J., et al. (2009). The
Rotterdam Study: 2010 objectives and design update.
European Journal of Epidemiology, 24, 553–572.
Hoggart, C. J., Clark, T. G., De Iorio, M., Whittaker, J. C., &
Balding, D. J. (2008). Genome-wide significance for
dense SNP and resequencing data. Genetic Epidemiology,32, 179–185.
Israel, S., Lerer, E., Shalev, I., Uzefovsky, F., Reibold, M.,
Bachner-Melman, R., et al. (2008). Molecular genetic
studies of the arginine vasopressin 1a receptor (AVPR1a)
and the oxytocin receptor (OXTR) in human behaviour:
From autism to altruism with some notes in between.
Progress in Brain Research, 170, 435–449.
Iyigun, M. F., & Owen, A. L. (1998). Risk, entrepreneurship,
and human capital accumulation. American EconomicReview, 88, 454–457.
Jovanovic, B. (1994). Firm formation with heterogeneous
management and labor skills. Small Business Economics,6, 185–191.
Keller, L. M., Bouchard, T. J., Jr., Arvey, R. D., Segal, N. L., &
Dawes, R. V. (1992). Work values: Genetic and envi-
ronmental influences. Journal of Applied Psychology, 77,
79–88.
Kihlstrom, R. E., & Laffont, J.-J. (1979). A general equilibrium
entrepreneurial theory of the firm based on risk aversion.
Journal of Political Economy, 87, 719–748.
Kirman, A. P. (1992). Whom or what does the representative
individual represent? Journal of Economic Perspectives,6, 117–136.
Kluger, A. N., Siegfried, Z., & Ebstein, R. P. (2002). A
meta-analysis of the association between DRD4 poly-
morphism and novelty seeking. Molecular Psychiatry, 7,
712–717.
Knafo, A., Israel, S., Darvasi, A., Bachner-Melman, R.,
Uzefovsky, F., Cohen, L., et al. (2008). Individual dif-
ferences in allocation of funds in the dictator game
associated with length of the arginine vasopressin 1a
receptor RS3 promoter region and correlation between
RS3 length and hippocampal mRNA. Genes, Brain andBehavior, 7, 266–275.
Knight, F. H. (1921). Risk, uncertainty, and profit. Boston,
MA: Houghton Mifflin Company.
Koellinger, P., Minniti, M., & Schade, C. (2007). ‘‘I think I
can, I think, I can’’: Overconfidence and entrepreneurial
behaviour. Journal of Economic Psychology, 28, 502–
527.
Laussel, D., & Le Breton, M. (1995). A general equilibrium
theory of firm formation based on individual unobservable
skills. European Economic Review, 39, 1303–1319.
Lazear, E. P. (2004). Balanced skills and entrepreneurship.
American Economic Review, 94, 208–211.
Lazear, E. P. (2005). Entrepreneurship. Journal of LaborEconomics, 23, 649–680.
Lentz, B. F., & Laband, D. N. (1990). Entrepreneurial success
and occupational inheritance among proprietors. Cana-dian Journal of Economics, 23, 563–579.
Levie, J. (2007). Immigration, in-migration, ethnicity and
entrepreneurship in the United Kingdom. Small BusinessEconomics, 28, 143–169.
Li, Y., & Abecasis, G. R. (2006). Mach 1.0: Rapid haplotype
reconstruction and missing genotype inference. AmericanJournal of Human Genetics, S79, 2290.
Marchini, J., Howie, B., Myers, S., McVean, G., & Donnelly,
P. (2007). A new multipoint method for genome-wide
association studies by imputation of genotypes. NatureGenetics, 39, 906–913.
McCarthy, M. I., Abecasis, G. R., Cardon, L. R., Goldstein, D.
B., Little, J., Ioannidis, J. P. A., et al. (2008). Genome-
wide association studies for complex traits: consensus,
uncertainty and challenges. Nature Review Genetics, 9,
356–369.
Miller, P., Mulvey, C., & Martin, N. (2001). Genetic and
environmental contributions to educational attainment in
Australia. Economics of Education Review, 20, 211–224.
Nicolaou, N., & Shane, S. (2009). Can genetic factors influence
the likelihood of engaging in entrepreneurial activity?
Journal of Business Venturing, 24, 1–22.
Nicolaou, N., Shane, S., Cherkas, L., Hunkin, J., & Spector, T.
D. (2008a). Is the tendency to engage in entrepreneurship
genetic? Management Science, 54, 167–179.
Nicolaou, N., Shane, S., Cherkas, L., & Spector, T. D. (2008b).
The influence of sensation seeking in the heritability of
entrepreneurship. Strategic Entrepreneurship Journal, 2,
7–21.
Perez de Castro, I., Ibanez, A., Torres, P., Saiz-Ruiz, J., &
Fernandez-Piqueras, J. (1997). Genetic association study
between pathological gambling and a functional DNA
Genome-wide association studies 17
123
polymorphism at the D4 receptor gene. Pharmacogenet-ics, 7, 345–348.
Plomin, R. (1999). Genetics and general cognitive ability.
Nature, 402(Supp), C25–C29.
Plomin, R., & Kosslyn, S. M. (2001). Genes, brain and cog-
nition. Nature Neuroscience, 4, 1153–1155.
Plomin, R., & Spinath, F. M. (2004). Intelligence: Genetics,
genes, and genomics. Journal of Personality and SocialPsychology, 86, 112–129.
Psaty, B. M., O’Donnell, C. J., Gudnason, V., Lunetta, K. L.,
Folsom, A. R., Rotter, J. I., et al. (2009). Cohorts for Heart
and Aging Research in Genomic Epidemiology
(CHARGE) Consortium: Design of prospective meta-
analyses of genome-wide association studies from five
cohorts. Circulation: Cardiovascular Genetics, 2, 73–80.
Purcell, S., Cherny, S. S., & Sham, P. C. (2003). Genetic power
calculator: Design of linkage and association genetic
mapping studies of complex traits. Bioinformatics, 19,
149–150.
Purcell, S., Neale, B., Todd-Brown, K., Thomas, L., Ferreira,
M. A. R., Bender, D., et al. (2007). PLINK: A tool set for
whole-genome association and population-based linkage
analysis. American Journal of Human Genetics, 81, 559–
575.
Rablen, M. D., & Oswald, A. J. (2008). Mortality and
immortality: The Nobel Prize as an experiment into the
effect of status upon longevity. Journal of Health Eco-nomics, 27, 1462–1471.
Redon, R., Ishikawa, S., Fitch, K. R., Feuk, L., Perry, G. H.,
Andrews, T. D., et al. (2006). Global variation in copy
number in the human genome. Nature, 444, 444–454.
Reik, W. (2007). Stability and flexibility of epigenetic gene
regulation in mammalian development. Nature, 447, 425–
432.
Roessler, C., & Koellinger, P. (2009). Firm formation withcomplementarities: The role of the entrepreneur (TI Dis-
cussion Paper 09-003/3). Rotterdam, The Netherlands:
Tinbergen Institute.
Rutter, M. (2006). Genes and behavior—Nature-nurtureinterplay explained (pp. 41–44). Oxford, UK: Blackwell
Publishing.
Sasieni, P. D. (1997). From genotypes to genes: Doubling the
sample size. Biometrics, 53, 1253–1261.
Steinthorsdottir, V., Thorleifsson, G., Reynisdottir, I., Bene-
diktsson, R., Jonsdottir, T., Walters, G. B., et al. (2007). A
variant in CDKAL1 influences insulin response and risk
of type 2 diabetes. Nature Genetics, 39, 770–775.
Sturges, H. A. (1926). The choice of a class interval. Journal ofthe American Statistical Association, 21, 65–66.
The International HapMap Consortium. (2005). A haplotype
map of the human genome. Nature, 437, 1299–1320.
Thurik, A. R., Carree, M. A., Van Stel, A., & Audretsch, D. B.
(2008). Does self-employment reduce unemployment?
Journal of Business Venturing, 23, 673–686.
Van der Loos, M. J. H. M., Koellinger, P. D., Groenen, P. J. F.,
& Thurik, A. R. (2010). Genome-wide association studies
and the genetics of entrepreneurship. European Journal ofEpidemiology, 25, 1–3.
Van der Zwan, P., Thurik, R., & Grilo, I. (2010). The entre-
preneurial ladder and its determinants. Applied Econom-ics, forthcoming.
Verheul, I., Carree, M., & Thurik, R. (2009). Allocation and
productivity of time in new ventures of female and male
entrepreneurs. Small Business Economics, 33, 273–291.
Verheul, I., Uhlaner, L., & Thurik, R. (2005). Business
accomplishments, gender and entrepreneurial self-image.
Journal of Business Venturing, 20, 483–518.
Wagner, J. (2007). What a difference a Y makes—Female and
male nascent entrepreneurs in Germany. Small BusinessEconomics, 28, 1–21.
Wang, W. Y. S., Barratt, B. J., Clayton, D. G., & Todd, J. A.
(2005). Genome-wide association studies: Theoretical and
practical concerns. Nature Reviews Genetics, 6, 109–118.
Wang, Y., Broderick, P., Webb, E., Wu, X., Vijayakrishnan, J.,
Matakidou, A., et al. (2008). Common 5p15.33 and
6p21.33 variants influence lung cancer risk. NatureGenetics, 40, 1407–1409.
Waterland, R. A., & Jirtle, R. L. (2003). Transposable ele-
ments: Targets for early nutritional effects on epigenetic
gene regulation. Molecular and Cellular Biology, 23,
5293–5300.
Weinberg, W. (1908). Uber den Nachweis der Vererbung beim
Menschen. Jahreshefte des Vereins fur vaterlandischeNaturkunde in Wurttemberg, 64, 368–382.
Wellcome Trust Case Control Consortium. (2007). Genome-
wide association study of 14,000 cases of seven common
diseases and 3,000 shared controls. Nature, 447, 661–678.
Wennekers, S., & Thurik, R. (1999). Linking entrepreneurship and
economic growth. Small Business Economics, 13, 27–55.
Zhang, Z., Zyphur, M. J., Narayanan, J., Arvey, R. D., Cha-
turvedi, S., Avolio, B. J., et al. (2009). The genetic basis
of entrepreneurship: Effects of gender and personality.
Organizational Behavior and Human Decision Processes,110, 93–107.
18 P. D. Koellinger et al.
123