genomic expression programs in the response of …genome- biology of the cell vol. 11, 4241–4257,...
TRANSCRIPT

Molecular Biology of the CellVol. 11, 4241–4257, December 2000
Genomic Expression Programs in the Response ofYeast Cells to Environmental Changes□D
Audrey P. Gasch,*¶ Paul T. Spellman,†¶ Camilla M. Kao,*¶
Orna Carmel-Harel,‡ Michael B. Eisen,§ Gisela Storz,‡ David Botstein,†and Patrick O. Brown*i
*Departments of Biochemistry and †Genetics, Stanford University School of Medicine, Stanford, CA94305-5428; ‡Cell Biology and Metabolism Branch, National Institute of Child Health and HumanDevelopment, National Institutes of Health, Bethesda, MD 20892-5430; §Lawrence Berkeley NationalLabs and Department of Molecular and Cellular Biology, University of California Berkeley, Berkeley,CA 94720; and iHoward Hughes Medical Institute, Stanford, CA
Submitted July 11, 2000; Revised September 19, 2000; Accepted October 11, 2000Monitoring Editor: Pamela A. Silver
We explored genomic expression patterns in the yeast Saccharomyces cerevisiae responding todiverse environmental transitions. DNA microarrays were used to measure changes in transcriptlevels over time for almost every yeast gene, as cells responded to temperature shocks, hydrogenperoxide, the superoxide-generating drug menadione, the sulfhydryl-oxidizing agent diamide,the disulfide-reducing agent dithiothreitol, hyper- and hypo-osmotic shock, amino acid starva-tion, nitrogen source depletion, and progression into stationary phase. A large set of genes (; 900)showed a similar drastic response to almost all of these environmental changes. Additionalfeatures of the genomic responses were specialized for specific conditions. Promoter analysis andsubsequent characterization of the responses of mutant strains implicated the transcription factorsYap1p, as well as Msn2p and Msn4p, in mediating specific features of the transcriptional response,while the identification of novel sequence elements provided clues to novel regulators. Physio-logical themes in the genomic responses to specific environmental stresses provided insights intothe effects of those stresses on the cell.
INTRODUCTION
Cellular organisms require specific internal conditions foroptimal growth and function. Myriad strategies haveevolved to maintain these internal conditions in the face ofvariable and often harsh external environments. Whereasmulticellular organisms can use specialized organs and tis-sues to provide a relatively stable and homogenous internalenvironment, unicellular organisms such as the yeast Sac-charomyces cerevisiae have evolved autonomous mechanismsfor adapting to drastic environmental changes. Yeasts regu-larly withstand fluctuations in the types and quantities of
available nutrients, temperature, osmolarity and acidity oftheir environment, and the variable presence of noxiousagents such as radiation and toxic chemicals. The genomicexpression program required for maintenance of the optimalinternal milieu in one environment may be far from optimalin a different environment. Thus, when environmental con-ditions change abruptly, the cell must rapidly adjust itsgenomic expression program to adapt to the new conditions.
The complexity of the yeast cell’s system for detecting andresponding to environmental variation is only beginning toemerge. Genes whose transcription is responsive to a varietyof stresses have been implicated in a general yeast responseto stress (Mager and De Kruijff, 1995; Ruis and Schuller,1995). Other gene expression responses appear to be specificto particular environmental conditions. Several regulatorysystems have been implicated in modulating these re-sponses, but the complete network of regulators of stressresponses and the details of their actions, including thesignals that activate them and the downstream targets theyregulate, remain to be elucidated.
We used DNA microarrays to analyze changes in tran-script abundance in yeast cells responding to a panel of
□D Online version of this article contains data set material, and isavailable at www.molbiolcell.org.
¶ Current address: Lawrence Berkeley National Labs, Berkeley,CA 94720. ‡‡current address: Department of Chemical Engi-neering, Stanford University, Stanford, CA 94305-5428.
i Corresponding author. E-mail address: [email protected]: dithiothrietol (DTT), environmental stress response(ESR), hydrogen peroxide (H2O2), Msn2p and/or Msn4p (Msn2/Msn4p), stress response element (STRE)
© 2000 by The American Society for Cell Biology 4241

diverse environmental stresses. Our analysis of this largebody of gene expression data allowed us to define stereo-typed patterns of gene expression during the adaptation tostressful environments, and to compare and contrast thegene expression responses to different stresses. Here, wepresent three key results. First, we describe the global ex-pression programs in response to a diverse set of stresses,including their specific features and a common response toall of the stressful conditions, termed the “environmentalstress response” (ESR). Second, several sets of coregulatedgenes share promoter elements, which point to the involve-ment of specific transcription factors in the regulation ofthose genes. The roles of the transcription factor Yap1p andthe related factors Msn2p and Msn4p are examined by an-alyzing the expression responses of strains deleted for oroverproducing these factors. Third, we interpret the re-sponses of genes with known functions to gain insights intothe physiological effects of each of the stresses as well as themechanisms that yeast cells use to cope with these stresses.The complete data set, as well as supplemental materials, isavailable at http://www-genome.stanford.edu/yeast stress.
MATERIALS AND METHODS
(Additional details, including descriptions of duplicated experi-ments and appropriate reference citations, can be found on the websupplement, at the address given above.)
Strains and Growth ConditionsThe strains used in this study are listed in Table 1. Unless otherwisenoted, cells were grown in rich medium (YPD) (Sherman, 1991) at30°C and shaken at 250–300 rpm.
Sample Collection, Cell Lysis, and RNA IsolationIn most cases, cells were grown to early log phase (OD600 0.2 to 0.4),and an aliquot of cells was collected to serve as the time-zeroreference. Cells were collected by centrifugation at 3000 3g for 3 to7 min at room temperature. Each 50-ml cell pellet was resuspendedin 3 to 10 ml of lysis buffer (10 mM Tris-Cl pH 7.4, 10 mM EDTA,0.5% SDS), and stored at 280°C until RNA preparation. Total RNAwas collected by acid lysis similar to that previously described(Spellman et al., 1998; see web supplement). Where indicated,mRNA was purified using oligo-dT cellulose (Ambion, Austin, TX),precipitated and resuspended in Tris-EDTA (TE) at a final concen-tration of ; 0.5–1 mg/mL.
Probe Preparation, Microarray Hybridization, andData AcquisitionProbe preparation and microarray construction and analysis wereperformed as previously described (Shalon et al., 1996; DeRisi et al.,
1997; Spellman et al., 1998; see web supplement). Arrays werescanned using a commercially available scanning laser microscope(GenePix 4000) from Axon Instruments (Foster City, CA). Full de-tails on using the GenePix 4000 can be obtained from Axon. Allarrays were analyzed using the program ScanAlyze (available fromhttp://rana.stanford.edu/), as described in the manual.
Heat Shock from 25°C to 37°CCells grown continuously at 25°C were collected by centrifugation,resuspended in an equal volume of 37°C medium, and returned to37°C for growth. Samples were collected at 5, 15, 30, and 60 min. Forarray analysis, each Cy5-labeled sample was compared with a Cy3-labeled reference pool, consisting of an equal mass of all of the RNAsamples. Following data acquisition and clustering analysis, thedata were mathematically “zero transformed” for visualization bydividing the expression ratios for each gene measured on a givenarray by the corresponding ratios measured for the unshocked,time-zero cells. Therefore, in all figures, the ratios represent theexpression level at each time point relative to the expression level inthe unshocked, time-zero sample.
Heat Shock from Various Temperatures to 37°C andSteady-State Temperature GrowthSix cultures were grown continuously at 17°, 21°, 25°, 29°, 33°, or37°C for ;20 h. Half of each culture was collected to serve as theunstressed reference, and the remainder of each culture was col-lected by centrifugation and immediately resuspended in 37°C me-dium. After 20 min at 37°C, the cells were harvested, and total RNAwas isolated.
To measure steady-state expression at each temperature, RNAcollected from cells grown continuously at each temperature wasalso compared directly to RNA from cells grown at 33°C.
Temperature Shift from 37°C to 25°CCells grown at 37°C for ;20 h were collected by centrifugation,resuspended in two volumes of 25°C medium, and returned to 25°Cfor growth. Samples were collected at 5, 15, 30, 45, 60, and 90 min,and total RNA was collected. Gene expression in cells growingcontinuously at 37°C was also compared directly to expression incells growing at 25°C.
Mild Heat Shock at Variable OsmolarityTo compare the effects of mild heat shock at different osmolarities,three experiments were performed. In the first, a YPD culture ofDBY7286 was grown at 29°C to OD600 0.3. Cells were collected bycentrifugation, the culture was resuspended in 33°C medium, andsamples were collected at 5, 15, 30 min after resuspention. A secondtime series was performed nearly identically, except that cells weregrown in YPD supplemented with 1 M sorbitol throughout theexperiment. In the third experiment, cells growing in YPD with 1 Msorbitol at 29°C were collected and resuspended in YPD without
Table 1. Strains used in this study
Name Genotype Source
DBY7286 MATa ura3-52 GAL2 Ferea et al., 1999DBY8768 ura3-52/ura3-52 GAL2/GAL2 Ferea et al., 1999DBY9434 MATa ura3-52 yap1::KANMX4 GAL2 This studyDBY9435 MATa msn2::KANMX4 msn4::URA3 GAL2 DeRisiDBY9439 DBY7286 harboring pRS416 Tae Bum ShinDBY9440 DBY7286 harboring pTS1 Tae Bum ShinDBY9441 DBY7286 harboring pTS2 Tae Bum Shin
Gasch et al.
Molecular Biology of the Cell4242

sorbitol at 33°C, and serial samples were collected. Total RNA wasisolated for array analysis.
Response of Mutant Cells to Heat ShockWild-type and mutant strains were exposed to heat shock in tripli-cate experiments. Wild-type, yap1, and msn2 msn4 cultures, grownat 30°C, were collected and resuspended in an equal volume ofmedium preheated to 37°C. After 20 min at 37°C the cells werecollected, and total RNA was isolated.
Hydrogen Peroxide TreatmentCells were grown to early-log phase at which point H2O2 (Sigma, St.Louis, MO) was added for a final concentration of 0.30 mM. Sampleswere collected at 10, 20, 30, 40, 50, 60, 80, 100, and 120 min. Theculture volume and the concentration of H2O2 were maintainedthroughout the experiment. The H2O2 concentration was monitoredevery 3 min using a horseradish-peroxidase based assay (Green andHill, 1984), which showed that the concentration of H2O2 was main-tained at 0.32 1/20.03 mM H2O2 over the course of the experiment(data not shown).
Response of Mutant Cells to H2O2 ExposureWild-type, yap1, and msn2 msn4 cultures were exposed to 0.3 mMH2O2 in duplicate experiments. A single dose of H2O2 was added to0.3 mM of each culture, and after 20 min, the cultures were col-lected, and mRNA was isolated.
Menadione ExposureMenadione bisulfite (Sigma) was suspended immediately before usein water at a concentration of 1 M and was filter-sterilized. Mena-dione bisulfite was added to the culture at a concentration of 1 mM,samples were removed at 10, 20, 30, 40, 50, 60, 80, 105, and 120 min,and mRNA was isolated.
Diamide Treatment1.5 mM diamide (Sigma) was added to the culture, and sampleswere recovered at 5, 10, 20, 30, 40, 60, 90 min. Polyadenylated RNAwas isolated for array analysis.
DTT ExposureCells were grown at 25°C and dithiothrietol (DTT) (Boeringer Man-heim, Indianapolis, IN) was added for a final concentration of 2.5mM. Samples were removed at 15, 30, 60, 120, 240, 480 min. TotalRNA recovered from each time point, as well as the unstressedsample, was labeled with Cy5-dUTP and compared with a referencepool, consisting of equal mass of total RNA from each sample thatwas labeled with Cy3-dUTP. The array data were “zero-trans-formed” subsequent to clustering analysis.
Hyper-osmotic ShockA YPD culture was inoculated and grown to OD600 0.6. One volumeof 30°C YPD supplemented with 2 M sorbitol was added to theculture for a final concentration of 1 M sorbitol. Samples werecollected at 5, 15, 30, 45, 60, 90, and 120 min, and mRNA wasisolated.
Hypo-osmotic ShockCells were grown for ;20 h in YPD supplemented with 1 M sorbitol.The cells were grown to OD600 0.15, collected by centrifugation, andresuspended in YPD without sorbitol. Samples were collected at 5,15, 30, 60 min, and total RNA was isolated for array analysis.
Amino Acid StarvationCells were grown in complete minimal medium (SCD) to early-logphase. Cells were collected by centrifugation and resuspended in anequal volume of minimal medium lacking amino acids and adenine(YNB2AA, 2% glucose, 20 mg/L uracil) and allowed to grow.Samples were then harvested after 0.5 h, 1 h, 2 h, 4 h, and 6 h, andtotal RNA was collected.
Nitrogen DepletionCells were grown in SCD medium, collected by centrifugation andresuspended in an equal volume of minimal medium withoutamino acids or adenine and with limiting concentrations of ammo-nium sulfate (YNB2AA2AS, 2% glucose, 20 mg/L uracil, 0.025%ammonium sulfate) and returned to the 30°C shaker. Samples weresubsequently harvested after 0.5 h, 1 h, 2 h, 4 h, 8 h, 12 h, 1 d, 2 d,3 d, and 5 d of culture incubation, and mRNA was isolated.
Stationary PhaseA YPD culture was grown to OD600 0.3, at which point a sample wascollected to serve as the time-zero reference. Samples were recov-ered at 2 h, 4 h, 6 h, 8 h, 10 h, 12 h, 1 d, 2 d, 3 d, and 5 d of cultureincubation. Total RNA was isolated for array analysis.
Steady-state Growth on Alternative Carbon SourcesCells were grown continuously in YP media supplemented with 2%weight to volume of glucose, galactose, raffinose, fructose, sucrose,or ethanol as a carbon source. Total RNA harvested from each of thesamples was labeled with Cy5-dUTP and compared with a refer-ence pool, consisting of an equal mass of RNA from each samplethat was labeled with Cy3-dUTP. The data were mathematicallytransformed subsequent to clustering analysis by dividing the ex-pression ratios for each gene measured on a given array by thecorresponding ratios measured for the cells grown in glucose.
Overexpression StudiesOverexpression constructs pRS-MSN2 and pRS-MSN4, as well asthe parent vector pRS416 (Mumberg et al., 1994), were received fromTae Bum Shin (postdoctoral fellow in Brown lab). Wild-typeDBY7286 cells harboring each plasmid were grown in SCD mediumsupplemented with 2% galactose for ; 6 h. Total RNA collectedfrom cells harboring pTS1 (MSN2 vector) and pTS2 (MSN4 vector)was compared directly to RNA collected from cells containingpRS416.
Hierarchical ClusteringHierarchical clustering of the data was performed as previouslydescribed (Eisen et al., 1998) using the program Cluster (available athttp://rana.stanford.edu). Data from 142 microarray analyses ofRNA samples isolated from wild-type cells under various condi-tions were clustered, along with previously-published data (DeRisiet al., 1997). The cluster analysis was performed without the “time-zero” mathematical transformation of the data from experiments inwhich a reference pool was used. The data from each array exper-iment were weighted by the program Cluster (available at http://rana.stanford.edu/software) according to the overall similarity ofeach array to others in the data set, which served to under-weightarrays that were highly similar. The resulting cluster was visualizedusing the program TreeView (available at http://rana.stanford.edu/software/).
Promoter AnalysisFor coregulated genes, either 600 bp or 1000 bp, as indicated,upstream of each gene start site was recovered using Yeast Tools
Yeast Expression Responses to Stress
Vol. 11, December 2000 4243
(http://copan.cifn.unam.mx/;jvanheld/rsa-tools). Sequence mo-tifs common to the upstream sequences were identified by theMEME algorithm (http://www.sdsc.edu/MEME/meme/website/meme.html [Bailey and Elkan, 1994]). Upstream sequences weresearched for specific sequence motifs using Yeast Tools.
RESULTS
OverviewWe characterized genomic expression programs in yeastresponding to environmental changes in three ways. First,we characterized the temporal program of gene expressionin the response of cells to heat shock, hydrogen peroxide,superoxide generated by menadione, a sulfhydryl oxidizingagent (diamide), and a disulfide reducing agent (dithiothre-itol), hyper-osmotic shock, amino acid starvation, nitrogensource depletion, and progression into stationary phase. Theseverity of each condition was calibrated to preserve morethan 80% cell viability, so that we could observe the expres-sion programs in viable cells adapting successfully to achanging environment. For most of the environmentalchanges we studied, samples were collected over the courseof 2–3 h; in our investigation of the responses to nitrogendepletion and stationary phase, samples were collected overa period of 5 d. Second, we examined the dose response toheat shock in a series of experiments in which cells weresubjected to temperature shifts of variable magnitude.Third, we compared the genomic expression programs incells already adapted to steady-state growth at differenttemperatures and on alternative carbon sources.
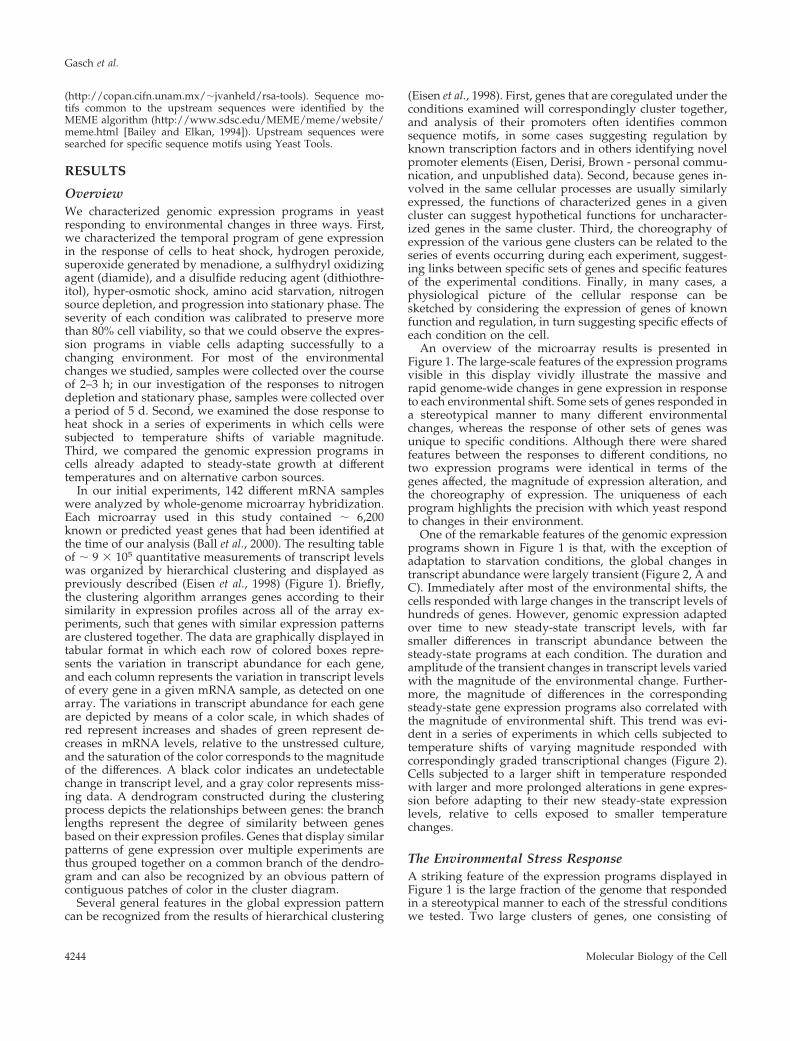
In our initial experiments, 142 different mRNA sampleswere analyzed by whole-genome microarray hybridization.Each microarray used in this study contained ; 6,200known or predicted yeast genes that had been identified atthe time of our analysis (Ball et al., 2000). The resulting tableof ; 9 3 105 quantitative measurements of transcript levelswas organized by hierarchical clustering and displayed aspreviously described (Eisen et al., 1998) (Figure 1). Briefly,the clustering algorithm arranges genes according to theirsimilarity in expression profiles across all of the array ex-periments, such that genes with similar expression patternsare clustered together. The data are graphically displayed intabular format in which each row of colored boxes repre-sents the variation in transcript abundance for each gene,and each column represents the variation in transcript levelsof every gene in a given mRNA sample, as detected on onearray. The variations in transcript abundance for each geneare depicted by means of a color scale, in which shades ofred represent increases and shades of green represent de-creases in mRNA levels, relative to the unstressed culture,and the saturation of the color corresponds to the magnitudeof the differences. A black color indicates an undetectablechange in transcript level, and a gray color represents miss-ing data. A dendrogram constructed during the clusteringprocess depicts the relationships between genes: the branchlengths represent the degree of similarity between genesbased on their expression profiles. Genes that display similarpatterns of gene expression over multiple experiments arethus grouped together on a common branch of the dendro-gram and can also be recognized by an obvious pattern ofcontiguous patches of color in the cluster diagram.
Several general features in the global expression patterncan be recognized from the results of hierarchical clustering
(Eisen et al., 1998). First, genes that are coregulated under theconditions examined will correspondingly cluster together,and analysis of their promoters often identifies commonsequence motifs, in some cases suggesting regulation byknown transcription factors and in others identifying novelpromoter elements (Eisen, Derisi, Brown - personal commu-nication, and unpublished data). Second, because genes in-volved in the same cellular processes are usually similarlyexpressed, the functions of characterized genes in a givencluster can suggest hypothetical functions for uncharacter-ized genes in the same cluster. Third, the choreography ofexpression of the various gene clusters can be related to theseries of events occurring during each experiment, suggest-ing links between specific sets of genes and specific featuresof the experimental conditions. Finally, in many cases, aphysiological picture of the cellular response can besketched by considering the expression of genes of knownfunction and regulation, in turn suggesting specific effects ofeach condition on the cell.
An overview of the microarray results is presented inFigure 1. The large-scale features of the expression programsvisible in this display vividly illustrate the massive andrapid genome-wide changes in gene expression in responseto each environmental shift. Some sets of genes responded ina stereotypical manner to many different environmentalchanges, whereas the response of other sets of genes wasunique to specific conditions. Although there were sharedfeatures between the responses to different conditions, notwo expression programs were identical in terms of thegenes affected, the magnitude of expression alteration, andthe choreography of expression. The uniqueness of eachprogram highlights the precision with which yeast respondto changes in their environment.
One of the remarkable features of the genomic expressionprograms shown in Figure 1 is that, with the exception ofadaptation to starvation conditions, the global changes intranscript abundance were largely transient (Figure 2, A andC). Immediately after most of the environmental shifts, thecells responded with large changes in the transcript levels ofhundreds of genes. However, genomic expression adaptedover time to new steady-state transcript levels, with farsmaller differences in transcript abundance between thesteady-state programs at each condition. The duration andamplitude of the transient changes in transcript levels variedwith the magnitude of the environmental change. Further-more, the magnitude of differences in the correspondingsteady-state gene expression programs also correlated withthe magnitude of environmental shift. This trend was evi-dent in a series of experiments in which cells subjected totemperature shifts of varying magnitude responded withcorrespondingly graded transcriptional changes (Figure 2).Cells subjected to a larger shift in temperature respondedwith larger and more prolonged alterations in gene expres-sion before adapting to their new steady-state expressionlevels, relative to cells exposed to smaller temperaturechanges.
The Environmental Stress ResponseA striking feature of the expression programs displayed inFigure 1 is the large fraction of the genome that respondedin a stereotypical manner to each of the stressful conditionswe tested. Two large clusters of genes, one consisting of
Gasch et al.
Molecular Biology of the Cell4244

Figure 1. Genomic expression programs in response to environmental changes. The entire set of yeast genes identified at the time of our analysis (;6,200)was clustered based on their expression patterns in 142 array experiments that followed wild-type yeast responding to environmental changes. Here, datafrom 94 arrays are shown, omitting duplicate experiments that were considered in the clustering analysis (see web supplemental MATERIALS ANDMETHODS for details). Experiments are labeled according to the color key depicted: time course experiments are indicated with colored triangles, whilesteady-state experiments are labeled with colored squares. Individual clusters of coregulated genes that are discussed in the text and web supplementsare labeled as follows: A. WSC2 cluster, B. CIS3 cluster, C. LHS1 cluster, D. Glycolysis cluster, E. SSA2 cluster, F. Repressed ESR cluster, G. Amino acidtransporters, H. Amino acid and purine genes, I. Chaperone cluster, J. KAR2 cluster, K. Proteasome and Endocytosis cluster L. TRR1 and TRR2 clusters,M. DAL cluster, N. Oxidative phosphorylation cluster, O. Glyoxylate and TCA cycle cluster, P. Induced ESR cluster, Q. TRX2 cluster.
Yeast Expression Responses to Stress
Vol. 11, December 2000 4245

repressed genes and one consisting of induced genes, dis-played reciprocal but otherwise nearly-identical temporalprofiles (Figure 3). These clusters amounted to ; 900 genes,more than 14% of the currently-predicted genes in the yeastgenome (Ball et al., 2000). This stereotypical response sharedfeatures with the previously-recognized general response tostress, which typically refers to the response of a set of ; 50genes induced by a variety of stresses through the stressresponse element (STRE) promoter sequence, recognized bythe transcription factors Msn2p and Msn4p (Kobayashi andMcEntee, 1993; Marchler et al., 1993; Martinez-Pastor et al.,1996). Our results reveal that, although genes in this large
program showed a similar response to the conditions testedhere, the regulation of their expression is not general, but isinstead dependent on many different signaling systems thatact in a condition-specific and gene-specific manner (seebelow). Therefore, while it is important to recognize thesimilarities between this program and the previously-de-scribed general stress response, to avoid confusion we referto the stereotyped response of this entire set of induced andrepressed genes as the environmental stress response (ESR).
Genes Repressed in the ESR Within the large cluster of ; 600genes that were repressed in the ESR, two clusters with
Figure 2. Transient changes ingenomic expression following en-vironmental change. (A-B) Theexpression of ; 1000 genes thatchanged by a factor of at leasttwofold in response to heat shockis shown as the cells responded to(A) 25°C to 37°C heat shock and(B) 29°C to 33°C heat shock. (C-D)The average expression changesof genes displayed in (A) and (B),respectively, are shown. The av-erage expression of genes in-duced in each response is de-picted by a red curve, while theaverage expression of genes re-pressed in each response is de-picted by a green curve.
Gasch et al.
Molecular Biology of the Cell4246

Figure 3. Overview of the Environmental Stress Response (ESR). Genes that participate in the ESR were chosen based strictly on thegenomic cluster analysis shown in Figure 1. Two extended clusters of genes, one corresponding to repressed genes and one correspondingto induced genes, displayed nearly identical but opposite patterns of gene expression in response to environmental stress. Color scale andarray identification are indicated.
Yeast Expression Responses to Stress
Vol. 11, December 2000 4247

distinct expression profiles are evident (see web supplementfor details). The first cluster consists of genes involved ingrowth-related processes, various aspects of RNA metabo-lism (such as RNA processing and splicing, translation ini-tiation and elongation, tRNA synthesis and processing), nu-cleotide biosynthesis, secretion, and other metabolicprocesses. These genes appeared to be coregulated, andpromoter analysis revealed the presence of two novel andconserved motifs in the upstream elements of these genes(see web supplement for details), one of which was similarto a site identified in the promoters of RNA processing genesby Hughes et al. (2000). The second cluster is distinguishedfrom the first by a slight delay in the decline in transcriptlevels, and it consists almost entirely of genes encodingribosomal proteins. The repression of ribosomal proteingenes has previously been observed during multiple stressresponses (Warner, 1999) and is known to be regulated bythe transcription factor Rap1p (Moehle and Hinnebusch,1991; Li et al., 1999). Our results show that the repression ofthe ribosomal genes, along with the large set of genes in-volved in RNA metabolism, protein synthesis, and aspectsof cell growth, is a general feature of the ESR.
Genes Induced in the ESR Approximately 300 genes, ofwhich nearly 60% are completely uncharacterized, were in-duced in the ESR (see web supplement for details). Thefunctional themes represented by these genes are likely toprovide many clues to the ways cells fortify themselves forsurvival in inhospitable environments. The genes in thisgroup with known molecular functions are involved in awide variety of processes, including carbohydrate metabo-lism, detoxification of reactive oxygen species, cellular redoxreactions, cell wall modification, protein folding and degra-dation, DNA damage repair, fatty acid metabolism, metab-olite transport, vacuolar and mitochondrial functions, auto-phagy, and intracellular signaling (Figure 4). Many of thegenes induced in the ESR have previously been proposed tooffer cellular protection during stressful conditions, such asoxidative stress, heat shock, osmotic shock, and starvation(Hohmann and Mager, 1997; Mager and De Kruijff, 1995).More than half of the 50 genes that were previously reportedto be STRE-regulated (see Moskvina et al., 1998 and YeastProtein Database for references) were induced in the ESR.
One notable feature of the ESR was the differential expres-sion of isozymes. For example, various enzymes involved incarbon metabolism, protein folding, and defense againstreactive oxygen species were specifically induced in the ESR,while their counterparts were not (Figure 5). This resultconfirms and expands previous observations that isozymesinvolved in carbohydrate metabolism are differentially ex-pressed in response to osmotic shock (Norbeck andBlomberg, 1997; Rep et al., 2000). One possible explanationfor this divergence in regulation is that the putativeisozymes might possess different properties, including bio-chemical function, substrate specificity, and physical loca-tion, that make one isozyme optimized to the ESR and theother to more specific conditions. Alternatively, the exis-tence of differentially-regulated isozymes possessing similarproperties might allow ESR isozymes to be regulated as partof this more general program, while their related counter-parts are regulated by specialized signals.
Among the genes induced in the ESR were many whoseproducts play reciprocal metabolic roles. An example isprovided by genes involved in the metabolism of trehaloseand glycogen, whose roles in stress responses have beenlinked to storage of energy reserves, protein stabilization,and osmolyte balance (Hounsa et al., 1998; Singer andLindquist, 1998). Genes encoding enzymes that synthesizetrehalose, glycogen, and their precursors, as well as genesthat encode catabolic enzymes for degrading these carbohy-drates, are jointly induced in the ESR (Figure 4A), consistentwith the previously-observed induction of many of thesegenes in response to numerous stresses (Parrou et al., 1999;Parrou et al., 1997; Rep et al., 2000; Zahringer et al., 1997). Thesimultaneous induction of both synthetic and catabolic en-zymes seems paradoxical. However the activity of many ofthese enzymes is sensitively controlled at the posttransla-tional level (Hwang et al., 1989; Marchase et al., 1993; Dey etal., 1994; Huang et al., 1998; Parrou et al., 1999). We proposethat the coinduction of these genes renders the cell poised torapidly and sensitively modulate the activity of the corre-sponding enzymes and thereby increases the cell’s capacityfor regulated flux of carbohydrates into and out of its gly-cogen and trehalose stores. Induction of these genes presum-ably enhances the cell’s ability to rapidly buffer and manageosmotic instability and energy reserves.
The induction of genes encoding reciprocally-relatedfunctions is also evident in regulatory networks, includingthose that may be involved in regulation of the ESR itself.Components of the PKA pathway, including both positiveeffectors (SRA3, PKA3) and negative regulators (PDE2,SRA1) of PKA signaling, were coordinately induced in theESR (Figure 4F). Induction of PKA signaling components inthe ESR is particularly noteworthy, as activity of the path-way inhibits Msn2p and Msn4p activity by triggering relo-calization of the factors to the cytosol (Gorner et al., 1998;Smith et al., 1998). In fact, induction of the PKA componentsin the ESR was dependent on Msn2p and Msn4p (see morebelow). The cell may concomitantly increase protein levelsof positive and negative regulators of PKA signaling toallow sensitive posttranslational control of signalingthrough the pathway. Among the likely effects of this adap-tation would be an enhancement of the cell’s ability torapidly and precisely modulate expression of genes in theESR.
What Triggers the ESR? Given the universal induction of theESR in our initial experiments, we hypothesized that theESR might be initiated in response to any abrupt change inthe cells’ environment. According to this hypothesis, theresponse would be triggered by transferring cells in eitherdirection between two environments. To test this, we exam-ined the pattern of ESR expression following an abrupt shiftin temperature from 37°C to 25°C (Figure 6A and 6C). Theresponse to this shift was fundamentally different from thereverse shift from 25°C to 37°C in two ways. First, in re-sponse to the 37°C to 25°C temperature shift, the cells re-sponded with reciprocal changes in the expression of ESRgenes relative to the response to a 25°C to 37°C heat shock,reflecting the suppression, rather than initiation, of the ESR.Second, unlike the response to a 25°C to 37°C heat shock,which elicited massive and transient changes in ESR expres-sion, the transition from 37°C to 25°C resulted in a simple,
Gasch et al.
Molecular Biology of the Cell4248

Figure 4. Characterized genes induced in the ESR. Characterized genes that are induced in the ESR are displayed according to theirinvolvement in (A) carbohydrate metabolism, (B) cellular redox reactions and defense against reactive oxygen species, (C) protein folding,(D) protein degradation and vacuolar functions, (E) DNA damage repair, and (F) intracellular signaling. Additional functional categories canbe viewed on the web supplement.
Yeast Expression Responses to Stress
Vol. 11, December 2000 4249

rapid transition to the gene expression program character-istic of steady-state growth at 25°C, with essentially notransient features. A similar result was observed when cellswere transferred between medium of standard osmolarityand medium supplemented with 1 M sorbitol: when cellswere transferred to hyperosmolar medium, they initiatedthe ESR with transient changes in expression, whereas whencells adapted to growth in 1 M sorbitol were transferred tomedium of standard osmolarity, they suppressed the ESRwith only subtle transient features (Figure 6, B and D). Theseresults reveal that the ESR is not initiated in response to all
environmental changes and that the large, transient changesin expression that are characteristic of the ESR are only seenwhen this response is initiated and not in the reciprocalresponse to diminished environmental stress.
We also characterized the response of cells shifted be-tween two different environments that were equally stress-ful, in the sense that steady-state expression of genes in theESR was comparable at each of the conditions. Cells adaptedto growth at 29°C in the presence of 1 M sorbitol wereshifted to 33°C medium lacking sorbitol, resulting in a mildtemperature shift in combination with a shift to lower os-
Figure 5. Differentially regulated isozymes in the ESR. The expression of genes encoding differentially regulated isozymes is shown.Isozymes regulated in the ESR are labeled in purple. Color scale and array identification are shown.
Gasch et al.
Molecular Biology of the Cell4250

molarity. The resulting expression of ESR genes closely ap-proximated the sum of the individual responses to heatshock and a transition to lower osmolarity, with only a fewexceptions (see web for supplemental details). This resultsuggests that the cell responds independently to the uniquefeatures of each of the environmental transitions, i.e. theeffects of temperature shift and the consequences of osmo-larity change, resulting in additive effects on gene expres-sion.
Regulation of the ESR Because the ESR unfolds in a stereo-typical manner in response to diverse environmentalstresses, it might be supposed that the response is governedby one all-purpose regulatory system. However, severallines of evidence suggest that the ESR is not controlled by asingle system but by different regulatory systems evokedunder different environmental conditions.
Numerous subclusters of genes within the large cluster ofinduced ESR genes showed subtly different expression pat-terns, suggesting differences in the regulation of those genes.For example, genes in the TRX2 cluster were induced in theESR but were super-induced relative to other ESR genes inresponse to agents that alter the cellular redox potential.Similarly, a group of protein folding chaperones induced inthe ESR were super-induced in response to heat shock,relative to other stresses (Figure 4C). These results suggestthat subsets of genes within the ESR are governed by con-dition-specific regulatory mechanisms.
The expression of some of the genes induced in the ESRhas previously been shown to be governed by Msn2pand/or Msn4p (Msn2/Msn4p) in response to stressful con-ditions (see Moskvina et al., 1998 and Yeast Protein Databasefor review and references). We characterized genomic ex-pression in cells lacking these factors, identifying additional
Figure 6. Reciprocal expressionof the ESR following reciprocalenvironmental changes. (A-B)The expression of ESR genes isshown for (A) cells transferredfrom 25°C to 37°C (Œ) and cellstransferred from 37°C to 25°C (‚),and (B) cells exposed to hyper-osmotic shock (Œ) and reverse os-motic shock (‚) over the course of1 h. Steady-state expression ateach condition is also shown andis indicated by a closed or opensquare. The genes represented arethe same as those shown in Figure3. (C-D) The average expressionchanges of genes displayed in (A)and (B), respectively, over timeare graphed. Genes normally in-duced in the ESR are representedby a red curve, and genes nor-mally repressed in the ESR arerepresented by a green curve oneach plot.
Yeast Expression Responses to Stress
Vol. 11, December 2000 4251

targets of Msn2/Msn4p and providing evidence for alterna-tive regulators of ESR gene expression. The expression ofroughly 180 genes was affected in an msn2 msn4 doubledeletion strain responding to heat shock or H2O2 treatment,relative to the isogenic wild-type, and the genes affectedvaried in their dependence on Msn2/Msn4p (Figure 7). Onelarge class of genes, including previously known targetssuch as CTT1, HSP12, and carbohydrate metabolism genes(Martinez-Pastor et al., 1996; Schmitt et al., 1996; Boy-Mar-cotte et al., 1998; Moskvina et al., 1998), was largely depen-dent on Msn2/Msn4p in response to both heat shock andH2O2, while the induction of a second class of genes waspartially dependent on these factors in response to bothconditions. A third class of genes was dependent on Msn2/Msn4p in response to one of the two conditions, but not theother. For example, the induction of genes in the TRX2cluster was dependent on Msn2/Msn4p in response to heatshock, but the expression of these genes in response to H2O2treatment was unaffected by deletion of the factors (Figure8). Because the genes in this group contained within theirpromoters the consensus binding site for the transcriptionfactor Yap1p (Fernandes et al., 1997), we reasoned thatYap1p may also play a role in governing their expression.Characterization of gene expression in a yap1 deletion strainrevealed that the induction of genes in the TRX2 cluster wasdependent on Yap1p in response to H2O2 treatment, buttheir expression in response to heat shock was unaffected bydeletion of YAP1. These data reveal that genes in the TRX2cluster were induced through Msn2/Msn4p in response toheat shock but were induced through Yap1p in response toH2O2. Thus, genes in the ESR can be regulated by differenttranscription factors depending on the specific environmen-tal shock. This conclusion confirms and expands that of arecent study by Rep et al. (1999), in which the induction ofthe ESR genes GPD1, HSP12, and CTT1 was shown to begoverned by different transcription factors, namely Msn1p,Msn2p, Msn4p, or Hot1p, depending on the exact environ-mental conditions (Rep et al., 1999).
More than 90% of the genes whose expression was depen-dent on Msn2/Msn4p in response to heat shock or H2O2exposure were also induced by overexpression of MSN2 orMSN4 (Figure 7), but significantly more ESR genes wereaffected by overexpression of the factors than by their dele-tion. Approximately 80 additional ESR genes were inducedby MSN2 or MSN4 overexpression, as were other genes thatdo not participate in the ESR, whose expression in responseto either heat shock or H2O2 treatment was unaffected bydeletion of the factors. Some of these genes may be inducedthrough indirect effects of MSN2 or MSN4 overexpression,but many may be legitimate targets of the factors. That moreputative Msn2/4p targets were affected by overexpressionof the factors than by their deletion, under the conditions weexamined, is consistent with the hypothesis that, in responseto stressful environmental changes, the dependence of geneinduction on Msn2/4p is condition-specific. Deletion ofthese factors therefore reveals only the subset of their genetargets whose activation is Msn2/4p-dependent under thespecific conditions examined. A substantial fraction of thegenes in the ESR were unaffected by overexpression or de-letion of MSN2 or MSN4 and did not contain the STREpromoter element recognized by the factors, further impli-cating additional regulators of ESR expression.
Figure 7. Genes dependent on Msn2/Msn4p. Wild-type, msn2 msn4,and yap1 strains were exposed to H2O2 and heat shock, and geneswhose expression was affected in the msn2 msn4 mutant strain areshown. The display represents data averaged from duplicate experi-ments. The effects on these genes of overexpression of MSN2, MSN4(this study), and YAP1 (DeRisi et al., 1997) are also shown. Genes fellinto three classes based on their expression patterns, marked by bars tothe right of the cluster diagram: (A) genes partially dependent onMsn2/Msn4p in response to both stresses; (B) genes largely dependenton Msn2/Msn4p in response to both stresses; and (C) genes dependenton Msn2/4p only in response to heat shock.
Gasch et al.
Molecular Biology of the Cell4252

Specific Responses to SpecificEnvironmental ChangesIn addition to the common ESR, many of the gene expres-sion responses to different environmental changes were spe-cific to individual conditions. Thus, the global expressionresponse to each of the environmental transitions wasunique. The physiological themes represented by the geneexpression changes in each global response sketched a pic-ture of the physiological effects of each condition and sug-gested directions for future investigation of the molecularadaptation to these conditions. We present a brief synopsisof each genomic response, and we encourage readers to visitthe companion website to explore the complete data set andview supplemental details.
Heat Sudden heat shock elicited massive and rapid alter-ations in genomic expression. The ESR was initiated withinminutes of a temperature shift, and numerous specializedresponses were also triggered. Most notably, the concurrentinduction of protein folding chaperones localized to thecytoplasm, mitochondria, and ER supports the notion thatone of the primary effects of heat shock is protein unfolding.In addition, the genomic response to heat shock was strik-ingly similar to that triggered by stationary phase, includingthe induction of genes involved in respiration and alterna-tive carbon source utilization. Because extracellular glucoseconcentrations did not change during the course of the heatshock experiment (data not shown), we propose that chap-erone-dependent protein folding in the immediate aftermath
of heat shock causes a sudden decrease in cellular ATPconcentrations. A shift in the ATP:AMP ratio might thenlead to the observed expression alterations in central energymetabolism genes, similar to the response seen in mamma-lian cells (Hardie and Carling, 1997; Hardie, 1999).
H2O2 and Menadione The gene expression programs follow-ing H2O2 and menadione treatment were largely identical,despite the fact that these agents are thought to generatedifferent reactive oxygen species within the cell. The re-sponses to both agents were characterized by the stronginduction of genes known to be involved in the detoxifica-tion of both H2O2 and superoxide (such as superoxide dis-mutases, glutathione peroxidases, and thiol-specific antioxi-dants), as well as genes involved in oxidative and reductivereactions within the cell (thioredoxin, thioredoxin reducta-ses, glutaredoxin, and glutathione reductase). Many of thegenes most strongly induced in response to H2O2 and men-adione were dependent on the transcription factor Yap1p fortheir induction (Schnell et al., 1992; Stephen et al., 1995;Jamieson, 1998) (see web for supplemental details).
DTT The transcriptional profile of the DTT response wasquite distinct from the responses to other stresses, particu-larly in its temporal pattern. The initial induction response,which occurred within 30 min of DTT exposure, includedprotein disulfide isomerases and protein folding chaperoneslocalized to the ER and genes implicated in the response toalterations in the cellular redox potential. These observa-tions are consistent with the hypothesis that DTT-dependent
Figure 8. ESR genes dependenton Msn2/Msn4p and Yap1p. (A)Gene expression in the wild-type,msn2 msn4, and yap1 strains wasmonitored following heat shockand H2O2 treatment as described.The expression ratios for each genein this diagram represent the aver-age from duplicate array experi-ments. Transcripts of the GRE2 andYOL150C genes (*) are highly ho-mologous and are likely to cross-hybridize on the microarrays. (B)The bar graphs depict the averagechange in expression for the genesshown in (A) in each of the strainstested.
Yeast Expression Responses to Stress
Vol. 11, December 2000 4253

reduction inhibits protein folding in the ER, triggering theunfolded protein response (Cox et al., 1993; Jamsa et al., 1994;Travers et al., 2000). Surprisingly, initiation of the ESR didnot occur until hours after DTT exposure, suggesting thatsecondary effects of DTT treatment eventually triggered thisresponse. Indeed, the late induction of genes involved in cellwall synthesis, concomitant with the induction of signalingsystems involved in the response to cell wall damage, sug-gests that the accumulation of cell wall defects ultimatelyinitiated the ESR and that, in response to DTT treatment,ESR expression may be governed by regulatory systemsspecific to cell wall perturbations. Cell wall defects mayresult from prolonged impairment of secretion, and theymay be exacerbated by direct effects of DTT on cell walldisulfide linkages (Cappellaro et al., 1998).
Diamide The expression response elicited by the sulfhydryl-oxidant diamide resembled a composite of the responses toheat shock, H2O2 and menadione, and DTT. For example,genes involved in protein folding and respiration were in-duced by diamide in a manner similar to heat shock. Geneswhose products are implicated in the response to alteredcellular redox potential and defense against reactive oxygenspecies were also strongly induced, as they were duringH2O2 and menadione treatment. Finally, like DTT treatment,diamide induced many putative cell wall biosynthesisgenes, as well as genes involved in protein secretion andprocessing in the ER. These observations suggest that dia-mide has pleiotropic effects, including protein unfoldingfollowing oxidation of protein sulfhydryl groups, oxidativestress resulting from the sulfhydryl modification, and de-fects in secretion and, ultimately, cell wall damage due toimproper disulfide bond formation in the ER.
Hyperosmotic Shock The genomic expression response tosorbitol osmotic shock included only a few genes whoseexpression was specifically affected by this condition, butthere were two unique features to this response. First, theglobal expression response to sorbitol was extremely tran-sient, perhaps indicative of the relatively minor cellularchanges required for adaptation to hyperosmolarity. Sec-ond, numerous genes that were generally induced in theESR appeared to be super-induced in response to sorbitol,pointing to systems that were selectively called into play inthis response. Among the earliest and strongest responseswas the induction of ESR genes involved in the synthesisand regulation of critical internal osmolytes, including glyc-erol and trehalose. Interestingly, other ESR genes, includingoxidoreductases and cytosolic catalase, were superinducedin response to sorbitol, for reasons that are not understood.
Starvation Carbon and nitrogen starvation elicited dramaticglobal changes in the gene expression program. A more exten-sive discussion of genomic responses to starvation will bepresented elsewhere (Kao et al., unpublished data). Whilemany of the metabolic changes during starvation have beendescribed previously, thousands of genes that are known toparticipate in other cellular processes or have completely un-known functions showed significant, and previously unrecog-nized, expression changes during the response to starvation.Many of the starvation-specific expression alterations may berationalized by the fact that starvation involves a transitionfrom active growth to growth arrest, in contrast to the response
to other stresses in which cells resume growth after adapting tothe new conditions. Furthermore, gradual nutrient starvationalso involves changes in multiple environmental parametersover time, such as cell density, pH, and the successive deple-tion of various nutrients, which contribute to the complextemporal pattern of gene expression during starvation (Kao etal., unpublished data).
DISCUSSION
To survive in natural environments, microorganisms mustbe able to respond swiftly and appropriately to suddenenvironmental changes, adapting to the unique features ofeach environment. The genomic expression programs char-acterized in this study reveal that yeast cells respond toenvironmental changes by altering the expression of thou-sands of genes, creating a genomic expression program thatis customized for each environment. These genomic pro-grams include features that are specific to each stress, re-flecting gene products specifically called into play underthose conditions. In addition, a remarkable fraction of thegenome responds in a stereotypical manner following envi-ronmental stress, as part of a program we refer to as the ESR.
Role of the ESRThe ESR is initiated not only by conditions known tothreaten cellular viability (data not shown), but also by smallenvironmental changes that do not detectably impair viabil-ity and growth. Nonetheless, the response appears to bespecific to transitions to environments less optimal forgrowth and survival. It is not triggered, for example, whencells adapted to growth at elevated temperatures or hyper-osmolarity are suddenly shifted to standard growth condi-tions. Based on these observations, we propose that the ESRis a general adaptive response to suboptimal environments.We hypothesize that, when a cell is shifted to an environ-ment for which its physiological systems are not optimized,the specific cellular consequences resulting from the shiftcan lead to a series of secondary instabilities within the cell,potentially threatening many key physiological systems.Thus, the genome has evolved to initiate the ESR to protectand maintain critical features of the yeast cell’s internalsystem in response to diverse signs of potential trouble.
The functions of the characterized genes in the ESR pro-vide clues to cellular features that are protected under stress-ful conditions. The requirement to conserve energy is likelyan important feature of all stress responses, and the ESRpresumably aids this effort by rapidly repressing hundredsof genes involved in protein synthesis and cellular growth.The characterized genes induced in the ESR participate in adiverse range of cellular processes, including energy gener-ation and storage, defense against reactive oxygen species,synthesis of internal osmolytes, protein folding and turn-over, and DNA repair, and together these may representphysiological systems that must be protected under anycircumstance. Indeed, the broad protection of these systemsby the ESR probably accounts for the observed cross-resis-tance to various stresses, in which cells exposed to a lowdose of one stress become resistant to an otherwise low doseof a second, unrelated stress (Hohmann and Mager, 1997).
The ESR is a graded response. The magnitude of thechanges in gene expression, as well as the duration and
Gasch et al.
Molecular Biology of the Cell4254

amplitude of the transient expression changes seen when theresponse is initiated, is graded to the severity of the envi-ronmental stress (this work and data not shown). This cor-relation suggests that the ESR responds in proportion to thedeviation of key physiological systems from a homeostaticset-point. The signals from different pathways that respondto distinct physiological perturbations appear to be inte-grated in transducing an overall measure of this deviationfrom homeostasis. Thus, initiation of the ESR may provide auseful operational definition of suboptimal environments,and expression of the program can therefore serve as amolecular gauge of the level of stress experienced by the cell.
Regulation of the Environmental Stress ResponseWhile the ESR displays stereotypical expression changesunder diverse types of environmental shifts, we have shownthat its regulation is both gene-specific and condition-spe-cific. The expression of genes in the ESR is regulated bydifferent transcription factors depending on the conditions,and the response is governed by several different upstreamsignaling pathways. For example, the repression of genesencoding ribosomal proteins, and the induction of some ofthe genes we find induced in the ESR, have previously beenshown to be regulated by the PKA pathway in response tonutritional signals and by the PKC pathway following inhi-bition of secretion (Klein and Struhl, 1994; Neuman-Silber-berg et al., 1995; Nierras and Warner, 1999), suggesting thatthe PKA pathway may govern the entire ESR in response tonutritional signals, while the PKC pathway plays a key rolein ESR initiation when secretion is impaired. The inductionof many genes we find induced in the ESR was also shownto be dependent on the high osmolarity glycerol (HOG)pathway in response to osmotic stress (Rep et al., 2000),suggesting the involvement of the HOG pathway in ESRregulation under those conditions. In response to DNA-damaging agents, the ESR is governed by the DNA damage-specific Mec1 pathway; the Mec1 pathway appears to playno role in ESR regulation in response to heat shock, suggest-ing the specific involvement of this pathway following DNAdamage (Gasch, Huang, Botstein, Elledge, Brown; manu-script in preparation). In addition to regulating the ESR,each of these signaling systems has also been implicated inregulating more specialized gene expression responses.Thus, these pathways simultaneously regulate the expres-sion of both the ESR and specialized responses specific to thestimuli that activate the pathways.
Our results suggest that, in response to each environmen-tal change, yeast cells simultaneously yet independentlydetect many distinct cellular signals and create a genomicexpression program that integrates the individual responsesto each of these signals. Evidence for composite expressionprograms is provided by the response of cells subjected to ashift to lower osmolarity in combination with mild temper-ature shock, which can be closely approximated as the sumof the individual responses. The additive response to mul-tiple signals of physiological stress may allow the cell tocustomize its response to the specific features of the newenvironment. An example of such emergent genomic ex-pression programs is provided by the response to diamide,which shares specific features of the responses to severalother stresses, and which suggests that the pleiotropic effects
of this agent trigger specific responses to misfolded proteins,redox stress, and secretion and cell wall defects.
Accounting for the Large Transient Changes inGenomic Expression following EnvironmentalChangesImmediately following stressful environmental changes, thecell responds with rapid and dramatic alterations in globalgene expression, but as the cell adapts to growth at the newconditions, the gene expression program adjusts to a newsteady-state that may be only slightly altered from the pro-gram seen before the environmental change. We considertwo models for the physiological role of the large, transientchanges in gene expression. One possibility is that the geneproducts affected play important roles mainly during thetransient period of adaptation to the new conditions. In thismodel, transient changes in transcript levels would be ac-companied by transient changes in the corresponding pro-tein levels. We favor an alternative model, in which thelarge, transient changes in transcript levels serve as a load-ing dose, providing rapid, but relatively small, alterations inthe corresponding protein levels to the new steady-stateconcentrations appropriate to the new environment. Afterthe new optimal protein concentrations are achieved, onlysubtle differences in transcript levels are required to main-tain those subtly-altered protein concentrations. The lattermodel is supported by the observation that, in response toheat shock, the transient changes in transcripts encodingprotein folding chaperones do not lead to transient changesin the corresponding protein levels, but rather result in asteady increase in the levels of chaperones until they reachthe appropriate steady-state levels (S. Lindquist, personalcommunication). Future experiments evaluating the changesin the levels of protein products of genes regulated by en-vironmental stress will further test the validity of this model.
CONCLUSION
The detailed characterization of global expression programstriggered by environmental stress is a first step towarddefining the role of each gene and each physiological systemin cellular adaptation to environmental change. This studysuggests hypotheses for the mechanisms yeast employ tosurvive environmental stress, and raises many questionsregarding the role and regulation of the observed genomicexpression responses. How initiation of the ESR contributesto cellular resistance to various stresses is an importantquestion in understanding the role of this program in theyeast life cycle. This work has provided a partial sketch ofthe complex regulation of this critical physiological pro-gram. More complete identification and mapping of theregulatory circuits that govern the ESR and the more spe-cialized genomic responses to stress will help us understandthe remarkable ability of yeast and other organisms to rec-ognize and survive stressful and unstable environments.
ACKNOWLEDGMENTS
We thank Joe DeRisi for the original msn2 msn4 double-deletionstrain and Tae Bum Shin for overexpression constructs. Specialthanks to Christian Rees, Gavin Sherlock, and especially Ash Aliza-deh for invaluable help with construction of the companion website,
Yeast Expression Responses to Stress
Vol. 11, December 2000 4255

and Mark Schroeder, Gavin Sherlock, and the curators of Saccharo-myces Genome Database (SGD) for computer support. We thankSusan Lindquist, Sean O’Rourke, Ira Herskowitz, Jonathan Warner,Anders Blomberg, Judith Frydman, Jim Garrels, Christoph Schuller,Max Diehn, Ash Alizadeh, Jennifer Boldrick, Oliver Rando, andmembers of the Brown and Botstein labs for helpful discussions.Much of the analysis presented here was possible due to genomedatabases, in particular SGD and the Yeast Protein Database (YPD).This work was supported by grants from the National Institutes ofHealth (HG-00450 and HG-00983) and by the Howard HughesMedical Institute. P.O.B is an associate investigator of the HowardHughes Medical Institute.
REFERENCES
Bailey, T.L., and Elkan, C. (1994). Fitting a mixture model by expec-tation maximization to discover motifs in biopolymers. Conferenceon Intelligent systems for Molecular Biology. AAAl Press: MenloPark, CA, 28–36.
Ball, C.A., Dolinski, K., Dwight, S.S., Harris, M.A., Issel-Tarver, L.,Kasarskis, A., Scafe, C.R., Sherlock, G., Binkley, G., Jin, H., Kaloper,M., Orr, S.D., Schroeder, M., Weng, S., Zhu, Y., Botstein, D., andCherry, J.M. (2000). Integrating functional genomic information intothe Saccharomyces genome database. Nucleic. Acids. Res.28, 77–80.
Boy-Marcotte, E., Perrot, M., Bussereau, F., Boucherie, H., and Jac-quet, M. (1998). Msn2p and Msn4p control a large number of genesinduced at the diauxic transition which are repressed by cyclic AMPin Saccharomyces cerevisiae. J. Bacteriol. 180, 1044–1052.
Cappellaro, C., Mrsa, V., and Tanner, W. (1998). New potential cellwall glucanases of Saccharomyces cerevisiae and their involvement inmating. J. Bacteriol 180, 5030–5037.
Cox, J.S., Shamu, C.E., and Walter, P. (1993). Transcriptional induc-tion of genes encoding endoplasmic reticulum resident proteinsrequires a transmembrane protein kinase. Cell 73, 1197–1206.
DeRisi, J.L., Iyer, V.R., and Brown, P.O. (1997). Exploring the met-abolic and genetic control of gene expression on a genomic scale.Science 278, 680–686.
Dey, N.B., Bounelis, P., Fritz, T.A., Bedwell, D.M., and Marchase,R.B. (1994). The glycosylation of phosphoglucomutase is modulatedby carbon source and heat shock in Saccharomyces cerevisiae. J. Biol.Chem. 269, 27143–27148.
Eisen, M.B., Spellman, P.T., Brown, P.O., and Botstein, D. (1998).Cluster analysis and display of genome-wide expression patterns.Proc. Natl. Acad. Sci. USA 95, 14863–14868.
Fernandes, L., Rodrigues-Pousada, C., and Struhl, K. (1997). Yap, anovel family of eight bZIP proteins in Saccharomyces cerevisiae withdistinct biological functions. Mol. Cell Biol. 17, 6982–6993.
Gorner, W., Durchschlag, E., Martinez-Pastor, M.T., Estruch, F.,Ammerer, G., Hamilton, B., Ruis, H., and Schuller, C. (1998). Nu-clear localization of the C2H2 zinc finger protein Msn2p is regulatedby stress and protein kinase A activity. Genes. Dev. 12, 586–597.
Green, M.J., and Hill, H.A. (1984). Chemistry of dioxygen. Meth.Enzymol. 105, 3–22.
Hardie, D.G. (1999). Roles of the AMP-activated/SNF1 protein ki-nase family in the response to cellular stress. Biochem. Soc.Symp.64, 13–27.
Hardie, D.G., and Carling, D. (1997). The AMP-activated proteinkinase: fuel gauge of the mammalian cell? Eur. J. Biochem.246,259–273.
Hohmann, S., and Mager, W.H. (1997). Yeast stress responses. NewYork, NY:Chapman & Hall,
Hounsa, C.G., Brandt, E.V., Thevelein, J., Hohmann, S., and Prior,B.A. (1998). Role of trehalose in survival of Saccharomyces cerevisiaeunder osmotic stress. Microbiology 144, 671–680.
Huang, D., Moffat, J., Wilson, W.A., Moore, L., Cheng, C., Roach,P.J., and Andrews, B. (1998). Cyclin partners determine Pho85 pro-tein kinase substrate specificity in vitro and in vivo: control ofglycogen biosynthesis by Pcl8 and Pcl10. Mol. Cell. Biol. 18, 3289–3299.
Hughes, J.D., Estep, P.W., Tavazoie, S., and Church, G.M. (2000).Computational identification of cis-regulatory elements associatedwith groups of functionally related genes in Saccharomyces cerevisiae.J. Mol. Biol. 296, 1205–1214.
Hwang, P.K., Tugendreich, S., and Fletterick, R.J. (1989). Molecularanalysis of GPH1, the gene encoding glycogen phosphorylase inSaccharomyces cerevisiae. Mol. Cell. Biol. 9, 1659–1666.
Jamieson, D.J. (1998). Oxidative stress responses of the yeast Saccha-romyces cerevisiae. Yeast 14, 1511–1527.
Jamsa, E., Simonen, M., and Makarow, M. (1994). Selective retentionof secretory proteins in the yeast endoplasmic reticulum by treat-ment of cells with a reducing agent. Yeast 10, 355–370.
Klein, C., and Struhl, K. (1994). Protein kinase A mediates growth-regulated expression of yeast ribosomal protein genes by modulat-ing RAP1 transcriptional activity. Mol. Cell. Biol.14, 1920–1928.
Kobayashi, N., and McEntee, K. (1993). Identification of cis andtrans components of a novel heat shock stress regulatory pathway inSaccharomyces cerevisiae. Mol. Cell Biol. 13, 248–256.
Li, B., Nierras, C.R., and Warner, J.R. (1999). Transcriptional ele-ments involved in the repression of ribosomal protein synthesis.Mol. Cell. Biol. 19, 5393–5404.
Mager, W.H., and De Kruijff, A.J. (1995). Stress-induced transcrip-tional activation. Microbiol. Rev. 59, 506–531.
Marchase, R.B., Bounelis, P., Brumley, L.M., Dey, N., Browne, B.,Auger, D., Fritz, T.A., Kulesza, P., and Bedwell, D.M. (1993). Phos-phoglucomutase in Saccharomyces cerevisiae is a cytoplasmic glyco-protein and the acceptor for a Glc-phosphotransferase. J. Biol.Chem.268, 8341–8349.
Marchler, G., Schuller, C., Adam, G., and Ruis, H. (1993). A Saccha-romyces cerevisiae UAS element controlled by protein kinase A acti-vates transcription in response to a variety of stress conditions.EMBO J. 12, 1997–2003.
Martinez-Pastor, M.T., Marchler, G., Schuller, C., Marchler-Bauer,A., Ruis, H., and Estruch, F. (1996). The Saccharomyces cerevisiae zincfinger proteins Msn2p and Msn4p are required for transcriptionalinduction through the stress response element (S.T.R.E). EMBO J.15, 2227–2235.
Moehle, C.M., and Hinnebusch, A.G. (1991). Association of RAP1binding sites with stringent control of ribosomal protein gene tran-scription in Saccharomyces cerevisiae. Mol. Cell. Biol. 11, 2723–2735.
Moskvina, E., Schuller, C., Maurer, C.T., Mager, W.H., and Ruis, H.(1998). A search in the genome of Saccharomyces cerevisiae for genesregulated via stress response elements. Yeast 14, 1041–1050.
Mumberg, D., Muller, R., and Funk, M. (1994). Regulatable promot-ers of Saccharomyces cerevisiae: comparison of transcriptional activityand their use for heterologous expression. Nucleic. Acids. Res. 22,5767–5768.
Neuman-Silberberg, F.S., Bhattacharya, S., and Broach, J.R. (1995).Nutrient availability and the RAS/cyclic AMP pathway both induceexpression of ribosomal protein genes in Saccharomyces cerevisiae butby different mechanisms. Mol. Cell. Biol. 15, 3187–3196.
Nierras, C.R., and Warner, J.R. (1999). Protein kinase C enables theregulatory circuit that connects membrane synthesis to ribosomesynthesis in Saccharomyces cerevisiae. J. Biol Chem. 274, 13235–13241.
Gasch et al.
Molecular Biology of the Cell4256

Norbeck, J., and Blomberg, A. (1997). Metabolic and regulatorychanges associated with growth of Saccharomyces cerevisiae in 1.4 MNaCl. Evidence for osmotic induction of glycerol dissimilation viathe dihydroxyacetone pathway. J. Biol. Chem. 272, 5544–5554.
Parrou, J.L., Enjalbert, B., Plourde, L., Bauche, A., Gonzalez, B., andFrancois, J. (1999). Dynamic responses of reserve carbohydrate me-tabolism under carbon and nitrogen limitations in Saccharomycescerevisiae. Yeast. 15, 191–203.
Parrou, J.L., Teste, M.A., and Francois, J. (1997). Effects of varioustypes of stress on the metabolism of reserve carbohydrates in Sac-charomyces cerevisiae: genetic evidence for a stress-induced recyclingof glycogen and trehalose. Microbiology. 143, 1891–1900.
Rep, M., Krantz, M., Thevelein, J.M., and Hohmann, S. (2000). Thetranscriptional response of Saccharomyces cerevisiae to osmotic shock.Hot1p and Msn2p/Msn4p are required for the induction of subsetsof high osmolarity glycerol pathway-dependent genes. J. Biol.Chem. 275, 8290–8300.
Rep, M., Reiser, V., Gartner, U., Thevelein, J.M., Hohmann, S.,Ammerer, G., and Ruis, H. (1999). Osmotic stress-induced geneexpression in Saccharomyces cerevisiae requires Msn1p and the novelnuclear factor Hot1p. Mol. Cell. Biol. 19, 5474–5485.
Ruis, H., and Schuller, C. (1995). Stress signaling in yeast. Bioessays17, 959–965.
Schnell, N., Krems, B., and Entian, K.D. (1992). The PAR1 (YAP1/SNQ3) gene of Saccharomyces cerevisiae, a c-jun homologue, is in-volved in oxygen metabolism. Curr. Genet.21, 269–273.
Shalon, D., Smith, S.J., and Brown, P.O. (1996). A DNA microarraysystem for analyzing complex DNA samples using two-color fluo-rescent probe hybridization. Genome. Res. 6, 639–645.
Sherman, F. (1991). Getting started with yeast. In: Guide to YeastGenetics and Molecular Biology, ed. G.R. Fink, San Diego, CA:Academic Press, 3–21.
Singer, M.A., and Lindquist, S. (1998). Multiple effects of trehaloseon protein folding in vitro and in vivo. Mol. Cell. 1, 639–648.
Smith, A., Ward, M.P., and Garrett, S. (1998). Yeast PKA repressesMsn2p/Msn4p-dependent gene expression to regulate growth,stress response and glycogen accumulation. EMBO J.17, 3556–3564.
Stephen, D.W., Rivers, S.L., and Jamieson, D.J. (1995). The role of theYAP1 and YAP2 genes in the regulation of the adaptive oxidativestress responses of Saccharomyces cerevisiae. Mol. Microbiol. 16, 415–423.
Travers, K.J., Patil, C.K., Wodicka, L., Lockhart, D.J., Weissman, J.S.,and Walter, P. (2000). Functional and genomic analyses reveal anessential coordination between the unfolded protein response andER-associated degradation. Cell 101, 249–258.
Warner, J.R. (1999). The economics of ribosome biosynthesis inyeast. Trends Biochem Sci. 24, 437–440.Zahringer, H., Burgert, M., Holzer, H., and Nwaka, S. (1997). Neutraltrehalase Nth1p of Saccharomyces cerevisiae encoded by the NTH1 geneis a multiple stress responsive protein. FEBS. Lett.412, 615–620.
Online References
The following references are cited in the supplemental material avail-able online at: http://www.genome.stanford.edu/yeast stress.
Jung, U.S., and Levin, D.E. (1999). Genome-wide analysis of geneexpression regulated by the yeast cell wall integrity signalingpathway [In Process Citation]. Mol. Microbiol. 34, 1049–1057.
Kawahara, T., Yanagi, H., Yura, T., and Mori, K. (1997). Endoplas-mic reticulum stress-induced mRNA splicing permits synthesis oftranscription factor Hac1p/Ern4p that activates the unfolded pro-tein response. Mol. Biol. Cell 8, 1845–1862.
Liu, X.D., Morano, K.A., and Thiele, D.J. (1999). The yeast Hsp110family member, Sse1, is an Hsp90 cochaperone. J. Biol. Chem. 274,26654–26660.
Mattison, C.P., Spencer, S.S., Kresge, K.A., Lee, J., and Ota, I.M. (1999).Differential regulation of the cell wall integrity mitogen-activatedprotein kinase pathway in budding yeast by the protein tyrosinephosphatases Ptp2 and Ptp3. Mol. Cell. Biol. 19, 7651–7660.
Morano, K.A., Santoro, N., Koch, K.A., and Thiele, D.J. (1999). Atrans-activation domain in yeast heat shock transcription factor isessential for cell cycle progression during stress. Mol. Cell. Biol.19, 402–411
Mori, K., Ogawa, N., Kawahara, T., Yanagi, H., and Yura, T. (1998).Palindrome with spacer of one nucleotide is characteristic of thecis- acting unfolded protein response element in Saccharomycescerevisiae. J Biol Chem. 273, 9912–9920.
Payne, W.E., and Garrels, J.I. (1997). Yeast protein database (YPD):a database for the complete proteome of Saccharomyces cerevisiae.Nucleic. Acids. Res. 25, 57–62.
Schmitt, A.P., and McEntee, K. (1996). Msn2p, a zinc finger DNA-binding protein, is the transcriptional activator of the multistressresponse in Saccharomyces cerevisiae. Proc Natl Acad Sci USA. 93,5777–5782.
Tamai, K.T., Liu, X., Silar, P., Sosinowski, T., and Thiele, D.J. (1994).Heat shock transcription factor activates yeast metallothionein geneexpression in response to heat and glucose starvation via distinctsignaling pathways. Mol. Cell. Biol.14, 8155–8165.
Winzeler, E.A., Shoemaker, D.D., Astromoff, A., Liang, H.,Anderson, K., Andre, B., Bangham, R., Benito, R., Boeke, J.D.,Bussey, H., and et al. (1999). Functional characterization of theS. cerevisiae genome by gene deletion and parallel analysis.Science 285, 901–906.
Yeast Expression Responses to Stress
Vol. 11, December 2000 4257