geochemistry geophysics geosystemsgeofaculty.uwyo.edu/ksims7/pubs/simsetalaberrantg-cubed03.pdf ·...
TRANSCRIPT

Aberrant youth: Chemical and isotopic constraints on theorigin of off-axis lavas from the East Pacific Rise, 9�–10�N
K. W. W. SimsDepartment of Geology and Geophysics, Woods Hole Oceanographic Institution, MS #22 Woods Hole Road, Woods Hole,Massachusetts 02543, USA ([email protected])
J. Blichert-ToftLaboratoire des Sciences de la Terre, CNRS UMR 5570, Ecole Normale Superieure de Lyon 46, Allee d’Italie, 69364Lyon Cedex 7, France ( [email protected])
D. J. FornariDepartment of Geology and Geophysics, Woods Hole Oceanographic Institution, MS #22 Woods Hole Road, Woods Hole,Massachusetts 02543, USA ([email protected])
M. R. PerfitDepartment of Geological Sciences, University of Florida, 241 Williamson Hall, P.O. Box 112120, Gainesville, Florida32611-2120, USA ([email protected] l.edu)
S. J. GoldsteinGroup C-INC, Isotope and Nuclear Chemistry, Los Alamos National Laboratory MS J514, Los Alamos, New Mexico87545, USA ([email protected])
P. JohnsonHawaii Mapping Research Group, University of Hawaii, SOEST, Honolulu, Hawaii 96822, USA([email protected])
D. J. DePaoloCenter for Isotope Geochemistry, Earth and Planetary Science Department MC4767, University of California, Berkeley,California 94720-4767, USA ([email protected])
S. R. HartDepartment of Geology and Geophysics, Woods Hole Oceanographic Institution, MS #22 Woods Hole Road, Woods Hole,Massachusetts 02543, USA ([email protected])
M. T. MurrellGroup C-INC, Isotope and Nuclear Chemistry, Los Alamos National Laboratory MS J514, Los Alamos, New Mexico87545, USA ([email protected])
P. J. MichaelDepartment of Geosciences, University of Tulsa, 600 S. College Avenue, Tulsa, Oklahoma 74104, USA([email protected])
G. D. LayneDepartment of Geology and Geophysics, Woods Hole Oceanographic Institution, MS #22 Woods Hole Road, Woods Hole,Massachusetts 02543, USA ([email protected])
G3G3GeochemistryGeophysics
Geosystems
Published by AGU and the Geochemical Society
AN ELECTRONIC JOURNAL OF THE EARTH SCIENCES
GeochemistryGeophysics
Geosystems
Article
Volume 4, Number 10
4 October 2003
8621, doi:10.1029/2002GC000443
ISSN: 1525-2027
Copyright 2003 by the American Geophysical Union 1 of 27

L. A. BallDepartment of Marine Chemistry and Geochemistry, Woods Hole Oceanographic Institution, Woods Hole Road, WoodsHole, Massachusetts 02543, USA ([email protected])
[1] We report measurements of U-series disequilibria, Sr, Nd, Hf, and Pb isotopic compositions and major
and trace element abundances in a suite of well-located, off-axis MORBs that span the East Pacific Rise
(EPR) ridge crest from 9�480–520N and across it for �4 km on either side. The geological context of the
samples are well constrained as they were collected by submersible in an area that has been extensively
imaged by remote sensing techniques. Sr, Nd, Hf and 208Pb/206Pb isotopic compositions of the off-axis
N-MORB are identical to the axial lavas from this same region, suggesting that their sources are similar
and that melting processes are the dominant influence in establishing the U-Th-Ra disequilibria and trace
element fractionations. A majority of off-axis samples have U-Th and Th-Ra disequilibria that are larger,
and model ages that are younger, than would be predicted from their off-axis distance and the
time-integrated spreading rate. There are, however, a few off-axis samples with U-Th ages that are
consistent with their spreading rate ages. It is likely that these samples erupted within or close to the axial
summit trough (AST) and aged at a rate proportional to the spreading rate. The anomalously young ages
determined for most of the off-axis lavas suggest that volcanic construction along this region is occurring
over a zone that is wider (at least 4 km) than the AST (10s to 100s of meters). The combined observational,
chemical and isotopic data support a model for the 9�00N area that includes a significant component
of crustal accumulation resulting from lavas that breach the AST and flow down the flanks of the EPR
ridge crest. However, these data also require a minor component of off-axis eruptions that occur on distinct
pillow mounds and ridges. This suggests that MOR construction involves several volcanic and tectonic
processes acting in concert to form a complex patchwork of lava ages and compositions along, and across,
this fast spreading ridge crest.
Components: 13,987 words, 12 figures, 7 tables.
Keywords: Mantle source composition; U-series disequilibria; mid-ocean ridge processes; isotope geochemistry; off-axis
volcanism; melt generation and magma transport.
Index Terms: 1040 Geochemistry: Isotopic composition/chemistry; 3035 Marine Geology and Geophysics: Midocean ridge
processes; 3640 Mineralogy and Petrology: Igneous petrology; 8434 Volcanology: Magma migration.
Received 13 September 2002; Revised 20 June 2003; Accepted 18 July 2003; Published 4 October 2003.
Sims, K. W. W., et al., Aberrant youth: Chemical and isotopic constraints on the origin of off-axis lavas from the East Pacific
Rise, 9�–10�N, Geochem. Geophys. Geosyst., 4(10), 8621, doi:10.1029/2002GC000443, 2003.
————————————
Theme: The Oman Ophiolite and Mid-Ocean Ridge ProcessesGuest Editors: Peter Kelemen, Chris MacLeod, and Susumu Umino
1. Introduction
[2] The fast spreading East Pacific Rise (EPR),
from 9�–10�N, is one of the most intensively
sampled sites along the world’s mid-ocean ridges,
with over 1200 rock samples collected via rock
core, dredge and submersible [Batiza and Niu,
1992; Perfit et al., 1994; Perfit and Chadwick,
1998; Smith et al., 2001, and references therein].
Although geological mapping, qualitative age con-
straints and remote sensing data suggest much of
the recent volcanic activity along 9�–10�N EPR
has been largely confined to the narrow axial
summit trough (AST) [e.g., Haymon et al., 1991;
Fornari et al., 1998; Perfit and Chadwick, 1998;
Schouten et al., 2001], three key observations
indicate that volcanic construction along this
section of the EPR may actually occur over a zone
GeochemistryGeophysicsGeosystems G3G3
sims et al.: aberrant youth 10.1029/2002GC000443
2 of 27
that is considerably wider than the AST: (1) Recent
seismic studies suggest that seismic layer 2A,
inferred to be the extrusive crust, doubles in
thickness away from the AST, over a region up
to several kilometers wide [Christeson et al., 1994;
1996; Harding et al., 1993; Vera and Diebold,
1993; Schouten et al., 1999, 2001]; (2) Off-axis
observations during submersible dives have docu-
mented flows and pillow mounds that appear to be
younger than the surrounding lavas [Macdonald et
al., 1996; Perfit et al., 1994; Perfit and Chadwick,
1998]; (3) U-series model eruption ages have
identified basalts located up to 4 km from the
AST that are younger than would be inferred from
crustal spreading rates [Goldstein et al., 1992,
1993, 1994].
[3] Two models of crustal genesis have been
proposed to explain the observed off-axis thicken-
ing of the extrusive section of the oceanic crust
(i.e., seismic layer 2A) and the existence of anom-
alously young ages for off-axis basalts. One model
suggests the extrusive crust is being built by
frequent small volume flows confined largely
within the AST and less frequent large flows that
breach the AST and flow off-axis for several kilo-
meters through surface channels or subsurface
conduits [Hooft et al., 1996]. The other model
proposes that small volume flows, with distinct
compositions and sources, erupt off-axis along
ridge-parallel fissures and faults [Perf it et al.,
1994; Goldstein et al., 1992, 1994; White et al.,
2002; Reynolds and Langmuir, 2000].
[4] While off-axis volcanism has been inferred to
be an important component in the construction of
the 9�–10�N EPR crustal section [Christeson et
al., 1992, 1994, 1996; Harding et al., 1993; Perfit
et al., 1994; Goldstein et al., 1994], a lack of
constraints on the ages and isotopic compositions
of off-axis lavas has resulted in uncertainty
regarding the temporal and genetic context of
off-axis magmatism. Here, we present U-Th-Ra
disequilibria results in conjunction with elemental
data and Sr, Nd, Hf, and Pb isotopic compositions
for 14 samples selected from a large, two-dimen-
sional suite of off-axis MORB that span the ridge
crest between 9� 480–520N for �4 km on both
sides of the axis. Two important aspects of this
study should be noted. First, the geological con-
text of the samples are well constrained; the
samples were collected by submersible in an area
that has now been extensively imaged by remote
sensing techniques including side-scan sonar, high
resolution altimetric data, and deep sea photogra-
phy [Fornari et al., 1998; Kurras, 2000; Schouten
et al., 2001, 2002]. Second, we have comprehen-
sively characterized young, axial basalts from the
most recently active portion of the 9�–10�N EPR
segment in terms of major and trace element
compositions, U-Th-Ra and U-Pa disequilibria
and Sr, Nd, Hf, and Pb isotopic compositions
[Sims et al., 2002]. This baseline reference com-
bined with our knowledge of the geological con-
text of the off-axis lavas enables us to evaluate
whether the unusually ‘‘young’’ off-axis lavas
were erupted from vents/fissures off-axis, or
whether instead they were erupted within, or
proximal to, the AST, and flowed for considerable
distances (kilometers) down the axial high
through lava tubes and/or surface channels. Fur-
thermore, knowing the chemical and isotopic
compositions of the axial lavas further allows us
to use the U-Th-Ra disequilibria data to constrain
the extent and timing of off-axis volcanism and to
contrast the chemistries of the axial and off-axis
lavas in order to compare their sources and
genetic histories.
2. Sample Locations and GeologicalSetting of Off-Axis Lavas
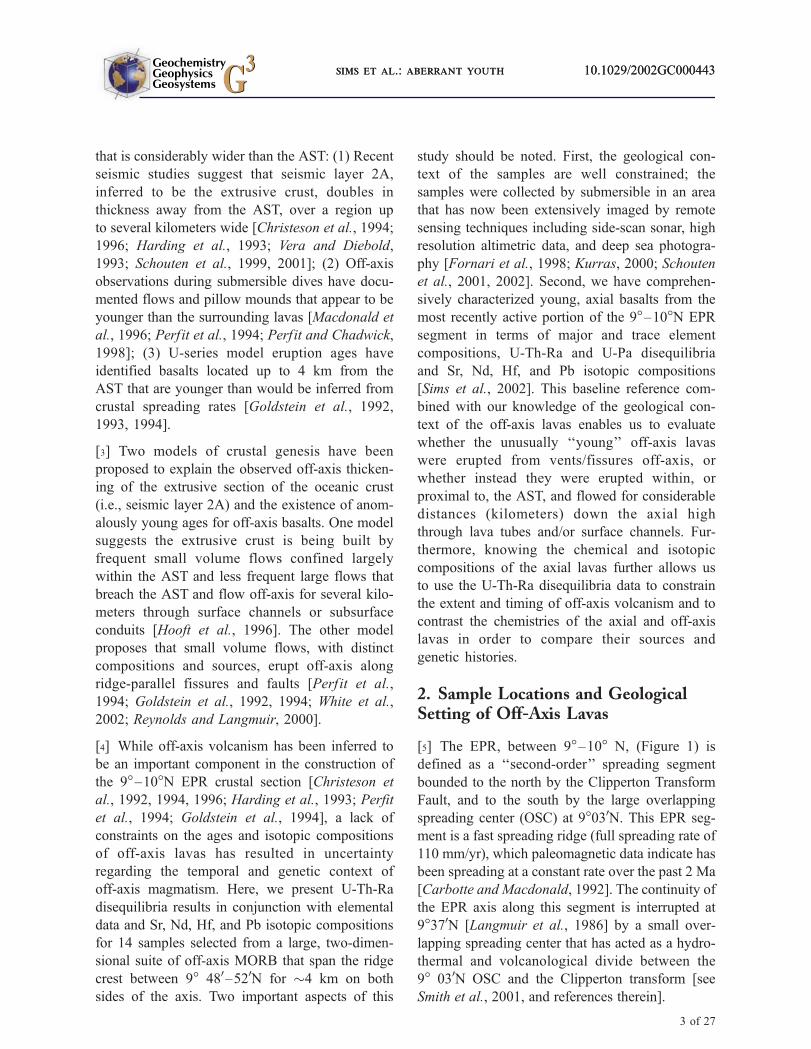
[5] The EPR, between 9�–10� N, (Figure 1) is
defined as a ‘‘second-order’’ spreading segment
bounded to the north by the Clipperton Transform
Fault, and to the south by the large overlapping
spreading center (OSC) at 9�030N. This EPR seg-
ment is a fast spreading ridge (full spreading rate of
110 mm/yr), which paleomagnetic data indicate has
been spreading at a constant rate over the past 2 Ma
[Carbotte and Macdonald, 1992]. The continuity of
the EPR axis along this segment is interrupted at
9�370N [Langmuir et al., 1986] by a small over-
lapping spreading center that has acted as a hydro-
thermal and volcanological divide between the
9� 030N OSC and the Clipperton transform [see
Smith et al., 2001, and references therein].
GeochemistryGeophysicsGeosystems G3G3
sims et al.: aberrant youth 10.1029/2002GC000443sims et al.: aberrant youth 10.1029/2002GC000443
3 of 27

[6] The focus of our study is the northern region of
this segment, from 9�480–520N. In the 9�480–520Nregion (hereafter called the 9�500N region) of the
EPR, the thickness of seismic layer 2A, increases
from �300 m at the ridge axis to �600 m at �2 km
off-axis [Christeson et al., 1994, 1996; Harding et
al., 1993; Vera and Diebold, 1994; Schouten et al.,
1999, 2001, 2002]. On the basis of analysis of
multibeam bathymetry and other parameters this
region appears to be the most magmatically robust
region of the 9�–10�N segment [Macdonald and
Fox, 1988; Scheirer and Macdonald, 1993]. In
cross-section, the ridge crest along 9�480–520N is
a broad axial high, 2–5 kilometers wide, bisected
by the axial summit trough (AST) [Fornari et al.,
1998]. The AST is a narrow trough, 10 to 100 m
wide and 10 to 50 m deep, and is the locus of
focused volcanism and hydrothermal activity along
the ridge crest. Volcanism in the AST is character-
ized by sheet flows, lava ponds and drain back
features [Haymon et al., 1991, 1993; Fornari et al.,
1998; Perfit and Chadwick, 1998]. Off-axis the
surface morphology and structural features change
across the ridge crest, creating two distinct off-axis
Figure 1. (a) Multibeam bathymetric map; 25 meter contour intervals. Yellow line is trace of AST based on 100 kHzside-scan sonar data collected in 1989 [Haymon et al., 1991; Fornari et al., 1998]. (b) Side-scan sonar image of theEPR crest from 9�480–9�500N EPR [Schouten et al., 2002]. This area has a narrow AST (<100 m wide and <15 mdeep). Young lobate and sheet lavas, which sometimes terminate in pillowed flow fronts, dominate the flanks of theridge crest adjacent to the AST. In plan view these lavas appear to interfinger and override each other forming aconvex outward ‘‘shingled’’ appearance out to about 1–2 km. Beyond this distance there are distinct pillow moundsand ridges up to �20 m high (some of these are outlined in red), located several kilometers off-axis, which do notappear to have been sourced from lava flows erupted within or adjacent to the AST. Symbols showing samplelocations are colored according to their MgO content (see key).
GeochemistryGeophysicsGeosystems G3G3
sims et al.: aberrant youth 10.1029/2002GC000443
4 of 27
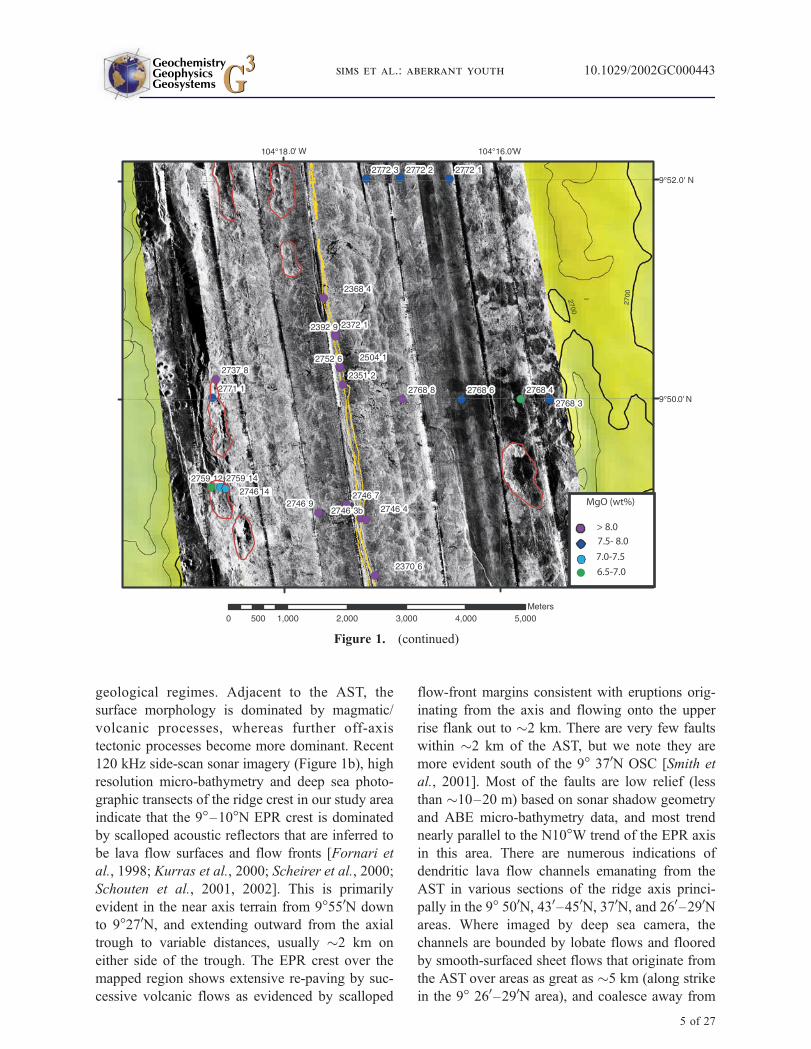
geological regimes. Adjacent to the AST, the
surface morphology is dominated by magmatic/
volcanic processes, whereas further off-axis
tectonic processes become more dominant. Recent
120 kHz side-scan sonar imagery (Figure 1b), high
resolution micro-bathymetry and deep sea photo-
graphic transects of the ridge crest in our study area
indicate that the 9�–10�N EPR crest is dominated
by scalloped acoustic reflectors that are inferred to
be lava flow surfaces and flow fronts [Fornari et
al., 1998; Kurras et al., 2000; Scheirer et al., 2000;
Schouten et al., 2001, 2002]. This is primarily
evident in the near axis terrain from 9�550N down
to 9�270N, and extending outward from the axial
trough to variable distances, usually �2 km on
either side of the trough. The EPR crest over the
mapped region shows extensive re-paving by suc-
cessive volcanic flows as evidenced by scalloped
flow-front margins consistent with eruptions orig-
inating from the axis and flowing onto the upper
rise flank out to �2 km. There are very few faults
within �2 km of the AST, but we note they are
more evident south of the 9� 370N OSC [Smith et
al., 2001]. Most of the faults are low relief (less
than �10–20 m) based on sonar shadow geometry
and ABE micro-bathymetry data, and most trend
nearly parallel to the N10�W trend of the EPR axis
in this area. There are numerous indications of
dendritic lava flow channels emanating from the
AST in various sections of the ridge axis princi-
pally in the 9� 500N, 430–450N, 370N, and 260–290Nareas. Where imaged by deep sea camera, the
channels are bounded by lobate flows and floored
by smooth-surfaced sheet flows that originate from
the AST over areas as great as �5 km (along strike
in the 9� 260–290N area), and coalesce away from
Figure 1. (continued)
GeochemistryGeophysicsGeosystems G3G3
sims et al.: aberrant youth 10.1029/2002GC000443
5 of 27

the trough at distances of �500 m to <1000 m
[Schouten et al., 2001, 2002]. Spacing between
these areas of inferred sheet flows can be from a
few hundred meters to several kilometers.
[7] Fields of �10–30 m high lava mounds or
ridges, several hundred meters wide and up to
�1 km long, occur at distances greater than
�1.5 km from the AST. At times the pillow
mounds appear cut by faults and fissures, while
in some areas their construction appears to be
younger than the tectonic features they overprint.
[8] These observational data suggest that three
types of volcanic emplacement have occurred.
(1) Eruptions from the AST that primarily result
in overlapping/onlapping lobate flows with local-
ized sheet flows. This terrain extends from the axis
to �1–1.5 km from the walls of the AST and give
the ridge crest a shingled appearance in plan view.
(2) Down-slope flow of lava erupted at or near the
AST that has moved through channelized surface
flows and lava tubes within the interiors of lobate
flows, into the off-axis environment. (3) Off-axis
fissure-fed or syntectonic eruptions that form pil-
low mounds and ridges commonly associated with
faulting and tectonism at distances of �1 km to
4 km off-axis. These magmatic and tectonic pro-
cesses produce a neovolcanic zone that is up to
4 km wide and results in a ‘‘patchwork’’ of lava
flows of potentially different ages [e.g., see Perfit
et al., 1994; Goldstein et al., 1993, 1994; Hooft et
al., 1996; Macdonald et al., 1996; Perf it and
Chadwick, 1998; Kurras et al., 2000].
[9] The locations and geological context of the
samples used for this study are well constrained
(Table 1; Figures 1 and 2). The samples were
collected using DSRV Alvin along �4 km long
transects that cross the EPR crest between 9�480–520N. Sample locations were chosen to maximize
across-axis spatial coverage and to encompass the
range of lava ages and morphologies observed
along the dive transects (e.g., they looked young
or old, and/or they were located along faults or
fissures, or a pillow ridge, etc.). As a result, the
samples used for this study provide insights into
the temporal and spatial evolution of the EPR crest,
and into the volcanic and tectonic processes
responsible for construction of the extrusive oce-
anic crust.
3. Results
3.1. Major and Trace Elements
[10] Major- and trace-element concentrations are
reported in Appendix 1 together with details on
analytical methods. All off-axis samples measured
in this study are tholeiitic, incompatible trace ele-
ment depleted, ‘‘normal MORB’’ (N-MORB) with
K2O/TiO2 < 0.10. Their major-element composi-
tions range from relatively primitive to evolved
(molar Mg-number ranging from 64 to 50). More
evolved samples have greater concentrations of
incompatible trace elements but have incompatible
trace element ratios (e.g., La/Yb, Sm/Nd and U/Th)
similar to those in basalts with higher Mg-numbers.
This group of off-axis samples also shows limited
variability in their MgO-normalized Na2O and FeO
contents (Na8 varies from 2.5 to 2.8, Fe8 varies
from 9.0 to 10.5) and normalized incompatible trace
element ratios (e.g., La/Yb, Sm/Nd and U/Th).
[11] With the exception of the most evolved sam-
ples, the major-element compositions of the off-
axis samples, as a whole (Figure 3, Appendix A),
are similar to the compositions reported for the
‘‘axial samples’’ from this region [Perf it and
Chadwick, 1998; Sims et al., 2002]. The 9�500Noff-axis samples have a slightly larger range of
trace element abundances than the axial samples
due to higher incompatible and lower compatible
trace element concentrations in the most evolved
off-axis basalts. However, despite this larger range
in trace element abundances (consistent with greater
extents of crystal fractionation), all of the off-axis
and axial samples show similar patterns on prim-
itive mantle-normalized trace element abundance
plots (Figure 4).
3.2. Radiogenic Isotopes: Sr, Nd, Hfand Pb
[12] Sr, Nd, Hf and Pb isotopic compositions for
our 9�500N off-axis samples are reported in Table 2
and shown in Figures 5 through 7. Analytical
methods are described in the footnotes to Table 2.
With the exception of one highly altered sample (see
GeochemistryGeophysicsGeosystems G3G3
sims et al.: aberrant youth 10.1029/2002GC000443
6 of 27

Table
1.
Sam
ple
LocationsandDescriptionsa
Sam
ple
Long.West
(Degree,
Decim
alMinutes)
Lat.North
(Degree,
Decim
alMinutes)
Tim
eof
Collection
Depth,m
Description
2737-8
104�18.623
9�50.188
13:27
2525
Pillow
from
pillow
ridgewithmoderatesedim
ent
cover.Aphyric,
glassyoutersurfaceisfresh-looking
withonly
slightsedim
entandMn-coating
2746-4
104�17.2884
9�48.922
11:37
2515
Youngdrained
outlobefrom
edgeofverycollapsed
ASC
eastwall.Appears
tobeyoungcrustof
lobateflow.Veryfreshandyoung-looking,very
slightMn-coating.Slightlyplag.phyricwithrare
crystal
clots.
2746-7
104�17.422
9�49.044
12:18
2516
Upper
crustoflobateflow
inafieldoflobateand
sheetflows,has
slightMn-andsedim
entcoating,
buthas
thick,freshglassytop.Mostly
aphyric
withrare
plagmicrophenocrysts.
2746-9
104�17.679
9�48.971
12:44
2533
Pillow
inahummockyarea
ofsm
allpillows.
Sam
ple
isfrom
asm
all,2–3m
highmound.
Veryirregularlyshaped
piece
that
appears
tomultiple
layers.Surfaceishackly
tobroken
probably
areflectionofmultiple
fillingand
drainingofthepillow.Moderateto
lightsedim
ent
andMn-coating;slightlyplag.andol.phyric.
2746-14
104�18.558
9�49.004
14:10
2658
Massiveold
flow
(�5m
thick);from
east-facing
(inward)faultscarpthat
is10–20m
highwith
heavysedim
entcover
ontopofscarp;has
polygonal
jointing,only
somethin
glass
remains
ontopsurface,
Heavilycoated
withMnO.Mostly
aphyric,
withrare
plag.andrarerol,(see
photo)
2759-12
104�18.666
9�49.202
13:08
2650
Pillow
recovered
from
topofinward-facingfault
scarp(sam
escarpas
2746-14);associated
witha
fissure
ontopoffaultscarp.ModerateMn-coating.
Nearlyaphyricwithrare
plag.microphenocrysts.
Notmuch
glass
onsurface.
2759-14
104�18.581
9�49.203
13:44
2664
Pillow
from
eastofthefaultscarpin
afieldof
moderatelysedim
entedpillows(see
SideScanim
age,
Figure
1b).Thick,glass
withrelativelythin
Mn-coatingandsedim
entcover.Slightlyplag-phyric.
2768-3
104�15.551
9�49.999
10:43
2675
Pillow
basaltbudwithextensivesedim
entcover,part
ofsm
allflow
margin
(see
photo).In
area
ofshort-throw
faultsandlocalconstructional
escarpments.Sam
ple
isaphyricandMncoated.
2768-4
104�15.819
9�50.002
11:24
2611
Pillow
withthickMncoating.From
anarea
ofextensive
sedim
entandwell-decoratedpillow
lavas.Sam
ple
isaphyric,
chalkyandpartially
altered,withupto
1cm
Mn-crust.
GeochemistryGeophysicsGeosystems G3G3
sims et al.: aberrant youth 10.1029/2002GC000443
7 of 27

Sam
ple
Long.West
(Degree,
Decim
alMinutes)
Lat.North
(Degree,
Decim
alMinutes)
Tim
eof
Collection
Depth,m
Description
2768-6
104�16.363
9�50.002
12:21
2556
Pillow
cylinder
ortubefrom
asteepconstructional
escarpmentwithwell-form
edpillow
cylindersheading
downslope,
generally
heavysedim
entcover.Sam
ple
isglassywithminim
alsedim
entorMncoatings.
2768-8
104�16.907
9�50.005
01:37
2530
Lobateflow
from
anarea
withcurtain-folded
sheetflows
andcollapsedlobateflows;lightsedim
entcover
(see
photo).Sam
ple
isoftheglassylobatecrust,
relativelyfresh-looking,aphyricglass
withminim
alsedim
entcoating.
2771-1
104�18.655
9�50.02
Lobateflow
inmoderatelysedim
entedarea
oflow
relief.
Sam
ple
isplagphyric,
locallycoated
withMnand/or
traces
oforganic
remains.
2772-1
104�16.470
9�52.012
08:16
2556
Lobateflow;aphyricwiththickglassymargin,moderate
sedim
entandMncoating.
2772-2
104�16.921
9�52.021
09:08
2555
Lobateflow
from
collapse
area.Sam
ple
has
thickglassy
crustthat
isplagphyric;
Thin
Mncoatingandminim
alsedim
ent(see
photo).
2772-3
104�17.238
9�52.014
09:59
2557
Pillow
lavabudfrom
baseofscarp,moderatesedim
ent
cover
(see
photo).Sam
ple
isaphyricwithslight
Mncoating.
aSam
ple
collectedusingAlvin
[Haym
onet
al.,1993;Perfitet
al.,1994;Fornariet
al.,1998;PerfitandChadwick,
1998].Locationsarebased
ontransponder
navigationin
ALVIN
.Geological
and
petrological
descriptionssummarized
from
divetranscripts,hand-sam
ple
descriptionsat
sea,
anddivefilm
s.
Table
1.
(continued)a
GeochemistryGeophysicsGeosystems G3G3
sims et al.: aberrant youth 10.1029/2002GC000443
8 of 27

discussion below), the Sr, Nd, and Hf isotopic
compositions exhibit only slight differences
(87Sr/86Sr ranges from 0.70244 ± 5 to 0.70254 ± 6;143Nd/144Nd from 0.512387 ± 10 to 0.512412 ± 9;
and 176Hf/177Hf from 0.283157 ± 8 to 0.283194 ± 8).
The high-precision 208Pb/204Pb, 207Pb/204Pb,
and 206Pb/204Pb data show small but significant
variability, whereas the 208Pb/206Pb isotopic ratios
are identical within analytical uncertainty (2.063 ± 1
to 2.065 ± 1).
[13] As a group, the Sr, Nd, Hf and Pb isotopic
compositions of the off-axis samples are identical,
within analytical uncertainty, to those measured in
the 9�500N EPR axial samples (Figures 5–7) [Sims
et al., 2002]. The nearly constant and similar Sr, Nd,
Figure 2. Photos of six of the samples analyzed in this study, taken from Alvin dive tapes. Scale estimates for the sixphotographic images are: 2768-8 (3� 4 m); 2746-4 (4� 5 m); 2772-2 (3� 4 m); 2768-3 (4� 5 m); 2746-14 (2� 3 m);2772-3 (4 � 5 m). These photos represent the younger (on the left) and older samples (on the right) collected on threedifferent dives (2768; 2746; 2772), and show a distinct contrast in the geologic features that can be related to theirage, including sediment cover, Mn oxide coatings, freshness of glass etc. Consistency between these observationalfeatures and the ages determined by U-Th-Ra chronology (Table 4) provides validation of the U-series technique.
GeochemistryGeophysicsGeosystems G3G3
sims et al.: aberrant youth 10.1029/2002GC000443
9 of 27

Hf and 208Pb/206Pb isotopic compositions of the
axial and off-axis lavas indicate that both sample
suites originated from a source that was relatively
homogeneous with respect to its time-integrated
Rb/Sr, Sm/Nd, Lu/Hf, and Th/U, respectively.
3.3. U-Series Disequilibria Measurements
[14] U, Th, and Ra concentrations and (234U/238U),
(230Th/232Th), (230Th/238U) and (226Ra/230Th) for
the off-axis 9�500N samples are reported in Table 3
and shown in Figures 8 and 9. The analytical
methods are discussed in the footnotes to Table 3.
For several samples, (230Th/232Th) has been mea-
sured by both Secondary Ion Mass Spectrometry
(SIMS), using the WHOI/NENIMF Cameca IMS
1270 [Layne and Sims, 2000], and by Plasma ioni-
zation multicollector mass spectrometry (PIMMS),
using the Finnigan Neptunes at ThermoFinnigan in
Bremen, Germany and at WHOI [Ball et al., 2002].
The reproducibility between the two techniques is
within analytical errors (less than 1%). Replicate
measurements of (238U/232Th), (230Th/232Th),
(230Th/238U), (234U/238U) and (226Ra/230Th) for
MORB sample 2392-9 and rock standards ATHO
and TML are consistent (within analytical uncer-
tainties) with previously reported TIMS and SIMS
measurements [see Lundstrom et al., 1999; Sims et
al., 1995, 1999; Sims et al., 2002].
3.3.1. 238U-234U
[15] For submarine basalts, (234U/238U) activity
ratios are a sensitive indicator of alteration, as
seawater is significantly enriched in 234U relative
to 238U (for seawater (234U/238U) = 1.14 ± 0.03
[Thurber, 1962; Ku et al., 1977]). All of the
samples analyzed in this study were hand-picked
glasses that were mildly leached. Most have
(234U/238U) activity ratios = 1.00 (±3 per mil),
indicating undetectable post-eruptive alteration
(Table 3). However, sample 2768-4, which was
one of the most altered and Mn-coated samples in
hand-specimen and had partially devitrified glass,
has elevated (234U/238U) of 1.009 (±2 per mil),
high Cl/K, irregular normalized trace element abun-
dances (e.g., high Ba/Th, negative Ce anomaly), an
elevated Sr isotopic composition and slightly lower
Hf isotopic compositions (for the mildly leached
sample). This sample also has much higher abun-
dances of Th and U (by about a factor of two), lower
(238U/232Th), and higher (230Th/232Th) and
(230Th/238U) when compared to the other off-axis
and axial samples from this region [Sims et al.,
2002]. All of this suggests that secondary processes,
such as post-eruptive alteration/weathering or the
assimilation of altered crust, have significantly
changed the chemical and isotopic composition of
sample 2768-4. While a strong leach (in warm
6N HCl) seems to diminish this alteration signature
(Table 2), such leaching can significantly affect the
measured U, Th, and Ra concentrations and result-
ing U-Th-Ra disequilibria. Because the U-series
data for this sample cannot be considered reliable,
we do not consider it in our age calculations and
subsequent interpretations; however, for complete-
ness, we list its measured major and trace element
and isotopic compositions in the data tables.
3.3.2. 238U-230Th-226Ra
[16] All of the off-axis 9�500N samples examined
in this study have (230Th/238U) greater than one,
Figure 3. Na2O versus MgO for the 9�50N EPR off-axis samples of this study, the AST lavas from 9�–10�NEPR [Sims et al., 2002], and the Siqueiros picriticbasalts and E-type MORB [Perfit et al., 1996]. The axiallavas distinguished as 9�500N EPR (blue) are from9�400N–9�520N, and those distinguished as 9�300N EPR(red) come from 9�280N–9�370N; this divide is based ona small overlapping spreading center (OSC) at 9�370NEPR that acts as a hydrothermal and volcanologicaldivide between the northern and southern ridgesegments. Note that the altered sample 2768-4 doesnot lie along the same trend as the other data.
GeochemistryGeophysicsGeosystems G3G3
sims et al.: aberrant youth 10.1029/2002GC000443
10 of 27

indicating that the daughter 230Th has been
enriched relative to its parent 238U (hereafter
(230Th/238U) > 1 is referred to as 230Th excess).
Experimentally determined U and Th mineral-melt
partition coefficients suggest that 230Th excesses
measured in MORB indicate that melting began
deep and most likely in the presence of garnet
[Beattie, 1993; LaTourrette et al., 1993; Landwehr
et al., 2001]. For most of the off-axis samples,
(230Th/232Th) is correlated with (238U/232Th)
(Figure 8), a feature common to the axial samples
from 9�500N EPR [Sims et al., 1995]. There are,
however, three samples that lie below this trend
and we interpret this to indicate that they are older
(see discussion below). Similar to the axial sam-
ples, there is a negative correlation between Mg#
and the extent of (230Th/238U) disequilibrium in the
off-axis samples. The more primitive samples show
the smallest 230Th excesses and the more evolved
samples show progressively larger 230Th excesses
(Figure 10a).
[17] (226Ra/230Th) is greater than unity in seven of
the eleven off-axis samples (Table 3; Figure 9),
indicating that daughter 226Ra is enriched relative
to its parent 230Th (hereafter (226Ra/230Th) > 1 is
referred to as 226Ra excess). The other four
samples have 226Ra in equilibrium with 230Th.
When compared with the correlation between226Ra and 230Th excesses of the axial lavas
(Figure 9), four of the off-axis samples have large226Ra excesses similar to the axial samples from
this region. The other three samples also have
significant 226Ra excesses, but appear to lie on
Figure 4. Trace element abundances of off-axis lavas normalized to primitive mantle abundances of McDonoughand Sun [1995]. Grey field shows the range of normalized abundances for the 9�500N axial samples. The prominentnegative Sr anomalies are a consequence of extensive plagioclase fractionation. Note that if the 9�300N EPR axialsamples, which have similar patterns but higher abundances [Sims et al., 2002], had been included, the axial fieldwould extend beyond the range observed for the 9�500N off-axis lavas. The pattern of the altered sample (2768-4) isshown in blue and is quite distinct from the other samples.
GeochemistryGeophysicsGeosystems G3G3
sims et al.: aberrant youth 10.1029/2002GC000443
11 of 27

downward vertical trajectories from the axial
trend toward 230Th - 226Ra equilibrium.
4. Constraints on Eruption Ages FromMeasurements of U-Th-RaDisequilibria
4.1. U-Series Age Constraints
[18] Disequilibrium between a parent/daughter
ratio in MORB is generally attributed to chemical
fractionation during magmatic processes (e.g.,
melt generation and transport, crystal fraction-
ation, or magma degassing). If this fractionation
ceases after the basalt has erupted (i.e., the system
is closed), then the simple presence or absence of
radioactive disequilibria can place limits on the
time since chemical fractionation (in this case, the
eruption age). Because of the large difference in
the half-lives of 230Th (75 ka) and 226Ra (1.6 ka),
combined measurement of U-Th and Th-Ra dis-
equilibria enables the dating of MORB across a
time range of ca. 102–106 years.
[19] All thirteen unaltered samples show significant
(230Th/238U) disequilibria (Table 3), requiring that
their eruption ages be less than 300,000 years
(Table 4). The large magnitude of these 230Th
excesses suggests even younger ages, probably less
than the half-life of 230Th (75,000 yrs). This is
consistent with the fact that all the samples were
collected on crust that is younger than 80 ka, based
on spreading rate and their location relative to the
AST. Of these thirteen samples, eleven have been
measured for (226Ra/230Th). Seven of the eleven
samples show significant 226Ra excesses. The
observation that the (226Ra/230Th) is greater than
one constrains the ages of these samples to less than
Table 2. Sr, Nd, Hf and Pb Isotopic Compositions for the 9�500N EPR Off-Axis Samplesa
Sample 87Sr/86Sr 143Nd/144Nd eNd176Hf/177Hf eHf
208Pb/204Pb 207Pb/204Pb 206Pb/204Pb 208Pb/206Pb
2737-8 0.70248 ± 5 0.512412 ± 9 11.3 0.283189 ± 8 14.7 37.674 15.467 18.263 2.0632746-4 0.70247 ± 5 0.512398 ± 12 11.0 0.283190 ± 5 14.8 37.646 15.461 18.250 2.0632746-7 0.70254 ± 6 0.512396 ± 9 11.0 0.283177 ± 12 14.32746-9 0.70250 ± 4 0.512402 ± 11 11.1 0.283176 ± 10 14.3 37.645 15.454 18.252 2.0632746-14 0.70248 ± 4 0.512400 ± 10 11.0 0.283178 ± 10 14.42759-12 0.70248 ± 4 0.512409 ± 9 11.2 0.283183 ± 10 14.52759-14 0.70250 ± 3 0.512402 ± 9 11.1 0.283178 ± 8 14.4 37.729 15.498 18.284 2.0642768-3 0.70248 ± 5 0.512397 ± 11 11.0
2768-4 (SL) 0.70245 ± 4 0.512400 ± 10 11.0 37.707 15.484 18.267 2.0642768-4 (LL) 0.70342 ± 12 0.283157 ± 8 13.6
2768-6 0.70247 ± 4 0.512411 ± 11 11.2 0.283179 ± 11 14.4 37.691 15.476 18.257 2.0652768-8 0.70244 ± 5 0.512390 ± 12 10.8 0.283175 ± 10 14.3 37.717 15.479 18.273 2.0642771-1 0.70246 ± 4 0.512410 ± 10 11.2 0.283181 ± 11 14.5 37.662 15.466 18.249 2.0642772-1 0.70254 ± 6 0.512402 ± 9 11.1 0.283182 ± 10 14.5 37.773 15.503 18.284 2.0662772-2 0.70252 ± 4 0.512395 ± 11 10.9 0.283176 ± 8 14.3 37.757 15.498 18.278 2.0662772-3 0.70249 ± 4 0.512387 ± 10 10.8 0.283194 ± 8 14.9 37.754 15.495 18.279 2.065
aGlass samples were leached on the ship in either distilled water, 3N HCl or 6N HCl for 15 min, depending on the cruise. In the laboratory
samples were hand-picked under a microscope, then ultrasonically leached in sequential treatments of 0.1N HCL plus 2%H2O2 (15 min), DI water(twice, each time for 15 min), 0.1N oxalic acid plus 2% H2O2, DI water (twice, each time for 15 min), acetone (15 min). Samples were then hand-picked by microscope for a second time and then lightly leached in the clean lab using 0.1N HCL plus 2%H2O2 (15 min). All laboratory leachingused ultra pure reagents. For sample 2768-4, which appeared to be highly altered in hand specimen (see text for details) a separate split for theisotopic fraction was further leached with warm 6N HCl until all visible signs of alteration were eliminated; this sample split is designated with thesuffix SL (Strong Leach) and is distinguished from the split which was treated as described above designated LL (light leach). Sr isotopes measuredat WHOI by TIMS using the VG 354. Uncertainties in measured Sr isotope ratios represent analytical errors (2s/
pn, where n is the number of
measured ratios) reported in the last decimal place. Measured ratios are corrected to NBS987 = 0.710240 measured every fifth sample. Externalreproducibility is 20–30 ppm based on replicate runs of NBS987. Nd isotopes measured at UC Berkeley by TIMS using the VG 354. Uncertaintiesin measured Nd isotope ratios are analytical errors (2s/
pn, where n is the number of measured ratios) reported in the last decimal place. Measured
ratios are normalized to 146Nd/142Nd = 0.636151. Replicate measurement (n = 71) of 143Nd/144Nd in BCR-1 (between 10/02/92–4/04/01) gives avalue of 0.511843 ± 5. eNd values calculated using (143Nd/144Nd)Chur(0) = 0.511836, see DePaolo, 1988. Hf isotopes measured at ENS Lyon by MC-ICPMS using the VG Plasma 54 [see Blichert-Toft et al., 1997]. Uncertainties in measured Hf isotope ratios are analytical errors (2s/
pn, where n is
the number of measured ratios) reported in the last decimal place. Measured ratios are normalized for mass fractionation to 179Hf/177Hf = 0.7325.Measurement of 176Hf/177Hf in the JMC-475 Hf isotopic standard = 0.28216 ± 1; JMC-475 Hf isotopic standard was run every second sample. eHfvalues calculated with (176Hf/177Hf )Chur(0) = 0.282772. Pb isotopes measured at ENS Lyon by MC-ICPMS using the VG Plasma 54. Measuredratios are normalized to both an internal Tl std and then to NBS 981 using the values of Todt et al., 1996. For these measurements every two samplesare interspersed with an analyses of NBS 960 for the mass bias correction [see White et al., 2000]. Errors for 208Pb/204Pb; 207Pb/204Pb and206Pb/204Pb are 300–400 ppm (2s) and for 208Pb/206Pb 200–300 ppm (2s) and are calculated by propagating (
p(se2 + se2)) both the analytical
error and the variance of the NBS 960 standards from the instrument fractionation trend observed during the sum of these analyses.
GeochemistryGeophysicsGeosystems G3G3
sims et al.: aberrant youth 10.1029/2002GC000443
12 of 27

8,000 years. The large magnitude of these 226Ra
excesses suggest even younger ages (Table 4). Four
of the eleven samples (2746-9, 2746-14, 2759-12,
2768-3) have (226Ra/230Th) equal to unity, suggest-
ing their eruption ages are older than 8,000 years.
Consequently, the ages of these four samples are
constrained to between 8,000 and 300,000 years.
4.2. U-Series ‘‘Model’’ Ages
[20] If after eruption the sample remains a closed
system, disequilibria between parent and daughter
will decay back to equilibrium at a rate propor-
tional to the half-life of the daughter isotope. This
decay can be used for dating off-axis MORB [e.g.,
Rubin and MacDougall, 1990; Goldstein et al.,
1991, 1993, 1994].
[21] For MORB, U-Th and Th-Ra model ages can
be determined from the relationships:
T¼� 1
l230
ln
230Th=232Th� �
m� 238U=232Th� �
m
230Th=232Th� �
o� 238U=232Th� �
m
ð1Þ
T ¼ � 1
l226
ln
226Ra=230Th� �
m�1
226Ra=230Th� �
o�1
ð2Þ
Figure 5. (a) eNd versus 87Sr/86Sr for axial 9–10�Nand Siqueiros Transform samples [Sims et al., 2002] and9�500N off-axis samples measured in this study.Analytical uncertainties are smaller than, or similar to,symbol size. (b) eNd versus 87Sr/86Sr for axial 9–10�N[Sims et al., 2002] and 9�500N off-axis samplesmeasured in this study. Error bars represent two sigmaanalytical uncertainties.
Figure 6. (a) eNd versus eHf for axial 9–10�N andSiqueiros Transform samples [Sims et al., 2002] and9�500N off-axis samples measured in this study.Analytical uncertainties are smaller than, or similar to,symbol size. (b) eNd versus eHf for axial 9–10�N [Simset al., 2002] and 9�50 N off-axis samples measured inthis study. Error bars represent two sigma analyticaluncertainties.
GeochemistryGeophysicsGeosystems G3G3
sims et al.: aberrant youth 10.1029/2002GC000443
13 of 27

where the subscript (m) represents the sample’s
measured activity ratio, the subscript (o) its initial
activity ratio upon eruption, and l230 and l226 thedecay constants for 230Th and 226Ra, respectively.
In equation 1, 232Th is used as a stable analog for230Th [see Allegre and Condomines, 1982]. No
stable analog exists for 226Ra, hence the different
form of equation (2).
[22] In both of these equations, the one additional
unknown, besides time, is the sample’s initial activ-
ity ratio {i.e., (230Th/232Th)o and (226Ra/230Th)o}.
For off-axis MORB, U-series ages can be deter-
mined by estimating this initial activity ratio
from data for young axial basalts and comparing
this with the sample’s measured activity ratio.
For this approach to be valid, it must be dem-
Figure 7. (a) 208Pb/204Pb versus 206Pb/204Pb, (b) 207Pb/204Pb versus 206Pb/204Pb and (c) 208Pb/204Pb versus207Pb/204Pb for axial 9–10�N and Siqueiros Transform samples [Sims et al., 2002] and 9�500N off-axis samplesmeasured in this study. (d) 208Pb/204Pb versus 206Pb/204Pb, (e) 207Pb/204Pb versus 206Pb/204Pb and (f ) 208Pb/204Pbversus 207Pb/204Pb for axial 9–10�N and Siqueiros Transform samples [Sims et al., 2002] and 9�500N off-axissamples measured in this study. Analytical uncertainties are <400 ppm (2s) and shown in Figures 7d–7f and similarto symbol size in Figures 7a–7c.
GeochemistryGeophysicsGeosystems G3G3
sims et al.: aberrant youth 10.1029/2002GC000443
14 of 27

Table 3. (230Th/232Th), (230Th/238U), (226Ra/230Th), (234U/238U), and U, Th and Ra Concentrations Measured bySIMS, PIMMS and Single-Collector ICPMSd,e,f
Sample [Th] ug/g [U] ug/g Th/U (238U/232Th) (230Th/232Th) (230Th/238U) [226Ra] fg/g (226Ra/230Th) (234U/238U)
2737-8 (1) 0.1085a 0.0436a 2.488 1.219 1.375a 1.127 1.002b
2737-8 (2) 1.375b 1.1272737-8 avg 1.375 1.1272746-4 0.1229a 0.0496a 2.479 1.224 1.390a 1.135 50.89 2.67 1.003a
2746-7 0.1214a 0.0486a 2.498 1.215 1.376a 1.133 49.45 2.662746-9 (1) 0.1212a 0.0483a 2.507 1.210 1.351a 1.116 18.40 1.01 1.002a
2746-9 (2) 1.361b 1.1242746-9 avg 1.356 1.1202746-14 0.1432a 0.0587a 2.441 1.243 1.351a 1.087 21.44 0.99 1.001b
2759-12 0.1717a 0.0699a 2.458 1.234 1.383a 1.120 26.25 0.992759-14 0.1433a 0.0587a 2.441 1.243 1.398a 1.125 50.65 2.272768-3 0.1239a 0.0507a 2.445 1.241 1.322a 1.065 18.25 1.00 1.002b
2768-4 0.2594a 0.0994a 2.608 1.163 1.402a 1.205 1.009b
2768-6 (1) 0.1466a 0.0588a 2.494 1.216 1.380a 1.134 1.001a
2768-6 (2) 1.383a 1.1372768-6 (avg) 1.381 1.1362768-8 (1) 0.1148a 0.0470a 2.443 1.242 1.386a 1.1162768-8 (2) 1.384b 1.114 1.003b
2768-8 (avg) 1.385 1.1152771-1 0.1421a 0.0582a 2.442 1.242 1.393a 1.122 49.00 2.23 1.003b
2772-1 (1) 0.1466a 0.0595a 2.461 1.233 1.420a 1.152 59.65 2.58 1.0022772-1 (2) 1.423b 1.1552772-1 (avg) 1.422 1.153
2772-2 0.1466a 0.0594a 2.466 1.230 1.412a 1.148 61.65 2.682772-3 (1) 0.1572a 0.0637a 2.468 1.229 1.385a 1.126 50.10 2.07 1.002a
2772-3 (2) 1.380b 1.122 1.003b
2772-3 (avg) 1.382 1.124AThO 1.013b 1.002b
AThO 1.014a
TML 1LANL 30.26a 10.80a 2.801 1.083 1.086c 1.003 3,623 0.991 1.004a
TML-2 LANL 30.49a 10.87a 2.804 1.082 1.072c 0.991 3,635 0.999TML 1WHOI 29.45b 10.543b 2.793 1.086 1.084a 0.997 1.004b
TML 2 WHOI 29.44b 10.517b 2.799 1.084 1.084a 0.999 1.002b
TML 3 WHOI 30.17b 10.695b 2.821 1.076 1.082a 1.006 1.005b
TML 4 WHOI 1.069b
TML 5 WHOI 1.072b
aDuplicate measurements represent separate glass splits; glass samples were leached on the ship in either distilled water or 6N HCl for 15 min,
depending on the cruise. In the laboratory the samples were hand-picked under a microscope, then ultrasonically leached in sequential treatments of0.1N HCL plus 2%H2O2 (15 min), DI water (twice, each time for 15 min), 0.1N oxalic acid plus 2% H2O2, DI water (twice, each time for 15 min),acetone (15 min). Samples were then hand-picked by microscope for a second time and then lightly leached in the clean lab in 0.1N HCL plus2%H2O2 (15 min) using ultra pure reagents. Sample splits (>1 g) were then dissolved, aliquoted, spiked and then U-Th-Pa and Ra were separatedusing chemical techniques outlined in Goldstein et al., 1989; Volpe et al., 1991; Cohen and O’Nions, 1991; Chaubaux et al., 1994; and Layne andSims, 2000. Note that measurements of TML, leached under similar conditions, show that this leaching procedure does not alter the samples U andTh concentrations.b[U], [Th], measured by both a) ID-TIMS at LANL and b) ID-ICPMS at WHOI; measurement errors for [U], [Th] 0.8% (2s) for ID-TIMS and
1.0% for ID-ICPMS.c( ) denotes activity l238 = 1.551 � 10�10 yr�1;, l232 = 4.948 � 10�11 yr�1 errors (2s) range from 0.4%–1.0% and do not include uncertainties
in l238 (0.07%) or l232 (0.5%).dTh isotopic compositions measured by a) SIMS at WHOI [Layne and Sims, 2000]; B) PIMMS at Finnigan MAT in Bremen and WHOI using
the ThermoFinnigan Neptune [Ball et al., 2002] c HAS TIMS at LANL [Goldstein et al., 1989; Sims et al., 1995, 1999]; activity ratios calculatedusing l230 = 9.195 � 10�6 yr�1 and l232 = 4.948 � 10�11 yr�1; errors (2s) range from: 0.4%–1% for both techniques and do not includeuncertainties in l230 (0.4%) or l232 (0.5%).e(226Ra) measured by ID-ICPMS at WHOI using the ThermoFinnigan Element; l226 = 4.331 � 10�4 yr�1, ;measurement errors (2s range from
0.6%–1.7% and do not include uncertainties in l226 (0.4%) or l230. For all samples accuracy is limited by uncertainties (2s; 1.5%) on the NBS226Ra standard used to calibrate the 228Ra spike.f(234U/238U) measured by a) TIMS at LANL and by b) ICPMS at WHOI. l234 = 2.823 � 10�6 yr�1, errors (2s) < 1.0%; for these samples
(234U/238U) = 1 within error, using an equilibrium 234U/238U of 54.95 ppm. For ICPMS NBS 960 was run between each sample to determine massbias.
GeochemistryGeophysicsGeosystems G3G3
sims et al.: aberrant youth 10.1029/2002GC000443
15 of 27

onstrated that both the axial and off-axis lavas
were: (1) derived from the same time-averaged
source (as indicated by their Sr, Nd, Hf and Pb
isotopic compositions), and (2) produced by
similar petrogenetic processes (i.e., similar melt
fractions, depths of melting, transport mecha-
nisms, extents of magma differentiation, and
magma transport and storage times).
Figure 8. (a) (238U/232Th) versus (230Th/232Th) for9�500N off-axis samples compared to the 9–10�N EPRaxial samples [Sims et al., 2002], and the SiqueirosTransform samples [Lundstrom et al., 1999; Sims et al.,2002] for which Sr, Nd, Hf and Pb isotopes have beenmeasured. Note that the age of Siqueiros E-type sample(2390-1) is thought to be significant relative to the half-life of 230Th and has been age corrected [see Lundstromet al., 1999]. Also shown are the near axial basalts from9�370N EPR [Goldstein et al., 1992]. (b) U/Th versus230Th/232Th for the 9�500N off-axis samples comparedto the 9–10�N EPR axial samples [Sims et al., 2002].Errors represent two sigma analytical uncertainties.Dashed line represents the zero-age axial trend usedfor calculating ‘‘trend line’’ ages. For most of the off-axis samples (230Th/232Th) and (238U/232Th) are similarto the axial samples from 9�500N EPR; the three sampleswhich lie below the range of axial values are interpretedto be older (see text for details).
Figure 9. (a) (230Th/238U) versus (226Ra/230Th) for the9�500N EPR off-axis samples from this study comparedwith the 9–10�N EPR axial samples [Sims et al., 2002],three ‘‘near axis’’ 9�30N EPR samples, including oneE-type from close to the 9�370N DEVAL [Batiza andNiu, 1992; Volpe and Goldstein, 1993] and theSiqueiros transform samples [Lundstrom et al., 1999].(b) 230Th/238U versus. 226Ra/230Th for 9�500N EPR off-axis samples compared with the 9�500N EPR axialsamples [Sims et al., 2002]. Error bars represent twosigma analytical uncertainties. Because of the signifi-cant difference in the half-lives of 226Ra and 230Th,(226Ra/230Th) decays back to equilibrium before(230Th/238U) (note decay curve on plot). The correlationobserved among the zero-age samples (shown bydashed line) is used as the trend line from which Th-Ra ages are calculated (see text for details). Note thatseveral off-axis samples have (226Ra/230Th) in equilib-rium, indicating that their ages are older (>8 ka) thancan be determined through 230Th-226Ra disequilibria.
GeochemistryGeophysicsGeosystems G3G3
sims et al.: aberrant youth 10.1029/2002GC000443
16 of 27

[23] To calculate U-series model ages for the
9�500N EPR off-axis samples, initial activity ratios
are estimated from young basalts (some erupted
in 1991–92; see Rubin et al. [1994]), collected
exclusively within the AST between 9�480 and
9�520N, for which major- and trace element com-
positions, U-Th-Ra and U-Pa disequilibria and Sr,
Nd, Hf, and Pb isotopic compositions have been
determined [Sims et al., 2002]. The Sr, Nd, Hf and208Pb/206Pb isotope compositions in both the axial
and off-axis lavas are identical (within analytical
uncertainty) indicating that over the length scale of
melting, their mantle source was homogenous with
respect to its time-averaged parent/daughter ratios
(Rb/Sr, Sm/Nd, Lu/Hf and U/Th). However, the
young axial lavas from this region show significant
variability in U/Th, 230Th/232Th, (230Th/238U) and
(226Ra/230Th) (Figures 8 and 9), which we attribute
to variations in the degree and depth of melting and
the effects of progressive source depletion [Sims et
al., 2002]. While this variability has been critical
for the interpretation of melting beneath this region
of the EPR [Sims et al., 2002], it adds uncertainty
when using the axial lavas as a proxy for the off-
axis lavas’ initial (230Th/232Th) and (226Ra/230Th),
and this uncertainty must be taken into account in
the U-Th and Th-Ra age calculations.
4.2.1. U-Th Model Ages
[24] Using a statistical interpretation to account for
the observed variability among the young axial
lavas, we observe that ten of the off-axis samples’
(230Th/232Th) are within the range observed for the
axial samples (1.362 to 1.425), while the other
three samples (2746-9, 2746-14, 2768-3) have
lower (230Th/232Th). However, when analytical
errors are considered, only sample 2768-3 is sig-
nificantly different. While using the lowest value of
(230Th/232Th) in axial lavas as a proxy for the off-
axis lavas’ initial activity ratio provides an estimate
of minimum age, using the axial lavas upper limit
for the initial value provides an estimate of max-
imum age (Table 4). Most of the off-axis lavas
have (230Th/232Th) higher than the axial lavas’
lower limit of 1.36, and, therefore, these samples’
calculated minimum ages are zero. For samples
2746-9, 2746-14, 2768-3, (230Th/232Th) is smaller
Figure 10. (a) 230Th excess versus Mg# (molar Mg/(Mg + Fe); Fe based on FeO = 0.9 � FeO total)) for the9�500N EPR off-axis samples compared with the 9–10�N axial and Siqueiros Transform samples. (b) 226Raexcess versus Mg# for the 9�500N EPR off-axis samplescompared with the 9–10�N axial and Siqueiros Trans-form samples. For the 9–10�N EPR axial lavas(230Th/238U) and (226Ra/230Th) are correlated with molarMg#, which is attributed to the mixing of polybaric melts(see Sims et al. [2002] for details). Many of the off-axislavas are similarly correlated, further confirming thisfunctional relationship. Several samples that lie belowthese correlations have significant U-Th and Th-Ra ages.If the residence times of the young evolved off-axispillow ridge lavas were significantly different from thoseof the axial lavas, relative to the half-life of 226Ra, then itis likely that these lavas would lie below the(226Ra/230Th)-Mg# correlation. The observation thatthe young off-axis samples tend to lie slightly abovethe (226Ra/230Th)-Mg# correlation, but slightly below the(230Th/238U)-Mg# correlation, suggests that these lavashave been shifted to lower Mg#. If so, one could inferthat they had experienced different cooling histories, butthe timescale of differentiation is short compared to thehalf-life of 226Ra.
GeochemistryGeophysicsGeosystems G3G3
sims et al.: aberrant youth 10.1029/2002GC000443
17 of 27

than the axial lavas’ lower limit; however, when
analytical uncertainties are considered, only 2768-3
is significantly different having a minimum age of
43 ± 35 ka. When calculating ‘‘maximum ages’’,
only two of the off-axis samples (2772-1; 2759-14)
have maximum ages that are significantly younger
than their calculated spreading rate ages, suggest-
ing that these samples were emplaced off-axis. All
other off-axis samples have maximum ages that are
similar to or older than their calculated spreading
rate ages, indicating that they could have originated
on or close to the axis. When the minimum and
maximum ages are considered in combination,
most of these samples have U-Th ages that range
from zero years, which would indicate that the
sample was emplaced/erupted in its current loca-
tion, to having maximum ages similar to the
inferred spreading rate age, which would indicate
that the sample was originally erupted on axis and
has aged proportionally to the spreading rate (see
also Figure 11a). In the absence of additional
constraints, the large variation in (230Th/232Th)
and (230Th/238U) among the axial samples clearly
limits the resolution of the above-determined U-Th
ages.
[25] A more robust way to estimate the initial
(230Th/232Th) and (230Th/238U) of off-axis lavas
is to take advantage of the observation that the
U-series isotopes of the ‘‘zero age’’ 9�–10�N EPR
axial lavas are correlated, both among themselves
{e.g., (230Th/232Th) versus (238U/232Th) and
(230Th/238U) versus (226Ra/230Th)}, and with other
chemical indices {e.g., (230Th/238U) versus Mg#}
[see Sims et al., 2002]. If it can be shown that
young off-axis lavas exhibit similar correlations,
then the ages of lavas that deviate from these
correlations can be determined explicitly by pro-
Table 4. Spreading Rate Ages, U-Th and Th-Ra Age Limits and U-Th and Th-Ra Model Ages (See Text forExplanation of Age Calculations)a
SampleDistance From
AST, km
Age Basedon Spreading
Rate, ka
U-Th-Ra AgeConstraints,
ka
U-ThMinimumAge, ka
U-ThMaximumAge, ka
U-ThTrend LineAge, ka
Th-RaMinimumAge, ka
Th-RaMaximumAge, ka
Th-RaTrend LineAge, ka
2737-8 1.85 W 33.64 <300 0 33 ± 20 0 NM NM NM2746-4 0.02 E 0.28 <8 0 24 ± 19 0 0 0.3 ± 0.1 02746-7 0.26 W 4.79 <8 0 31 ± 19 0 0 0.3 ± 0.1 02746-9 0.74 W 13.42 8 to 300 0 45 ± 21 15 ± 16 >8 >8 >82746-14 2.36 W 42.98 8 to 300 0 60 ± 28 38 ± 24 >8 >8 >82759-12 2.56 W 46.64 8 to 300 0 30 ± 21 0 >8 >8 >82759-14 2.41 W 43.75 <8 0 20 ± 19 0 0 0.9 ± 0.1 0.7 ± 0.22768-3 3.75 E 68.26 8 to 300 42 ± 37 92 ± 35 69 ± 30 >8 >8 >82768-6 2.25 E 40.92 <300 0 28 ± 19 0 NM NM NM2768-8 1.24 E 22.63 <300 0 30 ± 21 0 NM NM NM2771-1 1.99 W 36.16 <8 0 24 ± 20 0 0 1.0 ± 0.1 0.8 ± 0.22772-1 2.28 E 41.37 <8 0 5 ± 16 0 0 0.4 ± 0.1 02772-2 1.44 E 26.21 <8 0 10 ± 17 0 0 0.3 ± 0.1 02772-3 0.86 E 15.55 <8 0 30 ± 20 0 0 1.3 ± 0.1 1.1 ± 0.2
aAST location determined by Fornari et al. [1998]. Spreading determined assuming a constant spreading rate of 5.5 cm/yr half-rate.
Age constraints based upon absence of presence of 230Th/238U or 226Ra/230Th disequilibria and the half-lives of 226Ra and 230Th; see text for details.U-Th minimum and maximum ages calculated using the range of (230Th/232Th) from the 9�50N EPR AST samples (low value: 1.362; high value:1.425) from Sims et al. [2002]; maximum and minimum ages are estimates and assume that the measured range of (230Th/232Th) in the axial samplesrepresents the entire possible range (see text for details). Negative minimum ages are reported as zero years. Errors incorporate analyticaluncertainties in (238U/232Th) and (230Th/232Th) of the off-axis samples and (230Th/232Th) of the ‘‘end-member’’ axial samples. U-Th ‘‘trend line’’ages calculated using ‘‘zero-age’’ trend defined by the 9�50N EPR AST samples on the U-Th isochron plot (see Figure 8). Off-axis samplesindistinguishable from the 9�50N EPR AST samples are defined as zero-age. For samples that lie below this ‘‘zero-age’’ trend, their ‘‘initial’’(230Th/232Th) is inferred by their measured (238U/232Th). Errors incorporate analytical uncertainties in (238U/232Th) and (230Th/232Th) of the off-axissamples and the range of (230Th/232Th) about the zero-age axial trend. Th-Ra minimum and maximum ages calculated using the range of(226Ra/230Th) determined from 9�50N EPR AST samples (2.01 to 2.89) from Sims et al. [2002]; maximum and minimum ages are estimates andassume that the measured range of (226Ra/230Th) in the axial samples represents the entire possible range (see text for details). Negative minimumages are reported as zero years. Samples with ages older than 8 ka have (226Ra/230Th) = 1. Errors incorporate analytical uncertainties in(226Ra/230Th) of both the off-axis samples and the ‘‘end-member’’ axial samples. Th-Ra ‘‘trend-line’’ ages calculated using ‘‘zero-age’’ trenddefined by the 9�50N EPR ASCT samples on (226Ra/230Th)versus(230Th/238U) (see Figure 9). Off-axis samples indistinguishable from the 9�50NEPR AST samples are defined as zero-age. For samples that lie below this ‘‘zero-age’’ trend, their ‘‘initial’’ (226Ra/230Th) is inferred from theirmeasured (230Th/238U). Samples with ages older than 8 ka have (226Ra/230Th) = 1. Errors incorporate analytical uncertainties in (226Ra/230Th) of theoff-axis samples and the range of (226Ra/230Th) about the ‘‘zero-age’’ axial trend.
GeochemistryGeophysicsGeosystems G3G3
sims et al.: aberrant youth 10.1029/2002GC000443
18 of 27

jection to the zero-age trend. We have shown
previously that the 9–10�N EPR axial lavas’
(230Th/232Th) activity ratios vary as a function of
(238U/232Th) (Figure 8). This correlation, which is
defined as the ‘‘zero-age axial trend’’, can be used to
determine U-Th model ages of the 9�500N EPR off-
axis lavas. All but three of the off-axis samples
(2746-9, 2746-14 and 2768-3) have (230Th/232Th)
and (238U/232Th) that lie within the zero-age trend,
and when analytical errors are considered, only two
of these samples (2768-3; 2746-14) are significantly
different. Because on a plot of (230Th/232Th) versus
(238U/232Th), 230Th decay occurs along vertical
vectors (Figure 8b), the ‘‘initial’’ (230Th/232Th) of
these samples can be inferred from their measured
(238U/232Th). The difference between a sample’s
measured and projected ‘‘initial’’ (230Th/232Th) is
then used to calculate its age. Calculated U-Th ages
for samples 2746-9, 2746-14, and 2768-3 are 15 ±
16 ka, 38 ± 24 ka and 69 ± 30 ka, respectively
(Table 4).
4.2.2. Th-Ra Model Ages
[26] Four samples (2768-3, 2746-14, 2759-12,
2746-9) have (226Ra/230Th) equal to unity; the
Th-Ra ages of these samples therefore cannot be
determined, except to say that they are older than
8 ka (or were erupted with 226Ra in equilibrium
with 230Th, which is highly unlikely). The other
seven off-axis samples have (226Ra/230Th) greater
than one. The (226Ra/230Th) of these samples are
within the range observed among the 9�500N axial
samples (2.01 to 2.89); calculated minimum ages
are ‘‘zero’’ years for all samples, and calculated
maximum ages range from 0.3 ± 0.1 ka (2746-4,
2746-7, 2772-2) to 1.3 ± 0.1 ka (2772-3) (Table 4).
[27] A more explicit way to determine Th-Ra ages
for the off-axis samples is to use the negative
correlation between (226Ra/230Th) and (230Th/238U)
observed among the 9�–10�N EPR axial samples
(Figure 9). The half-life of 226Ra is very short
compared to the half-life of 230Th; for off-axis
samples, which do not lie along this correlation,
the initial (226Ra/230Th) can be determined by
projection from the (230Th/238U). Four samples
(2746-4, 2746-7, 2772-1, 2772-2) lie along the zero
age axial trend (Figure 9b) and therefore have
Figure 11. (a) 9�500N EPR samples (230Th/238U)versus their location, relative to the AST. Decay curvesshow how (230Th/238U) decreases as a function ofdistance from the AST. Initial values for decay curvescome from the average (1.385 ± 0.02), shown in red, andhigh (1.425) and low (1.362) values of (230Th/238U) forthe 9�500N EPR axial samples reported in Sims et al.[2002]. (b) 9�500N EPR samples (226Ra/230Th) versustheir location relative to theAST.Decay curves show how(226Ra/230Th) decreases as a function of distance from theAST. The initial values for these decay curves come fromthe average (2.5 ± 0.3), shown in red, and high (2.89) andlow (2.01) values of (226Ra/230Th) for the 9�500N EPRaxial samples taken from Sims et al. [2002]. (c) U-Thand Th-Ra trend-line ages for the 9�500N off-axissamples compared with ages calculated from spreadingrate (5.5 cm/yr), as determined from paleomagnetic data[Carbotte and Macdonald, 1992].
GeochemistryGeophysicsGeosystems G3G3
sims et al.: aberrant youth 10.1029/2002GC000443
19 of 27

‘‘zero’’ Th-Ra ages relative to this trend line. Three
samples (2759-14, 2771-1, 2772-3) have signifi-
cant 226Ra excesses, but lie somewhat below the
zero-age trend; calculated Th-Ra ‘‘trend line’’ ages
for these samples are 0.7 ± 0.2 ka, 0.8 ± 0.2 ka and
1.1 ± 0.2 ka, respectively (Table 4). Th-Ra ages for
four samples (2768-3, 2746-14, 2759-12, 2746-9)
with (226Ra/230Th) equal to unity are greater than
8 ka.
[28] The U-Th and Th-Ra model ages for the
9�500N EPR off-axis samples are concordant.
Samples with large 226Ra excesses have ‘‘zero’’
U-Th model ages, whereas samples with signifi-
cant U-Th ages have (226Ra/230Th) in equilibrium.
All samples with (226Ra/230Th) greater than one are
much younger than would be predicted by their
spreading rate ages (Table 4); these young ages
therefore require that these samples were emplaced
off-axis as either flows or eruptions.
4.3. Influence of Magma ChamberResidence Times on Calculated U-SeriesAges
[29] In this study we assume that the U-Th-Ra
disequilibria are produced by melt generation and
magma transport processes. Prior work on the axial
samples from 9�–10�N EPR [Sims et al., 2002;
Jull et al., 2003], and numerous other related
studies [e.g., McKenzie, 1985; Williams and Gill,
1989; Spiegelman and Elliott, 1993; Lundstrom et
al., 1995, 1999, 2000] have shown that U-Th-Ra
disequilibria in MORB are best explained by
melt generation and magma transport processes.
Recently it has been proposed that addition of226Ra from plagioclase (which has a high Ra/Th
ratio) either through assimilation or steady-state
melt/plagioclase interaction during magma storage
could be responsible for the observed Th-Ra dis-
equilibiria in MORB [Saal et al., 2002]. However,
recent measurements of 226Ra-230Th in plagioclase
and glass from the N. Gorda Ridge 1996 flow
[Cooper et al., 2003] limit the extent to which
plagioclase could modify 226Ra-230Th disequilibria
during storage in a crustal reservoir. The extremely
low Th concentrations in the plagioclase (3.3 ±
1.7 ng/g) requires any assimilated plagioclase to be
very young (as 226Ra incorporated during crystal-
lization will be unsupported and rapidly decay to
equilibrium with the low 230Th) or that the 226Ra
concentration in plagioclase is ‘‘maintained’’ by
diffusive exchange with a mineral that has a high
Th concentration (e.g., pyroxene). The low con-
centrations of 226Ra measured in the plagioclase
(3.4 ± 0.6 fg/g) are even more problematic. While
the (226Ra)/(230Th) measured in plagioclase from
the N. Gorda Ridge sample is much higher (7.3)
than that in the glass (2.4), the absolute concentra-
tion of Ra in plagioclase is more than a factor of 10
lower than that in the coexisting glass. Addition of
50% plagioclase by assimilation to a liquid with a
composition like that of the host glass would raise
(226Ra)/(230Th) in the liquid to only �2.5 and
significantly change the bulk composition of the
liquid (which is not evident in the 9–10�N EPR
major and trace element data). If instead steady-
state melt/plagioclase diffusive exchange were the
operative process, then the ratio of cumulate/melt
would have to be quite large, requiring an exces-
sive amount of cumulate to produce the observed
7 km thick oceanic crust. Such a process would
also have to be systematic enough to generate the
observed correlation between 230Th and 226Ra
excesses. In either case, melting or cumulate-melt
interaction, the U-series ‘‘clocks’’ start when the
melt is no longer in equilibrium with the matrix.
[30] When magma is stored in the crust for a
significant period of time prior to eruption, U-Th
and Th-Ra disequilibria can decay toward their
equilibrium values. We are using the axial lavas as
a proxy for the off-axis lavas’ initial (230Th/232Th)
and (226Ra/230Th). Therefore if the off-axis lavas
have been stored in the crust for a period of time
significantly different than the axial lavas (either
longer or shorter), their calculated U-Th and
Th-Ra eruption ages could be incorrect. Because
of the much shorter half-life of 226Ra, this issue is
potentially significant for the calculated Th-Ra
ages, but it is unlikely to be important for the
U-Th ages.
[31] The major and trace element compositions of
several off-axis samples show that they are indeed
more evolved than the axial basalts (e.g., they
have lower MgO, CaO, and Al2O3, and higher
TiO2, K2O, FeO, Na2O and incompatible trace
GeochemistryGeophysicsGeosystems G3G3
sims et al.: aberrant youth 10.1029/2002GC000443
20 of 27

element abundances (see e.g., Figures 3 and 4;
Appendix 1)). The question is whether the
residence times of these more evolved off-axis
lavas were significantly longer than those of the
axial lavas. Among the axial lavas from 9–10�NEPR, 226Ra is negatively correlated with Mg#
while 230Th is positively correlated with Mg#.
While samples with significant U-Th and Th-Ra
ages lie below these correlations, the ‘‘zero-age’’
9�500N EPR off-axis lavas are similarly correlated
(Figure 10), further confirming this functional
relationship and suggesting that, relative to the
half-life of 226Ra, the residence times of the off-
axis samples are similar to those of the axial lavas.
5. Comparison of U-Series Ages WithObservational Age Constraints
[32] A number of geological features can be used
to provide a gross estimate of the relative ages of
submarine lava flows and to recognize eruptions
that occurred away from the focus of volcanism
along the AST. These features include: extent and
thickness of sediment cover, thickness of Mn oxide
coatings on lava surfaces, freshness of glass, lava
type and morphology, stratigraphic and contact
relationships, and tectonic characteristics [e.g.,
Chadwick and Embley, 1994]. The combination
of U-series ages (Table 4, Figure 11), observations
from submersibles and remote sensing data
(Table 1, Figures 1 and 2) permits us to evaluate
the relationships between U-series model ages, and
geologic and geomorphologic features of the ridge
crest.
[33] To a first order, there is a reasonable qualita-
tive relationship between relative ages of our
samples and the U-Th-Ra model ages determined
in this study (see Tables 1 and 4, Figure 2).
Samples that had the least amount of sediment
cover and Mn-oxide coating, and the ‘‘freshest’’
and thickest glassy crusts also have the youngest
U-Th and Th-Ra model ages (e.g., 2768-8; 2737-7;
2746-4; 2772-2). Samples with older model ages
(e.g., 2768-3; 2746-14; 2772-3) appeared older
both in the field and in hand specimen, in that they
had greater amounts of sediment cover and thicker
Mn-oxide coatings on thinner glassy rinds.
6. Geological and GeochemicalConstraints on the Extent of Off-AxisVolcanism
[34] U-Th-Ra model ages for the 9�500N EPR
lavas analyzed in this study show a complex
distribution of ages across the crestal plateau
(Figure 11). Three samples (2746-9, 2746-14,
and 2768-3) have U-Th and Th-Ra ages concor-
dant with their spreading rate ages as determined
from paleomagnetic data. These concordant ages
suggest these samples erupted within, or close to,
the AST and have since aged at a rate propor-
tional to the crustal spreading rate. For the
majority of samples, however, their U-Th-Ra
model ages are younger than would be predicted
by their locations and model spreading rate ages.
These anomalously young ages indicate that the
age of the extrusive crust is not linearly related to
the time-averaged paleomagnetic spreading rate
(see Figure 11c).
[35] The observational data indicate that along the
9�480–500N segment of the EPR crest, volcanic
construction is dominated by axis-derived lobate
lava flows (plus minor sheet flows), which have
flowed down the upper portion of the crestal
plateau. Isolated areas of off-axis eruption also
contribute to volcanic construction. However, this
type of volcanism is volumetrically insignificant
compared to the axis-centric volcanism (Figure 1b).
The U-Th-Ra ages show that these two processes
are occurring contemporaneously. Samples from
both sheet and lobate flows collected adjacent to
the AST (e.g., 2768-8, 2746-4, 2746-7, 2771-1,
2772-2, 2772-1) and from off-axis pillow mounds
(e.g., 2737-8, 2771-1, 2759-14) have anomalously
young U-Th-Ra ages.
[36] For the lobate and sheet flow samples ana-
lyzed adjacent to the axis, the side scan imagery
indicates that many of these flows can be traced
back to the AST (Figure 1b). Sample 2768-8 typi-
fies this type of morphology. This young sample
appears to have come from a flow that originated
in the AST and may have traveled as far as
1.24 kilometers off-axis. This distance is consistent
with observations of the 1991 BBQ flow [Haymon
et al., 1993; Gregg et al., 1996], which started in
GeochemistryGeophysicsGeosystems G3G3
sims et al.: aberrant youth 10.1029/2002GC000443
21 of 27

the AST and has been mapped out to �1 km off-
axis. For some of the other young off-axis samples
that were classified as lobate flows when they were
collected, such as 2771-1, 2772-1 and 2772-2, their
origin is not so apparent from the side-scan sonar
images (Figure 1b). If these samples came from
lava flows that originated in, or close to, the AST
(as could be suggested by their flow morpholo-
gies), then one could infer from their young ages
and current positions (Table 4) that they may have
traveled as far as �2 km off-axis. There are also
massive flows that have older U-Th model ages.
For example, sample 2746-14 has a U-Th age of
38 ± 24 ka.
[37] With regard to the pillow lavas, it is important
to distinguish between breakout pillows and/or
lava buds at the distal ends of lobate and sheet
flows versus pillow ridges associated with off-axis
faults and fissures. Samples 2768-6, 2768-3 and
2746-9 were classified as pillow lavas when they
were collected. From their ages, locations and dive
descriptions it is likely that these samples came
from pillows and lava buds at the ends of more
extensive lobate flows that originated in or adjacent
to the AST (see Figure 1b and Table 1). Two of
these samples (2746-9 and 2768-3) have U-Th ages
that are concordant with their spreading rate ages,
suggesting that they were erupted within, or close
to, the AST, and have since been aging at a rate
proportional to the spreading rate. However, sam-
ples 2737-8, 2759-12, and 2759-14 can be inter-
preted as off-axis eruptions because they come
from pillow ridges mapped in the side scan imag-
ery (Figure 1b), and are flows that were associated
with faults and scarps. These samples have ‘‘zero’’
U-Th ‘‘model ages’’ but significant Th-Ra model
ages (Table 4).
[38] The geochemical data indicate that 9�500NEPR axial and off-axis lavas (measured in this
study and Sims et al. [2002]) can be related by
similar liquid lines of descent, and that their
parental magmas had similar time-averaged source
characteristics (as indicated by their identical
radiogenic Sr, Nd, Hf and 208Pb/206Pb isotope
compositions). Lavas erupted from (or close to)
the AST are more primitive (higher Mg#), whereas
several of the pillow ridge lavas erupted off-axis
are more evolved (Figure 12). For example, sam-
ples 2768-8 and 2746-7 which are young and
appear to be associated with lobate flows emanat-
ing from the AST, have compositions similar to the
more primitive axial lavas from the 9�50N region.
In contrast, samples 2759-12 and 2746-14, which
were collected from pillow mounds on the west
side of the AST (Figure 1), have much lower Mg#s
(see Figure 12). This greater extent of differentia-
tion for the pillow lavas erupted off-axis may
indicate that they originated from colder, more
distal and more differentiated portions of the axial
magma lens/mush zone; alternatively, these off-
axis lavas could have been derived from isolated
pockets of magma, which were also colder and
more differentiated [Perfit et al., 1994]. Several
lobate and sheet flows (e.g., 2772-3; 2768-6),
which may have originated on-axis and flowed
off-axis are also slightly more evolved. The greater
extent of differentiation of these lavas may indicate
that they came from large eruptions (hence their
breaching the AST and flowing off-axis for con-
siderable distances), which either tapped more
Figure 12. Mg# versus sample location, relative to theAST, for the 9�500N EPR off-axis samples and 9–10�NEPR axial samples. The AST sample (2370-1) with thelowest Mg# (55) is from 9�47.60N EPR, but has acomposition similar to the 9�300N EPR samples;whereas the remainder of the 9�500N EPR axial sampleshave significantly higher Mg# numbers.
GeochemistryGeophysicsGeosystems G3G3
sims et al.: aberrant youth 10.1029/2002GC000443
22 of 27

Table A1a. Major-Element Compositions of 9�50N EPR Off-Axis Samplesa
Sample SiO2 TiO2 Al2O3 FeO(total) MnO MgO CaO Na2O K2O P2O5 Total
2737-8 49.3 1.21 15.62 8.99 0.16 8.62 12.10 2.53 0.09 0.10 98.722746-4 50.4 1.36 15.28 9.43 0.18 8.32 12.10 2.64 0.11 0.15 99.962746-7 50.1 1.23 15.50 9.22 0.16 8.65 12.26 2.59 0.12 0.12 99.902746-9 50.2 1.27 15.58 9.16 0.17 8.48 12.19 2.60 0.12 0.11 99.912746-14 50.4 1.72 14.38 10.70 0.15 7.20 11.98 3.06 0.14 0.16 99.902759-12 50.7 1.95 13.86 11.74 0.20 6.78 11.23 3.00 0.16 0.19 99.812759-14 50.5 1.61 14.54 10.40 0.19 7.55 11.81 2.83 0.14 0.14 99.742768-3 50.1 1.59 14.25 10.20 0.19 7.72 11.88 2.81 0.10 0.14 98.972768-4 45.7 1.80 12.4 14.10 2.72 5.75 9.50 2.77 0.19 0.30 95.202768-6 50.0 1.60 14.21 10.28 0.17 7.75 11.81 2.68 0.11 0.13 98.732768-8 49.3 1.20 15.77 8.92 0.18 8.82 12.14 2.53 0.10 0.09 99.102771-1 49.9 1.68 14.30 10.47 0.19 7.53 11.77 2.77 0.12 0.15 98.862772-1 50.0 1.55 14.23 10.23 0.18 7.73 11.97 2.68 0.12 0.14 98.852772-2 49.7 1.52 14.21 10.10 0.17 7.69 11.95 2.67 0.12 0.14 98.282772-3 49.6 1.71 14.14 10.80 0.19 7.57 11.48 2.76 0.12 0.16 98.51
aMajor-elements in weight percent, measured by Electron Microprobe at the USGS in Denver, Co. Estimated relative errors based on repeat
analyses �2%, except for Na (5%), P (6%) and K (8%).
Table A1b. Rare-Earth Element Compositions of 9�50N EPR Off-Axis Samples Measured by ICPMS and ID-TIMS
Sample La Ce Pr Nd Sm Eu Gd Tb Dy Ho Er Yb Lu
2737-8a 2.6 8.2 1.40 7.6 2.60 1.10 3.80 0.70 4.30 0.93 2.50 2.60 0.402737-8b 8.24 2.662746-4a 2.9 9.2 1.60 8.3 2.90 1.20 4.50 0.77 4.90 1.10 2.90 2.80 0.462746-4a 3.1 9.8 1.7 9.3 3.2 1.2 4.5 0.79 5.0 1.1 2.9 3.0 0.502746-4b 7.48 2.612746-7a 2.8 8.8 1.50 8.0 2.80 1.10 4.10 0.73 4.60 1.00 2.70 2.80 0.432746-9a 2.8 8.7 1.50 8.0 2.80 1.10 4.20 0.74 4.60 1.00 2.70 2.80 0.42
7.97 2.782746-14a 3.6 12.0 2.00 11.0 3.70 1.40 5.30 0.95 5.90 1.30 3.50 3.60 0.542746-14b 10.95 3.682759-12a 4.2 14.0 2.30 13.0 4.30 1.60 6.00 1.10 6.70 1.50 4.00 4.20 0.632759-12b 12.84 4.232759-14a 3.6 11.0 1.90 11.0 3.60 1.40 5.10 0.93 5.80 1.20 3.40 3.60 0.53
10.84 3.532768-3c 4.6 12.0 1.80 11.0 3.6 1.40 5.50 0.94 6.10 1.20 3.80 3.602768-3b 9.81 3.432768-4a 18.0 18.0 4.90 25.0 7.10 2.20 9.10 1.60 10.0 2.10 6.00 6.10 0.892768-4b 13.57 4.582768-6a 3.4 11.0 1.90 9.9 3.40 1.40 5.20 0.93 5.70 1.30 3.40 3.40 0.562768-6b 9.95 3.442768-8a 2.7 8.5 1.40 7.8 2.70 1.00 4.00 0.67 4.20 0.98 2.50 2.50 0.412768-8b 7.91 2.732771-1a 3.5 11.0 1.90 11.0 3.50 1.40 5.10 0.90 5.60 1.20 3.30 3.60 0.532771-1b 10.25 3.552772-1a 3.5 11.0 1.80 9.8 3.50 1.30 5.00 0.91 5.50 1.20 3.30 3.50 0.512772-1b 9.74 3.372772-2a 3.5 11.0 1.90 10.0 3.50 1.30 4.90 0.89 5.60 1.20 3.30 3.50 0.512772-2b 9.74 3.372772-3a 3.9 12.0 2.10 11.0 4.00 1.50 5.70 1.00 6.20 1.40 3.80 3.90 0.582772-3b 10.82 3.73
aREE elements measured by ICPMS at Geological Survey of Canada, errors 5–10% (2 sigma).bSm and Nd concentrations measured by ID-TIMS at UC Berkeley, errors �1% (2 sigma).cREE elements measured by ICPMS at USGS, errors 5–10% (2 sigma).
GeochemistryGeophysicsGeosystems G3G3
sims et al.: aberrant youth 10.1029/2002GC000443
23 of 27

fractionated parts of the melt lens, or erupted lavas
that had longer repose periods and more time to
fractionate.
7. Conclusions
[39] 1. A majority of the measured off-axis
basalt samples from the 9�50 section of the EPR
have U-Th and Th-Ra disequilibria that are larger,
and model ages that are younger, than would be
predicted from their off-axis distance and the time-
integrated spreading rate. There are, however, a
few off-axis samples with U-Th model ages that
are consistent with their spreading rate ages. It is
likely that these samples erupted within or close to
the AST, and aged at a rate proportional to the
spreading rate. The anomalously young model ages
determined for most of the off-axis lavas and the
distribution of surficial lava flows imaged by high-
resolution sonar suggest that volcanic construction
along the 9�–10�N EPR region is occurring over a
zone that is at least �4 km wide, considerably
larger than the few hundred meter width of the
actual AST.
[40] 2. Isotopic compositions of the off-axis N-
MORB analyzed in this study are identical, within
analytical uncertainty, to the isotopic compositions
of the axial lavas from this region. Major- and trace
element variations form coherent trends that can be
related to the axial lavas by differing extents of
fractional crystallization of similar parental mag-
mas generated by polybaric melting.
[41] 3. The combined observational (from both
submersible and remote sensing) and chemical
and isotopic data support a model for the 9�500NEPR area that includes a significant component of
crustal accumulation resulting from lavas that
breach the AST and flow down the flanks of the
EPR ridge crest. However, these data also require a
minor component of off-axis eruptions, which
occur on distinct pillow mounds and ridges, as
imaged by side-looking sonar data. This suggests
that MOR construction at the northern EPR
involves several volcanic and tectonic processes
acting in concert to form a complex patchwork of
lava ages and compositions along and across this
fast spreading ridge crest.
Appendix A
[42] Tables showing major-element compositions
of 9�50N EPR off-axis samples (Table A1a), rare-
earth element compositions of 9�50N EPR off-axis
samples measured by ICPMS and ID-TIMS
(Table A1b), and Cl, K, Rb, Nb, Ba, Ni, Zr, Sr,
Hf and Y concentrations of 9�50N N EPR off-axis
samples (A1c) are given here.
Table A1c. Cl, K, Rb, Nb, Ba, Ni, Zr, Sr, Hf and Y Concentrations of 9�50N N EPR Off-Axis Samplesa
Sample Cl, ppm K, ppm Rb, ppm Nb, ppm Ba, ppm Ni, ppm Zr, ppm Sr, ppm Hf, ppm Y, ppm
2737-8 43 726 0.7 2.20 7 110 82 123 2.30 272746-4 39 800 0.9 2.50 8 81 92 122 2.20 302746-7 41 709 0.8 2.60 9 95 84 120 2.50 282746-9 30 727 0.8 2.50 10 98 84 120 2.40 292746-14 1.3 3.20 9 54 107 119 3.10 342759-12 85 1087 1.1 3.90 11 42 134 126 3.80 432759-14 64 945 0.9 3.40 9 66 109 125 3.10 352768-3 114 835 0.8 3.3 9 86 120 2.00 352768-4 782 1444 1.9 6.30 87 269 183 138 4.10 572768-6 132 948 1.0 3.00 10 57 102 114 2.50 342768-8 14 796 0.8 3.20 9 98 82 129 1.90 272771-1 76 976 0.9 3.20 9 67 110 126 3.00 362772-1 69 996 1.0 3.10 9 54 102 120 2.70 342772-2 81 944 1.0 3.40 10 52 102 121 3.00 352772-3 43 726 1.0 3.60 11 55 117 118 3.40 39
aCl and K measured by electron microprobe at U of Tulsa [Michael and Cornell, 1998]. Errors for both Cl and K are <20 ppm (2s). Ba measured
by ID-ICPMS at WHOI and ID-TIMS at LANL. Uncertainties for both techniques <2% (2s). Zr, Y and Sr measured by XRF at the University ofFlorida, errors are <4% (2s). Rb, Nb, Ni, and Hf concentrations measured by ICPMS at Canadian Geological Survey errors �5% (2s).
GeochemistryGeophysicsGeosystems G3G3
sims et al.: aberrant youth 10.1029/2002GC000443
24 of 27

Acknowledgments
[43] This paper is dedicated to the memory of Judith Miner.
KWWS thanks Hans Schouten, Maurice Tivey, Peter
Kelemen, Tim Elliott, Mark Reagan, Marc Spiegelman, Bob
Detrick, Ed Sklar, Craig Lundstrom and Haibou Zou for
invaluable discussions pertaining to this study. KWWS and
JBT thank Philippe Telouk for assistance with the Plasma 54
and acknowledge financial support from INSU. KWWS and
DJD thank Tom Owens (UC Berkeley) and KWWS and SRH
thank Jurek Blusztajn for their analytical efforts. MRP thanks
Matt Smith, Ian Ridley and Ian Jonasson for analytical
assistance and lively discussion. Constructive reviews by
Tim Elliott and an anonymous reviewer improved the quality
of this manuscript and were much appreciated. Editorial
handling by Bill White was also valuable and appreciated.
Support for this research was provided by NSF grants OCE-
9730967, 83732500 (KWWS), OCE- 9100503 (MRP, DJF),
OCE- 9402360, 9403773 (MRP), OCE 9408904, 9912072,
9819261 (DJF) and Ear 0115433 (NENIMF). Support for
U-series analyses performed at LANL provided by the
Office of Basic Energy Sciences, Geosciences Research
Program, U.S. Department of Energy.
References
Allegre, C. J., and M. Condomines, Basalt genesis and mantle
structure studied through Th-isotopic geochemistry, Nature,
299, 21–24, 1982.
Ball, L., K. Sims, S. Weyer, and J. Schwieters, Measurement of
Th-232/Th-230 in volcanic rocks by PIMMS, using the
ThermoFinnigan Neptune, Geochim. Cosmochim. Acta, 66,
A47, 2002.
Batiza, R., and Y. Niu, Petrology and magma chamber pro-
cesses at the East Pacific Rise - 9�300N, J. Geophys. Res., 97,6779–6797, 1992.
Beattie, P., Uranium-thorium disequilibria and partition-
ing on melting of garnet peridotite, Nature, 363, 63–
65, 1993.
Blichert-Toft, J., C. Chauvel, and F. Albarede, Separation of Hf
and Lu for high-precision isotope analysis of rock samples
by magnetic sector-multiple collector ICP-MS, Contrib.
Mineral. Petrol., 127, 248–260, 1997.
Carbotte, S. M., and K. C. Macdonald, East Pacific Rise 8�–10�300N: Evolution of ridge segments and discontinuities
from SeaMARC II and three-dimensional magnetic studies,
J. Geophys. Res., 97, 6959–6982, 1992.
Chabaux, F., D. B. Othman, and J. L. Birck, A new Ra-Ba
chromatographic separation and its application to Ra mass-
spectrometric measurement in volcanic rocks, Chem. Geol.,
114, 191–197, 1994.
Chadwick, W. W., and R. W. Embley, Lava flows from a mid-
1980s submarine eruption on the cleft segment, Juan de Fuca
ridge, J. Geophys. Res., 99, 4761–4776, 1994.
Christeson, G. L., G. M. Purdy, and G. J. Fryer, Structure of
young upper crust at the East Pacific Rise near 9�300N, Geo-phys. Res. Lett., 19, 1045–1048, 1992.
Christeson, G. L., G. M. Purdy, and G. J. Fryer, Seismic con-
straints on shallow crustal emplacement processes at the fast-
spreading East Pacific Rise, J. Geophys. Res., 99, 17,957–
17,973, 1994.
Christeson, G. L., G. M. Kent, G. M. Purdy, and R. S. Detrick,
Extrusive thickness variability at the East Pacific Rise, 9�–10�N, constraints from seismic techniques, J. Geophys. Res.,
101, 2859–2873, 1996.
Cochran, J. R., D. J. Fornari, B. J. Coakley, R. Herr, and M. A.
Tivey, Continuous near-bottom gravity measurements made
with a BGM-3 gravimeter in DSVAlvin on the East Pacific
Rise crest near 9�300N and 9�500N, J. Geophys. Res., 104,10,841–10,861, 1999.
Cohen, A. S., and R. K. O’Nions, Precise determination of
femtogram quantities of radium by thermal ionization mass
spectrometry, Anal. Chem., 63, 2705–2708, 1991.
Cooper, K., S. J. Goldstein, K. W. W. Sims, and M. T. Murrell,
Uranium-series chronology of Gorda Ridge volcanism: New
evidence from the 1996 eruption, Earth Planet. Sci. Lett.,
206, 459–475, 1996.
DePaolo, D. J., Neodymium Isotope Geochemistry, Springer-
Verlag, New York, 1988.
Detrick, R. S., P. Buhl, E. Vera, J. Orcutt, J. Madsen, and
T. Brocher, Multi-channel seismic imaging of a crustal
magma chamber along the East Pacific Rise, Nature, 326,
35–41, 1987.
Fornari, D., R. Haymon, M. Perfit, T. K. P. Gregg, and M. H.
Edwards, Axial summit trough of the East Pacific Rise, 9�–10�N: Geological characteristics and evolution of the axial
zone on fast spreading mid-ocean ridges, J. Geophys. Res.,
103, 9827–9855, 1998.
Goldstein, S. J., M. T. Murrell, and D. R. Janecky, Th and U
isotopic systematics of basalts from the Juan de Fuca and
Gorda Ridges by mass spectrometry, Earth Planet. Sci. Lett.,
96, 134–146, 1989.
Goldstein, S. J., M. T. Murrell, D. R. Janecky, J. R. Delaney,
and D. Clague, Geochronology and petrogenesis of MORB
from the Juan de Fuca and Gorda Ridges by 238U-230Th
disequilibrium, Earth Planet. Sci. Lett., 107, 25–41, 1991.
(Erratum, Earth Planet. Sci. Lett., 109, 255–272, 1992.)
Goldstein, S. J., M. T. Murrell, and R. W. Williams, 231Pa and230Th chronology of mid-ocean ridge basalts, Earth Planet.
Sci. Lett., 115, 151–160, 1993.
Goldstein, S. J., M. R. Perfit, R. Batiza, D. J. Fornari, and M. T.
Murrell, Off-axis volcanism at the East Pacific Rise detected
by uranium-series dating of basalts, Nature, 367, 157–159,
1994.
Gregg, T. K. P., D. F. Fornari, M. P. Perfit, R. M. Haymon, and
J. H. Fink, Rapid emplacement of a mid-ocean ridge lava
flow on the East Pacific Rise at 9�460–510N, Earth Planet.
Sci. Lett., 144, E1–E7, 1996.
Harding, A. J., G. M. Kent, and J. A. Orcutt, A multichannel
seismic investigation of upper crustal structure at 9�N on the
East Pacific Rise: Implications for crustal accretion, J. Geo-
phys. Res., 98, 13,925–13,944, 1993.
Haymon, R. M., D. J. Fornari, M. H. Edwards, S. C. Carbotte,
D. Wright, and K. C. Macdonald, Hydrothermal vent distri-
bution along the East Pacific Rise Crest (9�090–540N) and its
GeochemistryGeophysicsGeosystems G3G3
sims et al.: aberrant youth 10.1029/2002GC000443
25 of 27

relationship to magmatic and tectonic processes on fast-
spreading mid-ocean ridges, Earth Planet. Sci. Lett., 104,
513–534, 1991.
Haymon, R., et al., Volcanic eruption of the mid-ocean ridge
along the East Pacific at 9�45–520N: I. Direct submersible
observation of sea floor phenomena associated with an erup-
tion event in April, 1991, Earth Planet. Sci. Lett., 119, 85–
101, 1993.
Hooft, E. E. E., H. Schouten, and R. S. Detrick, Constraining
crustal emplacement processes from the variation in seismic
layer 2A thickness at the East Pacific Rise, Earth Planet. Sci.
Lett., 142, 289–309, 1996.
Jull, M., P. Kelemen, and K. W. W. Sims, Melt migration and
uranium series disequilibria: The combined effect of porous
and conduit flow, Geochim. Cosmochim. Acta., 66, 4133–
4148, 2003.
Ku, T.-L., K. G. Knauss, and G. G. Mathieu, Uranium in open
ocean: Concentration and isotopic composition, Deep Sea
Res., 1977, 1005–1017, 1977.
Kurras, G. J., D. J. Fornari, M. H. Edwards, M. J. Perfit, and
M. C. Smith, Volcanic morphology of the East Pacific Rise
Crest 9�49–520: Implications for volcanic emplacement pro-
cesses at fast-spreading mid-ocean ridges, Mar. Geophys.
Res., 21, 23–41, 2000.
Landwehr, D., J. Blundy, E. M. Chamorro-Perez, E. Hill, and
B. Wood, U-series diisequilibria generated by partial melting
of spinel lherzolite, Earth Planet Sci. Lett., 188, 329–348,
2001.
Langmuir, C. H., J. F. Bender, and R. Batiza, Petrological
segmentation of the East Pacific Rise, 5�300–14�300N,Nature, 322, 422–429, 1986.
LaTourrette, T. Z., A. K. Kennedy, and G. J. Wasserburg,
U-Th fractionation by garnet-evidence for a deep source
and rapid rise by oceanic basalts, Science, 261, 739–742,
1993.
Layne, G. D., and K. W. Sims, Secondary Ion Mass Spectro-
metry for the measurement of 232Th/230Th in volcanic rocks,
Int. J. Mass Spect., 203, 187–198, 2000.
Lundstrom, C. C., J. Gill, Q. Williams, and M. R. Perfit, Man-
tle melting and basalt extraction by equilibrium porous flow,
Science, 270, 1958–1961, 1995.
Lundstrom, C. C., D. E. Sampson, M. R. Perfit, J. Gill, and
Q. Williams, Insights into mid-ocean ridge basalt petrogen-
esis: U-series disequilibria from the Siqueiros Transform,
Lamont Seamounts, and East Pacific Rise, J. Geophys.
Res., 104, 13,035–13,048, 1999.
Lundstrom, C. C., Q. Williams, and J. Gill, A geochemically
consistent hypothesis for MORB generation, Chem. Geol.,
162, 105–126, 2000.
Macdonald, K. C., and P. J. Fox, The axial summit graben and
cross-sectional shape of the East Pacific Rise as indicators of
axial magma chambers and recent volcanic eruption, Earth
Planet. Sci. Lett., 88, 119–131, 1988.
Macdonald, K. C., P. J. Fox, R. T. Alexander, R. Pockalny, and
P. Gente, Volcanic growth faults and the origin of Pacific
abyssal hills, Nature, 380, 125–129, 1996.
McDonough, W. M., and S.-S. Sun, The composition of the
Earth, Chem. Geol., 120, 223–253, 1995.
McKenzie, D., 230Th-238U disequilibrium and the melting pro-
cesses beneath ridge axes, Earth Planet. Sci. Lett., 72, 149–
157, 1985.
Michael, P. J., and W. C. Cornell, Influence of spreading rate
and magma supply on crystallization and assimilation
beneath mid-ocean ridges: Evidence from chlorine and
major-element chemistry of mid-ocean ridge basalts,
J. Geophys. Res., 103, 18,325–18,356, 1998.
Perfit, M. R., and W. W. Chadwick Jr., Magmatism at mid-
ocean ridges: Constraints from volcanological and geochem-
ical investigations, in Faulting and Magmatism at Mid-Ocean
Ridges, edited by W. R. Buck et al., pp. 41–70, AGU,
Washington, D.C., 1998.
Perfit, M., D. Fornari, M. Smith, J. Bender, C. Langmuir, and
R. Haymon, Small-scale spatial and temporal variations
in MORB geochemistry and implications for ridge crest
magmatic processes, Geology, 22, 375–379, 1994.
Perfit, M. R., et al., Recent volcanism in the siqueiros trans-
form fault: Picritic basalts and implications for MORB
magma genesis, Earth Planet. Sci. Lett., 141, 61–73, 1996.
Reynolds, J. R., and C. H. Langmuir, Identification and
implications of off-axis lava flows around the East Pacific
Rise, Geochem. Geophys. Geosyst., 1, Paper number
1999GC000033, 2000.
Rubin, K. H., and J. D. MacDougall, Dating of neovolcanic
MORB using (226Ra/230Th) disequilibrium, Earth. Planet.
Sci. Lett., 101, 313–321, 1990.
Rubin, K., J. D. Macdougall, and M. R. Perfit, 210Po-210Pb
dating of recent volcanic eruptions on the sea floor, Nature,
368, 841–844, 1994.
Saal, A. E., J. A. Van Orman, E. H. Hauri, C. H. Langmuir, and
M. R. Perfit, An alternative hypothesis for the origin of the
high Ra-226 excess in mid-ocean ridge basalts, Geochim.
Cosmochim. Acta, 66, A659, 2002.
Scheirer, D. S., and K. C. Macdonald, Variation in cross-sec-
tional area of the axial ridge along the East Pacific Rise:
Evidence for the magmatic budget of a fast spreading center,
J. Geophys. Res., 98, 22,321–22,338, 1993.
Scheirer, D. S., D. J. Fornari, S. E. Humphris, and S. Lerner,
High-resolution seafloor mapping using the DSL-120 sonar
system: Quantitative assessment of side-scan and phase-
bathymetry data from the Lucky Strike segment of the
Mid-Atlantic Ridge, Mar. Geophys. Res., 21, 121–142,
2000.
Schouten, H., M. A. Tivey, D. J. Fornari, and J. R. Cochran,
Central Anomaly Magnetization High: Constraints on the
volcanic construction and architecture of seismic layer 2A
at a fast-spreading Mid-Ocean Ridge, the EPR at 9�300–500N, Earth Planet. Sci. Lett., 169, 37–50, 1999.
Schouten, H., M. Tivey, D. Fornari, D. Yoeger, A. Bradley,
M. Edwards, P. Johnson, and Ship Board Science and Tech-
nical Teams, Near-Bottom Investigations of the Central
Anomaly Magnetic High (CAMH) at the Aest Pacific Rise
9�250–57N, Cruise Report R/V Atlantis Voyage 7 Leg 4,
11/05–12/04/2001, 2001. (Available at http://imina.soest.
hawaii.edu/HMRG/EPR/index.htm)
Schouten, H., M. Tivey, D. Fornari, D. Yoerger, A. Bradley,
P. Johnson, M. Edwards, and T. Kurokawa, Lava transport
GeochemistryGeophysicsGeosystems G3G3
sims et al.: aberrant youth 10.1029/2002GC000443
26 of 27

and accumulation processes on EPR 9 270N to 10N: Inter-
pretations based on recent near-bottom sonar imaging and
seafloor observations using ABE, Alvin and a new digital
deep sea camera, Eos Trans. AGU, 83(47), Fall Meet. Suppl.,
Abstract T11C-1262, 2002.
Sims, K. W. W., D. J. DePaolo, M. T. Murrell, W. S. Baldridge,
S. J. Goldstein, and D. A. Clague, Mechanisms of magma
generation beneath Hawaii and mid-ocean ridges: U/Th and
Sm/Nd isotopic evidence, Science, 267, 508–512, 1995.
Sims, K. W. W., D. J. DePaolo, M. T. Murrell, W. S. Baldridge,
and S. J. Goldstein, Porosity of the melt zone and variations
in solid mantle upwelling rates beneath Hawaii: Inferences
from 238U-230Th-226Ra and 235U-231Pa Disequilibria, Geo-
chim. Cosmchim. Acta., 63, 4119–4138, 1999.
Sims, K. W. W., et al., Chemical and isotopic constraints on the
generation and transport of melt beneath the East Pacific
Rise, Geochim. Cosmchim. Acta., 66, 3481–3504, 2002.
Smith, M. C., M. R. Perfit, D. J. Fornari, W. I. Ridley, M. H.
Edwards, G. J. Jurras, and K. L. Von Damm, Magmatic
processes and segmentation at a fast spreading mid-ocean
ridge; detailed investigation of an axial discontinuity on
the East Pacific Rise crest at 9 degrees 370N, Geochem.
Geophys. Geosyst., 2, Paper 2000GC000134, 2001.
Spiegelman, M., and T. Elliott, Consequences of melt transport
for uranium series disequilibrium in young lavas, Earth
Planet. Sci. Lett., 118, 1–20, 1993.
Thurber, D., Anamolous 234U/238U in nature, J. Geophys. Res.,
67, 4518, 1962.
Todt, W., R. A. Cliff, A. Hanser, and A. W. Hofmann, Evalua-
tion of a 202Pb-205Pb double spike for high-precision lead
isotope analysis, in Earth Processes Reading the Isotopic
Code, vol. 95, edited by S. R. Hartand and A. Basu,pp. 429–437, AGU, Washington, D.C., 1996.
Vera, E. E., and J. B. Diebold, Seismic imaging of oceanic
layer 2A between 9�30 and 10�N on the East Pacific Rise
from two ship wide-aperature profiles, J. Geophys. Res., 99,
3031–3041, 1994.
Volpe, A. M., and S. J. Goldstein, 226Ra-230Th Disequilibrium
in Axial and Off-Axis Mid-Ocean Ridge Basalts, Geochim.
Cosmochim. Acta., 57, 1233–1242, 1993.
Volpe, A. M., J. A. Olivares, and M. T. Murrell, Determination
of radium isotope ratios and abundances in geologic samples
by thermal ionization mass spectrometry, Anal. Chem., 63,
913–916, 1991.
White, S. M., R. M. Haymon, D. J. Fornari, M. R. Perfit, and
K. C. Macdonald, Correlation between volcanic and tectonic
segmentation of fast-spreading ridges: Evidence from volca-
nic structures and lava flow morphology on the East Pacific
Rise at 9–10N, J. Geophys. Res., 107(B8), doi:10.1029/
2002GC000443, 2002.
White, W. M., F. Albarede, and P. Telouk, High-precision
analysis of Pb isotope ratios using multi-collector ICP-MS,
Chem. Geol., 167, 257–270, 2000.
Williams, R. W., and J. B. Gill, Effects of partial melting on
the uranium decay series, Geochim. Cosmochim. Acta., 53,
1607–1619, 1989.
GeochemistryGeophysicsGeosystems G3G3
sims et al.: aberrant youth 10.1029/2002GC000443
27 of 27