geodetic research in finland in the 20 century · geodetic research in finland in the 20th century...
TRANSCRIPT

Geophysica (2001), 37(1–2), 33–77
Geodetic Research in Finland in the 20th Century
Juhani Kakkuri
Finnish Geodetic InstituteGeodeetinrinne 2, FIN-02430 Masala, Finland
(Received: September 2000; Accepted: March 2001)
1. Birth of geodetic tradition in Finland
The Earth was considered to be a sphere until the end of the 17th century. Onlythen, the concept of an Earth flattened at the poles was beginning to gain support amongscientists. A powerful influence in this respect had especially the Englishman IsaacNewton, who, in his opus Principia, appearing in 1687, described, based on his theoreti-cal investigations, the Earth as flattened at the poles in a ratio of 1:230.
1.1 Lapponian arc measurement
The genesis and development of a geodetic tradition in Finland was in fact the re-sult of Newton’s theoretical investigation mentioned earlier, as it was connected with ascientific disagreement receiving extensive international attention, which was resolvedhere in our northern country.
The French astronomers did not consider Newton’s result correct, because arc meas-urements performed in 17th and beginning 18th centrury in France had proved the op-posite, i.e., the Earth is elongated at the poles. This was quite certain at least in the mindof the famous astronomer J. Cassini; he had personally handled the arc measurementsand obtained for the amount of elongation as much as 7.5%.
A heated debate took place in the French Academy on the subject “prolate or ob-late”, and the most renowned cultural personality of the day, the enlightenment writerVoltaire, described how in Paris the Earth was considered melon-shaped, whereas inLondon it was flattened from both “sides”.
In order to resolve the disagreement, the Academy equipped two expeditions toperform measurements along a meridian arc: one to the equator, the other to the highNorth. Each of the expeditions was to determine the length of a meridian arc of one de-gree in its respective area of measurement. If it were longer in the North than in theequator, Newton was right, in the opposite case Cassini.
Published by the Geophysical Society of Finland, Helsinki

Juhani Kakkuri34
One of the expeditions, led first by Louis Godin, but later by Charles-Maria de LaCondamine, traveled in 1735 to the equator in Perú, and the other, led by Pierre-LouisMoreau de Maupertuis, traveled in 1736 to Lapland, the Torne river valley.
The Lapponian arc measurement was carried out mostly on the present Finnishterritory – then a Swedish province. The expedition completed its work in 1737. Be-cause the meridian arc of one degree turned out to be clearly longer up in Fennoscandiathan the similar arc in France, scientific evidence had been obtained to the effect thatthe Earth was flattened at the poles. The Peruvian expedition completed its work notbefore 1744. Its result confirmed that of Maupertuis.
The arc measurement extending from the town of Tornio to the top of the hillKittisvaara in Pello attracted great attention abroad. Finland, the far away land in theNorth, came into the focus of international attention, and Maupertuis’ work published in1738: La Figure de la Terre attracted an ample readership among the European elite ofthe day, and no less attention attracted the work Journal d’un voyage au Nord, pub-lished in 1744 by Maupertuis’ travel companion, the abbott Outhier. Above all the ro-mantic descriptions of nature in these writings attracted the attention of contemporariesand sparked a longing for magic, far away Lapland.
1.2 Historical triangulations in the North after Maupertuis
The Lapponian arc measurement affected in a positive way also the mapping activitiesin the then Swedish-Finnish kingdom. It did not just terminate the debate on the figureof the Earth, but was also beneficial to the mapping of the realm: Maupertuis’measurements had provided both Tornio and Kittisvaara with precise latitude values bymeans of astronomical measurements. Mapping the realm had not been feasible withoutprecise geodetic measurements. Soon such were made throughout the extended territoryof the kingdom.
In 1748, a special surveying committee was established in Finland, and as its firstobservator was named Jakob Gadolin. He measured in 1748–1750 and 1752–1753 theTurku-Åland triangle chain, and from there on across the Åland Sea to the Swedishcoast at Grisslehamn. In 1754 Johan Justander continued the work of Gadolin, who hadgone to Turku University to become Professor of Physics, by extending the triangula-tion eastwards from Turku, along the coast of the Gulf of Finland, arriving in Helsinkiin 1774.
In 1801–1803 the Swede Jöns Svanberg repeated Maupertuis’ measurementsalong the original triangle chain, at the same time extending it to both North and South.However, the interest of Svanberg was not mapping but a check on the flattening ratioof the Earth.
Also the Russo-Scandinavian arc measurement, planned by one of the great namesin the history of astronomy, Wilhelm Struve, was done to check the dimensions of theEarth. This measurement started at the Danube delta, ran through Belo-Russia andEstonia to Finland and from here onward into the Norwegian fells and the Arctic Ocean.

Geodetic Research in Finland in the 20th Century 35
It entered Finland from Gogland island and, passing west of Loviisa to the area ofJyväskylä, ran from there on through Kajaani, Oulu, Tornio and Muonio toHammerfest. The measurements were started in 1816, and the angle observations in thepart located in Finland were done in 1830–1845.
Of the triangulations which took place during the 19th century, also the Baltic tri-angulation must be mentioned. It was done by the Hydrographic Department of theRussian Naval Ministry in 1828–1838. This measurement ran along the coast of theGulf of Finland from the Eastern border to Åland and from there to Sweden, where itconnected to the points Söderarm, Arholm and Grisslehamn determined by Swedishgeodesists. All in all 398 triangulation points were measured on the Finnish territory.
Neither of these measurements mentioned above, the Russo-Scandinavian arcmeasurement and the Baltic triangulation, was very useful to Finnish mapping. In bothmeasurements the triangulation point set was poorly marked in the terrain, as a result ofwhich points were later difficult to find, and a large part of them soon vanished com-pletely.
1.3 H.J. Walbeck and the Dimensions of the Earth
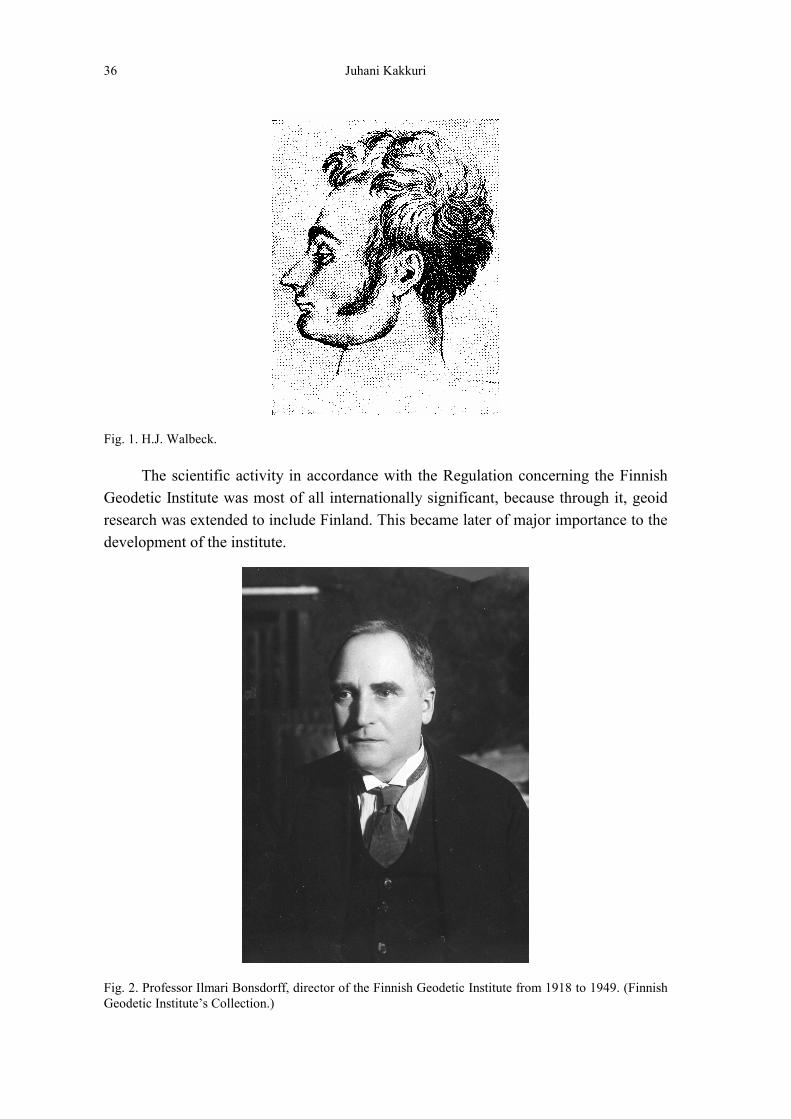
Besides the geodetic measurements summed up above, also original geodetic re-search was done in Finland during the 19th century, especially by the astronomer H.J. Wal-beck of the Observatory of Turku. At the age of 25 only, Walbeck published the workDe forma et magnitudine telluris ex dimensis arcubus meridiani definiendis (Deter-mining the figure and size of the Earth by means of meridian arc measurements). In ithe, as one of the first to do so, applied the least squares procedure known from mathematicalstatistics to the determination of the figure and dimensions of the Earth. He derived the di-mensions of the Earth from five different arc measurements, obtaining a = 6 376 896 kmand f = 1:302.8, values used in Russian geodetic measurements for almost a century.Through his publication, Walbeck got acquainted with Wilhelm Struve, and planned onStruve’s request the course through Southern Finland of the triangulation chain belongingto the Russian-Scandinavian arc measurement.
1.4 The establishment of the Finnish Geodetic Institute
On July 5th, 1918, seven months after Finland had become an independent state, theGovernment of Finland established the Finnish Geodetic Institute. The main task of theinstitute was defined as the first order triangulations with the geodetic and astronomicalmeasurements belonging to it. Additionally the institute was to collect and organizegeodetic material from elsewhere as well as to take initiatives for completion of thegeodetic-astronomical base which directly belonged to its mandate. The second task ofthe institute was defined as pure scientific research: it was to promote the solution ofproblems connected with its practical work, investigate geodetic (i.e. geoid-related)elements and follow closely the development of geodesy.
Juhani Kakkuri36
Fig. 1. H.J. Walbeck.
The scientific activity in accordance with the Regulation concerning the FinnishGeodetic Institute was most of all internationally significant, because through it, geoidresearch was extended to include Finland. This became later of major importance to thedevelopment of the institute.
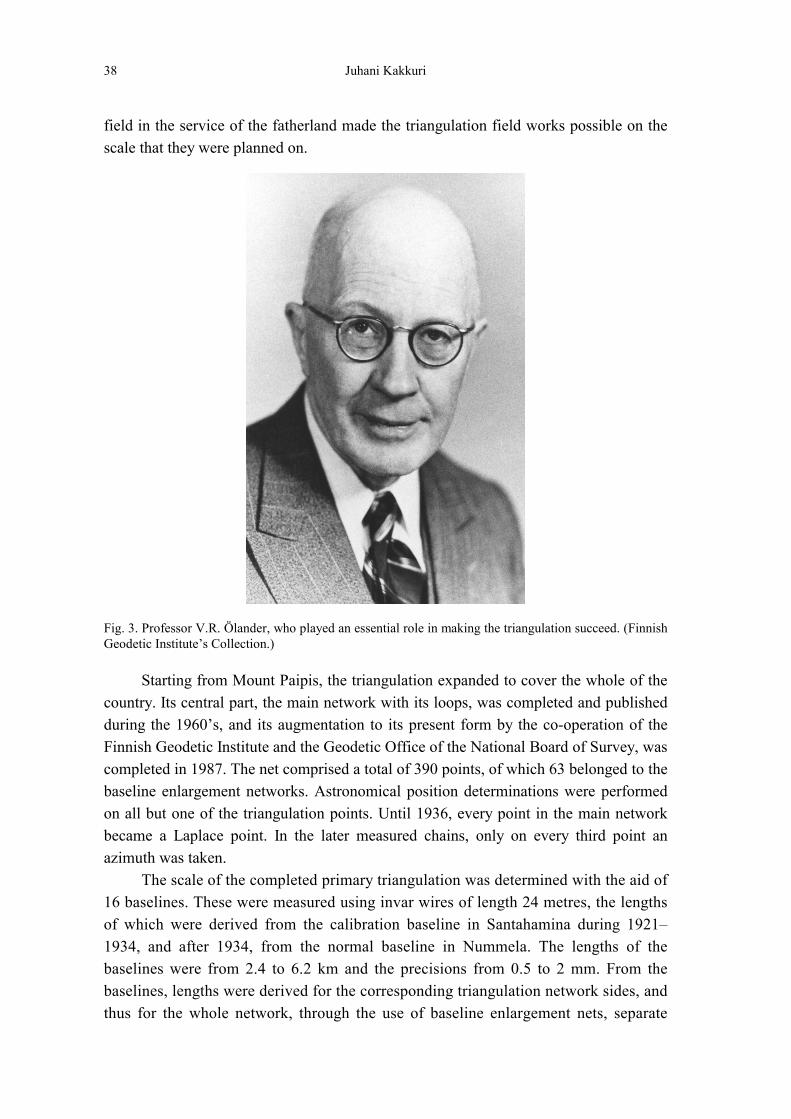
Fig. 2. Professor Ilmari Bonsdorff, director of the Finnish Geodetic Institute from 1918 to 1949. (FinnishGeodetic Institute’s Collection.)

Geodetic Research in Finland in the 20th Century 37
2. Primary triangulation of Finland
In its early years the Finnish Geodetic Institute created the material preconditionsfor performing first order triangulations. This included the procurement of suitable meas-urement instruments. The director of the newly founded Institute, Ilmari Bonsdorff, trav-elled promptly to Germany in order to personally make up contracts on the purchase ofdevices and instruments with the factories manufacturing these. As a result of this jour-ney, our country obtained a set of excellent measurement devices, among others threeHildebrand-theodolites for triangulation, two Hildebrand universal instruments and oneBamberg universal instrument for astronomical direction determinations as well as twoBamberg transit instruments for astronomical positioning.
Based on the above, the Institute initially decided to measure only simple trianglechains, with rather large holes in-between. This main network would then later bestrengthened by doubling the chains or filling the holes with new triangulations. In orderto obtain the greatest possible accuracy, it was decided firstly to make the triangle sides30–50 km long, the triangle angles at least 40° and the standard errors of the anglemeasurements as computed from observation series at most 0.3″. Additionally baselineswere to be measured in the various parts of the net, 3–6 km long, so precisely and somany of them, that the remaining scale error of the triangle sides would nowhere exceed5 mm/km. As aiming points, only lighted targets were decided to be used; i.e., no unlittriangulation towers or their signals like in lower order triangulations.
Astronomical latitude and longitude determination was decided to be performedon all points of the main network in order to determine the deflections of the vertical.These “disturbing quantities” had to be known, because angle measured within the truehorizontal plane had to be projected, for mapping purposes, onto the tangent plane tothe reference ellipsoid. If, in addition to astronomical longitude, also the astronomicalazimuth was determined, a triangulation point was called a Laplace point. In one point,such a measurement was mandatory in order to orient the triangle network, with multi-ple Laplace points it became possible to formulate so-called Laplace equations, whichwere used in the adjustment of the triangulation as constraint conditions, in order tominimize the effect of systematic errors.
2.1 Field work of the primary triangulation
One may say that the field works of the Finnish Geodetic Institute commenced of-ficially on May 19th, 1919, when the civil servants employed by the Institute at thattime, travelled under the leadership of Ilmari Bonsdorff to a hilltop in the village Paipisin the parish of Sibbo, in order to start the terrain work needed for the construction ofthe triangulation net. Among these civil servants were, among others, Yrjö Väisälä, whowas made responsible for the triangulation sites west of Paipis, and Jaakko Keränen,who assumed responsibility for the points east of Paipis. The triangulation field crewsreceived assistance from soldiers of the Finnish Armed Forces. Also their work in this
Juhani Kakkuri38
field in the service of the fatherland made the triangulation field works possible on thescale that they were planned on.
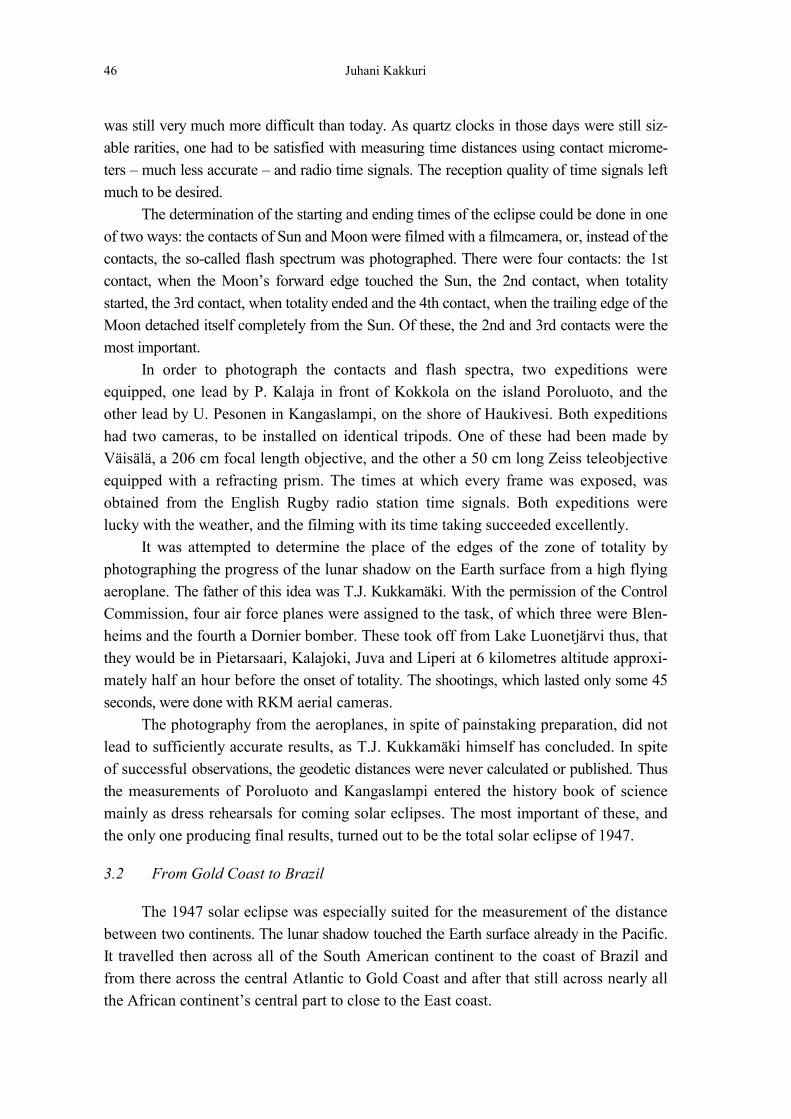
Fig. 3. Professor V.R. Ölander, who played an essential role in making the triangulation succeed. (FinnishGeodetic Institute’s Collection.)
Starting from Mount Paipis, the triangulation expanded to cover the whole of thecountry. Its central part, the main network with its loops, was completed and publishedduring the 1960’s, and its augmentation to its present form by the co-operation of theFinnish Geodetic Institute and the Geodetic Office of the National Board of Survey, wascompleted in 1987. The net comprised a total of 390 points, of which 63 belonged to thebaseline enlargement networks. Astronomical position determinations were performedon all but one of the triangulation points. Until 1936, every point in the main networkbecame a Laplace point. In the later measured chains, only on every third point anazimuth was taken.
The scale of the completed primary triangulation was determined with the aid of16 baselines. These were measured using invar wires of length 24 metres, the lengthsof which were derived from the calibration baseline in Santahamina during 1921–1934, and after 1934, from the normal baseline in Nummela. The lengths of thebaselines were from 2.4 to 6.2 km and the precisions from 0.5 to 2 mm. From thebaselines, lengths were derived for the corresponding triangulation network sides, andthus for the whole network, through the use of baseline enlargement nets, separate

Geodetic Research in Finland in the 20th Century 39
small triangulation networks. The network was tied through the Torne river valley,across the Bothnian channel and over Åland to the Swedish triangulation, and at thelocation of Helsinki to the Estonian triangulation network. At the southeastern borderthe network extended onto the territory of the former Soviet Union.
The Finnish primary triangulation is the most precise of its kind in the world, as init, the relative errors between neighbouring triangulation points are at most a fewcentimetres. V.R. Ölander has played an essential role in making the triangulation suc-ceed. Also the effort of U. Pesonen was considerable, as well as that of E. Hytönen, J.Korhonen and T.J. Kukkamäki. Of the younger generation of geodesists especially R.Konttinen, J. Kääriäinen, T. Parm and M. Poutanen must be mentioned, on whose shoul-ders the augmentations of the main network have rested. In addition, T. Parm has meas-ured by geodimeter a traverse extending from Jänhiälä to Kaamanen (Inari), of length880 km, in order to check the scale of the main network.
2.2 Coordinate systems and geodetic datum
In order to get a geodetic system, we must have, in addition of the radius a of theequator and flattening f of the reference ellipsoid, a datum point, i.e. its geodetic coor-dinates: latitude ϕ and longitude λ , and the azimuth A of some direction at this point. Ifanyone of these five quantities: a, f, ϕ , λ , and A changes, the whole geodetic systemchanges too.
The classical procedure of the terrestrial triangulation is the following: we com-pute, starting from the datum point, the geodetic coordinates and azimuths ϕ , λ , and A ofthe points of the triangulation net on the reference ellipsoid. The astronomically ob-served corresponding quantities ϕ ′ , λ ′ and A' are referred to the geoid. The differencebetween these quantities gives the known equations for computing the vertical deflec-tion components ξ and η . These equations are
( )( )
−′=−′=−′=
ϕηϕλλη
ϕϕξ
ctgcos
AA(1)
The last two equations give the famous Laplace’s equation:
( ) ϕλλ sin−′=−′ AA (2)
Computed values of the vertical deflection components ξ and η at the triangula-tion points are not absolute (geocentric) but only relative. They depend on the dimen-sions of the reference ellipsoid, a and f, as well as on how correctly the vertical deflec-tion components of the datum point, 0ξ and 0η , are known. If anyone of them is wrong,especially 0ξ and 0η , we get quite “incorrect” components ξ and η (Heiskanen, 1951),
relating to a non-geocentric reference ellipsoid.

Juhani Kakkuri40
The Finnish Geodetic Institute took in use for its own calculations the so-calledHayford ellipsoid, which in 1924 also was chosen as the international reference ellip-soid. Its dimensions are a = 6 378 388 km and f = 1:297.0. In 1922 also the NationalBoard of Survey and the National Board of Navigation decided to use the Hayford el-lipsoid as the basis for their own maps. Thus the same ellipsoid was used in Finland asthe basis for all maps, and at the same time the trouble that may be caused by using dif-ferent ellipsoids for the maps of the country was avoided.
The choice of the datum point proved to be a problem, because the coordinatesystem that had been in use before 1922 was heterogeneous and imprecise, and couldnot guarantee proper coordinates for a datum point. When the Finnish Geodetic Institutepublished in 1924 the results of its first triangulation chain (Åland–Helsinki), it chosefor the coordinates of the datum point the astronomical coordinates of the point Hjortö,in Korpo. The Hjortö system soon proved to be unsuitable and already in 1927 theInstitute abandoned it, moving to a new adjusted system partly based on gravimetricmeasurements. In 1931, the Institute published an improved version of the adjustedsystem, the so-called second adjusted system. The fourth system used by the FinnishGeodetic Institute was the all-European ED-50, or European Datum 1950, the startingcoordinates of which were defined thus, that they produced a minimum for the squaresum of the plumbline deviations for approximately 100 points all over Europe. The re-sults of the adjustment of the primary triangulation published in 1967 were given in theED-50 system.
When the National Board of Survey in 1922 moved to using the Hayford refer-ence ellipsoid and Gauss–Krüger rectangular coordinates with zones three degreeswide, it chose at the same time as starting coordinates the coordinate values for the Hel-sinki astronomical observatory at the time, its longitude reckoned from the Greenwichmeridian. This choice was mainly dictated by practical considerations, as the works ofthe Finnish Geodetic Institute had only just started, and precise values for the coordi-nates of the observatory were not known yet. This so-called Helsinki System was usedby the National Board until 1970. Not until the network of the primary triangulation hadbeen adjusted by the Finnish Geodetic Institute, did the National Board of Survey moveto using, instead of the Helsinki system, the so-called The National Grid CoordinateSystem (kkj in Finnish), which it had obtained by translating and rotating the network ofthe primary triangulation so, that it coincided as precisely as possible, in practice towithin a few metres, with the Helsinki system.
The Helsinki System as well as the National Grid Coordinate System differ quitesubstantially from the system defined by all-European starting points; e.g. from the ED-50 system in the north-south direction 52.3 metres and in the east-west direction 127.8metres on the average. Even a difference that great has no noticeable effect on the inter-nal accuracy of maps, but if one compares map coordinates to all-European coordinates orcoordinates given by positioning satellites in the WGS-84 system, the differences areclearly visible.

Geodetic Research in Finland in the 20th Century 41
On the year of its 75th anniversary, the Finnish Geodetic Institute published theresults of the final adjustment of the primary triangulation in the ED87-FIN system.This completed the first-order terrestrial triangulation of Finland (Jokela, 1994).
2.3 The Finnish Permanent GPS Network – FinnRef
The Finnish Permanent GPS Network was established in the 1990’s mainly forstudying the relative crustal movements inside the Finnish territory. The network con-sists of 12 permanent GPS stations, namely the following: Joensuu, Kevo, Kivetty, Kuu-samo, Metsähovi, Olkiluoto, Oulu, Romuvaara, Sodankylä, Tuorla, Vaasa ja Virolahti.Each of them is equipped with an Ashtech Z-12 received, a Dorne Margolin type an-tenna, and a Vaisala PTU meteorological sensor system. Antenna platforms are eithersteel grid masts, concrete pillars (Kivetty, Olkiluoto and Romuvaara) or invar stabilizedsteel masts (Metsähovi and Oulu). All the stations belong also to the FennoscandianPermanent GPS Network.
The function of the Finnref Net is to act as a basis for the geodetic reference sys-tems and for cadastral surveys in Finland. In addition, the stations take part in the geo-detic operations, especially in those, which are aimed at studying crustal motion phe-nomena such as plate tectonic motions, intraplate crustal deformation, and Fennoscan-dian postglacial rebound. Some of the stations, namely Joensuu, Metsähovi, Sodankylä andVaasa, work for the EUREF-coordinate system (European Geodetic Reference Frame).
2.4 Astronomical measurements
Astronomical direction and position determinations have from the very beginningbelonged to the work program of the Finnish Geodetic Institute. They are the astro-nomic determinations of latitude, longitude and azimuth, mentioned in the foundingregulation, that were to be made “on such points, that the orientation of the trianglesystem on the mathematical Earth surface can be ensured and that the greatest possibleusefulness will accrue for the control of the triangulation and the determination of theelements of the geoid”.
2.4.1 Astronomical measurements in 1920
The first triangle chain of the Institute, which was along the coast of the Gulf of Fin-land, had been reconnoitred in 1919. In the summer of the following year, the expeditions ofthe Institute built observation towers on the points on the Western side of the chain, in thefollowing order: Lemlaks, Dragsfjärd, Vestlaks, Perniö, Tenala and Degerby. On most tri-angle points in the Archipelago Sea, it was possible to observe directly “on the rocks”, so itsufficed to erect suitable observation pillars out of stone and concrete. Such were built on thefollowing triangle points: Prostvik, Nötö, Hjortö, Jungfruskär, Sälskär, Geta, Toböle, Kum-linge, Kökar, Storskär, Utö, Vänö, Bengtskär and Hanko.

Juhani Kakkuri42
The actual measurements were started in May 1, 1920. The Institute’s Director IlmariBonsdorff, optimistic as always, had decided to do angle observations and astronomical ob-servations at the same time. For this, the Institute had purchased a Hildebrand universal in-strument, with which horizontal and vertical angles, astronomical directions or azimuths,and astronomical latitude, could be easily measured. Longitude, for which precise time sig-nals would be needed, were to be measured separately. It would not be needed at all for thedetermination of the North component of the deviation of the vertical, and not for the Eastcomponent either, as these could easily be computed with Eqs. 1: ϕϕξ −′= and
( ) ϕη ctgA-A′= , not containing longitude. The measurement works, of which Bons-dorff personally did the lion’s share, progressed in the following order: Prostvik, Lem-laks, Hjortö, Nötö, Storskär, Bengtskär, Dragsfjärd, Utö, Kökar and Jungfruskär. Angleobservations were done on all these points, similarly astronomical latitude and azimuthobservations, with the exception of the Bengtskär and Utö lighthouses.
2.4.2 The Petsamo border survey 1921
During the summer of 1921 no astronomical measurements were done on trianglepoints at all. The reason was the Petsamo boundary survey. Ilmari Bonsdorff had al-ready in January–February made a three weeks’ official journey to Germany and Austriain order to acquire instruments and other equipment for the survey. In June–October heacted on order from the Cabinet as the Finnish chairman of the border survey com-mission. In April J. Keränen and Y. Leinberg performed an astronomical position de-termination on Mount Korvatunturi, and in May–June U. Pesonen executed similarmeasurements in the Maattivuono fjord, Petsamo.
2.4.3 Astronomical position determinations in the primary triangulation network
Astronomical measurements were started on the triangle points of the main net-work again in 1922. In summer 1920 it had been learned from experience, that the exe-cution of astronomical measurements simultaneously with angle measurements wasproblematic. You see, the triangulations have the best chance of succeeding in overcastweather, whereas the astronomical measurements require a starbright sky. Azimuth meas-urements were attempted, weather permitting, still in connection with angle measure-ments, but astronomical position determinations, i.e. both latitude and longitude deter-minations, were done as separate works. Position determinations were made on themain network up till 1966, when all 293 triangle points had been observed. After that,measurements were made on points of the completion network in Northern Finland. Thelast observations were done on the Karravaara triangle point in Northern Lapland, Sep-tember 11, 1990.
Nearly all position determinations were done with a Bamberg portable transit in-strument. The latitude of the site, being the same as its polar height, was determinedwith the Horrebow-Talcott method. In it, a star pair is observed, of which one of the

Geodetic Research in Finland in the 20th Century 43
stars culminates north of the zenith, and the other south of the zenith. The latitude wasobtained after that by the formula
( ) ( )nsns zz −++=′21
21 δδϕ (3)
where sδ is the declination of the southern star and nδ that of the northern one. The pairof stars had been chosen such, that the zenith distance of the southern star, sz , was ap-proximately the same as that of the northern star, nz , so that the difference ns zz − would
be small. In this way, the effect of refraction could be eliminated, as the small differencewould only contain a vanishingly small part of this error.
The result contained, however, the declination error of the star pair in full. In or-der to reduce its effect, several star pairs were observed, and furthermore measurementswere made on several nights.
Longitude was determined by observing with the aid of international time signalsand precision chronometers the times of suitably chosen stars passing through the me-ridian. A normal observing programme for one night consisted of about 18 stars, ofwhich 15 were time stars and 3 north stars. Time stars, which culminated close to thezenith, were used to determine the local sidereal time, while the north stars, which culmi-nated far from the zenith, were used mainly to determine the meridian plane of the tran-sit instrument. The measurements were tied to the Helsinki meridian using the so-calledpersonal equation. This was obtained from comparison observations made on the east-ern pillar in the garden of Helsinki Observatory, immediately before and immediatelyafter the field work. If λ ′ was the longitude observed on the pillar, the personal equa-tion would be λ ′−= smh .p 20049391 . The constant appearing in the formula is the onederived in the 1930’s by the Baltic Geodetic Commission from measurements made inthe area of the Baltic Sea.
Astronomical position determinations required special skills in order to succeed.For this reason, such measurements were entrusted in the Finnish Geodetic Instituteonly to four people: Y. Leinberg, P. Kalaja, E. Kääriäinen and M. Ollikainen.
2.4.4 Azimuth determinations
As remarked earlier, the east component of the deflection of the vertical was de-termined in summer 1920 by astronomical azimuth measurement. When the measure-ment of longitudes started in summer 1922, the azimuth measurements made only todetermine the east component became superfluous, as this component could be derivedfrom the longitude determination as well, as shown in Eqs. 1. The azimuth had to be meas-ured, however, for Laplace points, and thus was done on every triangle point up to 1936.This changed in 1937, after which the azimuth was measured only on every third trian-gle point.

Juhani Kakkuri44
Of the older civil servants of the Finnish Geodetic Institute almost everyone has atsome point in his career executed an azimuth determination, but most of these by farhave fallen to U. Pesonen and V.R. Ölander, 80–90 determinations for each of them.
2.4.5 Stellar triangulation
When Yrjö Väisälä, according to his own account, photographed asteroids in warblacked-out Turku, he had at the same time watched the flak charges explode over Hel-sinki. Then he had remembered his own rocket tests of already twenty years earlier, thatintended to use for aiming, instead of fixed triangulation towers, light signals shot highinto the air. If these had been photographed against the starry sky, their astronomicaldirections would have been obtained by measuring from the photographic plates.
Väisälä presented the principle of his astronomical triangulation on the Session ofthe Finnish Academy of Sciences and Letters of February 8, 1946. As possible applica-tions of his method he mentioned e.g. intercontinental triangulations, that would be pos-sible if one could use as aiming targets rockets launched to a height of more than 100km, or satellites orbiting the Earth at even several thousands of kilometres height. Theidea was realized quicker than Väisälä perhaps believed himself.
Flash lights suspended under weather balloons were tested by Väisälä for the firsttime already in 1947, but then further attempts were abandoned. The next time theywere used in the late 1950’s in tests organized jointly by T.J. Kukkamäki, and Väisälä.The last mentioned, successful tests have been presented in detail in the publication byVäisälä and Oterma (1960).
Later, during the late sixties and early seventies, Kukkamäki’s Ph.D. student J.Kakkuri (1973) measured in Southern Finland a network consisting of five trianglepoints, the side lengths of which were 150–230 km.
The telescopes used in this work were built and designed by Väisälä himself, andhe followed the progress of the measurement up till his last days. When artificial satel-lites appeared in the heavens toward the end of the fifties, planetary scale triangulationsbecame possible. The United States launched for this purpose several geodetic satellitesinto Earth orbit, like the satellites Pageos and Geos, the latter equipped with flash lights.By means of these satellite measurements, the dream of all geodesists, a planet-span-ning unified triangulation network, was realized in the sixties.
3. Geodetic measurements with solar eclipses
A solar eclipse is created when the Moon comes in front of the Sun. There, wherethe shadow of the Moon hits the Earth, the eclipse is enjoyed as total. By determiningthe onset and termination of totality in two different locations, one obtains the time ittakes the shadow to travel the distance in-between. As the speed of travel of the shadowis calculable from celestial mechanics, also the inter-location distance can be calculated.

Geodetic Research in Finland in the 20th Century 45
Fig. 4. Professor Yrjö Väisälä. (Finnish Geodetic Institute’s Collection.)
3.1 The solar eclipse of 1945
The principles of the grade measurement method explained above based on a so-lar eclipse was originally proposed by the Swiss-born mathematician Leonhard Euler.The famous Polish geodesist Th. Banachiewicz experimented with and developed it inconnection with the 1927 total eclipse.
When in Finland a total eclipse took place on July 9, 1945, the Director of the FinnishGeodetic Institute Ilmari Bonsdorff decided to exploit it for measuring a large distance. Thiseclipse started early in the morning on the west coast of North America, the lunar shadowtravelled from there to Greenland, Norway, through Sweden and Finland to Russia. Theeclipse ended in inner Russia in the Turkestan neighbourhood. In Finland it started about 16o’clock and totality lasted about 1 minute.
There were in 1945 still theoretical and practical problems in applying the eclipsemethod. The former ones concerned the movement of the lunar shadow on the Earthsurface. The relative motions of Sun, Earth and Moon were known, thanks to long ob-servation series, very precisely, but the distance between Earth and Moon was notknown precisely enough. Furthermore the poorly known topography of the limb of theMoon affected the precise determination of the starting and ending times of the eclipse.
Of the practical problems, that of obtaining time was the worst. In order to get a preci-sion of 10–15 metres in the distance, the times of the starting and ending moments of theeclipse had to be determined with an accuracy of approximately 0.01 seconds. In 1945 this
Juhani Kakkuri46
was still very much more difficult than today. As quartz clocks in those days were still siz-able rarities, one had to be satisfied with measuring time distances using contact microme-ters – much less accurate – and radio time signals. The reception quality of time signals leftmuch to be desired.
The determination of the starting and ending times of the eclipse could be done in oneof two ways: the contacts of Sun and Moon were filmed with a filmcamera, or, instead of thecontacts, the so-called flash spectrum was photographed. There were four contacts: the 1stcontact, when the Moon’s forward edge touched the Sun, the 2nd contact, when totalitystarted, the 3rd contact, when totality ended and the 4th contact, when the trailing edge of theMoon detached itself completely from the Sun. Of these, the 2nd and 3rd contacts were themost important.
In order to photograph the contacts and flash spectra, two expeditions wereequipped, one lead by P. Kalaja in front of Kokkola on the island Poroluoto, and theother lead by U. Pesonen in Kangaslampi, on the shore of Haukivesi. Both expeditionshad two cameras, to be installed on identical tripods. One of these had been made byVäisälä, a 206 cm focal length objective, and the other a 50 cm long Zeiss teleobjectiveequipped with a refracting prism. The times at which every frame was exposed, wasobtained from the English Rugby radio station time signals. Both expeditions werelucky with the weather, and the filming with its time taking succeeded excellently.
It was attempted to determine the place of the edges of the zone of totality byphotographing the progress of the lunar shadow on the Earth surface from a high flyingaeroplane. The father of this idea was T.J. Kukkamäki. With the permission of the ControlCommission, four air force planes were assigned to the task, of which three were Blen-heims and the fourth a Dornier bomber. These took off from Lake Luonetjärvi thus, thatthey would be in Pietarsaari, Kalajoki, Juva and Liperi at 6 kilometres altitude approxi-mately half an hour before the onset of totality. The shootings, which lasted only some 45seconds, were done with RKM aerial cameras.
The photography from the aeroplanes, in spite of painstaking preparation, did notlead to sufficiently accurate results, as T.J. Kukkamäki himself has concluded. In spiteof successful observations, the geodetic distances were never calculated or published. Thusthe measurements of Poroluoto and Kangaslampi entered the history book of sciencemainly as dress rehearsals for coming solar eclipses. The most important of these, andthe only one producing final results, turned out to be the total solar eclipse of 1947.
3.2 From Gold Coast to Brazil
The 1947 solar eclipse was especially suited for the measurement of the distancebetween two continents. The lunar shadow touched the Earth surface already in the Pacific.It travelled then across all of the South American continent to the coast of Brazil andfrom there across the central Atlantic to Gold Coast and after that still across nearly allthe African continent’s central part to close to the East coast.

Geodetic Research in Finland in the 20th Century 47
The Finnish Geodetic Institute equipped for this eclipse two expeditions, one toGold Coast, Africa, and one to Brazil. The leader of the Gold Coast expedition was T.J.Kukkamäki and that of the Brazilian one was R.A. Hirvonen.
Kukkamäki chose as observation location a hill close to the village of Bana, thecoordinates of which are: φ = 6° 9' 56″ N, λ = 0° 1' 1″ E, and H = 220.8 m. Hirvonen’smeasurement location again was close to a railway station by the name of Bocaiuva, thecoordinates of which are: φ = 17° 14' 2″ S, λ = 43° 40' 15″ W, H = 789 m.
Several other countries, i.e. Argentina, the Soviet Union, Sweden and the UnitedStates, equipped expeditions, but only both Finns succeeded in taking pictures. The oth-ers had bad luck due to clouds. The Finns were also concerned about the weather, espe-cially Kukkamäki, who was stressed during the whole shooting due to threateningclouds in the sky. Hirvonen’s expedition had to worry about the poor audibility of thetime signals and malfunctioning of the camera. Nevertheless a sufficient amount ofpictures was obtained. After return home, the films taken by the expeditions weremeasured. This measurement was complicated, as had been feared, by the unevennessof the lunar limb. The Sun shone through the valleys between mountains on the limb,even though already eclipsed by the mountains, and its crescent was visible as a stringof beads. Furthermore the restlessness of the atmosphere and the libration phenomenonof the Moon complicated the determination of the moment of contact. It was tried todiminish the effect of those disturbances using the lunar charts prepared by FriedrichHayn.
Kukkamäki and Hirvonen published the final results of their solar eclipse meas-urements in 1954 (Kukkamäki and Hirvonen, 1954). According to it, the distance betweenthe measurement points in the African Gold Coast and in Brazil, 5458.8 km, was meas-ured with 141 metre accuracy. An accuracy this good was not achieved again until satel-lites were used.
3.3 At the mercy of the weather, 1954
In 1954 three solar eclipses took place, of which the one on June 30, having themost favourable track, was scientifically the most important. It started in the UnitedStates in the area of Omaha, progressed through the Great Lakes to the Southern tip ofGreenland, and from there on to Norway, passing over Oslo, on to Öland and continuingfrom there to Russia and India, where it finally ended.
The Finnish Geodetic Institute equipped two expeditions to observe the eclipse,one led by P. Kalaja to the island Sotra, off the west coast of Norway, and the other ledby R.A. Hirvonen to Öland. The U.S. Ohio State University, where V. Heiskanen actedas Professor of Geodesy, equipped four expeditions. Of those, two went to the Labradorpeninsula, one to Greenland and one to Iran. As the Greenland expedition’s leader theuniversity chose T.J. Kukkamäki.
The Sotra expedition left to station already the 4th of June. In spite of nigh-continuous bad weather they managed to get everything set up for the measurements,

Juhani Kakkuri48
but when the eclipse was supposed to start, the sky was overcast and it drizzled, andthus the expedition’s work went to waste. The expedition returned home the 4th of July.
The Öland expedition left to station on the 9th of June. On the day of the eclipsethe sky was partly overcast, but the photography of the first, second and third contactappeared nevertheless to succeed through the clouds. After developing the film, it washowever found that exposure had varied so much, that the pictures could not be meas-ured, and thus also the Öland expedition’s work went to waste. It returned home the 6thof July.
The material conditions on the expedition that had left for Greenland were excel-lent. It had the use of the best measurement tools of the day, a plane to travel withinGreenland, and plenty of assistant work force. The only thing lacking was the favour ofthe weather gods. On eclipse day it rained, and total failure was on the books for thatday from the morning onward.
Taking into account that none of the geodetic solar eclipse expeditions obtainedresults, due to bad weather, it must be said that the weather gods really must have hatedglobal geodetic research.
3.4 Did gravity change?
Isaac Newton, when studying the attraction of spherical bodies, assumed that the exte-rior layers of the body did not insulate the inner layers from the exterior gravitational field, inother words, no absorption of gravity in obstructing masses is taking place. In most ex-periments done during the last century, this has been proven to hold within the accuracy ofmeasurement.
During the 20th century the matter has been studied again by many known physi-cists. The most famous studies and laboratory experiments were done by the ItalianQuirino Majorana during 1919–1921. In his experiments, he insulated a lead ball of 1.3kg mass from the Earth’s gravity field first by a mercury cylinder of 114 kg, and then bya lead cube of 9 603 kg. He published in total 22 studies on this subject, where heannounced having found a small effect. The effect observed by Majorana has not beenverified or falsified. Thus, the Frenchman M.F.C. Allais and the Americans E.J. Saxland M. Allen, who have performed tests with various pendulums during solar eclipses,have announced that they have observed the effect. The Moon coming in front of theSun has, in their experiments, acted as a mass absorbing the attraction of the Sun.
On the other hand, many geodesists, like L.B. Slichter, M. Caputo and C.L.Hager, that have studied the change of gravity during a total solar eclipse with sensitivegravimeters and horizontal pendulums, have not observed any effect, although in theirtests the accuracy of measurement was considerably better than in Majorana’s tests.
The total solar eclipse in Finland on July 22, 1990, offered the Finnish Geodetic In-stitute an excellent opportunity to study the Majorana effect described above. The Sun rosethat morning in the North-East already partly eclipsed, and during totality it was only a few
Geodetic Research in Finland in the 20th Century 49
degrees above the horizon, so that it would have the strongest possible effect on the plum-bline direction.
The instruments needed in the test already existed within the zone of totality inthe Lohja mine and the Metsähovi laboratories, so no new purchases were needed. Anespecially serendipitous device was the long water tube tiltmeter, placed in the Lohjamine, with which the solid Earth tide phenomenon had been studied over many yearsalready. Furthermore the Institute had an absolute gravimeter constructed in the UnitedStates, with which the acceleration of free fall could be measured directly during theeclipse.
The measurement programme, in which the Institute’s gravimetric department’sscientists participated, comprised the following works:
− Absolute gravimetric measurement in Ilomantsi. The measurement instrument was theFaller gravimeter, built in the United States, in which the force of gravity was de-termined from the motion of a freely falling body. The measurements, which wereperformed by J. Mäkinen, started 24 hours before totality and ended 24 hours afterit. A measurement series consisting of 50 drops lasted 5 minutes. The standard errorof the mean of a series was found to be ±2.5 μGal, after the necessary tide correc-tions etc. were made. Nothing out of the ordinary in terms of gravity change hap-pened during the phase of totality.
− The tests done in the Lohja mine. The measurements were performed by J.Kääriäinen using the long water tube tilt meters. There were two of these, one of 62metres length in the North-South direction, the angular resolution of which was0.038 msec of arc, and one of 177 metres length in the East-West direction, with anangular resolution of 0.013 msec of arc. No change in the plumbline direction,above and beyond that caused by the normal lunisolar tide, could be demonstrated.
− The tests done in the Metsähovi Research Station. These measurements, which weresupervised by H. Ruotsalainen, were done with automatically registering instru-ments. These were a so-called Askania bore hole pendulum, which registered thechanges taking place in the direction of the vertical, and a Lacoste-Romberg tidalgravimeter, that registered changes taking place in gravity. Both instruments per-formed impeccably, and good registrations were obtained, but in spite of the highaccuracy of measurement (±0.1 μGal) any absorption effect could not be found fromthem.
4. Standard baselines
The career of Yrjö Väisälä as a civil servant at the Finnish Geodetic Institutelasted from 1918 to 1925, i.e., 7 years. This very short time he used to plan the triangu-lation, to do research and to do practical field work. From this time originates the firstpublication of the Institute written by him, namely Tafeln für geodätische Berechnungen

Juhani Kakkuri50
nach den Erddimensionen von Hayford. In it, he presented logarithmic tables for the com-putation of geographic coordinates of triangulation points (Väisälä, 1923). Of consid-erably greater value, however, was his second publication Die Anwendung der Lichtinter-ferenz zu Längenmessungen auf grösseren Distanzen. It was about a new procedure tomeasure baselines using the interference phenomenon of light (Väisälä, 1923).
Yrjö Väisälä moved from the Finnish Geodetic Institute to the University of Turkuas a Professor of Physics, on March 1, 1925. This transfer to a new position did not cutshort his geodetic career, however, because in Turku he could continue the researchwork he had started at the Finnish Geodetic Institute, and he preserved his active con-nection with the Institute until the end of his days. Soon, his workstead gave birth to the in-terference comparator and the quartz metre system belonging to it. This innovative labo-ratory device, suitable for outside measurements, can be used to measure, and has beenthus used, standard baselines of nearly 1 km length, to be used for calibrating invar wiresand electro-optical distance measuring instruments. Väisälä’s excellent publication de-scribing the comparator, Anwendung der Lichtinterferenz bei Basismessungen, appearedin the series of the Finnish Geodetic Institute in 1930 (Väisälä, 1930).
4.1 Nummela Standard baseline
The Finnish Geodetic Institute’s comparison baseline had been built in Santa-hamina in 1921. The permanency of this 720 m long baseline was put in jeopardy, how-ever, especially when in 1930 construction of an airfield was started. In 1932 the Insti-tute started to look for a suitable location for a new comparison baseline. Such a placewas found in the village Nummela, parish Vihti, on top of the Lohja esker. The place, asandy soil under thin pine vegetation, its ground hard sand and its ground water deep,was such that movements of the earth layers were not to be feared. The new baseline,the standard baseline, was built to a length of 36×24 m = 864 m, so that invar wires oflength 24 m could be calibrated there. In measuring the baseline, up to 1946 only invarwires were used. The baseline was measured with the interference comparator for thefirst time in 1947. After that, the permanency of the baseline has been monitored onlyusing interference measurements.
As can be seen from Table 1, the length of the Nummela baseline has duringforty years varied only very little, if at all. The baseline is the most precise in theworld. The standard errors of the measurements are one ten millionth part of thetotal length of the line. A precision that high cannot be achieved by any other meanson a baseline of this length, only with the Väisälä interferometer; not even modernlaser interferometers can do this.

Geodetic Research in Finland in the 20th Century 51
Table 1. Interference measurements on the Nummela standard baseline.
Year Length(mm)
Error(mm)
1947 864 122.78 ±0.071952 864 122.47 ±0.081955 864 122.41 ±0.091958 864 122.25 ±0.081958 864 122.33 ±0.081961 864 122.31 ±0.061968 864 122.37 ±0.071975 864 122.33 ±0.071977 864 122.70 ±0.081984 864 122.40 ±0.091991 864 122.32 ±0.081996 864 122.75 ±0.07
4.2 International Standard baselines
Following a proposal by the Finnish Geodetic Institute, the International As-sociation of Geodesy recommended in 1951 at its General Assembly in Brussels,that the interference method be used also in other countries for standard baselinemeasurements. This recommendation has been followed up by Argentina, TheNetherlands, Portugal, Germany, The United States, South Africa, Spain, China andHungary, where T. Honkasalo, E. Hytönen, J. Jokela, R. Konttinen, T.J. Kuk-kamäki, J. Kääriäinen, and M. Poutanen – each in his turn – have measured base-lines. In Germany, two baselines have been measured: in Munich and in Potsdam,and three in China: in Beijing, in Chengdu and on Taiwan.
5. Precise levellings and vertical datum definitions
A large part of the benchmarks of the Finnish first precise levelling performed bythe Supreme Board of Road and Water Works in 1892–1910 disappeared within a fewdecades due to construction and improvement of the road network. Furthermore theland uplift changed the heights of the benchmarks so much, that it caused practicaltrouble to road and water construction work. Because of this, a new national preciselevelling was felt to be necessary already in the early 1930’s.
5.1 The second precise levelling
The Finnish Geodetic Institute was commissioned to execute the Finnish secondprecise levelling in 1932. The actual field work started in 1935, when the state budgetedfunds to acquire measurement instruments, employ personnel and cover the expences of

Juhani Kakkuri52
field work. Before this, already in summer 1932, V.R. Ölander had done preliminarymeasurements on the Carelian isthmus. Partly based on Ölander’s, partly on his ownresearch, T.J. Kukkamäki, who was hired to lead the precise levelling, developed duringthe 1930’s almost all of the measurement methods used in the second precise levelling. Hebecame famous for his method to correct for the error caused by the refraction of a ray oflight (Kukkamäki, 1938, 1939).
Fig. 5. Professor T.J. Kukkamäki, director of the Finnish Geodetic Institute from 1963 to 1977. (FinnishGeodetic Institute’s Collection.)
The levelling works, which had started off so well, were interrupted for the dura-tion of the war. After the war, they continued, and principally T.J. Kukkamäki,E.Kääriäinen, J.Korhonen and E. Hytönen measured Southern Finland up to the lineAavasaksa–Rovaniemi–Kemijärvi, a measurement which was completed in 1955. Itcomprised 18 closed loops and ties to 12 tide gauges. The total length of the lines measuredby spirit level was 6 236 km, of which 5 928 km belonged to the loops. Of it, 490 kmwas located on territory ceded to the Soviet Union. The precision, obtained from statis-tical treatment of the loops, was ±0.64 mm/ km .
The Northern part of Finland was levelled twice during the years 1953–1975. Thenet, measured mainly by J.Kakkuri, J.Kääriäinen and M.Takalo, comprised 3 closedloops and was tied to the corresponding networks in Norway and Sweden. The totallength of the lines was 1 615 km, of which 1 079 km belonged to the loops. The preci-sion obtained from the network adjustment was in Northern Finland ±0.86 mm/ km .
Geodetic Research in Finland in the 20th Century 53
5.2 The levelling of Åland
Åland, hundreds of islands separated by straits, required its own levelling. Thiswas started in 1962, when J. Kääriäinen levelled on the main island the line Eckerö–Gölby–Bomarsund.
The line connecting the mainland and Åland, which ran from Mynämäki overKustavi to Bomarsund, was measured during the years 1963–1966. The line Gölby–Degerby tide gauge was measured in 1975, and the line, containing overly long watercrossings, from Eckerö to the lighthouse islet of Märket, in the years 1967–1972.
The levelling of Åland comprised land and island lines 233 km and water crossings 55km. The levelling, mainly done by J. Kakkuri and J. Kääriäinen, contained even watercrossings over 4 km in length, which required observations over long periods with spe-cial instruments. Also the levelling of the islands covered with steep cliffs and mireswas demanding, and asked much time and patience from the workers. Nevertheless, theÅland levelling succeeded well, as the error in the height difference calculated from thestarting point No. 51008, located in Mynämäki, amounted in Bomarsund only to ±9.1mm, in Eckerö to ±9.2 mm, in Degerby to ±10.3 mm and even on Märket still to a satis-factory ±26 mm. From this we obtain for the precision of the Åland levelling, if weleave the Eckerö–Märket connection out: ±0.64 mm/ km , and taking Märket along:±1.53 mm/ km , which is in itself still quite good.
5.3 The third precise levelling
The land uplift taking place in Finland changes continually the heights of bench-marks. Because of this, the useful lifetime of heights based on levelling is limited. Inorder for these heights to be up to date and the height differences between benchmarks cor-rect, it is necessary to revise the height system with several decades interval. The cur-rent, third precise levelling aims at a height system tied to the year 2010.
The third precise levelling was started in 1978. Its network covers completely thatof the second levelling. Furthermore it contains new lines, which were not present in thesecond levelling due to lacking roads. The points common to the first and second level-lings are naturally along, so that we can obtain an understanding of the speed and conti-nuity of land uplift, which is as correct as possible.
The third levelling, mainly executed by P. Lehmuskoski, P. Rouhiainen, V.Saaranen and M. Takalo, has progressed to Northern part of Lappland, and it is ex-pected to be completed in 2002.
5.4 The reference surface for height systems
During the present century, three height systems have been in use in Finland,namely the NN, the N43 and the N60 system. Of these, the NN system is the oldest. Itwas created as a result of the first precise levelling. Its reference level was defined to go

Juhani Kakkuri54
through the zero point of the footstock at Katajanokka Bridge, Helsinki, i.e. a point at-tached to the Earth’s crust. It was apparently intended to make the reference level coin-cide with mean sea level in Helsinki. Later it was found, that it remained 10.9 cm belowthe level representing the mean sea level over the period 1904–1909. The referencelevel moved up more and more because of the land uplift, and around the beginning of1943 it was on the same level as the mean sea level over the period 1935–1954. Thereference level of the NN system coincides thus in 1943 with the mean sea level com-puted over the period mentioned above, whereas the differences in benchmark heightsagain correspond approximately to the situation for the mean epoch of the first preciselevelling, the year 1900.
During the second precise levelling, the second height system for Finland wastaken into use, the temporary N43 system, so that the results of the new levelling could bepublished to satisfy practical needs. As the starting point, a certain benchmark located inPasila and its NN height was used. This point was tied to the fundamental bench marklocated in Helsinki on Observatory Hill, which is located 30.4652 m above the zeropoint of the Katajanokka footstock. When the levelling loop started from the Pasilapoint closed, its closing error was adjusted without changing its height. A new loop wasmeasured by its side, which was adjusted without changing the heights of the commonpart, etc. The end result was a height system that had the same reference level as the NNsystem. The heights of the benchmarks, on the other hand, are larger than the NN valuesthere, where the land uplift is faster than in Helsinki, and smaller there, where the landuplift is slower.
When the main network of the second levelling was completed in 1955, it wasadjusted, taking the land uplift into account. In 1960 a negotiation was arranged at theFinnish Geodetic Institute’s premises, aimed at being able to choose the new referencelevel and reference epoch in a way that would satisfy the offices and agencies using theheight values. At this meeting, the reference level Helsinki mean sea level and the ep-och 1960.0 were chosen.
The choice of Helsinki was influenced by the finding, from the levellings, thatthere sea level was lower than in any other coastal municipality in Finland and that thetide gauge there had operated long and its location by the open sea was good.
6. Gravimetric measurements
The first gravity measurement was made in Finland in connection with the Lap-ponian arc measurement, when Maupertuis measured gravity in Pello with the aid of apendulum. Planman did similar measurements in central Finland in 1761 and Sawitz inTornio and Vaasa in 1865. In 1896–1897 O. Savander measured the differences be-tween Potsdam and Helsinki as well as between Pulkova and Helsinki with a Stück-rath’s twin pendulum device. Ilmari Bonsdorff used the same instrument in 1901 whendoing gravity measurements in South and Central Finland. During 1907–1908 he meas-

Geodetic Research in Finland in the 20th Century 55
ured the gravity difference between Helsinki and Pulkova using a Stückrath’s threependulum device.
6.1 Pendulums and gravimeters
The Finnish Geodetic Institute started gravity measurements in 1924. They weredone initially only for geoid determination, but later on, when the number of gravitypoints grew, came the study of the structure of the Earth’s crust and geophysics alonginto the picture.
During 1924–1937 U. Pesonen and R.A. Hirvonen measured in total 186 gravitypoints with a so-called Sterneck’s four pendulum instrument. These points formed asparse network, covering the south of Finland up to the polar circle. The precision ofgravity differences measured with the pendulum instrument was as good as ±1.3 mGal.
The gravity measurements done by the pendulum instrument lasted 2–3 days oneach point, and the processing of the observations lasted several hours. Because of this,the national gravimetric mapping progressed slowly. This improved essentially by theend of the 1930’s, when a device suitable for gravity measurement was successfully de-veloped based on a spring balance. With these so-called gravimeters one could measuregravity differences rapidly and precisely. The first useable instrument was an Askaniagravimeter, where the extension of the spring was measured initially photoelectricallyand later capacitively. The whole instrument was placed inside a thermostat to minimizethe effect of temperature. Just as useable was the Danish Nørgaard’s gravimeter, whichcame into the use of the Finnish Geodetic Institute in 1945. Its reading accuracy was0.05 mGal, but here, like in all gravimeters, the reading changed a little due to stretch-ing of the spring. The most precise gravimeters were built in the United States. There,the large oil companies developed and built these to facilitate their search for the blackgold. The best of these were the Worden- and LaCoste-Romberg gravimeters. Thesewere (and are) compact and light instruments, with which one can achieve within asmall area a measurement accuracy of even 0.01 milligals.
The Institute acquired a Worden gravimeter in 1955. Four years later a thermostatwas added to it in connection with its servicing, changing it into a Worden-Master gra-vimeter. In 1967 the United States gave the Institute in loan four LaCoste-Romberggravimeters, of which one remained permanently in Finland. In 1981 the Institute got tobuy its own LaCoste-Romberg gravimeter from the U.S. manufacturer.
6.2 The gravity survey of Finland
With the new, precise gravimeters, the national gravimetric mapping proceededrapidly, and in 1967 gravity had been determined already in over 13 000 points, and in1978 in approximately 22 500 points. Their foundation was the primary gravimetricbase network measured in 1962, comprising 41 carefully built measurement stations. To-gether these 22 500 points form Finland’s national gravity net, where the point density is

Juhani Kakkuri56
1/15 km2. It covers the Finnish mainland completely as well as parts of the sea area,where measurements have been mainly done upon the ice in winter.
The densification of the national gravity network was started in 1980. The net-work was intended to become so dense, that there would be 1–2 points within everysquare of one km2 size. A network this dense is useful in many ways. With it, one canstudy and find out about e.g. the structure of the upper part of the Earth’s crust, con-nected to ore and mineral deposits of significance to the national economy. Because of this,the densification was co-ordinated with the Finnish Geological Survey.
The measurement of the national gravity net was for the greater part done by T.Honkasalo and A. Kiviniemi. The gravity data collected were delivered to the interna-tional use through the International Gravity Bureau and applied, for example, to com-putation of the Bouguer anomaly map for the Nord Kalott as well as to the gravimetricgeoid modelling for the Nordic Countries.
6.3 Absolute gravimetry
The absolute value of gravity can be determined either by a pendulum, as wasdone in work by the Finnish Geodetic Institute in 1924–1937 or with the aid of a freelyfalling body, like Galileo Galilei did. If we use a pendulum, we get the absolute valuewith the formula 224 T/bg π= , where b is the length of the pendulum and T the ob-served swing time. If the measurement is done with the aid of a freely falling body, theformula 22 t/sg = is used, where t is the time it takes the body to fall a distance s.
Table 2. Absolute gravimetric measurements by the Finnish Geodetic Institute at home and abroad.
Country Place of the measurement
Antarctica AboaBelgium Brussels, MembachChina Beijing, Guangzhou, Harbin, Kunming, Lhasa, Nanning, Shanghai, Xi’anCzech Republic PecnýEstonia Suurupi, Kuressaar, ToravereFinland Kirkkonummi, Joensuu, Sodankylä, Vaasa, VirolahtiFrance Sévres, StrasbourgGermany Clausthal, Moxa, WettzellIsland Höfn, ReykjavikLatvia Riga, Popé, ViškiLithuania Klaipeda, Panevežys, VilniusLuxemburg LuxemburgNorway Ny Ålesund, Stavanger, Tromsö, TrysilPoland Borowa Góra, Jozefoslav, Konopnika, PivnicePortugal Faial, Flores, Mertola, Porto, St. MiguelSlovenia Bogensberg, GotenicaSouth Africa Paarl, PretoriaSpain MadridSweden Furuögrund, Gävle, Göteborg, Onsala
Geodetic Research in Finland in the 20th Century 57
Absolute values were measured up to the sixties almost exclusively by means ofpendulums, and the best instruments achieved accuracies of 2–3 milligals. In 1957 T.J.Kukkamäki proposed on the Toronto General Assembly of the International Union ofGeodesy and Geophysics the absolute measurement of gravity using a 220 metre longwire pendulum. If such a pendulum were only to be suspended in a deep mine shaft in-side a vertical vacuum tube, it would according to him be possible to measure absolutegravity better than 1 mGal.
E. Hytönen undertook to implement Kukkamäki’s idea. He quickly found out thatthere were almost insuperable theoretical and practical problems, and because of these, theoriginal plan of Kukkamäki had to be abandoned. As the place of measurement waschosen instead of a mine shaft, an elevator shaft in the power utility building in Vallila,Helsinki. The wire used in the measurements was only 7.77 m long. At its end a bobwas dangling made of pure gold, weighing 17.8 kg. The precision of the absolute meas-urement published in 1972 was ±2.1 mGal, which was not bad result for a pendulummeasurement.
E. Hytönen’s measurement will probably remain as the last attempt in the whole worldto determine absolute gravity by means of a pendulum. The laser interferometer had namelymade the Galileo’s method a superior one for determining absolute values of gravity rapidlyand effectively, and already in the 1970’s ballistic devices achieved hundred-fold accuraciescompared to pendulum devices. The Finnish Geodetic Institute decided in the early 1980’sto acquire its own ballistic (falling-body) instrument for absolute gravity measurements.Because one does not buy such super-precise equipment “off the shelf'”, it had to bebuilt. This was possible at the University of Colorado in the United States, where ProfessorJ. Faller was just in the process of building six falling-body instruments for research use.
The Institute offered to pay for one, and when agreement was reached on the priceand the research contract connected with the instrument, the construction contract wassigned. The Faller’s falling-body device, a so-called absolute gravimeter, was com-pleted and delivered to the Institute in 1986. J. Mäkinen, which Faller trained as user of theinstrument, has from then on made many measurement journeys both at home and abroad.On those, it was tried to measure, following the principles of the International Association ofGeodesy, precise absolute points in different parts of the globe, so that the gravity measure-ments all over the Earth would be of the same scale. This was of great benefit for geodetic-geophysical research in the whole world.
6.4 Studying the Solid Earth’s tides
On the shallow ocean shores the sea floor is at times exposed, at times under wa-ter, and the difference between low and high water may be many metres. Here we havea periodic fluctuation in water level caused by Moon and Sun, the tidal phenomenon orflood and ebb, which generally repeat twice a day.
To some extent it is surprising, that the tidal phenomenon can also be observed inthe solid Earth crust, even so strongly that its effect must be taken into account in the

Juhani Kakkuri58
most precise geodetic measurements, like gravity measurements and precise levellings.If the Earth had been a completely rigid body, then the effect of the tides could havebeen precisely calculated given the apparent motions of Moon and Sun, and no obser-vations would have been needed. In reality the Earth is somewhat elastic, so that itsshape changes under the influence of the tidal force, and precise gravimeters observe theamplitudes and phases of the tidal waves, which differ from what the calculated cor-responding values for a rigid Earth would be. When we observe gravity changes, the ob-served amplitudes are some 16 % greater than the theoretically computed ones. This iscaused by the vertical motion of the Earth’s crust, which changes the distance of themeasurement instrument from the centre of the Earth. Thus the attraction acting uponthe instrument changes, and the effect works in the same direction as the original effect ofthe tidal force. The amplitudes of the changes in the direction of the vertical, on the otherhand, are smaller than the á priori calculated ones. Also this is caused by the change inshape of the globe, which compensates about 30 % of the change in vertical directioncalculated for a rigid Earth.
The Finnish Geodetic Institute acquired a tidal gravimeter manufactured by theAskania factories, in 1964, in order to be able to participate in the international researchprogram for solid Earth tides. Participation in this was considered important abroad, be-cause there were too few observing stations north of latitude 60° in the international ob-serving network.
T. Honkasalo installed the tidal gravimeter acquired for the Institute in Helsinki ina cellar located in the Sinebrychoff park. In 1967 he moved it to a tunnel in the bedrockin Pasila, where the water utility of Helsinki built suitable rooms. That same year theInstitute acquired two Verbaandert-Melchior horizontal pendulums in order to registerchanges in the direction of the vertical. These devices Honkasalo placed in the Ojamomine in Lohja. Later these were moved to the Tytyri mine. The observations producedby the tidal gravimeter and the horizontal pendulums are transmitted to Brussels, wherethe International Centre of Earth Tides (ICET) processes them and derives from them,using harmonic analysis, amplitude and phase coefficient values for the various wavespresent in the tide.
In 1971, a Geodynamics gravimeter in excellent state of functioning was received inloan from the United States. The Finnish Geodetic Institute used it to determine tidalcoefficients in seven Finnish, four Swedish and one Norwegian municipalities. Of othertidal observations made with registering gravimeters we should mention those of theGerman G. Jentzsch in Vaajakoski, Virojoki and Kirkkonummi during the 1970’s and1980’s, which have produced valuable additional knowledge on the elasticity propertiesof the Earth’s crust in our northern country.
A mention all of its own also deserves the long water tube tiltmeter built into theTytyri mine in Lohja. In a meeting in 1965 in Aulanko (Kukkamäki, 1966) on recentmovements in the Earth’s crust, T.J. Kukkamäki proposed that the continual tilting ofthe Earth’s crust caused by the land uplift could be monitored by means of a horizontal,

Geodetic Research in Finland in the 20th Century 59
approximately one kilometre long, U-tube, if 1) such a tube were to be placed under theEarth’s surface at a depth of at least 50 m, 2) it were to be filled with a suitable fluid,e.g. mercury, and 3) the fluid surface level relative to a fixed reference point would bedetermined with the aid of the light interference phenomenon.
J. Kääriäinen, disciple of Kukkamäki, implemented the idea of his teacher nearlycompletely. In a tunnel no longer in use in the Tytyri mine he built a 177 m long hori-zontal tube in the east-west direction, which was filled half way up with water. On bothits ends was a low terminating vessel, and inside these, just barely covered by water, alens, convex on top, mounted to the rock. When the terminating vessel was illuminatedwith monochromatic light, a reflection was created from both the water surface and thelens surface, and the reflected beams interfered with each other, producing concentricrings. Under the influence of the tidal force, the separation between lens and water sur-face was continually changing. Thus also the radii of the rings were changing. Whenthese changes were recorded with a film camera using a diametrically fitted slit dia-phragm, a figure was obtained on the slowly advancing film of the changes in directionof the plumbline caused by the tide, which could be measured with great precision (J.Kääriäinen, 1979).
In the mine corridor, which was some 150 m under the surface of Lake Lohja,conditions for measurement were almost ideal, as the yearly variation in temperature(+9° C) was only 0.4° C. No wonder, that beautiful results were obtained with the watertube. In fact it was never used, as Kukkamäki intended, for the study of the land uplift,but instead it was used from 1977 onward to determine tidal wave coefficients reliablyand with great precision. The resolution of the instrument is so high, that it reacts toeven small deformations of cavities in the Tytyri mine, as well as to the changes that thevariation in atmospheric pressure caused in the solid Earth’s crust. The device has as thefirst in the whole world observed the response of the Earth’s fluid core to the horizontalcomponent of the tidal force.
In 1983, a second water tube was installed in the Tytyri mine, in the north-southdirection, length 62 m. It was placed in a side tunnel perpendicular to the water tubetunnel. Also this instrument has yielded precise results.
6.6 Measurements on Antarctica
Finland joined the Antarctic Treaty in 1984. The signatory states are obliged toorganize on the continent, and the areas surrounding it, scientific research activity,aimed at furthering the peaceful use of the ice covered continent. The Finnish GeodeticInstitute participated in research on the Southern continent during 1989–1994 by exe-cuting in the area of Dronning Maud Land works belonging to a gravity survey.
In autumn 1989, the first expedition was sent by the Institute to Antarctica in theframework of the so-called FINNARP-89 project. The expedition consisted of two mem-bers, M. Ollikainen and P. Rouhiainen. During the measurement period, which lastedone and a half months, it measured in the surroundings of the station Aboa – the base of
Juhani Kakkuri60
the Finnish Antarctic researchers – some 100 gravity points and determined their geo-graphic coordinates using a GPS satellite receiver. Additionally the expedition gatheredexperiences on working in antarctic conditions with an eye on expeditions later to beequipped.
In November 1991 the Institute sent a second expedition to Antarctica in theframe of the FINNARP-91 project. Also this expedition consisted of two members, J.Jokela and H. Virtanen. During the time of the measurement period, about two months,it established in Dronning Maud Land 300 new gravity points and determined theirgeographical coordinates with GPS receivers like the previous expedition. Furthermoreit made two tie measurements to Montevideo, where the nearest international gravitynetwork base point was to be found.
In 1993 J. Mäkinen took part in FINNARP-93 project and determined the absolutegravity at a rocky hill close to the station Aboa. The measurement was repeated in 2001.
7. Geoid studies
The famous mathematician K.F. Gauss defined the Earth as having the figure ofthe geoid (later known as so-called Gauss-Listing geoid), i.e. of the equipotential sur-face of the gravity potential, which at the coasts coincides as precisely as possible withthe mean level of the oceans. From the geoid, the topographic heights and the depths ofthe seas are reckoned.
Because one of the objectives of geodetic research is the determination of the fig-ure of the Earth, geoid research has a central place within the science of geodesy.
7.1 The astrogeodetic geoid
Astronomical position determinations and azimuth determinations produced asvisible results numerical values for the plumbline deviation components in the Northand East directions, and with their aid one can draw the contours of a so-called astro-geodetic geoid on a map. Such a geoid is on the whole of similar shape as the truegeoid. It contains however less detail than a gravimetric geoid based on gravity meas-urements, and furthermore it is tilted with respect to a truly geocentric coordinate sys-tem, if the system for the geodetic reference points is chosen wrongly.
At the Finnish Geodetic Institute the astrogeodetic geoid has been calculated manytimes. The version displayed in Figure 6 is based on the most extensive observational mate-rial available.

Geodetic Research in Finland in the 20th Century 61
Fig. 6. The astrogeoid of Finland according to M. Ollikainen. Starting point is Korkatti and system isBomford 70.
7.2 The man who dedicated his life to physical geodesy
Immediately after the foundation of the Finnish Geodetic Institute, its appointedDirector, Ilmari Bonsdorff, started searching young talents for his Institute, and he suc-ceeded excellently in this, as he managed to catch e.g. Yrjö Väisälä. Soon also M.Sc.Veikko Heiskanen wandered in, becoming in September 1921 a civil servant at the In-stitute. Ilmari Bonsdorff had written his own doctoral dissertation in the field, whichstudied the isostatic balance of the Earth’s crust, and so perhaps he gave the youngHeiskanen the stimulus to start studying isostasy.

Juhani Kakkuri62
Fig. 7. Professor V.A. Heiskanen, director of the Finnish Geodetic Institute from 1949 to 1961. Portraitby E. Tilvis. (Finnish Geodetic Institute’s Collection.)
In 1922, the Hayford reference ellipsoid had been chosen as the basis for map-making in Finland; a couple of years later it was chosen also as the international refer-ence ellipsoid, as told earlier. The Hayford reference system lacked a normal gravityformula. To find one, it was necessary to collect gravity measurements made around theEarth at that time, and remove from them the local irregularities caused by mountains andseas. Already in the middle of the 19th century it had been shown, that these were com-pensated by invisible mass distributions inside the Earth, but no reliable model had asyet been found for this distribution. There were two alternatives, either the mountainshad risen from their substrate like dough, in which case the density of the mountainswould be inversely proportional to their height (Pratt’s model), or the continents floatedon top of fluid internal matter like ice floes on the ocean, in which case the mountainshad roots extending the deeper, the higher the mountain was (Airy’s model). Heiskanenconsidered the Airy model more natural and started developing it. Soon he could demon-strate, that, provided one chose a suitable value for the thickness of the crust, the Airytheory would be at least as useable as the Pratt theory.
The first research results Heiskanen used as the subject for his dissertation. Hisresearch results were internationally noted for the first time in 1930, when the interna-tional geodetic congress in Stockholm canonized as a gravity formula an expressionwhich read like this:

Geodetic Research in Finland in the 20th Century 63
( )ϕϕγ 2sin0000059,02sin0052884,01049,978 2−+= (4)
Here, ϕ is latitude and γ the acceleration due to normal gravity. The leading term of thisequation Heiskanen had derived from his isostatic studies.
In 1931 Heiskanen moved to the Helsinki University of Technology as Professor ofGeodesy. He returned to the Finnish Geodetic Institute in 1949, this time as Director.The handling of responsible official duties at the Technical University had in no wayinterrupted Heiskanen’s research programme, which featured, in addition to the study ofisostatic problems, also prominently research belonging to the field of physical geodesy.Around his research assistants and young people living on grants, an actively function-ing research institute was formed, that in 1936 received from the International Associa-tion of Geodesy the official status and name of Isostatic Institute. In the name of this Insti-tute, until 1965, 49 publications appeared.
In 1951 Heiskanen was appointed as a research professor and supervisor of theglobal gravimetric mapping project to Ohio State University, in connection with whichthere functioned a separate Research Center, and there, a Mapping and Charting ResearchLaboratory, the work of which was close to Heiskanen’s other activities. The same year,a geodetic, photogrammetric and cartographic institute was founded within the OhioState University. As the scientific leader and, since 1953, also executive director, Heis-kanen acted up till 1961, when the institute was merged with the just founded geodeticfaculty.
At the start of the American part of his career, Heiskanen presented his views andplans to solve the fundamental problems of geodesy in his publication The World Geo-detic System. In order to realize this, a worldwide project was started, aiming at col-lecting to Ohio gravity material from everywhere on Earth in order to compute a globalgeoid and deflections of the vertical. Material was received from 35 countries, but theinternational situation caused it to be collected slowly, and holes remained in the globalgravimetric map, which would not be filled during Heiskanen’s lifetime.
7.3 The gravimetric geoid
According to his own narrative, V. Heiskanen became convinced in 1931, that thefigure of the Earth could be pictured in detail with the aid of a gravimetric geoid. Thereforehe proposed to his assistant of that day, R.A. Hirvonen, that he would write his disser-tation on gravimetric methods for determining the geoid. Hirvonen followed the adviceof his superior, and when the dissertation The Continental Undulations of the Geoid be-came ready in 1934, Heiskanen was satisfied, as the results of the work were both im-portant and promising. Hirvonen was the first to apply the Stokes’ formula to the calcu-lation of the gravimetric geoid.

Juhani Kakkuri64
This famous formula in its basic form is as follows
( )∫∫=
σ
σψ∆π
dgSG
RN4
(5)
where N is a geoid undulation to be calculated, R is the radius of curvature of the Earth,G is mean value of gravity over the Earth, g∆ is a gravity anomaly, σd is a surfaceelement, and ( )ψS is so-called Stokes’ function (shown in all textbooks of physical ge-odesy). In spite of incomplete global coverage of the gravity material used, Hirvonenwas able to show, that the geoid can deviate from the reference ellipsoid only little, onaverage ±50 m.
Heiskanen’s other assistant, L. Tanni, who had worked at the isostatic institute,continued Hirvonen’s studies. In 1948 he published a study that came into widespreaduse: On the Continental Undulations of the Geoid as determined from the present grav-ity material. The gravity material available to Tanni consisted of some 13 000 pendu-lum points and several thousand gravimeter points. Most of these were done on land. Inspite of the deficient global coverage of the material, the main features of the figure ofthe Earth were clearly visible in Tanni’s geoid and in their right places.
When Heiskanen moved to the United States in 1951, also the focus of gra-vimetric geoid research shifted with him, like told before. In Finland this was continuedby R.A. Hirvonen, who succeeded Heiskanen in 1950 as Professor of Geodesy at theHelsinki University of Technology.
7.4 The point mass method
The geoid research at the Finnish Geodetic Institute had diminished after Heiskanenhad left. This did not change until 1974, when the Finnish gravimetric geoid computed by T.Honkasalo was published. It was based on gravimetric measurements made in the 1950’sand 1960’s in approximately 20 000 points, and it was computed using the Stokes’ formula.
After this, geoid studies at the Institute moved into an upward curve again. M.Heikkinen, who had come to the Institute as Honkasalo’s assistant, gave up the useof the Stokes’ formula for gravimetric geoid determination at the end of the 1970’s and de-veloped instead a computing method based on the straight application of Newton’sattraction law, the so-called point mass method. In 1981 he published the signifi-cant work Solving the Shape of the Earth by using Digital Density Models. In it, hepresented both the theory and maps of the global geoid, which he had computed us-ing over 40 000 mass points. Later the Dutch M. Vermeer developed the computa-tional aspects of Heikkinen’s method and computed both the Finnish and the Nordicgravimetric geoids using it (Vermeer, 1984). In 1992 Vermeer was appointed to theposition of department head and professor at the Finnish Geodetic Institute.

Geodetic Research in Finland in the 20th Century 65
7.5 New methods applied to determination of the geoid
Geoid studies were continued in Finland also in the 1990’s, this time by applyingcompletely new methods to the study. One of the methods was to derive the geoid un-dulations from the GPS satellite measurements performed along levelling lines. Geoidundulations are, as is well-known, the differences between the ellipsoidal heights fromGPS measurements and orthometric heights from the levelling. High accuracy for the geoidundulations can be obtained with this method as shown by Ollikainen (1998).
In the other new method the geoid undulations were derived from the deep seis-mic sounding data (Wang, 1998, Kakkuri and Wang, 1998). This is possible because thedata obtained from DSS can be used to construct a 3-D velocity structure model for theEarth’s crust. The velocity model can further be converted to a 3-D density model usingthe empirical relationship that holds between the seismic velocities and crustal massdensities. This relationship is a linear relation known as Birch’s law
ρα b)m(vp += (6)
where pv is velocity of the seismic P-waves known from the DSS, ρ is density to be
calculated, α is a coefficient which depends on the mean atomic weight m of the rockmaterial only, and b is a constant. For plutonic and metamorphic rocks, which are themain types of rocks in the shield areas, the mean atomic weight plays an insignificantrole and can be safely neglected from the density-velocity relation. In the sedimentaryrock areas, where the p-velocities depend on the burial and geologic age of the rock, theuse of Birch’s law is, however, questionable. Density data, for example, from drillingholes should be used instead of DSS-data.
As soon as observed velocities have been converted into densities and 3-D densitymodel developed for the crust, the geoid can be calculated using well-known computingtechniques.
8. The Fennoscandian land uplift
Land uplift studies have a long and respectable history in Finland and Sweden.For this, both countries can thank Mother Earth, who has blessed both her children witha powerful land uplift, so powerful, that already the changes happening during a humanlifetime can be easily observed. The writer Zachris Topelius depicted late last centurythe land uplift thus:
“Most noticeable are the effects of this partly still unexplained phenomenon. Theland rises from the sea, the sea flees, shores are exposed, the slope is moving forward.Where in old days the ships were sailing, now hardly a ship can travel; where once thefisherman cast his net, now his cows go grazing on the coastal meadow. Banks androcks appear out of the water, of which no sea chart has had knowledge before; banksexpand into islets, these grow together and connect with the mainland. Beaches expand,

Juhani Kakkuri66
harbours dry up, sea ports must move after the fleeing sea. Every generation of men,new areable land rises from the sea, every century grants Finland a principality.”
(Finland in the 19th Century as presented by Finnish writers and artists in words andpictures (in Finnish). Helsinki, 1893. G.W. Edlund, publisher.)
One encounters many a renowned scientist’s name in the field of land uplift re-search, like the Swede Gerard de Geer, who proved the land uplift to be a residual re-bound phenomenon from the ice age, or the Finnish geologist Wilhelm Ramsay, whoseparated conceptually the isostatic land uplift and the eustatic change of sea level fromeach other.
8.1 Determining the land uplift
The speed of land uplift can be measured on the shores by using water level me-ters also called tide gauges, and inland by precise levellings, repeated with 40–50 yearsinterval.
On the shores of Finland there are 13 tide gauges maintained by the Finnish In-stitute of Marine Research, namely the tide gauges in Kemi, Oulu, Raahe, Pietarsaari,Vaasa, Kaskinen, Mäntyluoto, Rauma, Turku, Degerby, Hanko, Helsinki, and Hamina.Of these, the Hanko tide gauge is the oldest; it has been in use since 1887. The youngestis the tide gauge of Rauma, which started operation in 1933. Because even the youngesttide gauge has already operated for 67 years, one can determine with their aid the landuplift on the coast extremely well. Such determinations have been done; e.g. the civilservants of the Finnish Institute of Marine Research I. Hela and E. Lisitzin have pub-lished extensively used values for the land uplift. The up till now most precise valuesfor the tide gauges were determined by a working group established jointly in 1988 bythe Finnish Institute of Marine Research and the Finnish Geodetic Institute, to whichbelonged P. Mälkki, H. Boman, Kimmo K. Kahma and M. Leppäranta from the FinnishInstitute of Marine Research, and M. Vermeer and J. Kakkuri from the Finnish GeodeticInstitute. In their work, the sea level values were treated as monthly means, whereas inearlier determinations they were yearly means.
The Finnish Geodetic Institute has tied all the tide gauges to the precise levellingnetwork. By this means, a datum or reference level was obtained for the precise level-ling, and starting values for the relative land uplift values given by the successive level-lings. The reference level of the precise levellings is, as mentioned earlier, mean sealevel in Helsinki at the start of 1960.
In the Finnish Geodetic Institute, several land uplift studies have been published.The most well-known of these is probably the determination of uplift figures by E.Kääriäinen (1953), in which the differences in yearly land uplift values between bench-marks were derived using the material of the first and second precise levellings. Therelative land uplift values thus obtained were then anchored to the values for the tidegauges, which I. Hela had determined. Thus, final land uplift values were obtained for
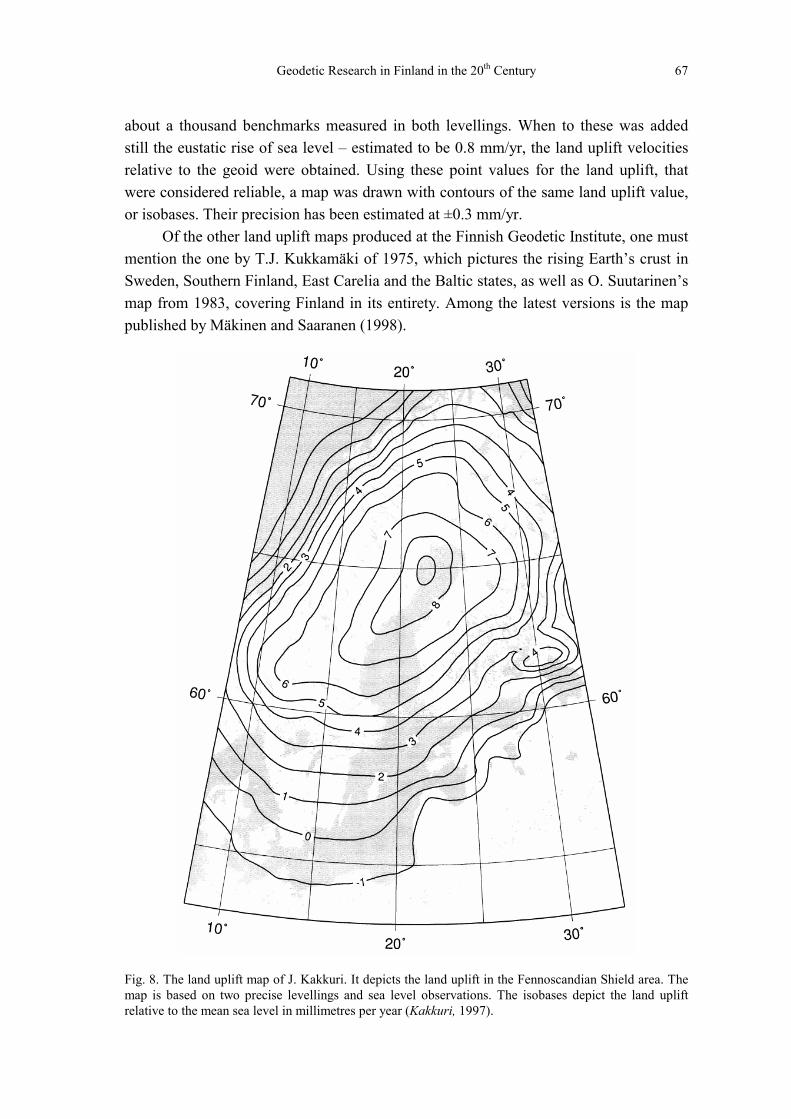
Geodetic Research in Finland in the 20th Century 67
about a thousand benchmarks measured in both levellings. When to these was addedstill the eustatic rise of sea level – estimated to be 0.8 mm/yr, the land uplift velocitiesrelative to the geoid were obtained. Using these point values for the land uplift, thatwere considered reliable, a map was drawn with contours of the same land uplift value,or isobases. Their precision has been estimated at ±0.3 mm/yr.
Of the other land uplift maps produced at the Finnish Geodetic Institute, one mustmention the one by T.J. Kukkamäki of 1975, which pictures the rising Earth’s crust inSweden, Southern Finland, East Carelia and the Baltic states, as well as O. Suutarinen’smap from 1983, covering Finland in its entirety. Among the latest versions is the mappublished by Mäkinen and Saaranen (1998).
Fig. 8. The land uplift map of J. Kakkuri. It depicts the land uplift in the Fennoscandian Shield area. Themap is based on two precise levellings and sea level observations. The isobases depict the land upliftrelative to the mean sea level in millimetres per year (Kakkuri, 1997).

Juhani Kakkuri68
8.2 Land uplift and gravity
When the land rises, the land surface is moving away from the centre of the Earth.At the same time, mass is flowing in under the crust from outside the uplift area. Thisphenomenon makes gravity diminish on the Earth’s surface as a result of land uplift. Ifthe diminishing is slower than what Newton’s law of attraction would require, then themass flowing in within a thin layer under the crust is partly compensating for this. Thereare, for this simplified model, two extreme values for the rate of gravity diminishing: ifit is –0.17 μGal/mm, then the inflow of mass is total, if on the other hand it is –0.31μGal/mm, there is no mass flow at all (Mäkinen, 2000).
The Finnish Geodetic Institute started its research on the foregoing phenomenonin 1967, when four instruments needed for the measurements were received on loanfrom the United States. Eight observation stations were constructed for the measure-ments, located in Joensuu, Äänekoski, Vaasa, Kramforss, Stugun, Kopperå, Meldal andVågstranda. The line formed by them followed the 63rd parallel. Later three other lineswere built, one along the 65th parallel, one along the 60th parallel and the third one alongthe 56th parallel. Most of the measurements performed by A. Kiviniemi and his foreigncolleagues almost yearly have been done on the line running from Joensuu to Våg-stranda.
Over 30 years have passed since these measurements were started. Has gravitychanged during this quarter century? We can answer this question in the affirmative. J.Mäkinen and his Swedish colleague M. Ekman have analyzed all the measurementsmade up to 1990 on the line from Joensuu to Vågstranda and obtained a value for therate of diminishing of gravity of –0.22 μGal/mm. On the basis of this it may be con-cluded, that the Fennoscandian land uplift is associated with almost total mass flow.When e.g. the land uplift in the Vaasa area in relative to the centre of the Earth ap-proximately 10 mm/y, gravity has diminished there in 26 years 0.22×10×26 microgals,i.e. about 0.06 milligals. Even a change this small can be observed with an absolutegravimeter.
8.3 Horizontal component of the land uplift
The complicated upward motion in the area of Fennoscandia once covered by thecontinental glacier has been characterized according to research, by changes in time,and the land has risen in blocks bounded by fault zones.
Also the recent land uplift has these features. According to the land uplift mappresented above the land rises in some places “too” quickly, in other again too slowly.This may be caused by horizontal stress induced by the continental plate motion, whichspeeds up the uplift, or extension, which slows it down. The land uplift may in that casealso have a horizontal component. Successive precise levellings cannot detect possible hori-zontal motions of the Earth’s crust – that requires successive triangulations. Fortunatelythese have been done in Finland.

Geodetic Research in Finland in the 20th Century 69
As mentioned earlier, the main network chains of the national triangulation formloops. The areas inside them have been filled with younger triangulations and electro-magnetic distance (EDM) measurements. The distances between the triangle points maythus be derived from two different measurement sets, namely the measurements of themain network and the later performed triangulation and EDM measurements, and crus-tal movements that change distances, may in this way be detected.
The Finnish Geodetic Institute started an investigation on the horizontal motionsin the Finnish bedrock in the beginning of the 1980’s. Preliminary results of investiga-tions by J. Kakkuri indicated already the possibility of such motions, and his student R.Chen’s (1991) final analysis confirmed their existence.
8.4 Determining the horizontal crustal movements in Central Asia
The Finnish Geodetic Institute performed short-range EDM measurements also inCentral Asia, more precisely in Tadžikistan, in 1980–1983. These measurements wereaimed at studying surface deformations caused by tectonic plate motion in the Garmarea, which is located on the northern side of the Pamir mountains (Konttinen, 1985,Kakkuri and Konttinen, 1986).
The measurement location in Garm, the Saripul network, extended across a beau-tiful valley between the Pamir and Alai mountains. A deep crustal fault ran through thevalley, i.e. along a river called the Surchob. There were five bechmarks in the Saripulnetwork. Three of them were located in the foot of Mindalul mountain, which belongsto the Alai. Two other benchmarks were located to the foothills of the Pamirs.
According to the measurements performed mostly by R. Konttinen, the Pamirsmoved slowly ( v! = 1.5 cm/yr) to the north. The direction of the motion was 349° (northis 0°).
9. Baltic Geodetic Commission
Early spring 1924 the Finnish government organized in Helsinki at the request of I.Bonsdorff a geodetic conference, in which participated delegates appointed by theirgovernments from Sweden, Germany, Poland, Lithuania, Latvia, Estonia and Finland.As the Finnish representative acted Bonsdorff and Professor A. Donner, then Chancellorof Helsinki University. The conference decided to propose the founding of a permanentBaltic Geodetic Commission for the states in the Baltic Sea region.
9.1 The Baltic triangulation ring
When the Helsinki conference was over, I. Bonsdorff drafted a treaty for foundingthe Commission, and the Finnish government forwarded this to the governments of theBaltic Sea states. In it, it was proposed in conformity with the resolutions of the confer-ence, that the signatory states would be bound to establish a Baltic Geodetic Commis-
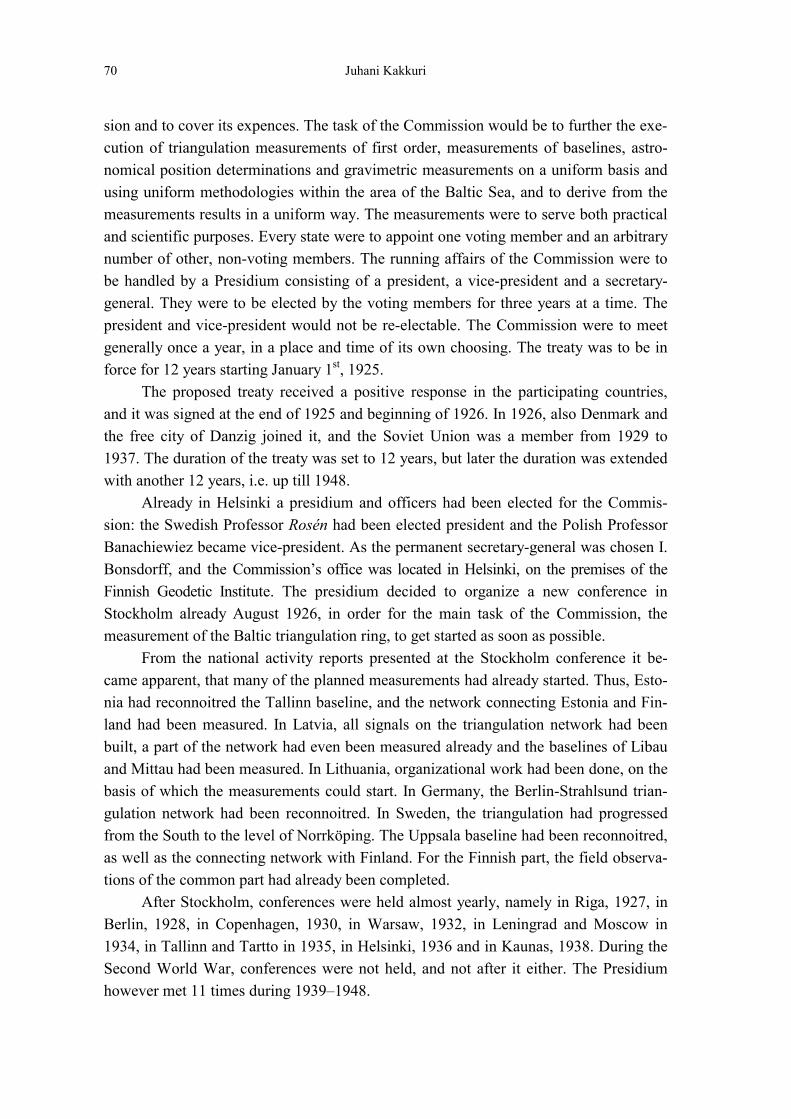
Juhani Kakkuri70
sion and to cover its expences. The task of the Commission would be to further the exe-cution of triangulation measurements of first order, measurements of baselines, astro-nomical position determinations and gravimetric measurements on a uniform basis andusing uniform methodologies within the area of the Baltic Sea, and to derive from themeasurements results in a uniform way. The measurements were to serve both practicaland scientific purposes. Every state were to appoint one voting member and an arbitrarynumber of other, non-voting members. The running affairs of the Commission were tobe handled by a Presidium consisting of a president, a vice-president and a secretary-general. They were to be elected by the voting members for three years at a time. Thepresident and vice-president would not be re-electable. The Commission were to meetgenerally once a year, in a place and time of its own choosing. The treaty was to be inforce for 12 years starting January 1st, 1925.
The proposed treaty received a positive response in the participating countries,and it was signed at the end of 1925 and beginning of 1926. In 1926, also Denmark andthe free city of Danzig joined it, and the Soviet Union was a member from 1929 to1937. The duration of the treaty was set to 12 years, but later the duration was extendedwith another 12 years, i.e. up till 1948.
Already in Helsinki a presidium and officers had been elected for the Commis-sion: the Swedish Professor Rosén had been elected president and the Polish ProfessorBanachiewiez became vice-president. As the permanent secretary-general was chosen I.Bonsdorff, and the Commission’s office was located in Helsinki, on the premises of theFinnish Geodetic Institute. The presidium decided to organize a new conference inStockholm already August 1926, in order for the main task of the Commission, themeasurement of the Baltic triangulation ring, to get started as soon as possible.
From the national activity reports presented at the Stockholm conference it be-came apparent, that many of the planned measurements had already started. Thus, Esto-nia had reconnoitred the Tallinn baseline, and the network connecting Estonia and Fin-land had been measured. In Latvia, all signals on the triangulation network had beenbuilt, a part of the network had even been measured already and the baselines of Libauand Mittau had been measured. In Lithuania, organizational work had been done, on thebasis of which the measurements could start. In Germany, the Berlin-Strahlsund trian-gulation network had been reconnoitred. In Sweden, the triangulation had progressedfrom the South to the level of Norrköping. The Uppsala baseline had been reconnoitred,as well as the connecting network with Finland. For the Finnish part, the field observa-tions of the common part had already been completed.
After Stockholm, conferences were held almost yearly, namely in Riga, 1927, inBerlin, 1928, in Copenhagen, 1930, in Warsaw, 1932, in Leningrad and Moscow in1934, in Tallinn and Tartto in 1935, in Helsinki, 1936 and in Kaunas, 1938. During theSecond World War, conferences were not held, and not after it either. The Presidiumhowever met 11 times during 1939–1948.

Geodetic Research in Finland in the 20th Century 71
The Baltic triangulation ring measurement, which had started with so much energy,continued also to progress rapidly, and it in spite of the restless political situation in theworld it was even brought to a successful conclusion. The ring counted 317 triangulationpoints, and its total length was approximately 2 500 km. The closure error of the whole ringamounted to ±2.5 m, the mean error of a triangle point to ±0.37″, the mean error of longitudedifferences ±0.010r and the relative mean error of the comparison baselines 1:3 850 000.Gravity differences were measured by two different expeditions. The mean error of bothmeasurements was ±0.45 mGal. The measurement work of the Baltic triangulation ringwas thus an excellent success and of high quality accuracy-wise.
The activities of the Baltic Geodetic Commission were in reality led by its origi-nator an secretary-general I. Bonsdorff. As his assistant acted V.R. Ölander, who was alsoresponsible for the treatment of observations and for the final adjustment of the whole trian-gulation ring. The personnel of the Finnish Geodetic Institute participated in many interna-tional measurements of the ring, e.g. P. Kalaja, U. Pesonen and V.R. Ölander participated inthe baseline measurements and Y. Leinberg in the astronomical measurements.
9.2 Recovery of collaboration
In 1989, the International Association of Geodesy established an ad hoc workinggroup led by J. Kakkuri to plan the unification of the height systems of the countriesaround the Baltic Sea using satellite measurements. The initiator of the idea, the PoleProfessor J.B. Zielinski, was appointed secretary of the working group, and the Swede Pro-fessor L. Sjöberg vice-president (Poutanen and Kakkuri, 1999).
The working group organized in October 1990 a two weeks’ GPS observationcampaign, called the First Campaign, in which 26 tide gauge stations on the coast of theBaltic Sea were tied to the same height system. Measurement teams from Poland,Sweden, Germany, Finland and Denmark participated in the campaign.
As the First Campaign took place at a time of political unrest in the Baltic Statesand Russia, these countries were not able to take part in it. As soon as it was politicallypossible, contacts were made with the authorities of the newly independent states in or-der to plan and organize the Second Baltic Sea Level Campaign which was agreed to becarried out in the period June 7–13, 1993. The Second Campaign was then performedunder more favourable measurement conditions than the First Campaign, and plenty ofgood data was collected.
The Third Campaign was performed in the period May 21–29, 1997 simultane-ously with the EUVN (European Vertical GPS Reference Network) Campaign. The rea-son of combining these two campaigns was that most of the points on the Baltic Seaarea were common to both networks.
The working group collected from the above mentioned three campaigns a largevolume of accurate GPS data. In addition, tide gauge observation series as well as gra-vimetric data from the Baltic States and Russia were collected. All the data collectedwere then applied to calculating the gravimetric geoid for the Baltic Sea and to determi-

Juhani Kakkuri72
nation of the sea surface topography of the Baltic. The data was also used for calculat-ing the gravity potential, 0W , and its temporal variation, 0W" , on the Baltic Sea.
In fact, geodetic determination of the sea surface topography of the Baltic wasperformed in 1990’s many times using various techniques. The first of them (Ekmanand Mäkinen, 1996) was based on the levelling height system NH60 used to derivemean sea surface topography at Finnish, Swedish, Danish and Norwegian tide gauges inBaltic and its transition area to the North Sea. The next determination (Kakkuri andPoutanen, 1997) was based on the Baltic Sea Level GPS Campaign of 1993 at tide gaugesand on a modified BSL95A geoid of Vermeer (1995). The GPS/geoid technique usedmade it possible to use tide gauges on islands, not connected to the Nordic levelling net-work. A later GPS/geoid determination at tide gauges (Poutanen and Kakkuri, 2000)used the Baltic Sea Level GPS Campaign of 1997 and the NKG96 geoid (Forsberg etal., 1997). Also altimetry/geoid technique was successfully applied to the determinationof the sea surface topography (Poutanen, 2000).
10. The Metsähovi observatory
The observatory site Metsähovi, located in Kirkkonummi, counts research and ob-servation stations belonging to three institutes, namely the Finnish Geodetic Institute, Hel-sinki University of Technology and Helsinki University. Of these, the activity of the FinnishGeodetic Institute is concentrated on geodetic measurements with the aid of satellites,aimed at investigating the shape and size of the Earth, researching various motionstaking place in the Earth’s crust, and developing measurement methods. Furthermore theInstitute participates in the international tracking and orbit determination programmes.
10.1 The story of the satellite laser
At the beginning of 1972 is was completely clear, that the Finnish Geodetic In-stitute should undertake to develop a satellite observation technique based on the use ofelectronics and the use of computers, if it intended to stay along in the international de-velopment of its field. The precision of the stellar triangulation was no longer sufficientfor international triangulations, as one could perform considerably more precise meas-urements with “radars” based on the use of laser light and radio waves.
Of the new measurement instruments, the satellite lasers were the most precise,but also the most expensive. There was no market for these devices, so they had to bemade on order in electronics factories, or to be home-built. The Finnish Geodetic Insti-tute chose the latter alternative and started up a collaboration with Professor M. Tiuri ofHelsinki University of Technology. He again handed the planning tasks for the instru-ment down to Professor S. Halme, and when the Academy of Finland had agreed to actas the main financier of the project, the working group led by Halme and consisting ofJ. Kakkuri, Kalevi Kalliomäki, Kari Kalliomäki, M. Paunonen, O. Ojanen and A.B.

Geodetic Research in Finland in the 20th Century 73
Sharma started the construction work on the Finnish version of the satellite laser (e.g.Paunonen, 1982).
The group decided to build a so-called ruby laser. This was a pulsed radar. It de-veloped inside a ruby crystal a giant, short light pulse, which was fired up to a geodetic sat-ellite orbiting at several thousand kilometers height. The reflections were received in areflector telescope, which tracked the satellite’s motion. When the pulse’s back-and-forth travel time had been measured using a nanosecond counter, the instantaneous dis-tance to the satellite was obtained, using a formula describing the propagation of light, towithin a fraction of a metre. From successive shots, one could derive parameters de-scribing the satellite motion and orbital elements, and from those again elements of theEarth’s gravity field and intercontinental distances, with great accuracy.
The construction work on the satellite laser was started in 1973, and the first reflec-tions were obtained from the Geos-satellite in 1978. The planning and construction work,which lasted some five years, confronted lots of difficulties. When the work was started, theprecision of the time signals transmitted by international radio stations was at best 0.001seconds. This was not even close to being sufficient, as Universal Time was needed a hun-dred times more precisely, i.e., with a precision of 0.000 01 seconds. In order to improve theprecision of time signals, a quartz crystal clock was purchased by the Institute, and KaleviKalliomäki connected it through a LORAN-C receiver built by him to the internationalatomic clock time system. The quartz clock locked to the LORAN-signals soon proved to besufficiently precise, and the time signal problem had found a successful solution.
There were other problems to be solved. One of these had to do with the highpower laser pulses. The duration of one pulse was approximately 0.000 000 02 seconds,and the instantaneous power was 50 million watts! This caused technical problems, be-cause especially the optical parts of the instruments came under heavy load, and theyhad to be cooled; and safety problems, as the powerful light pulses were dangerouslybright. Every pulse had to hit its target, a satellite moving at great speed (6–7 km/s). Itsorbit had to be computed in advance, and the laser was to be fired with a precision ofseveral millionth parts of a second, in order for the pulse to hit its target.
The so-called return pulse reflecting from the satellite was extremely weak, espe-cially compared to the powerful outgoing pulse. In fact it contained only a few photons,which the receiving telescope collected onto the cathode of a photomultiplier tube. Thetelescope with which the return pulse was received, was entirely hand-built in Finland,as its mount was made in the State Technical Research Centre’s fine mechanical work-shop, the optical parts at Tuorla Observatory and the guidance electronics in the Institute’sown workshop. The diameter of the primary mirror was 63 cm.
All the problems, mentioned above and left unmentioned, were solved in satisfactoryways, and in 1978 the satellite laser started producing observational material, from which ithas been possible to determine e.g. the geocentric coordinates of Metsähovi with a precisionof approximately 2 centimetres. As a result of the development effort, two doctoral disserta-tions were born (M. Paunonen and A.B. Sharma) as well as two licentiate theses (Kari Kal-

Juhani Kakkuri74
liomäki and O. Ojanen). Also the Finnish people benefitted from the development work, asthe Finnish National Broadcasting Company (Yleisradio) took as the basis of its own timesignal transmissions the signals of the quartz clock locked to the LORAN signals, and soonall the clocks in the nation could be compared with a precision of a few millionths of a sec-ond with international atomic clocks.
10.2 American Doppler and GPS; French Doris
In spring 1982 the Finnish Geodetic Institute acquired from England a so-called Dop-pler satellite receiver. It could be used to determine the coordinates of the observation siterelative to the Earth’s centre with a precision of a few metres. The operation of the instru-ment was based on the use of the American Transit satellite system. It consisted of some tensatellites in polar orbits, that transmitted stabilized 150 MHz and 400 MHz frequency sig-nals. On the Earth’s surface, the Doppler receiver “heard” the transmitted frequency ashigher or lower, depending on whether the satellite was approaching or moving away. Fromthis so-called Doppler shift, the coordinates of the receiver could be calculated, if the satel-lite orbital elements were known. These were contained in the signal transmitted by the sat-ellite (Broadcast Ephemerides) or were added to the coordinate calculation process later on(Precise Ephemerides). Using its Doppler receiver, the Institute determined Metsähovi’sgeocentric coordinates during many years and collected an observational material fromwhich the polar motion of the Earth may be calculated actually more precisely than fromastronomical zenith observations.
The Transit satellite system became quickly obsolete, and halfway into the 1980’sit was replaced by the more advanced GPS system, i.e. the Global Positioning System.This all-weather satellite system developed by the United states comprises 24 satellitesorganized in circular orbits, a permanent network of tracking stations, and a large inter-national community of users. The satellites, which are orbiting at a height of approxi-mately 20 200 kilometres, transmit radio waves on two different frequencies, i.e.1 575.42 and 1 227.6 MHz. Both waves have modulated upon them information on thesatellite’s orbital elements and time signals. They are observed on the Earth’s surfaceusing the user community’s GPS receivers, which have an antenna and a precise clock,and the receiver’s “smart” computer calculates from these the location of the antennawith great accuracy. The tracking network consists of numerous permanent observartionstations, the coordinates of which are precisely known and that monitor all GPS satel-lites day in day out. Also Metsähovi belongs nowadays to this set of tracking stations.The GPS observations in Metsähovi are fed into the storage of computers in the UnitedStates and Europe once a day over electronic communication lines, to be used for com-puting and updating orbital elements. In 1992 Metsähovi joined the so-called IGS net-work (International GPS Service for geodynamics), which produces observational mate-rial for research into crustal movements.
North of Metsähovi, at a distance of some kilometres, is located the Sjökullatraining centre, and close to it, on a low lying field, a small hut and an antenna mast of

Geodetic Research in Finland in the 20th Century 75
some 3 metres height. In spite of its modest looks, the mast is one link in the Dorismeasurement system spanning the globe. This measurement system, maintained by theFrench mapping agency (Institut Géographique National), consists of fifty fixed sta-tions, which form a global triangulation network. The operations are based on radiowaves, which the ground stations transmit at frequencies of 401.25 MHz and 2 036.25MHz, and with the aid of which the small Doris receivers mounted on satellites can de-termine their position to within a fraction of a metre in a geocentric coordinate systemdefined by the ground stations.
When the Sjökulla Doris station started operations early 1989, its coordinateswere based upon the satellite laser’s coordinates. In 1989 the German mapping agencyInstitut für Angewandte Geodäsie (IfAG) brought from the United States to Europe ahigh precision radio telescope in order to measure the base points of the EuropeanEUREF coordinate system. Metsähovi had been chosen as one of the base points, andthat is why the radio telescope was brought in summer 1989 also to Finland, and with it,a precise reference point was established in Sjökulla.
10.3 The future of Metsähovi
At the Metsähovi Research Station, satellite observations have been performed since1978, i.e. over a period of 20 years. During these years, the station has established a firm po-sition among the geodetic fundamental stations of the world. In addition to satellite observa-tions, gravimetric measurements have been made in Metsähovi, and it is the location of thereference point of the Finnish gravimetric network. Also Earth tidal registrations have beenmade in Metsähovi over many years, as told earlier.
In the 1994 the Metsähovi Observatory was equipped with a superconducting gra-vimeter SG T020. In this instrument mechanical spring suspension is replaced by a magneticlevitation. Due to that, the instrument has superior sensitivity as well as smooth and smallinstrumental drift. Since August 1994 it has sampled every 1 second the gravity field with aprecision better than 1210− g (i.e. 1 nGal). The analyses of the data have shown that the su-perconducting gravimeter is useable for studies in all bands of gravity spectrum. It canmonitor the noise level at the microseismicity band and retrieve seismic eigenmodes. E.g.,microseismic vibration of the Fennoscandian Shied due to storms in northern Atlantic Oceanis observable. Tracks of moderate (M > 4.5) distant earthquakes are found from the data(Virtanen, 1998), and free oscillations triggered by major earthquakes are visible severaldays (Virtanen and Kääriäinen, 1997).
The Metsähovi Observatory is participating to Global Geodynamics Project,which started in 1997. Among scientific aims of this project are, for example, a study ofweak core effects on gravity as well as silent and slow earthquakes.

Juhani Kakkuri76
References
Chen, R., 1991. On the horizontal crustal deformations in Finland. Rep. Finn. Geod.Inst. 91:1. Helsinki.
Ekman, M. and J. Mäkinen, 1996. Mean sea surface topography in the Baltic Sea and itstransition area to the North Sea: A geodetic solution and comparisons withoceanographic models. J. Geophys. Res. 101 (C5), 11993–11999.
Forsberg, R., J. Kaminskis and D. Solheim, 1997. Geoid of the Nordic and Baltic regionfrom gravimetry and satellite altimetry. In: J. Segawa, H. Fujimoto and S. Okubo(Eds). Gravity, Geoid and Marine Geodesy, International Symposium, Tokyo, Ja-pan, September 30 – October 5, 1996. IAG Symposia 117, 540–547, Springer.
Heikkinen, M., 1981. Solving the shape of the earth by using digital density models.Rep. Finn. Geod. Inst. 81:2. Helsinki.
Heiskanen, W., 1951. On the World Geodetic System. Publ. Finn. Geod. Inst. 39. Hel-sinki.
Hirvonen, R.A., 1934. The continental undulations of the geoid. Publ. Finn. Geod. Inst.19. Helsinki.
Jokela, 1994. The 1993 adjustment of the Finnish first-order terrestrial triangulation.Publ. Finn. Geod. Inst. 119. Helsinki.
Kakkuri, J., 1973. Stellar triangulation with balloon-borne beacons and satellites. Uni-versity of Helsinki. (Academic Dissertation)
Kakkuri, J. and R. Konttinen, 1986. Surface deformations in Central Asia. Tectono-physics, 130 (1986) 333–336.
Kakkuri, J., 1997. Postglacial deformation of the Fennoscandian crust. Geophysica 33,99–109.
Kakkuri, J. and M. Poutanen, 1997. Geodetic determination of the sea surface topogra-phy of the Baltic Sea. Marine Geodesy 20, 307–316.
Kakkuri, J. and Z.T. Wang, 1998. Structural effects of the crust on the geoid modelled usingdeep seismic sounding interpretations. Geophys. J. Int. 135, 495–504.
Konttinen, R., 1985. Plate motion studies in Central Asia. Publ. Finn. Geod. Inst. 101. Hel-sinki.
Kukkamäki, T.J., 1938. Über die nivellitische Refraktion. Publ. Finn. Geod. Inst. 25.Helsinki.
Kukkamäki, T.J., 1939. Formeln und Tabellen zur Berechnung der nivellitischen Re-fraktion. Publ. Finn. Geod. Inst. 27. Helsinki.
Kukkamäki, T.J., 1966. Recording of the secular land tilting with pipe level. Ann. Acad.Sci. Fenn. A III, 90, 209–211.
Kukkamäki, T.J. and R.A. Hirvonen, 1954. The Finnish solar eclipse expeditions toGold Coast and Brazil 1947. Publ. Finn. Geod. Inst. 44. Helsinki.
Kääriäinen, E., 1953. On the recent uplift of the Earth’s crust in Finland. Publ. Finn.Geod. Inst. 42. Helsinki.

Geodetic Research in Finland in the 20th Century 77
Kääriäinen, J., 1979. Observing the Earth Tides with long water-tube tiltmeter. Publ.Finn. Geod. Inst. 88. Helsinki.
Mäkinen, J., 2000. Geodynamical studies using gravimetry and levelling. Academicdissertation in geophysics. University of Helsinki.
Mäkinen, J. and V. Saaranen, 1998. Determination of post-glacial land uplift from thethree precise levellings in Finland. Journal of Geodesy 72: 516–528.
Ollikainen, M., 1997. Determination of orthometric heights using GPS levelling. Publ.Finn. Geod. Inst. 123. Helsinki.
Paunonen, M., 1984. Studies on the Metsähovi satellite laser ranging system. Rep. Finn.Geod. Inst. 82:2. Helsinki.
Poutanen, M., 2000. Sea surface topography and vertical datums using space geodetictechniques. Publ. Finn. Geod. Inst. 128. Helsinki.
Poutanen, M. and J. Kakkuri, 1999. Final results of the Baltic sea level 1997 Campaign.Rep. Finn. Geod. Inst. 99:4. Helsinki.
Poutanen, M. and J. Kakkuri, 2000. The sea surface of the Baltic – a result from theBaltic Sea Level Project (IAG SSC 8.1). In: K-P. Schwarz (Ed.), Geodesy Beyond2000 – The challenges of the first decade. International Association of GeodesySymposia 121, Springer, 289–294.
Tanni, L., 1948. On the continental undulations of the geoid as determined from thepresent gravity material. Publ. Isostat. Inst. Int. Assoc. Geod., No. 18.
Vermeer, M., 1984. Geoid studies on Finland and the Baltic. Rep. Finn. Geod. Inst.84:3. Helsinki.
Vermeer, M., 1995. Two new geoids determined at the FGI. Rep. Finn. Geod. Inst.95:5. Helsinki.
Virtanen, H. and J. Kääriäinen, 1997. The GWR T020 superconducting gravimeter1994–1996 at the Metsähovi station. Rep. Finn. Geod. Inst. 97:4. Helsinki.
Virtanen, H., 1998. On superconducting gravimeter observations above 8 mHz at theMetsähovi station, Finland. Rep. Finn. Geod. Inst. 98:5. Helsinki.
Väisälä, Y., 1923. Tafeln für geodätische Berechnungen nach den Erddimensionen vonHayford. Publ. Finn. Geod. Inst. 1. Helsinki.
Väisälä, Y., 1923. Die Anwendung der Lichtinterferenz zu Längenmessungen aufgrösseren Distanzen. Publ. Finn. Geod. Inst. 2. Helsinki.
Väisälä, Y., 1930. Anwendung der Lichtinyterferenz bei Basismessungen. Publ. Finn.Geod. Inst. 14. Helsinki.
Väisälä, Y. und L. Oterma, 1960. Anwendung der Astronomischen Triangulations-methode. Publ. Finn. Geod. Inst. 53. Helsinki.
Wang, Z.T., 1998. Geoid and crustal structure in Fennoscandia. Publ. Finn. Geod. Inst.126.