geoelectrical investigation of an existing …eaas-journal.org/survey/userfiles/files/v4i606...
TRANSCRIPT
Dec 2013. Vol. 4, No. 6 ISSN2305-8269
International Journal of Engineering and Applied Sciences © 2012 - 2013 EAAS & ARF. All rights reserved www.eaas-journal.org
43
GEOELECTRICAL INVESTIGATION OF AN EXISTING DAM
WITHIN A BASEMENT COMPLEX TERRAIN, SOUTHWESTERN
NIGERIA
1OLADUNJOYE H.T.,
2OLASUNKANMI N.K. and
3OLATUNJI S.
1OLABISI ONABANJO UNIVERSITY, AGO-IWOYE, NIGERIA, [email protected]
2LADOKE AKINTOLA UNIVERSITY OF TECHNOLOGY, OGBOMOSHO, NIGERIA,
[email protected] 3UNIVERSITY OF ILORIN, ILORIN, NIGERIA, [email protected]
ABSTRACT
An existing dam site within the main campus of University of Ilorin, located around the southern flank of the
Nigerian basement complex in West central part of Nigeria was geoelectrically investigated using Vertical
Electrical Sounding (VES) technique of Schlumberger and Horizontal Resistivity Profiling (HRP) of Wenner
Array electrode configuration methods. The objectives are to investigate the vertical contact, lateral changes in
the geologic setting, the fracture pattern to evaluate possible dam seepage along the dam axis or the river
banks. Twenty seven (27) VES stations on eight profiles with maximum electrode spacing (AB) of 100 m and five
(5) HRP of 120 m were established along the flank of the dam. The lithology units delineated are the low
resistivity layer (top soil) , gravelly zone (mostly saturated) and weathered/fresh basement with resistivity
range of about 29-120 Ωm and thickness range of 0.8-3.1 m, 90- 200 Ωm with thickness range of 1.8-11.3 m
and 600-2577 Ωm at depth of 10 m downward respectively. Vertical Electrical Sounding (VES) revealed three
major lithological units delineated as the topsoil, weak/gravelly zone and the fracture/fresh basement. The
geoelectric sections showed low resistivity regions which might be due to percolation of water beneath 4
stations of which two (i.e. VES 1 and 10) are along the dam reservoir and the two starts at the depth of 10 m,
extending downward. The geoelectric maps show high resistivity range of about 29-2613 Ωm and thickness
range of 0.8-3.1 m. This is underlain by relatively low resistivity layer whose values loiters around 100 Ωm with
thickness range of 1.8-11.3 m, (remain values of fresh basement with its depth). This indicates near surface
bedrock straddled with basement depression or fracture. Though the weathered basement shows no surface
manifestation, but the significant water reduction can be experienced which is considered as responsible for low
recharge as the season changes. Different types of vertical contacts were able to delineate with the aid of HRP.
The pseudosections also revealed the depth to unexposed granitic intrusion that appeared in form of dyke in
some profiles and various vertical contacts were identified in the areas.
KEY WORDS: Dyke, HRP, VES, Seepage, Geometric factor, Bedrock
Introduction
Dams are vital elements which stores water for
purposes such as human consumption, food
production through irrigation, electricity
production, industrial use, recreation, flood
protection etc. It is a barrier of concrete or earth
that is built across a river or stream to obstruct or
control the flow of water, especially in order to
create a reservoir. Dam failure is usually fatal
which involves destruction of lives, properties and
the ecosystem 1. Hence, it is important to note that
once a dam is completed, it represents a potential
risk in the future, because of several factors acting
on the structures2. History has shown that flood
disaster is not a recent phenomenon, and that its
destructive tendencies are sometimes enormous.
For instance, in Nigeria, report has it that serious
flood disasters have occurred in Ibadan (1985,
1987 and 1990), Oshogbo (1992, 1996, and 2002),
Yobe (2000), Akure (1996, 2000, 2002, 2004 and
2006) and the coastal cities of Lagos, Ogun, Port
Harcourt, Calabar, Uyo, and Warri3, 4
.
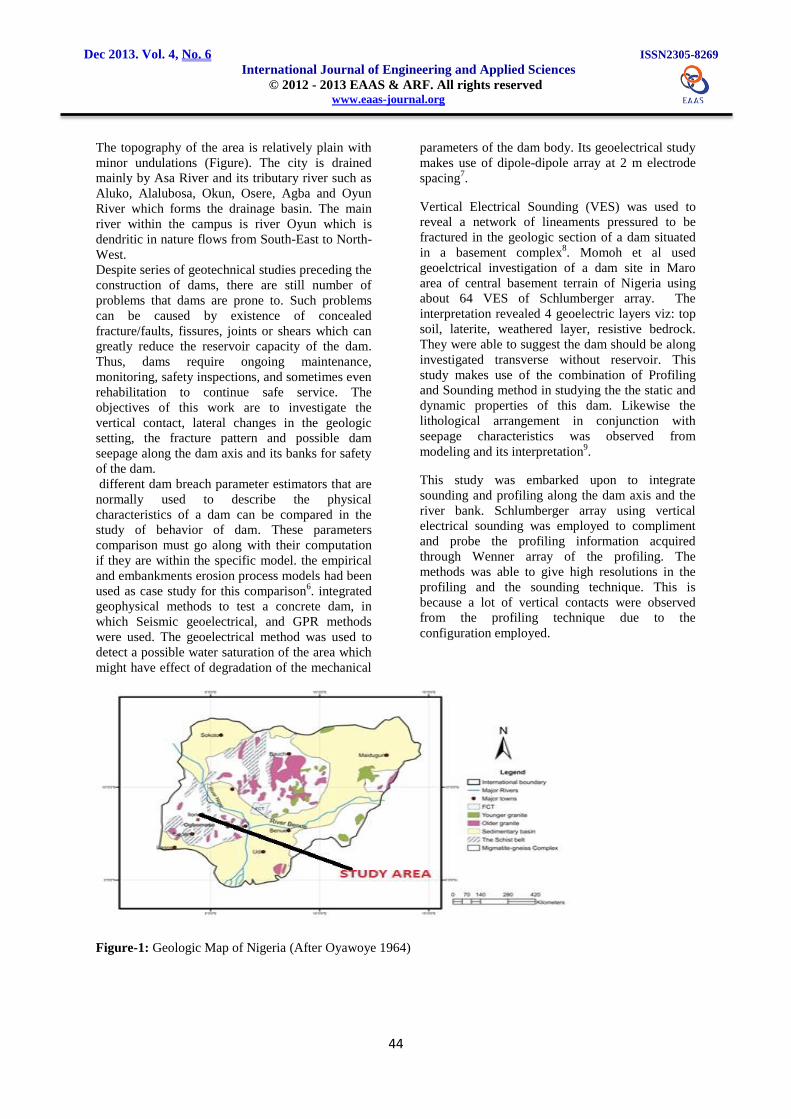
University of Ilorin Dam is the studied dam which
is located within basement complex of Nigeria.
(Figure-1)5. It lies entirely within the basement
rocks in the Western part of Central Nigeria
bounded by longitudes 4° 39'52" to 4° 40'0"E and
latitudes 8° 27'5" to 8° 28'5"N. The study site is
easily accessible through a moderately wide
motorable road that eased the fieldwork (Figure-2).
Dec 2013. Vol. 4, No. 6 ISSN2305-8269
International Journal of Engineering and Applied Sciences © 2012 - 2013 EAAS & ARF. All rights reserved www.eaas-journal.org
44
The topography of the area is relatively plain with
minor undulations (Figure). The city is drained
mainly by Asa River and its tributary river such as
Aluko, Alalubosa, Okun, Osere, Agba and Oyun
River which forms the drainage basin. The main
river within the campus is river Oyun which is
dendritic in nature flows from South-East to North-
West.
Despite series of geotechnical studies preceding the
construction of dams, there are still number of
problems that dams are prone to. Such problems
can be caused by existence of concealed
fracture/faults, fissures, joints or shears which can
greatly reduce the reservoir capacity of the dam.
Thus, dams require ongoing maintenance,
monitoring, safety inspections, and sometimes even
rehabilitation to continue safe service. The
objectives of this work are to investigate the
vertical contact, lateral changes in the geologic
setting, the fracture pattern and possible dam
seepage along the dam axis and its banks for safety
of the dam.
different dam breach parameter estimators that are
normally used to describe the physical
characteristics of a dam can be compared in the
study of behavior of dam. These parameters
comparison must go along with their computation
if they are within the specific model. the empirical
and embankments erosion process models had been
used as case study for this comparison6. integrated
geophysical methods to test a concrete dam, in
which Seismic geoelectrical, and GPR methods
were used. The geoelectrical method was used to
detect a possible water saturation of the area which
might have effect of degradation of the mechanical
parameters of the dam body. Its geoelectrical study
makes use of dipole-dipole array at 2 m electrode
spacing7.
Vertical Electrical Sounding (VES) was used to
reveal a network of lineaments pressured to be
fractured in the geologic section of a dam situated
in a basement complex8. Momoh et al used
geoelctrical investigation of a dam site in Maro
area of central basement terrain of Nigeria using
about 64 VES of Schlumberger array. The
interpretation revealed 4 geoelectric layers viz: top
soil, laterite, weathered layer, resistive bedrock.
They were able to suggest the dam should be along
investigated transverse without reservoir. This
study makes use of the combination of Profiling
and Sounding method in studying the the static and
dynamic properties of this dam. Likewise the
lithological arrangement in conjunction with
seepage characteristics was observed from
modeling and its interpretation9.
This study was embarked upon to integrate
sounding and profiling along the dam axis and the
river bank. Schlumberger array using vertical
electrical sounding was employed to compliment
and probe the profiling information acquired
through Wenner array of the profiling. The
methods was able to give high resolutions in the
profiling and the sounding technique. This is
because a lot of vertical contacts were observed
from the profiling technique due to the
configuration employed.
Figure-1: Geologic Map of Nigeria (After Oyawoye 1964)

Dec 2013. Vol. 4, No. 6 ISSN2305-8269
International Journal of Engineering and Applied Sciences © 2012 - 2013 EAAS & ARF. All rights reserved www.eaas-journal.org
45
Figure-2: Road Map of University of Ilorin Showing the Study Area (Olasunkanmi et al)
MATERIALS AND METHODS
Electrical resistivity method of geophysical survey
using Vertical Electrical Sounding (VES) technique
of Schlumberger and Horizontal Resistivity
Profiling (HRP) of Wenner array electrode
configurations was used to achieve the stated
objectives of this work. Twenty seven VES
stations on eight profiles with maximum electrode
spacing (AB) of 100 m and five HRP of 120 m
were established along the West-East flank of the
dam. HRP involves the process where current and
potential electrodes are maintained at a fixed
separation and progressively moved along the
traverse after each measurement.
VES involves the process where the current and
potential electrodes are maintained at same relative
spacing and the whole spread is progressively
expanded along the profile.
Theory: The fundamental equations are derivable
from Ohm’s laws. The electric potential Vr at any
point P distance r from a point electrode emitting
an electric current I in an infinite homogenous and
isotropic medium of Resistivity ρ is given by10, 11
For a semi-finite medium, this is the simplest Earth
model, and with both current and potential point-
electrodes placed at the Earth’s surface.
( )
Irrespective of surface location and electrode
spread, the resistivity is constant in a homogenous
and isotropic ground. However, it does vary with
the relative positions of electrodes when there is
presence of subsurface inhomogeneities and any
computed value is known as apparent resistivity ρa.
( )
For a semi-finite medium, which is the simplest
earth model, and with both current and potential
point-electrodes placed at the earth’s surface,
8° 29'
8° 28'
4° 39' 4° 40'
4° 39' 4° 40'
8° 29'
8° 28'
STAFF QUARTERS
UNJLORIN PRY SCHOOL
UNILORIN SECONDARY SCHOOL
UNILORIN DAM
RECEPTION GROUND
WORKS (ADMIN)
PG HOTEL
SCHOOL CLINIC
SUGBUILDING
GT BANKSKY BANKUNILORIN
CENTRALMOSQUE
SENATEBUILDING
SUGAR RESERCH INSTITUTE
FACULTY OF ENGINEERING
MAIN CAMPUS GATE
Dec 2013. Vol. 4, No. 6 ISSN2305-8269
International Journal of Engineering and Applied Sciences © 2012 - 2013 EAAS & ARF. All rights reserved www.eaas-journal.org
43
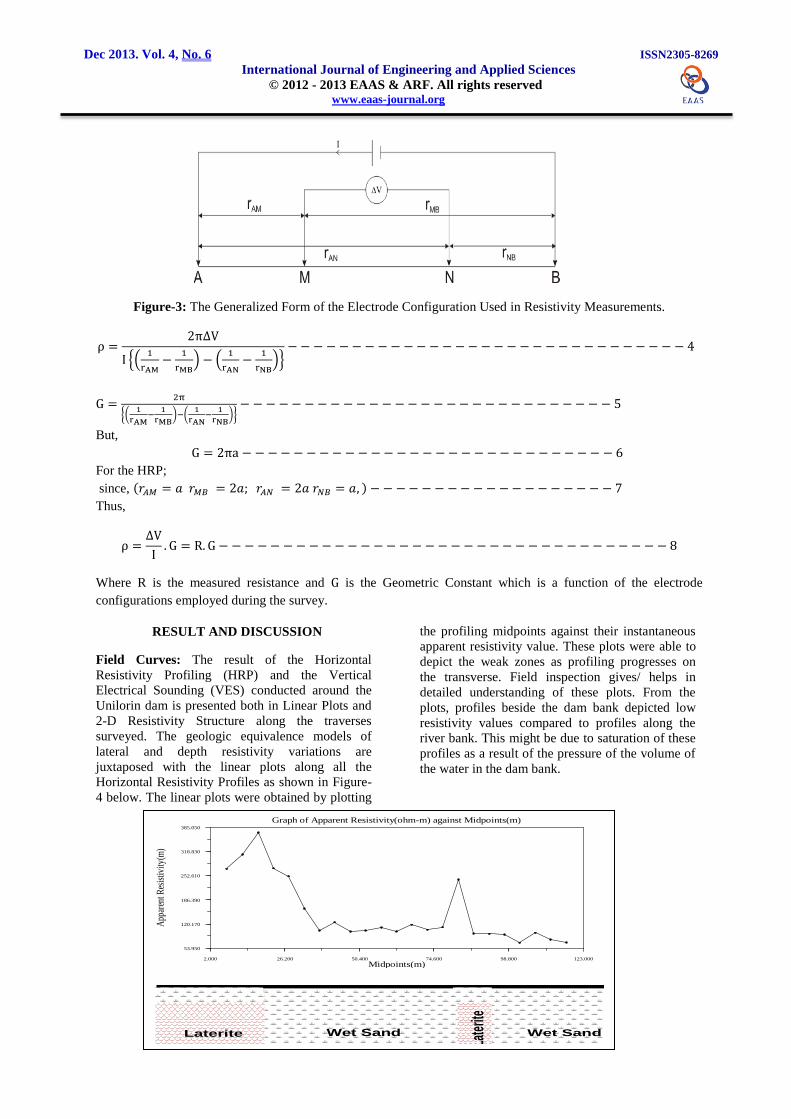
Figure-3: The Generalized Form of the Electrode Configuration Used in Resistivity Measurements.
(
) (
)
(
) (
)
But,
For the HRP;
since, ( )
Thus,
Where R is the measured resistance and is the Geometric Constant which is a function of the electrode
configurations employed during the survey.
RESULT AND DISCUSSION
Field Curves: The result of the Horizontal
Resistivity Profiling (HRP) and the Vertical
Electrical Sounding (VES) conducted around the
Unilorin dam is presented both in Linear Plots and
2-D Resistivity Structure along the traverses
surveyed. The geologic equivalence models of
lateral and depth resistivity variations are
juxtaposed with the linear plots along all the
Horizontal Resistivity Profiles as shown in Figure-
4 below. The linear plots were obtained by plotting
the profiling midpoints against their instantaneous
apparent resistivity value. These plots were able to
depict the weak zones as profiling progresses on
the transverse. Field inspection gives/ helps in
detailed understanding of these plots. From the
plots, profiles beside the dam bank depicted low
resistivity values compared to profiles along the
river bank. This might be due to saturation of these
profiles as a result of the pressure of the volume of
the water in the dam bank.
Graph of Apparent Resistivity(ohm-m) against Midpoints(m)
App
aren
t Res
istiv
ity(m
)
Midpoints(m)
53.950
120.170
186.390
252.610
318.830
385.050
2.000 26.200 50.400 74.600 98.800 123.000
Wet SandLaterite Wet Sand
Late
rite
Dec 2013. Vol. 4, No. 6 ISSN2305-8269
International Journal of Engineering and Applied Sciences © 2012 - 2013 EAAS & ARF. All rights reserved www.eaas-journal.org
47
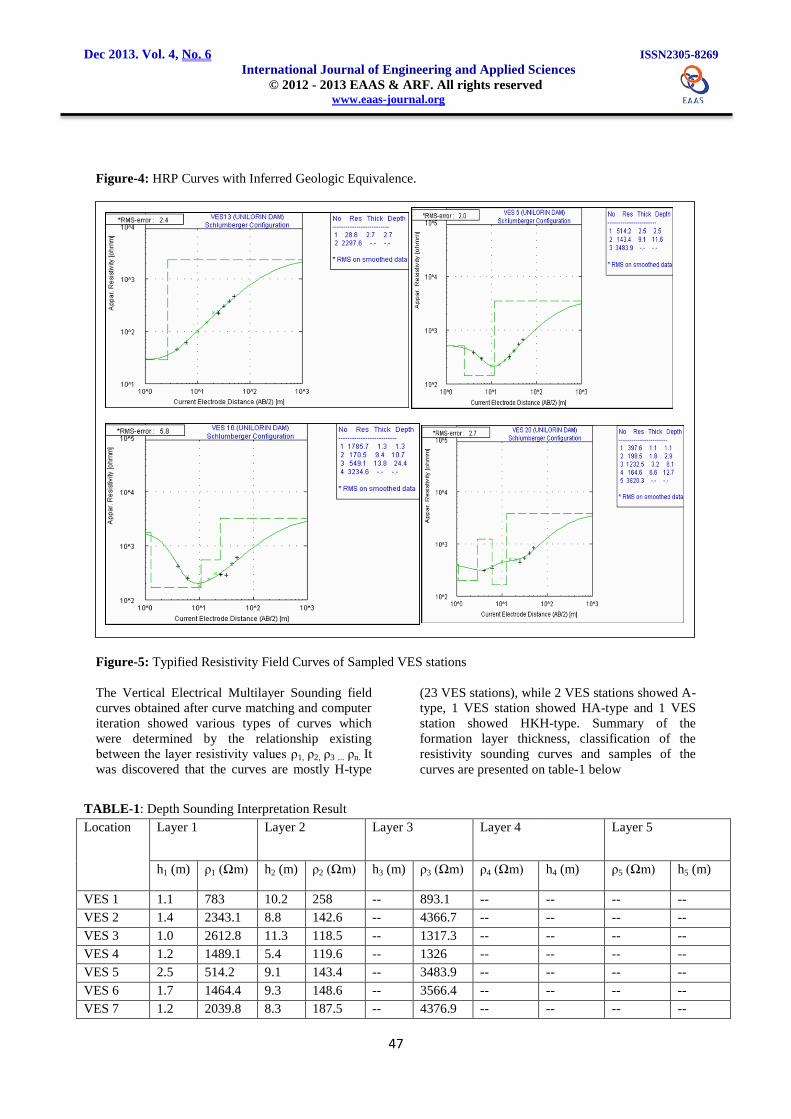
Figure-4: HRP Curves with Inferred Geologic Equivalence.
Figure-5: Typified Resistivity Field Curves of Sampled VES stations
The Vertical Electrical Multilayer Sounding field
curves obtained after curve matching and computer
iteration showed various types of curves which
were determined by the relationship existing
between the layer resistivity values ρ1, ρ2, ρ3 ... ρn. It
was discovered that the curves are mostly H-type
(23 VES stations), while 2 VES stations showed A-
type, 1 VES station showed HA-type and 1 VES
station showed HKH-type. Summary of the
formation layer thickness, classification of the
resistivity sounding curves and samples of the
curves are presented on table-1 below
TABLE-1: Depth Sounding Interpretation Result
Location
Layer 1 Layer 2 Layer 3 Layer 4 Layer 5
h1 (m) ρ1 (Ωm) h2 (m) ρ2 (Ωm) h3 (m) ρ3 (Ωm) ρ4 (Ωm) h4 (m) ρ5 (Ωm) h5 (m)
VES 1 1.1 783 10.2 258 -- 893.1 -- -- -- --
VES 2 1.4 2343.1 8.8 142.6 -- 4366.7 -- -- -- --
VES 3 1.0 2612.8 11.3 118.5 -- 1317.3 -- -- -- --
VES 4 1.2 1489.1 5.4 119.6 -- 1326 -- -- -- --
VES 5 2.5 514.2 9.1 143.4 -- 3483.9 -- -- -- --
VES 6 1.7 1464.4 9.3 148.6 -- 3566.4 -- -- -- --
VES 7 1.2 2039.8 8.3 187.5 -- 4376.9 -- -- -- --
Dec 2013. Vol. 4, No. 6 ISSN2305-8269
International Journal of Engineering and Applied Sciences © 2012 - 2013 EAAS & ARF. All rights reserved www.eaas-journal.org
48
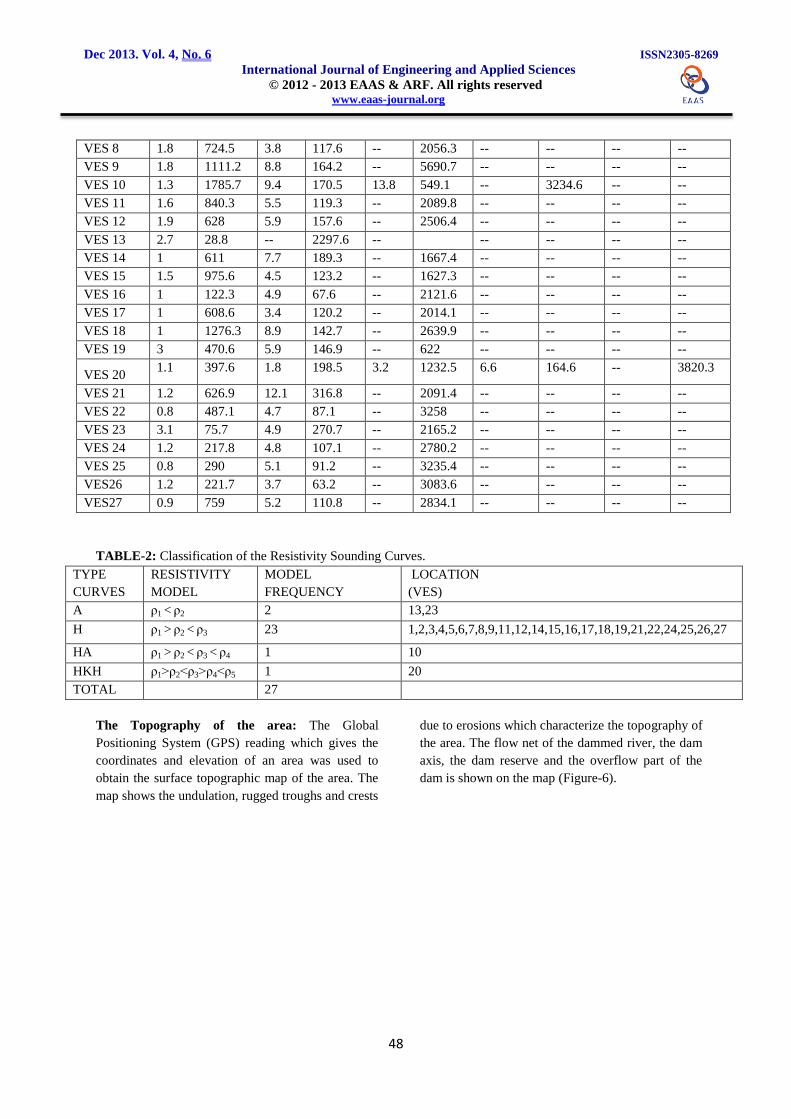
VES 8 1.8 724.5 3.8 117.6 -- 2056.3 -- -- -- --
VES 9 1.8 1111.2 8.8 164.2 -- 5690.7 -- -- -- --
VES 10 1.3 1785.7 9.4 170.5 13.8 549.1 -- 3234.6 -- --
VES 11 1.6 840.3 5.5 119.3 -- 2089.8 -- -- -- --
VES 12 1.9 628 5.9 157.6 -- 2506.4 -- -- -- --
VES 13 2.7 28.8 -- 2297.6 -- -- -- -- --
VES 14 1 611 7.7 189.3 -- 1667.4 -- -- -- --
VES 15 1.5 975.6 4.5 123.2 -- 1627.3 -- -- -- --
VES 16 1 122.3 4.9 67.6 -- 2121.6 -- -- -- --
VES 17 1 608.6 3.4 120.2 -- 2014.1 -- -- -- --
VES 18 1 1276.3 8.9 142.7 -- 2639.9 -- -- -- --
VES 19 3 470.6 5.9 146.9 -- 622 -- -- -- --
VES 20 1.1 397.6 1.8 198.5 3.2 1232.5 6.6 164.6 -- 3820.3
VES 21 1.2 626.9 12.1 316.8 -- 2091.4 -- -- -- --
VES 22 0.8 487.1 4.7 87.1 -- 3258 -- -- -- --
VES 23 3.1 75.7 4.9 270.7 -- 2165.2 -- -- -- --
VES 24 1.2 217.8 4.8 107.1 -- 2780.2 -- -- -- --
VES 25 0.8 290 5.1 91.2 -- 3235.4 -- -- -- --
VES26 1.2 221.7 3.7 63.2 -- 3083.6 -- -- -- --
VES27 0.9 759 5.2 110.8 -- 2834.1 -- -- -- --
TABLE-2: Classification of the Resistivity Sounding Curves.
TYPE
CURVES
RESISTIVITY
MODEL
MODEL
FREQUENCY
LOCATION
(VES)
A ρ1 < ρ2 2 13,23
H ρ1 > ρ2 < ρ3 23 1,2,3,4,5,6,7,8,9,11,12,14,15,16,17,18,19,21,22,24,25,26,27
HA ρ1 > ρ2 < ρ3 < ρ4 1 10
HKH ρ1>ρ2<ρ3>ρ4<ρ5 1 20
TOTAL 27
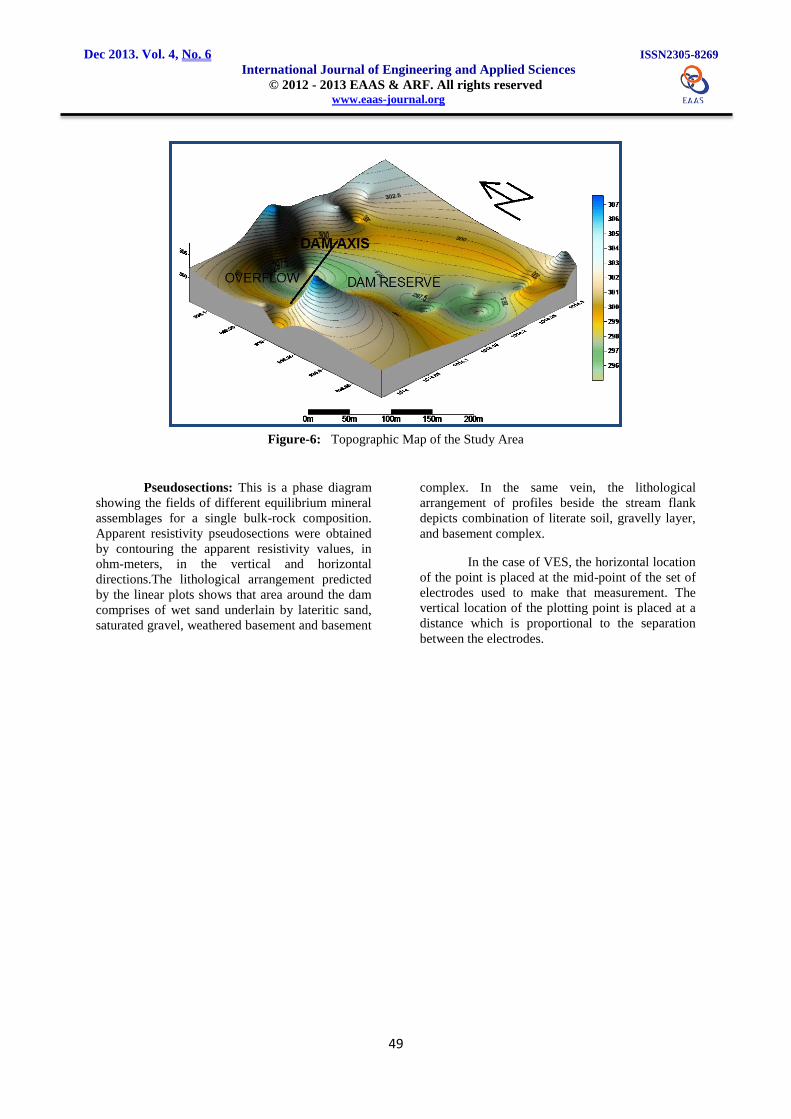
The Topography of the area: The Global
Positioning System (GPS) reading which gives the
coordinates and elevation of an area was used to
obtain the surface topographic map of the area. The
map shows the undulation, rugged troughs and crests
due to erosions which characterize the topography of
the area. The flow net of the dammed river, the dam
axis, the dam reserve and the overflow part of the
dam is shown on the map (Figure-6).
Dec 2013. Vol. 4, No. 6 ISSN2305-8269
International Journal of Engineering and Applied Sciences © 2012 - 2013 EAAS & ARF. All rights reserved www.eaas-journal.org
49
Figure-6: Topographic Map of the Study Area
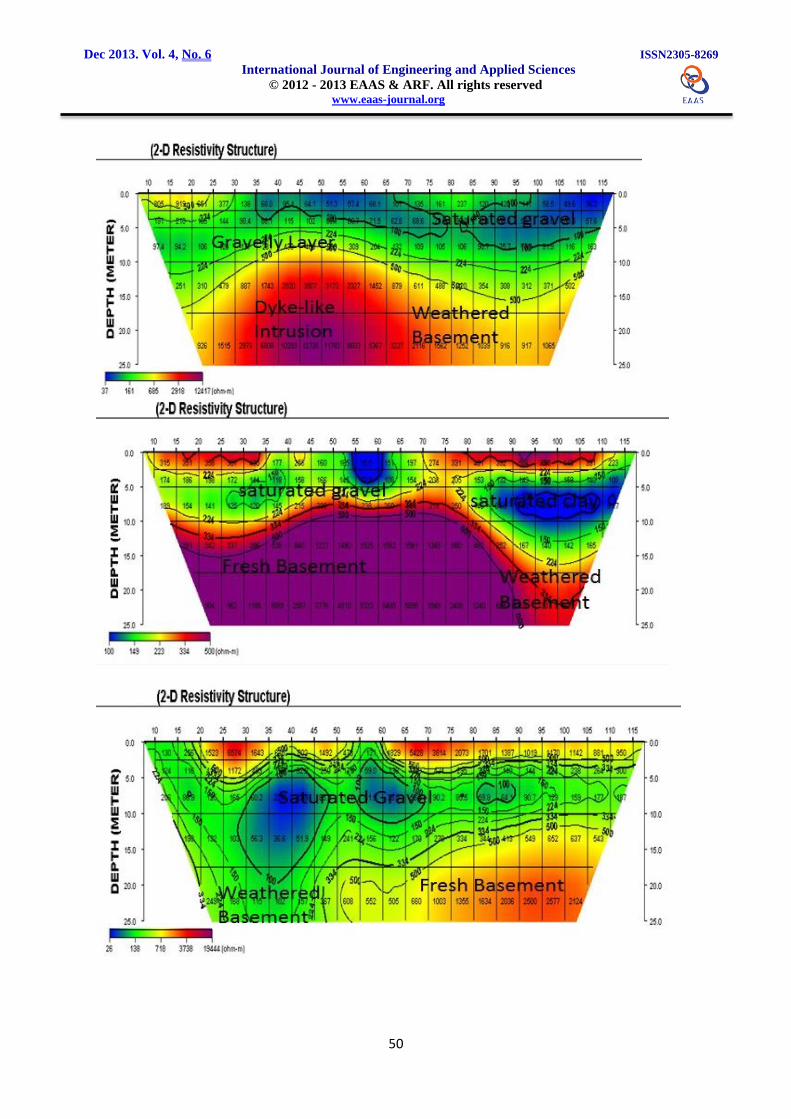
Pseudosections: This is a phase diagram
showing the fields of different equilibrium mineral
assemblages for a single bulk-rock composition.
Apparent resistivity pseudosections were obtained
by contouring the apparent resistivity values, in
ohm-meters, in the vertical and horizontal
directions.The lithological arrangement predicted
by the linear plots shows that area around the dam
comprises of wet sand underlain by lateritic sand,
saturated gravel, weathered basement and basement
complex. In the same vein, the lithological
arrangement of profiles beside the stream flank
depicts combination of literate soil, gravelly layer,
and basement complex.
In the case of VES, the horizontal location
of the point is placed at the mid-point of the set of
electrodes used to make that measurement. The
vertical location of the plotting point is placed at a
distance which is proportional to the separation
between the electrodes.
Dec 2013. Vol. 4, No. 6 ISSN2305-8269
International Journal of Engineering and Applied Sciences © 2012 - 2013 EAAS & ARF. All rights reserved www.eaas-journal.org
50
Dec 2013. Vol. 4, No. 6 ISSN2305-8269
International Journal of Engineering and Applied Sciences © 2012 - 2013 EAAS & ARF. All rights reserved www.eaas-journal.org
51
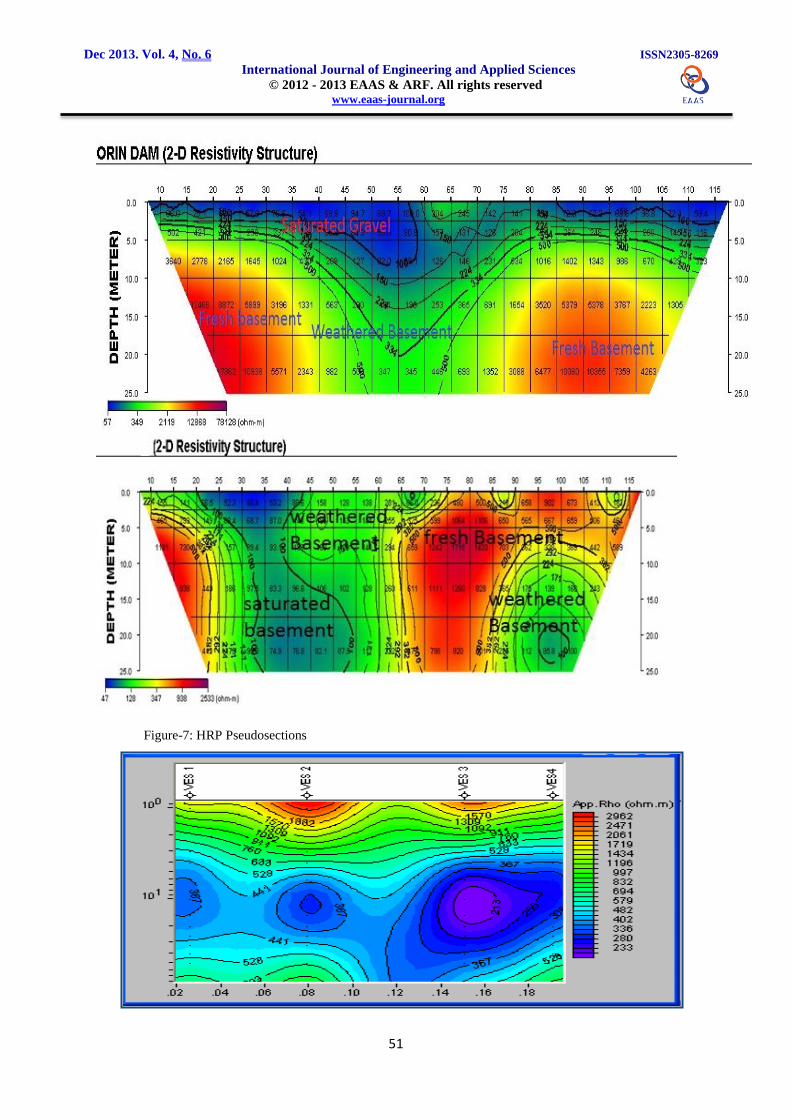
Figure-7: HRP Pseudosections
Fig. 5: Vertical Psuodosections
Dec 2013. Vol. 4, No. 6 ISSN2305-8269
International Journal of Engineering and Applied Sciences © 2012 - 2013 EAAS & ARF. All rights reserved www.eaas-journal.org
52
Dec 2013. Vol. 4, No. 6 ISSN2305-8269
International Journal of Engineering and Applied Sciences © 2012 - 2013 EAAS & ARF. All rights reserved www.eaas-journal.org
53
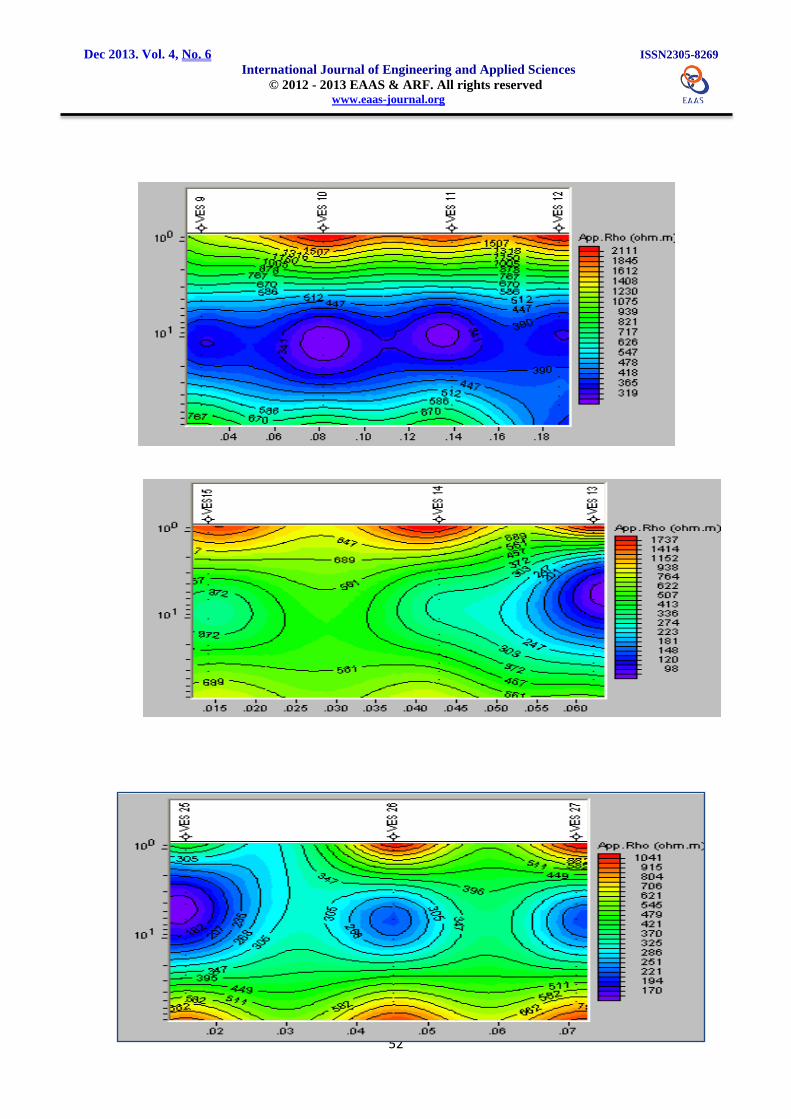
Figure-8 VES Pseudosections
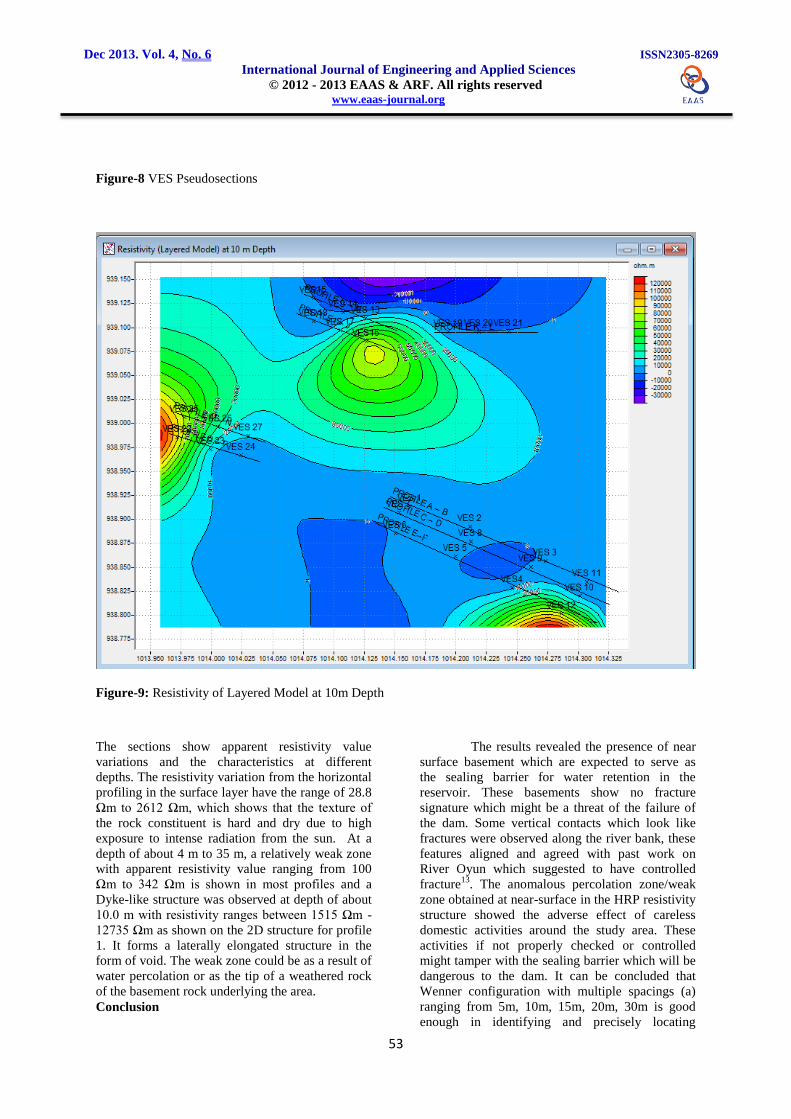
Figure-9: Resistivity of Layered Model at 10m Depth
The sections show apparent resistivity value
variations and the characteristics at different
depths. The resistivity variation from the horizontal
profiling in the surface layer have the range of 28.8
Ωm to 2612 Ωm, which shows that the texture of
the rock constituent is hard and dry due to high
exposure to intense radiation from the sun. At a
depth of about 4 m to 35 m, a relatively weak zone
with apparent resistivity value ranging from 100
Ωm to 342 Ωm is shown in most profiles and a
Dyke-like structure was observed at depth of about
10.0 m with resistivity ranges between 1515 Ωm -
12735 Ωm as shown on the 2D structure for profile
1. It forms a laterally elongated structure in the
form of void. The weak zone could be as a result of
water percolation or as the tip of a weathered rock
of the basement rock underlying the area.
Conclusion
The results revealed the presence of near
surface basement which are expected to serve as
the sealing barrier for water retention in the
reservoir. These basements show no fracture
signature which might be a threat of the failure of
the dam. Some vertical contacts which look like
fractures were observed along the river bank, these
features aligned and agreed with past work on
River Oyun which suggested to have controlled
fracture13
. The anomalous percolation zone/weak
zone obtained at near-surface in the HRP resistivity
structure showed the adverse effect of careless
domestic activities around the study area. These
activities if not properly checked or controlled
might tamper with the sealing barrier which will be
dangerous to the dam. It can be concluded that
Wenner configuration with multiple spacings (a)
ranging from 5m, 10m, 15m, 20m, 30m is good
enough in identifying and precisely locating
Dec 2013. Vol. 4, No. 6 ISSN2305-8269
International Journal of Engineering and Applied Sciences © 2012 - 2013 EAAS & ARF. All rights reserved www.eaas-journal.org
54
geologic vertical contacts, weak zones, faults, and
fractures. The fracture pattern of the study area is
unevenly distributed. Also the depth to the
basement in the study area is shallow. The low
resistivity areas, weak zones, delineated by the
geoelectric map present little or no risk of reservoir
water seepage but may be the water table or the
area is extensively marshy, capable of retaining
water to the ground surface level. The suspected
fractured basement observed beneath some
sounding points along the dam bank, started at the
depth of 10 m and proceeds downward as
explained in figure-9. These can be considered
inimical to the continued water retention or zone of
anomalous seepage but no surface manifestation
and significant water reduction experienced. The
presence of fracture is generally accompanied by
high fluid streaming potential and substantial water
can be lost through the fractures thus initiating the
weakening of the dam foundation
REFERENCES
1. Akanmu J.O. Management of the
Downstream Impacts of Dams Operation
orbed Experience and Hydropower Dams
as a Case Study, 22nd
ICOLD proceeding
Volume II, Barcelona, Spain, pp 517-526
(2006)
2. ICOLD World Register of Dams,
Computer Database, Paris, International
Commission on Large Dams (1998)
3. Daily Sketch. Kano to spend N17 million
on drainage, 16th November, p.3. Ibadan
(1988)
4. African Concord. Chaining the Flood
Monster, Vol.2, No.24, pp.12-13.
Concord, Lagos. (1988)
5. Nigerian Compass.. Combating flood
disasters in Nigeria 6th
September 2010
p.20 (2010)
6. Oyawoye M.O, The Basement Complex
of Nigeria, Geological survey of Nigeria.
Vol.1and 2, pp 87-102 (1964)
7. Gee, D. Michael and Brunner, Gary W.,
Comparison of Breach Predictors
Association of State Dam Safety Officials
(ASDSO), Dam Safety 2007, Austin TX 9-
13 September (2007)
8. Karasthathis V.K , Karmis P.N Drakatos
V,.Stavrakakis G, geophysical methods
contributing to the testing of concrete
dams; application of Marathon Dam
Journal of applied geophysics 50 pp247-
260 (2002)
9. Oyeneye O., Oladapo I. and Folami S.
Geoelectrical study of Dam Site of Federal
College of Agriculture, South Western
Nigeria, Journal of Medwell online Vol.,
2, No. 10, PP 1048 – 1056 ; (2007)
10. Grant, F.S.and West G.F., Interpretation
Theory in Applied Geophysics, McGraw-
Hill, New York (1965)
11. Dobrin, M.B. and C.H. Savit, Introduction
to Geophysical Prospecting 4th Edition.,
McGraw Hill Book Co., New York (1988)
12. Olasehinde, P.I. Elucidating fracture
patterns of the Nigerian Basement
Complex, using electrical resistivity
method. Z. Angew. Geowiss. Heff., 8, 5,
pp.109-120 (1989)