geohydrologic data section standard operating … · sop# geo_02.01.00 date 12/9/2013 revision #...
TRANSCRIPT

GEOHYDROLOGIC DATA SECTION Standard Operating Procedures
January 2014
Data Collection Bureau Southwest Florida Water Management District
2379 Broad Street Brooksville, Florida 34604-6899

TableofContents
0.01–SiteDevelopment01.01.00 Real Estate Acquisition …………………………………………………………………………… 3
01.02.00 Well Site Preparation ……………………………………………………………………………… 12
0.02–ExploratoryCoringandTesting02.01.00 Wire‐Line Coring ……………………………………………………………………………………. 13
02.02.00 Lithologic Sample Collection ………………………………………………………………….. 15
02.03.00 Slug Testing ……………………………………….........................................................17
02.04.00 Water Quality Sampling …………………………………………………………………………. 24
0.03–WellConstruction03.01.00 Well and Aquifer Test Design …………………………………………………………………. 27
03.02.00 Drilling Contractor Selection – Flowchart ………………..……………………………… 32
03.03.00 General well Construction ……………………………………………………………………… 33
03.04.00 Geopositioning – Flowchart ….……………………………………………………………….. 34
03.05.00 Staff Oversight During Well Construction ………………………………………………..35
03.06.00 Post Well Construction Payment Verification …………………………………………. 38
0.04–AquiferPerformanceTesting04.01.00 Aquifer Performance Testing Equipment Set‐up …………………………………….. 39
04.02.00 Conducting an Aquifer Performance Test ……………………………………………….. 42
0.05–ReportPreparation05.01.00 Slug Test Analysis …………………………………………………………………………………… 46
05.02.00 Aquifer Performance Test Analysis …………………………………………………………. 50
05.03.00 Report Formatting …………………………………………………………………………………..52
05.04.00 Report Review and Publication Flowchart ………………………………………….….. 55
0.06–ProjectCompletion06.01.00 Well Site Restoration …………………………………………………………………………….. 56
06.02.00 Data Management ………………………………………………………………………………… 57
06.03.00 Well Site Completion Checklist ……………………………………………………………… 60
0.07–WellLogging07.01.00 Geophysical and Video Well Logging …………………………………………………….. 61
0.08–QualityofWaterImprovementProgram08.01.00 QWIP Reimbursement Process – Flowchart ……………………………………….…. 66
08.02.00 Establishing New QWIP Well File ……………………..………….…….…………………. 67


SOP# GEO_01.01.00
Date 12/5/2013
Revision # Original
3
RealEstateAcquisition
PURPOSEEstablishment of a uniform procedure for acquiring a parcel of land for the construction of a monitor well station.
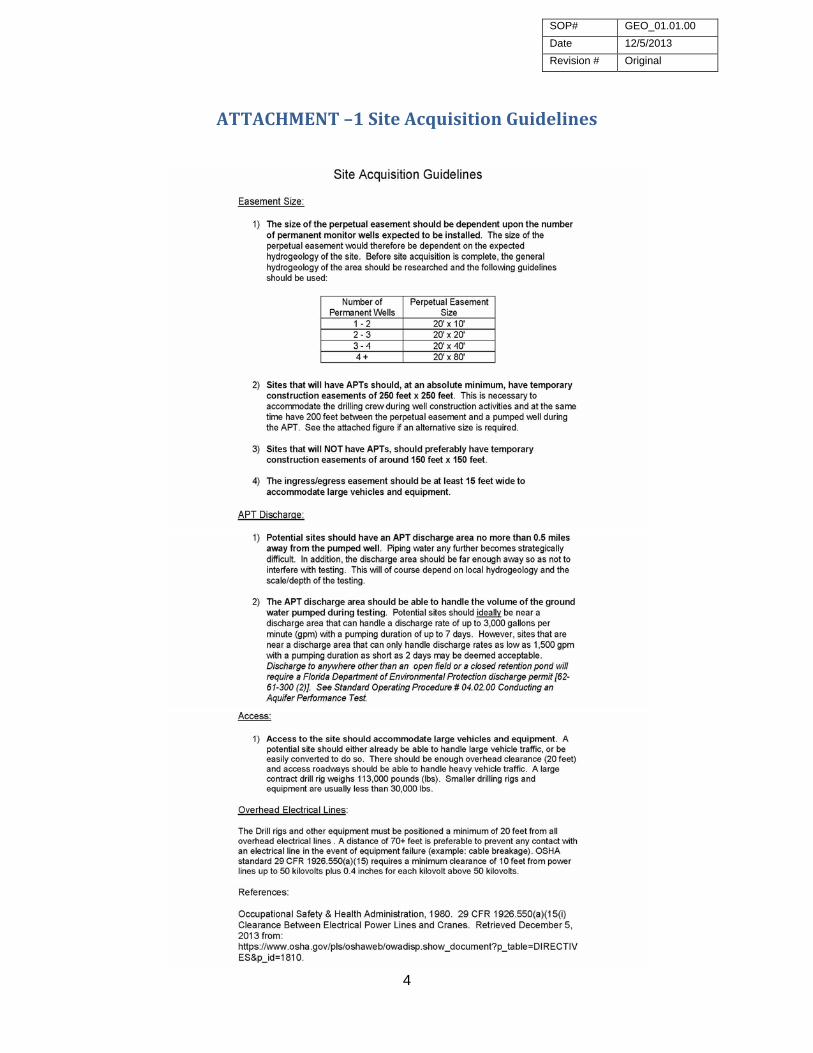
PROCEDURE1. Review Site Acquisition Guidelines (Attachment ‐1) 2. Draft a Site Acquisition memorandum to Real Estate Services (Attachment ‐2) The
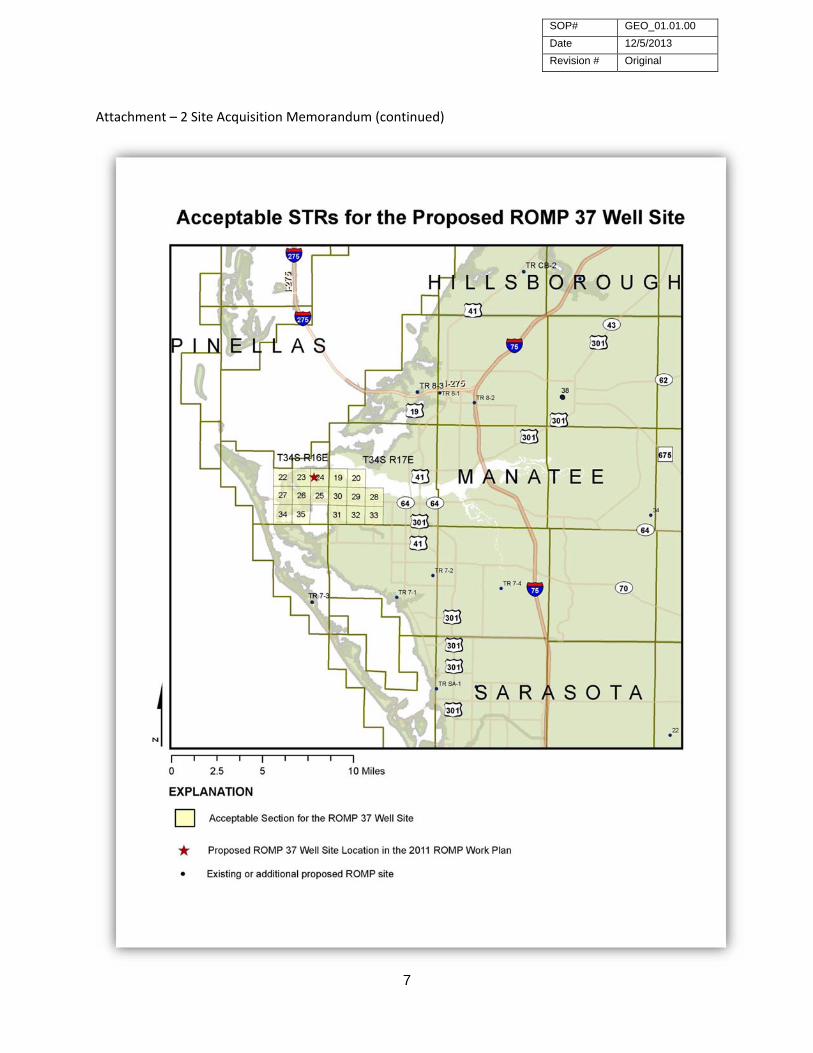
memorandum should list: a. Site location: specify a preferred area for the site (include a map) b. Site size requirements:
1. Perpetual well site: (example: 20 feet x 80 feet) 2. Temporary construction area: (example: 250 feet x 300 feet) 3. Perpetual Ingress/Egress: (example: 10 feet wide)
c. Time requirements: 1. Perpetual well site: (example: perpetual) 2. Temporary construction area: (example: 60 months) 3. Ingress/egress easement: (example: perpetual)
d. Aquifer Performance Test (APT) requirement: 1. If required – the location must have a suitable surface feature to accept
the water discharged during APT 3. Real Estate Services will provide a list of possible locations
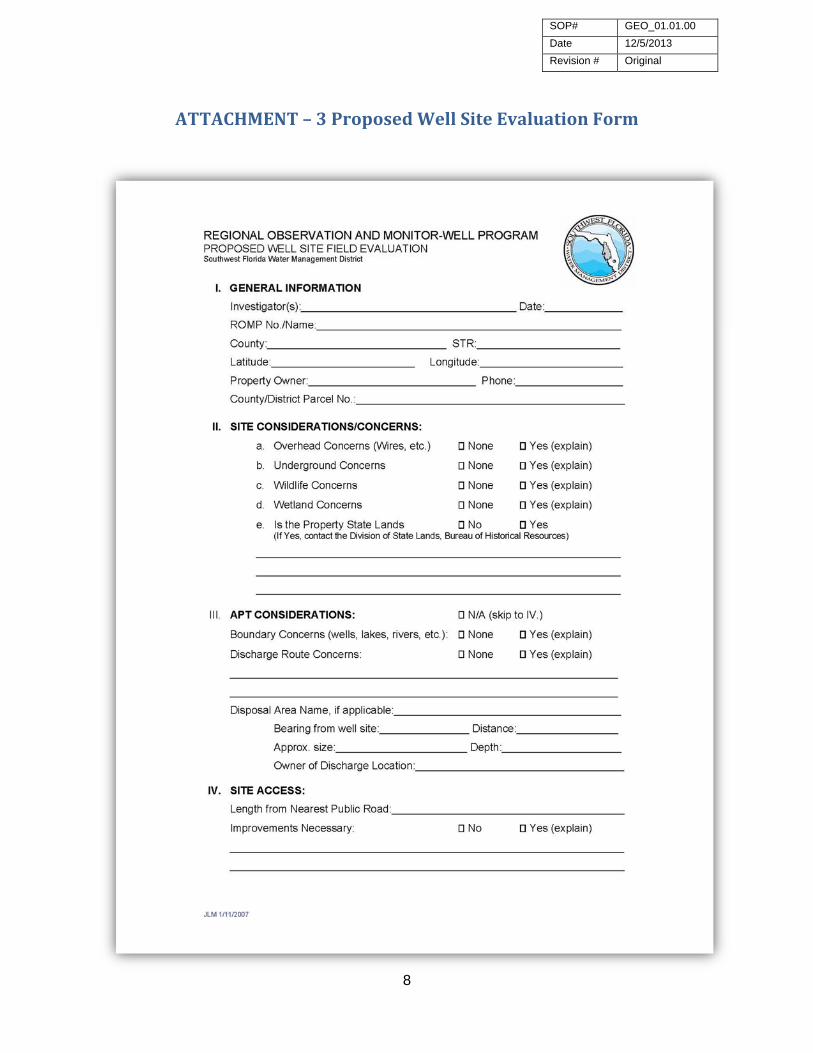
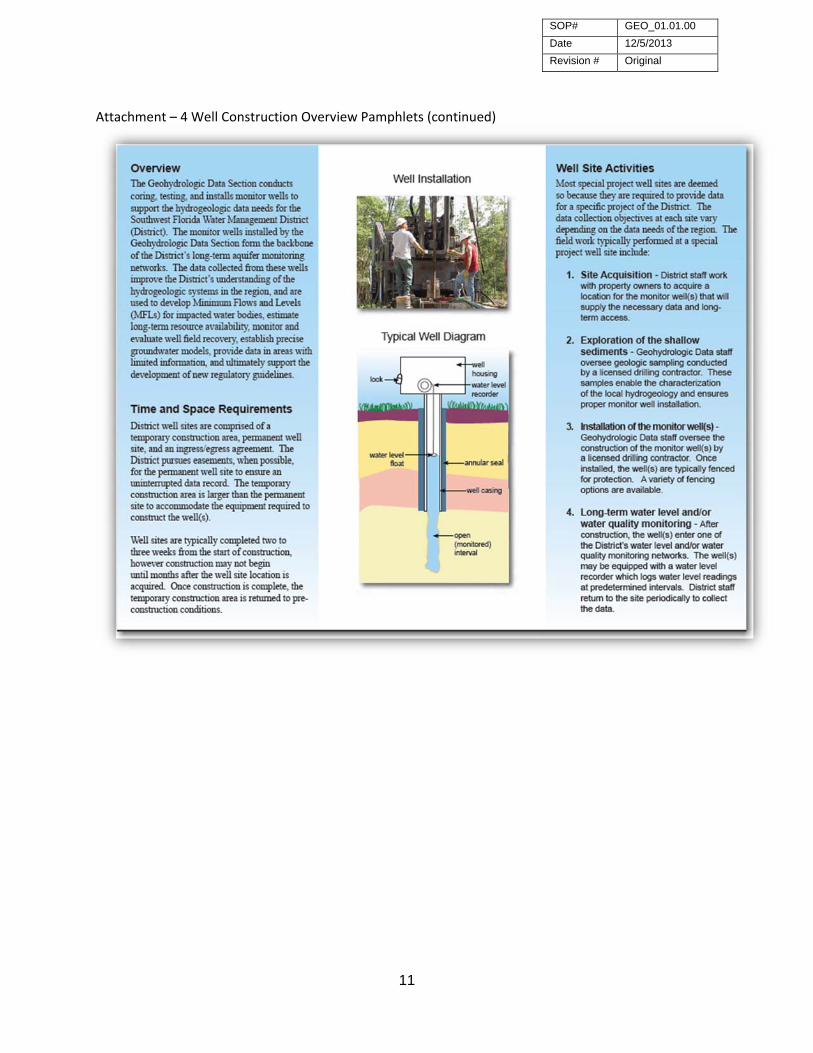
a. Plan a visit to each site: 1. Complete the Proposed Well Site Evaluation Site Form (Attachment ‐3) 2. Give GEO Section Well Construction Overview pamphlet to land owner
or site representatives (Attachment ‐4)
ATTACHMENTS1. Site Acquisition Guidelines 2. Site Acquisition Memorandum 3. Proposed Well Site Evaluation Form 4. Well Construction Overview Pamphlet
SOP# GEO_01.01.00
Date 12/5/2013
Revision # Original
4
ATTACHMENT–1SiteAcquisitionGuidelines

SOP# GEO_01.01.00
Date 12/5/2013
Revision # Original
5
Attachment – 1 Site Acquisition Guidelines (continued)

SOP# GEO_01.01.00
Date 12/5/2013
Revision # Original
6
ATTACHMENT–2SiteAcquisitionMemorandum
SOP# GEO_01.01.00
Date 12/5/2013
Revision # Original
7
Attachment – 2 Site Acquisition Memorandum (continued)
SOP# GEO_01.01.00
Date 12/5/2013
Revision # Original
8
ATTACHMENT–3ProposedWellSiteEvaluationForm

SOP# GEO_01.01.00
Date 12/5/2013
Revision # Original
9
Attachment – 3 Proposed Well Site Evaluation Form (continued)

SOP# GEO_01.01.00
Date 12/5/2013
Revision # Original
10
ATTACHMENT–4WellConstructionOverviewPamphlets
SOP# GEO_01.01.00
Date 12/5/2013
Revision # Original
11
Attachment – 4 Well Construction Overview Pamphlets (continued)

SOP# GEO_01.02.00
Date 12/5/2013
Revision # Original
12
WellSitePreparation
PURPOSEEstablishment of a uniform procedure for well site preparation.
PROCEDURE1. Visit site to determine site specific requirements 2. Determine:
a. Site access – are there ditches present that will require the installation of culverts to access site? ‐ utilize District engineering staff if possible for culvert designs
b. Mowing or tree removal – utilize Operations section or hire contractor c. Shell requirements – if needed coordinate with Operations section to deliver
and install d. Water supply source – is a fire hydrant or other potable source available or will
a water supply well need to be drilled? e. Silt fence – determine if necessary f. Fencing – does construction area need to be fenced?
3. Prepare Health and Safety Plan
a. Note site conditions for staff safety considerations b. Note location of nearest hospital c. Distribute plan to all staff working on site

SOP# GEO_02.01.00
Date 12/9/2013
Revision # Original
13
Wire‐LineCoring
PURPOSEEstablishment of a uniform procedure for wire‐line core drilling.
EQUIPMENT1. Core drilling rig (equipped with positive displacement, variable speed pump) 2. Air compressor 3. Wire‐line coring system (outer barrel, inner barrel, core bit, core retrieval system) 4. Core drilling rods (NQ, NRQ) 5. Weir discharge tank 6. Core barrel bench
PROCEDURE1. Core Drilling:
a. Ensure inner barrels are adjusted properly. 3/8”‐1/4” minimum from end of shoe to taper on bit
b. Clamp core rods, unscrew core rods c. Insert inner barrel into core rods d. Add one core rod, screw rods together, torque to specifications e. Suspend core rods off bottom and pump on high level until inner barrel has
been locked into outer barrel (Usually indicated by feeling it hit when the barrel becomes locked in and an increase on the pump pressure gauge, use stopwatch to know when it should be there)
f. Core the length of one core run if possible. At the end of the run keep water pump on to allow the drill cuttings to move up the hole. Pump pressures of 50‐100psi are normal
g. Stop rotation. Pull rods up with rotary head to break the core off formation. Pump 30 to 40 gallons of H20 minimum
h. Pull up core rods, unscrew core rods and retrieve inner core barrel 2. Removal of Inner Barrel:
a. Lower overshot retrieval tool inside the core rods until it connects to the inner barrel, run water down the core rods as the overshot tool is being lowered (water keeps drill cuttings from settling in the borehole)
b. Begin retrieving inner barrel c. Place inner barrel release tool around the wire‐line while retrieving d. Lower the inner barrel and remove from retrieval tool
3. Removal of Core from Inner Barrel: a. Clamp inner barrel in vice b. Unscrew the top and bottom parts of inner barrel using circle wrenches c. Slide rock core out of barrel (tapping on barrel with rubber mallet can help free
core if stuck) d. Flush barrel with water e. Add small amount of grease to threads on both ends of barrel and reassemble
SOP# GEO_02.01.00
Date 12/9/2013
Revision # Original
14
f. Grease the inner tube head assembly bearing 4. Airlifting:
a. The borehole is usually cleared of drill cuttings after coring 20 feet by using the airlifting method of pumping
b. Remove the inner barrel c. Install appropriate length of 0.5‐inch airline equipped with check‐valve into drill
string and connect to air swivel d. Connect core rods e. Discharge cuttings and water into mud pit f. After discharge water is free of cuttings, measure discharge rate using the weir
tank 5. Hole Sweeping:
a. “Sweeping” the borehole is accomplished by lifting the core rods off bottom (tens to hundreds of feet) and then airlifting at various depths while lowering the rods back to bottom
b. The borehole is “swept” to clean cuttings that have lodged in the annulus between the rods and the borehole (increased rotational torque, reduced flow rates, and an increase in the amount of time required to airlift the borehole clean are all indications that cuttings may be lodging in the borehole annulus)
SUGGESTEDREFERENCES1. Shuter, E, Teasdale, W. E., 1989, Application of drilling, coring, and sampling techniques
to test holes and wells: U.S. Geological Survey, Techniques of Water‐Resource Investigation; 02‐F1, 97 p.
SOP# GEO_02.02.00
Date 12/10/2013
Revision # Original
15
LithologicSampleCollection
PURPOSEEstablishment of a uniform procedure for the collection and processing of lithologic samples during drilling.
EQUIPMENT1. Munsell rock and/or soil color chart 2. Carpenters folding ruler 3. Hand lens 4. Dunham (1962) Limestone classification 5. Hydrochloric acid for carbonate testing 6. Hydrogeology Field Log
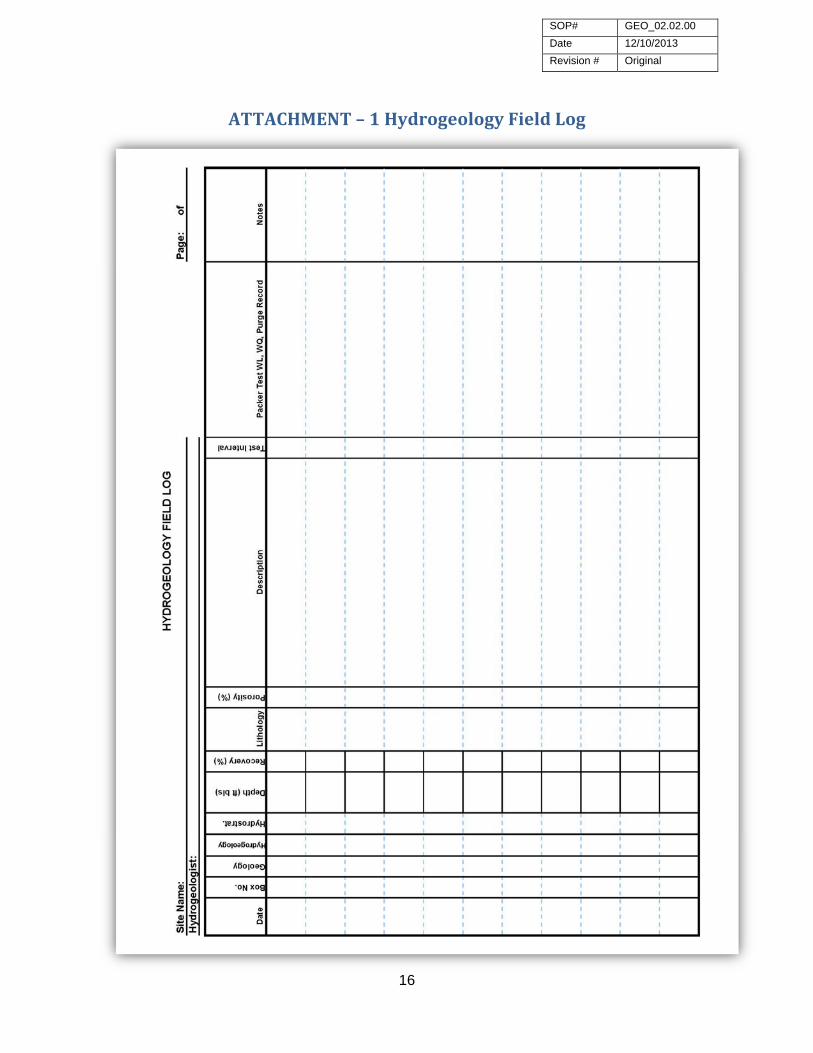
PROCEDURE1. Collect sample from driller (core, split spoon, or rock cuttings) 2. Measure the sample and determine the percentage recovered (core/split‐spoon) 3. Place sample in the appropriate container 4. Record depth interval on container 5. Describe sample and record data on Hydrogeology Field Log
SUGGESTEDREFERENCES1. Duhnam, R. J., 1962. Classification of carbonate rocks according to depositional texture
in Ham, W. E., ed., Classification of carbonate rocks: American Association of Petroleum Geologists Memoir 1, p. 108‐121.
2. Midwest Geosciences, 2001. Field Guide for Soil and Stratigraphic Analysis: Midwest Geosciences Group Press, Chart 2 p.
3. Midwest Geosciences, 2001. Field Guide for Rock Core Logging and Fracture Analysis: Midwest Geosciences Group Press, Chart 2 p.
ATTACHMENTS1. Hydrogeology Field Log
SOP# GEO_02.02.00
Date 12/10/2013
Revision # Original
16
ATTACHMENT–1HydrogeologyFieldLog

SOP# GEO_02.03.00
Date 12/10/2013
Revision # Original
17
SlugTesting
PURPOSETo establish a uniform procedure for performing slug tests while wire‐line core drilling to determine hydraulic conductivity of the tested interval.
EQUIPMENT1. Electronic water level tape 2. Carpenter’s ruler 3. Laptop computer (with PC400 software installed) 4. Campbell CR800 data logger 5. Pressure transducer and/or PVC spacer (with integrated transducer) for test casing 6. Pressure transducer for annulus 7. Pressure transducer for pneumatic valve pressure
PROCEDURE1. Preliminary Set Up:
a. Develop borehole b. Review core to determine optimal location to install packer c. Have drillers install packer at selected depth (if packer is required) d. Collect static water level with packer installed
2. Reading in Air: a. Connect pressure transducers to the data logger (be careful not to twist base of
caps on cables) b. Remove vent tube caps and turn reel so vent tube points down c. Connect laptop to CR800 data logger d. Launch PC400 program
1. Select the “Setup/Connect” tab at top of screen. a. Click on the “connect” button (when the data logger is
connected to the computer there will be a green bar at the bottom right of the screen that will show the connection time)
b. Click on the “select and send program…” button and choose the program “SLUG_TEST_FINAL_9” from the appropriate folder
c. Program will display “Data from this data logger will be lost. Are you sure you wish to proceed?” Press “yes”.
d. Synchronize the data logger time with the computer time by selecting the “set clock” button
2. Select the “Monitor Values” tab at the top of the screen. a. Record the readings in air in the Set‐up Information section of
the SLUG TEST – DATA ACQUISITION SHEET 1. “Submerge Test Int” = Transducer #1 (test casing) 2. “Submerge P Head” = Transducer #2 (gauge) 3. “Submerge Annulus” = Transducer #3 (annulus)

SOP# GEO_02.03.00
Date 12/10/2013
Revision # Original
18
3. Unhook and re‐cap the cables so that they can be measured and
brought over to the rig
3. Water Levels: a. Use the water level tape and carpenter’s ruler to measure the casing stickup
and water level in both the NQ and HQ (Remember to unscrew the cap that holds the pressure fittings onto the NQ so that the WL measurements are from the top of the NQ, not the cap (which can change.
b. Record this information in the General Information section of the SLUG TEST – DATA ACQUISITION SHEET
1. NQ stickup measurement = Test Casing Height (ft als) 2. NQ water level measurement = Initial Static WL (ft btoc) 3. Record the HW stickup and water level somewhere on the sheet for
your own knowledge
4. Determine Depth to put Spacer and Annulus Transducer: a. Use water level measurements from Step 3 to determine the appropriate depth
of spacer: 1. The static water level should be near the top of the yellow tape on the
spacer (which is exactly three feet above the ports on the pressure transducer). This will allow three feet of water above the pressure transducer at the end of the spacer
2. Using measuring tape, mark the depth of the spacer with yellow tape on the transducer cable
3. Choose a depth for the annulus transducer a. The depth should be at least as large as the largest slug b. Mark this depth on the cable with yellow tape c. Be sure to measure up from the holes at the nose of transducer

SOP# GEO_02.03.00
Date 12/10/2013
Revision # Original
19
5. Connect Transducers: a. Drillers lower the spacer and annulus into the borehole b. Connect surface pressure transducer to gauge on top of NQ rods c. Re‐connect all transducers to the data logger d. Plug electric valve cord into electric outlet in the CR800 box e. Select “Monitor Values” tab at the top of the PC400 screen and confirm
transducer readings are correct f. Once drillers have set transducers, select “Monitor” from the menu at top of
screen, select “Ports and Flags” 1. Click on circle next to the flag labeled “Bernie” to open the valve so
water levels can equilibrate before first test a. When valve is open, both the circle next to the “Bernie” flag and
the circle next to the “PortStatus(2)” port should be green g. Once the water levels have equilibrated, close the valve by selecting the circle
next to the “Bernie” flag again (Note: if water levels do not equilibrate, packer may be leaking)
1. All ports and flags should be black
SOP# GEO_02.03.00
Date 12/10/2013
Revision # Original
20
6. Running a Test:
a. Ask driller to add pressure to the system, and wait until the water levels equilibrate again
1. Test A will be 2 feet of pressure 2. Test B will be 1 foot of pressure 3. Test C will be 0.5 feet of pressure 4. Test D will be 2 feet of pressure 5. Test E (if needed) will be the smallest slug necessary to produce a good
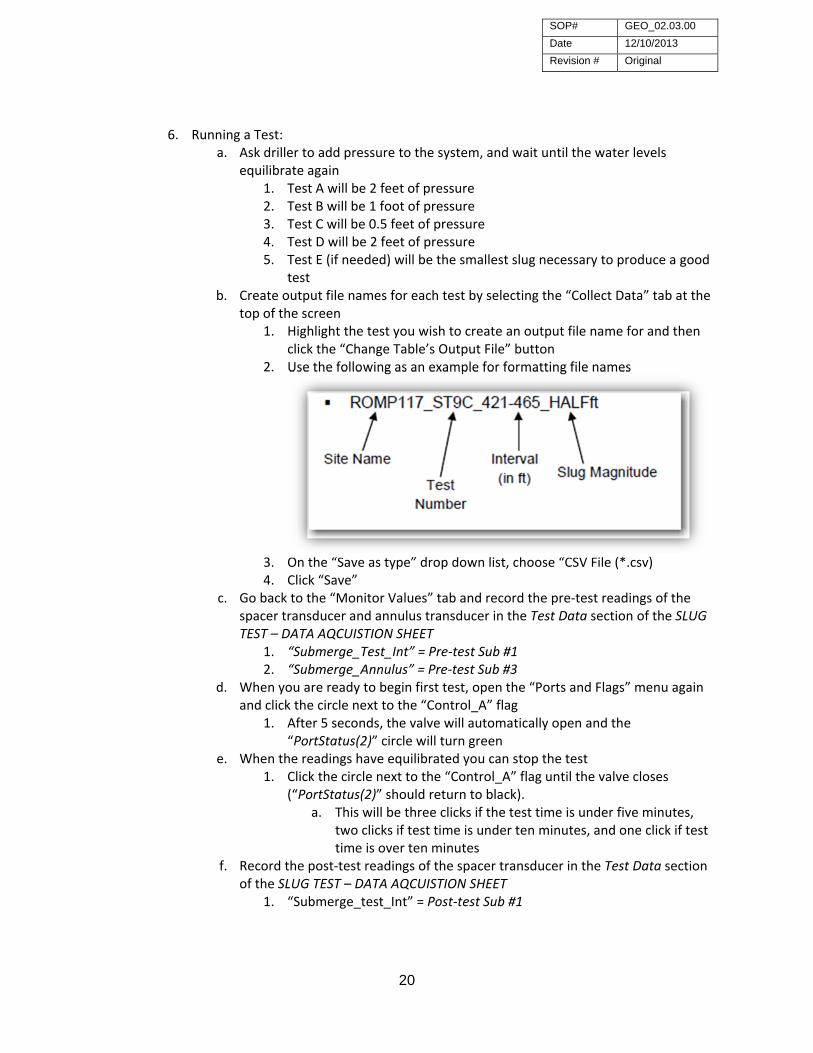
test b. Create output file names for each test by selecting the “Collect Data” tab at the
top of the screen 1. Highlight the test you wish to create an output file name for and then
click the “Change Table’s Output File” button 2. Use the following as an example for formatting file names
3. On the “Save as type” drop down list, choose “CSV File (*.csv) 4. Click “Save”
c. Go back to the “Monitor Values” tab and record the pre‐test readings of the spacer transducer and annulus transducer in the Test Data section of the SLUG TEST – DATA AQCUISTION SHEET
1. “Submerge_Test_Int” = Pre‐test Sub #1 2. “Submerge_Annulus” = Pre‐test Sub #3
d. When you are ready to begin first test, open the “Ports and Flags” menu again and click the circle next to the “Control_A” flag
1. After 5 seconds, the valve will automatically open and the “PortStatus(2)” circle will turn green
e. When the readings have equilibrated you can stop the test 1. Click the circle next to the “Control_A” flag until the valve closes
(“PortStatus(2)” should return to black). a. This will be three clicks if the test time is under five minutes,
two clicks if test time is under ten minutes, and one click if test time is over ten minutes
f. Record the post‐test readings of the spacer transducer in the Test Data section of the SLUG TEST – DATA AQCUISTION SHEET
1. “Submerge_test_Int” = Post‐test Sub #1
SOP# GEO_02.03.00
Date 12/10/2013
Revision # Original
21
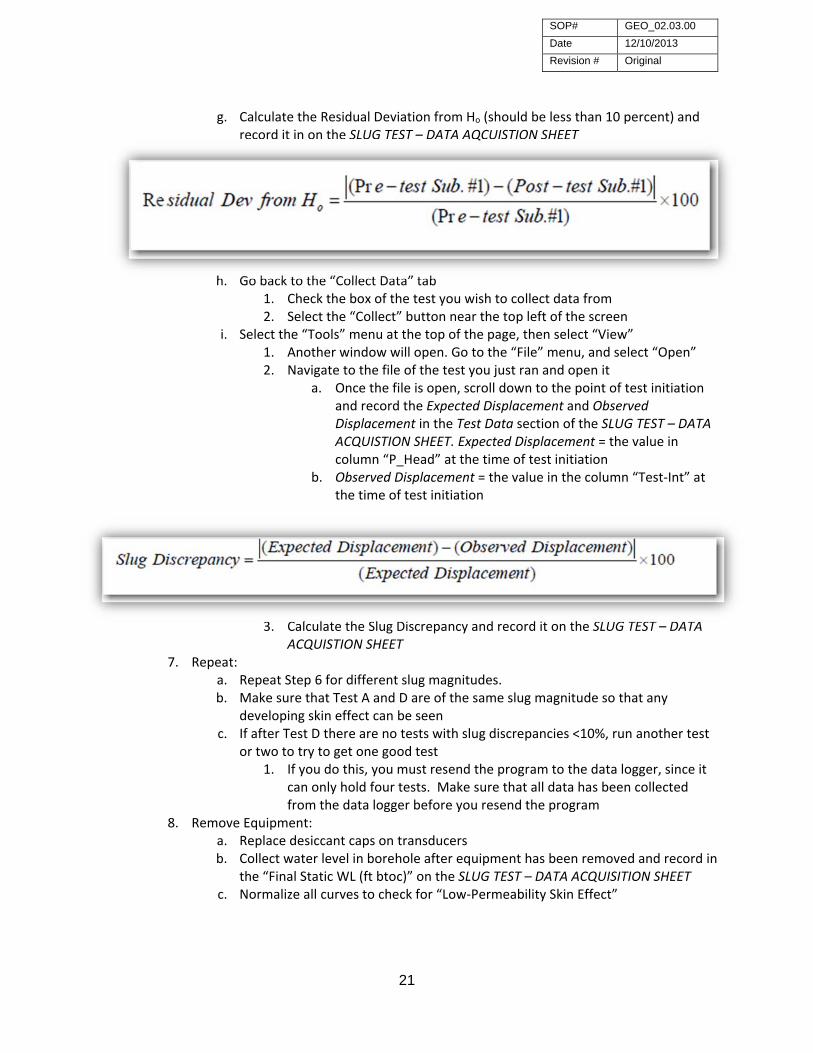
g. Calculate the Residual Deviation from Ho (should be less than 10 percent) and record it in on the SLUG TEST – DATA AQCUISTION SHEET
h. Go back to the “Collect Data” tab 1. Check the box of the test you wish to collect data from 2. Select the “Collect” button near the top left of the screen
i. Select the “Tools” menu at the top of the page, then select “View” 1. Another window will open. Go to the “File” menu, and select “Open” 2. Navigate to the file of the test you just ran and open it
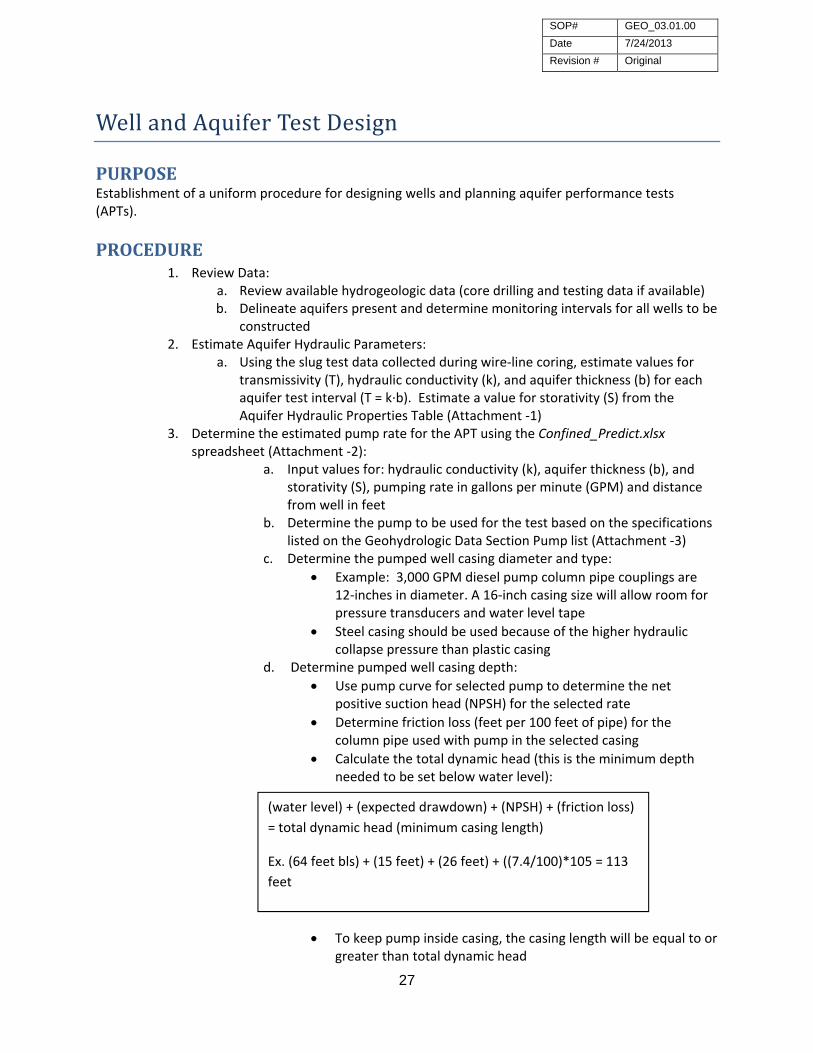
a. Once the file is open, scroll down to the point of test initiation and record the Expected Displacement and Observed Displacement in the Test Data section of the SLUG TEST – DATA ACQUISTION SHEET. Expected Displacement = the value in column “P_Head” at the time of test initiation
b. Observed Displacement = the value in the column “Test‐Int” at the time of test initiation
3. Calculate the Slug Discrepancy and record it on the SLUG TEST – DATA ACQUISTION SHEET
7. Repeat: a. Repeat Step 6 for different slug magnitudes. b. Make sure that Test A and D are of the same slug magnitude so that any
developing skin effect can be seen c. If after Test D there are no tests with slug discrepancies <10%, run another test
or two to try to get one good test 1. If you do this, you must resend the program to the data logger, since it
can only hold four tests. Make sure that all data has been collected from the data logger before you resend the program
8. Remove Equipment: a. Replace desiccant caps on transducers b. Collect water level in borehole after equipment has been removed and record in
the “Final Static WL (ft btoc)” on the SLUG TEST – DATA ACQUISITION SHEET c. Normalize all curves to check for “Low‐Permeability Skin Effect”

SOP# GEO_02.03.00
Date 12/10/2013
Revision # Original
22
SUGGESTEDREFERENCES1. Butler, J.J., Jr., Duffield, G.M., and Kelleher, D.L., 2009. Field Guide for Slug Testing and
Data Analysis: Midwest GeoSciences Group Press, Chart, 2 p. 2. LaRoche, J., and Mallams, J., 2004. Slug Testing Issues and Guidelines for the Design,
Performance and Analyses as they apply to ROMP CME corehole slug testing, Southwest Florida Water Management District, Geohydrologic Data Section, ROMP Instructional Memo Series RIMS 01‐04, 5 p.
ATTACHMENTS1. Slug Test – Data Acquisition Sheet

SOP# GEO_02.03.00
Date 12/10/2013
Revision # Original
23
ATTACHMENT‐1SlugTest–DataAcquisitionSheet

SOP# GEO_02.04.00
Date 12/10/2013
Revision # Original
24
WaterQualitySampling
PURPOSE Establish a uniform procedure for collecting water quality samples.
EQUIPMENT1. Electronic water level tape 2. Peristaltic pump 3. Tripod filter and filter media 4. pH, conductance and temperature meter 5. Photometer 6. De‐ionized (DI) water 7. Rubber gloves 8. 250 milligrams/liter (ml) and 500ml bottles 9. Nitric acid
PROCEDURE1. Choose Appropriate Method to Collect Sample:
a. Wire line bailer, nested bailer, or surface discharge 2. Purge:
a. Calculate the volume of the well or sample interval b. Pump the well and calculate discharge in gallons per minute (gpm) c. Calculate the time needed to purge three well or sample volumes [Note purge
start and stop times on Water Quality Acquisition form (Attachment D‐1)] d. Measure field parameters after each 0.5 volumes have been purged from the
well (Divide total time to purge three well volumes by 6). e. Record field parameters (elapsed time, specific conductance, temperature, and
pH) on the Water Quality Acquisition form.
3. Label Bottles/Prepare Tripod Filter: a. Complete labels for sample bottles (fill in
conductivity and time when sample is collected) b. Rinse tripod filter parts with DI water c. Place new filter media in tripod filter holder
4. Collect the Sample: a. Put on rubber gloves b. Rinse the sample collection container with
sample water c. Collect the sample
5. Meter Measurements: a. Rinse probe with portion of the sample before
submerging b. Record Specific Conductance, Temperature, and
pH on the Water Quality Acquisition form c. Record the time and Specific Conductance on
sample labels

SOP# GEO_02.04.00
Date 12/10/2013
Revision # Original
25
6. Fill Sample Bottles: a. Attach plastic tubing to peristaltic pump b. Purge tubing with sample water c. Fill the unfiltered 500ml bottle with sample water d. Attach tubing to top of tripod filter e. Purge filter by opening and closing air release valve f. Fill the filtered 250ml and 500ml bottles g. Acidify the 250ml bottle with nitric acid (HNO3) using one glass “snap‐off”
ampoule h. Check acidification by pouring small amount of the sample directly over a strip
of pH litmus paper. The pH strip should NEVER be dipped into the sample bottle, this may contaminate the sample. Compare the results of the litmus paper to the pH range shown on the litmus paper container. The pH must be less than 2.0. Adding more HNO3 should not be necessary
i. Put sample bottles in iced cooler 7. Clean‐up:
a. Rinse the photometer tubes and mixing sticks with DI water and set on paper towel to dry
b. Pump DI water through the peristaltic pump until tubing is purged c. Disassemble tripod, dispose of old filter and rinse all parts with DI water; allow
parts to air dry d. Rinse all sampling containers with DI water and allow to air dry e. Rinse meter probe with DI water, pour small amount of pH 4 buffer solution into
calibration cup and then screw cup tightly onto probe
SUGGESTEDREFERENCES1. Water Quality Monitoring Program, 2013. Standard Operating Procedures for the
Collection of Water Quality & Biological Samples, Revision 9.0: Southwest Florida Water Management District, 135 p.
ATTACHMENTS1. Water Quality Acquisition Form

SOP# GEO_02.04.00
Date 12/10/2013
Revision # Original
26
ATTACHMENT–1WaterQualityAcquisitionForm
SOP# GEO_03.01.00
Date 7/24/2013
Revision # Original
27
WellandAquiferTestDesign
PURPOSE Establishment of a uniform procedure for designing wells and planning aquifer performance tests (APTs).
PROCEDURE1. Review Data:
a. Review available hydrogeologic data (core drilling and testing data if available) b. Delineate aquifers present and determine monitoring intervals for all wells to be
constructed 2. Estimate Aquifer Hydraulic Parameters:
a. Using the slug test data collected during wire‐line coring, estimate values for transmissivity (T), hydraulic conductivity (k), and aquifer thickness (b) for each aquifer test interval (T = k∙b). Estimate a value for storativity (S) from the Aquifer Hydraulic Properties Table (Attachment ‐1)
3. Determine the estimated pump rate for the APT using the Confined_Predict.xlsx spreadsheet (Attachment ‐2):
a. Input values for: hydraulic conductivity (k), aquifer thickness (b), and storativity (S), pumping rate in gallons per minute (GPM) and distance from well in feet
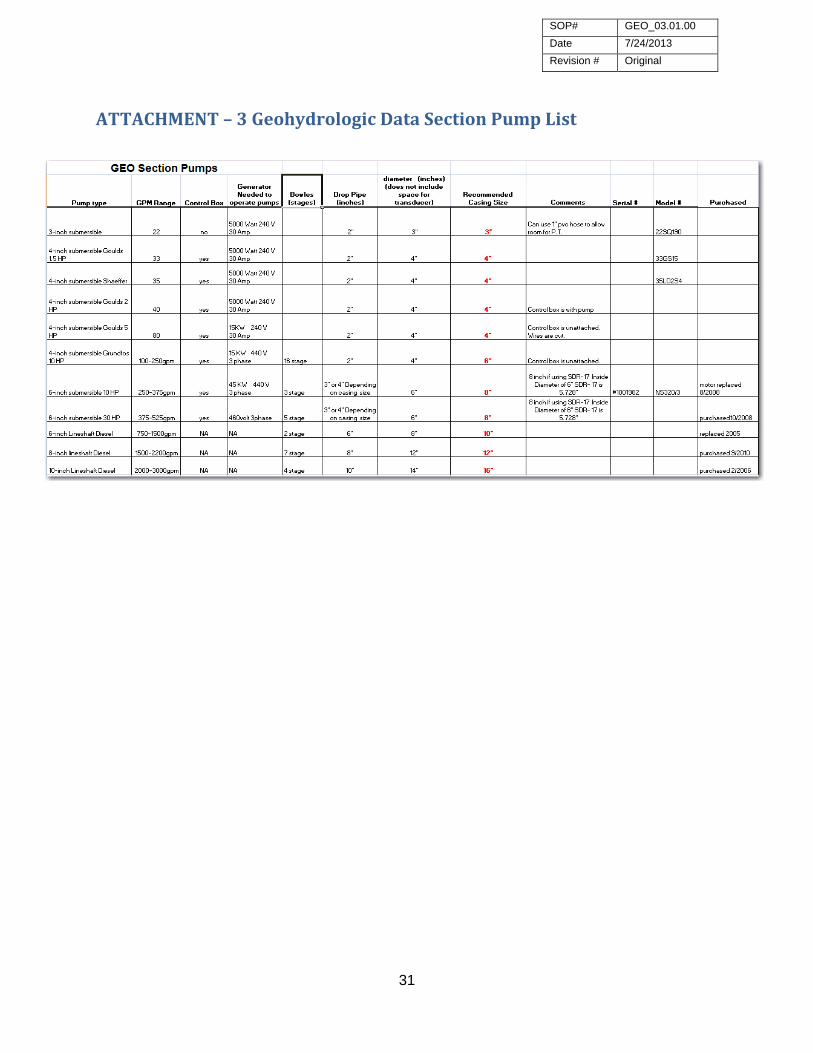
b. Determine the pump to be used for the test based on the specifications listed on the Geohydrologic Data Section Pump list (Attachment ‐3)
c. Determine the pumped well casing diameter and type:
Example: 3,000 GPM diesel pump column pipe couplings are 12‐inches in diameter. A 16‐inch casing size will allow room for pressure transducers and water level tape
Steel casing should be used because of the higher hydraulic collapse pressure than plastic casing
d. Determine pumped well casing depth:
Use pump curve for selected pump to determine the net positive suction head (NPSH) for the selected rate
Determine friction loss (feet per 100 feet of pipe) for the column pipe used with pump in the selected casing
Calculate the total dynamic head (this is the minimum depth needed to be set below water level):
To keep pump inside casing, the casing length will be equal to or greater than total dynamic head
(water level) + (expected drawdown) + (NPSH) + (friction loss)
= total dynamic head (minimum casing length)
Ex. (64 feet bls) + (15 feet) + (26 feet) + ((7.4/100)*105 = 113
feet

SOP# GEO_03.01.00
Date 7/24/2013
Revision # Original
28
e. Determine observation well distances:
Use the forward project feature in AQTESOLV to determine the expected drawdown and distances in the proposed observation wells
f. Design permanent wells:
Permanent wells are usually designed with 6‐inch diameter poly vinyl‐chloride (PVC) casing
SUGGESTEDREFERENCES1. Osborne, P. S., 1993. Suggested Operating Procedures for Aquifer Pumping Tests. U.S.
EPA, Office of Research and Development, EPA 540/S‐93/503.
ATTACHMENTS1. District Aquifer Hydraulic Properties 2. Confined Predict Spreadsheet 3. Geohydrologic Data Section Pumps

SOP# GEO_03.01.00
Date 7/24/2013
Revision # Original
29
ATTACHMENT–1DistrictAquiferHydraulicProperties

SOP# GEO_03.01.00
Date 7/24/2013
Revision # Original
30
ATTACHMENT–2ConfinedPredictSpreadsheet
SOP# GEO_03.01.00
Date 7/24/2013
Revision # Original
31
ATTACHMENT–3GeohydrologicDataSectionPumpList
SOP# GEO_03.02.00
Date 7/24/2013
Revision # Original
32
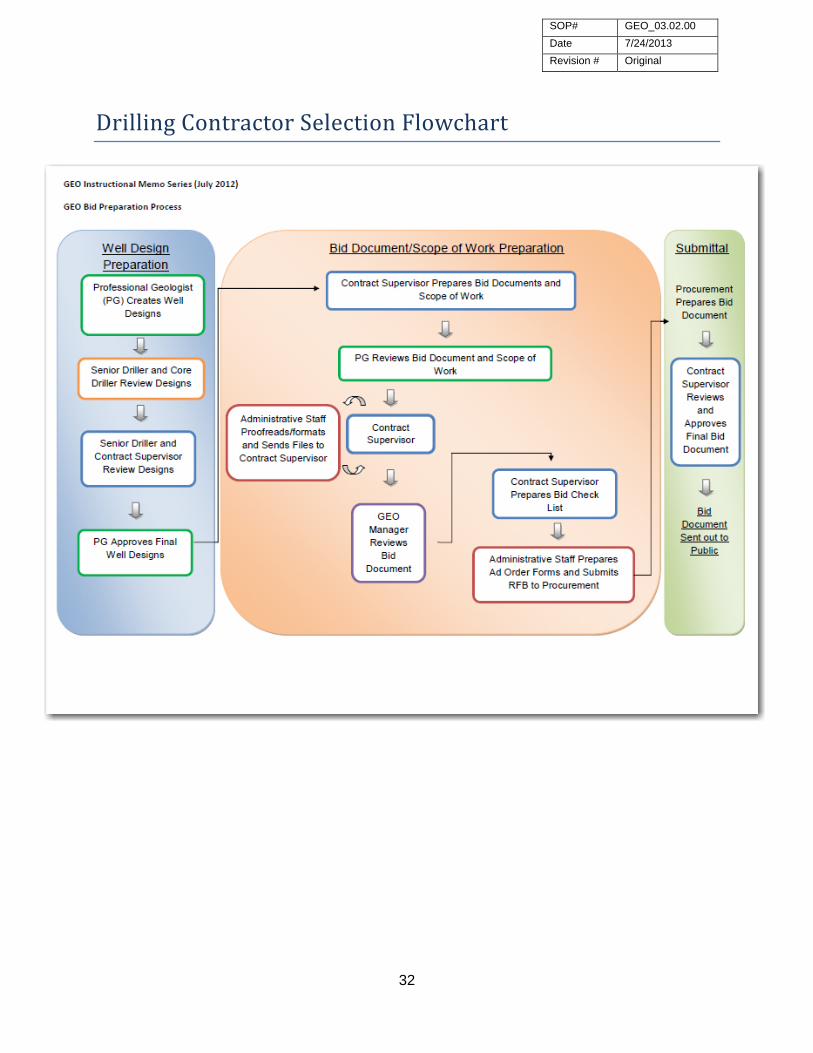
DrillingContractorSelectionFlowchart

SOP# GEO_03.03.00
Date 12/16/2013
Revision # Original
33
GeneralWellConstruction
PURPOSE Establishment of a uniform procedure for monitor well construction.
PROCEDURE1. Monitor well construction designs are prepared by the project geologist. Example well
diagrams can be found at: L:\GEO Section\ROMP\ROMP information\Misc\figures\Power Point Figures.
2. The monitor well designs are reviewed by a professional geologist and a senior driller. If monitor well designs are based on data collected during the core drilling phase, the monitor well designs should also be reviewed by the project core driller.
3. Any changes to well designs during construction should be approved by a professional geologist and a senior driller.
4. Well casing installations should be designed to terminate above known permeable zones when possible to prevent lost circulation when using the mud‐rotary drilling method.
5. The deepest monitor well proposed at the site should be constructed first. This will help prevent drilling mud and grout from migrating through permeable zones into the monitored zones of shallower wells adjacent to the deeper well.
6. The final casing of permanent monitor wells is usually constructed of 6‐inch diameter plastic casing. Different casing sizes and materials may be used in special cases.
SUGGESTEDREFERENCES1. Chapter 40D‐3, F.A.C. 2. Florida Department of Environmental Protection, 2008, Monitoring Well Design and
Construction Guidance Manual, Florida Department of Environmental Protection, 73 p. 3. Lapham, W.W., Wilde, F.D., Koterba, M.T., 1997, Guidelines and Standard Procedures
for Studies of Ground‐Water Quality: Selection and Installation of Wells, and Supporting Documentation, U.S. Geological Survey, Water Resources Investigations Report 96‐4233, 110 p.
4. United States Environmental Protection Agency, 2008, Design and Installation of Monitoring Wells: US. Environmental Protection Agency, 33 p.
SOP# GEO_03.04.00
Date 12/17/2013
Revision # Original
34
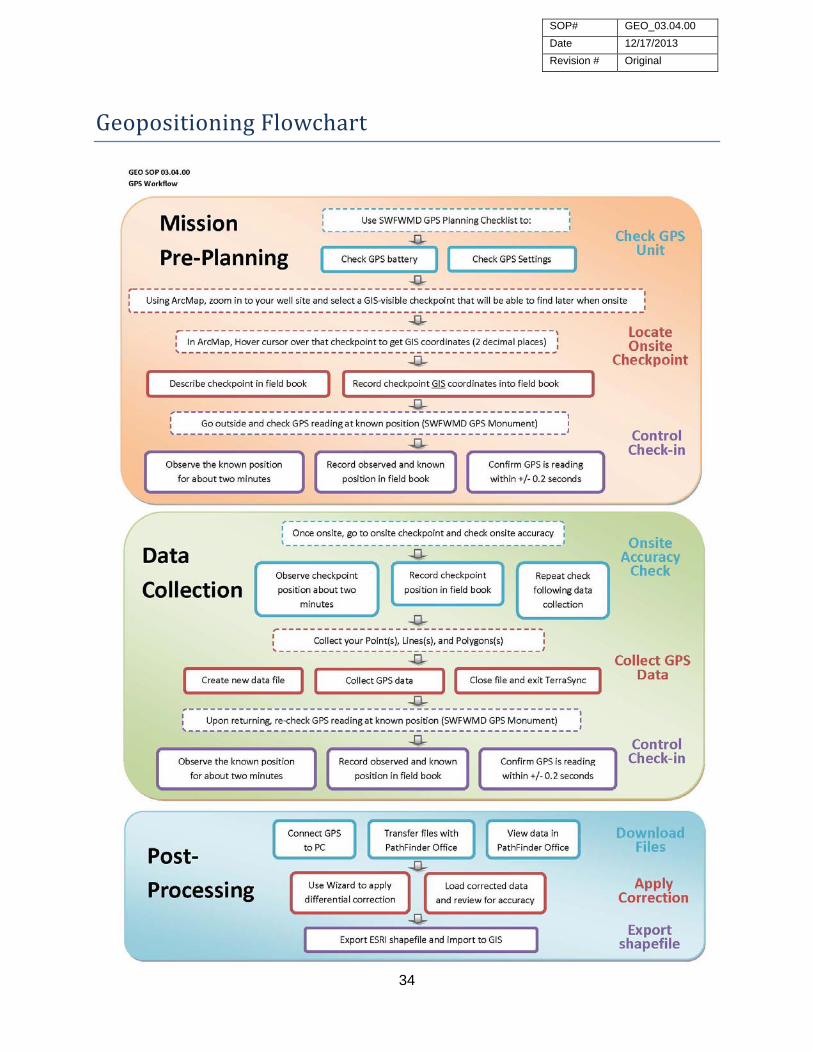
GeopositioningFlowchart

SOP# GEO_03.05.00
Date 12/16/2013
Revision # Original
35
StaffOversightDuringWellConstruction
PURPOSEEstablishment of a standard procedure that stipulates District staff responsibilities when supervising drilling companies contracted by the District to construct wells for District projects.
PROCEDURE 1. Site foreman duties prior to Contractor mobilizing to site:
a. Review all well designs and Scope of Work for project b. Coordinate the ordering and delivery of materials to the site c. Establish contact and exchange contact information with the driller for the
contracted drilling company d. Ensure all well construction permits have been obtained prior to drilling start
date e. Establish drilling start date for the project
2. Site foreman needs to be on‐site to verify the following activities: a. Contractor mobilization to the site. Instruct contractor on where the well is to
be constructed on site. b. Ensure that all proposed well locations are within the temporary and
permanent well easements c. Verify that contractor rig and equipment are satisfactory to perform work. d. Collect and review contractor’s daily logs. Foreman will place the well
construction permit (WCP) number on District’s daily log for each well being constructed
e. Casing installations – verify the casing depth matches the proposed well design submitted by the site hydrologist; witness all casing installations including casing connections.
f. Grouting – check contractors grout volume calculations (but do not perform this task for them), verify grout composition, and witness all grouting operations
g. Well development – witness well development methods and ensure water from well is clear and free of sand.
h. Well logging – review caliper logs on site to verify the open‐hole interval is as specified and verify final casing depth and integrity.
i. Well head completions – verify all well heads are completed as specified. j. Review contractor invoices for comparison to daily logs k. Contractor demobilization – verify contractor removes all equipment and
materials and ensure well site is clean and secure within one week of completion.
3. Site foreman to complete End of Site checklist and provide to Supervisor.
SUGGESTEDREFERENCES1. Florida Department of Environmental Protection, 2008, Monitoring Well Design and
Construction Guidance Manual, Florida Department of Environmental Protection, 73 p.

SOP# GEO_03.05.00
Date 12/16/2013
Revision # Original
36
ATTACHMENTS1. Contractor Final Payment Checklist

SOP# GEO_03.05.00
Date 12/16/2013
Revision # Original
37
ATTACHMENT–1ContractorPaymentChecklist
SOP# GEO_03.06.00
Date 12/17/2013
Revision # Original
38
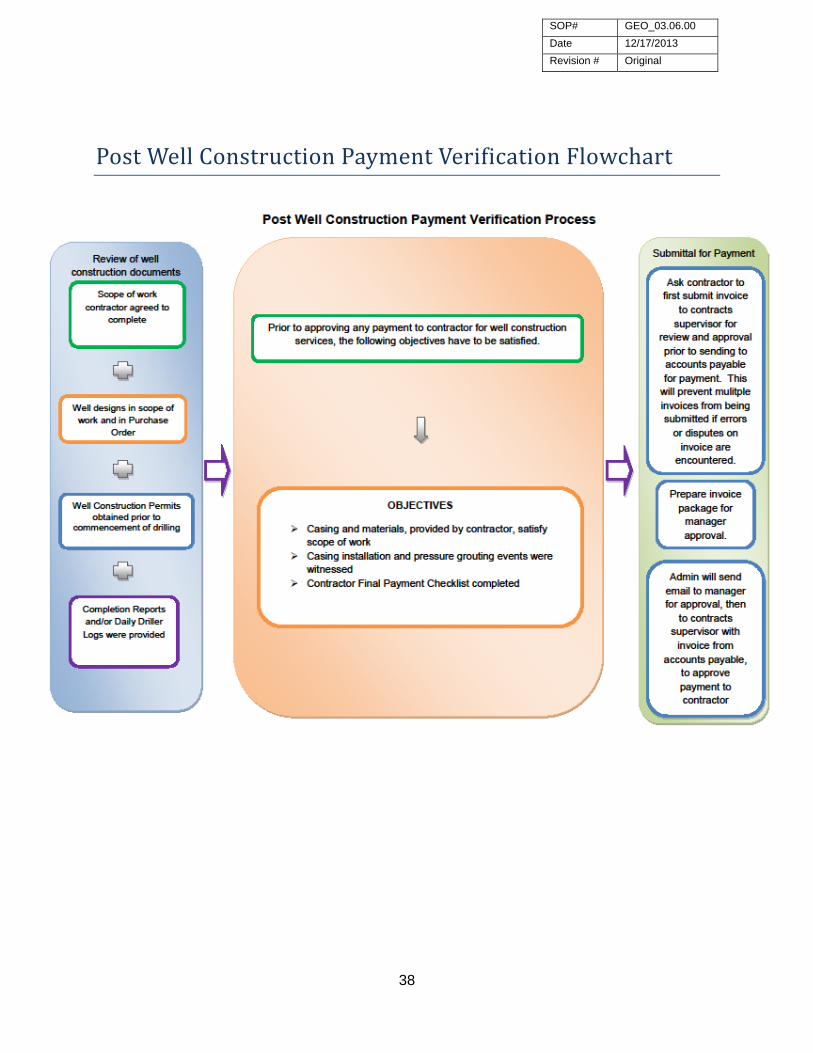
PostWellConstructionPaymentVerificationFlowchart
SOP# GEO_04.01.00
Date 09/24/2013
Revision # Original
39
AquiferPerformanceTest(APT)EquipmentSetUp
PURPOSEEstablishment of a uniform procedure for selection and installation of equipment to perform an aquifer performance test (APT) at a District well site.
EQUIPMENT1. Crane truck and hoist truck 2. 6‐ and 10‐inch diesel powered turbine pump 3. 3‐, 4‐, and 6‐inch electrical submersible pumps from 1 horsepower single phase to 30
horsepower three phase 4. 2‐ and 4‐inch steel drop pipe for submersible pumps. 5. 5 kilo‐watt (kW) and 60 kW generators 6. Approximately 3,200 feet of 10‐inch aluminum discharge pipe with air relief valves and
an assortment of 90 degree connectors and 45 degree connectors 7. 2‐, 4‐, 6‐, and 10‐inch flow meters 8. 4 foot x 8 foot water tank with flange connection to discharge pipe 9. Flow through circular orifice weir with monometer tube 10. Assorted circular orifice plates 11. Erosion control for discharge 12. Road ramp 13. Backhoe 14. Pipe elevators 15. Slip plate
PROCEDUREFORPUMPSELECTION1. A specific capacity test should be conducted in the pumped well to determine the
proper pump and flow meter to be used during the APT. 2. Make pump selection based on well diameter and water level. 3. Select power source: diesel engine or generator (5 kW or 60 kW). 4. Select mechanical equipment needed for pump installation: crane truck, and/or hoist
truck, and/or backhoe. 5. Establish the Net Positive Suction Head (NPSH) to determine proper pump set depth. 6. Select proper circular orifice weir plate based of flow rate.
PROCEDUREFOR6‐AND10‐INCHTURBINEPUMPINSTALLATION1. For installing 6‐ or 10‐inch line‐shaft turbine pump, the crane must be set as close as
possible to well head for maximum lift capacity. 2. Using the proper size elevators for pump selected, begin by lifting pump over well casing
and lower into well as centered as possible, utilizing a slip plate to hold pump column securely to well head.
3. At this point the line shaft (LEFT HAND THREAD) must be installed to the pump before adding the next column pipe. At every connection a spider fitting must be installed into column pipe and over line‐shaft to keep line‐shaft straight throughout entire length of pump column. Continue this method until desired depth is reached.
SOP# GEO_04.01.00
Date 09/24/2013
Revision # Original
40
4. Once pump is set to required depth, the right angle drive and stuffing box must be
installed and secured to pump column. Adjust the position of the impellers inside the bowl assembly for maximum performance. The impellers must be raised slightly to prevent dragging on the bowls. The impellers must be down against the bowl seat when starting impeller adjustments. When pumps are subjected to suction pressure the pressure acting against the shaft tends to raise it. Make sure the shaft is down when starting to adjust the impellers. The impellers for 10‐inch line shaft should be raised 0.25 inches for best operation.
5. A one‐way check valve is installed to discharge head or stuffing box to keep water from back flowing during shut down. The proper size hose is attached to check valve, then to flow meter.
6. Connect the 10‐inch aluminum discharge pipe to discharge side of flow meter. An air‐relief valve should be placed immediately after flow meter. Air‐relief valves should be placed evenly throughout total length of discharge pipe. Connectors (90 degree and 45 degree) can be used to adjust the pipeline route around obstacles. Every connector must have o‐ring and Travis circle locks to complete connection.
7. Once all discharge pipes have been installed, connect the circular orifice weir pipe with monometer tube to the aluminum discharge pipe. There are four leveling jacks mounted to orifice weir pipe that must be level before the test can begin.
8. Start pump for a pre‐APT check. Pump should be run at the proposed discharge rate for the APT. Check pump and piping for leaks and make any necessary adjustments to equipment. Check the discharge point for any erosion control issues that may need addressing before the actual APT begins.
9. At the conclusion of the pre‐APT test, the pump should be disengaged from the diesel engine and the diesel engine throttle should be reduced to idle speed for a minimum of 15 minutes to allow the engine to cool down before turning engine off. This will prevent damage to the engine turbocharger.
PROCEEDUREFORELECTRICALSUBMERSIBLEPUMPINSTALLATION1. The hoist truck can be utilized for installing most submersible pumps. 2. Begin by lowering the selected submersible pump and drop pipe into the well casing.
Casing elevators or a pull plug should be used to lift and lower the drop pipe. 3. Use electrical tape to secure the pump wiring to the drop pipe as the pump is lowered
to the selected depth. 4. Once the pump is lowered to the selected depth, a slip plate is installed at the top of the
well casing to secure the pump and column pipe in place. 5. Connect the pump wiring leads to the pump control box and wire accordingly. These
wires are color coded to avoid confusion. Wires leaving control box must be connected to a power supply, either the 60 kW or 5 kW generator. These wires are not color coded and special attention must be made when connecting these wires to a generator.
6. Connect the appropriate discharge pipe to the top of the column pipe. Connect the appropriate flow meter to the discharge pipe.
7. Connect the discharge pipe to the circular orifice weir pipe and manometer tube. The circular orifice pipe should be installed to flow into the 4 foot x 8 foot water tank.

SOP# GEO_04.01.00
Date 09/24/2013
Revision # Original
41
8. Connect the 10‐inch aluminum discharge pipe to the 4 foot x 8 foot water tank mounted on a flatbed trailer. The water discharged into the tank will then gravity flow through the discharge pipe to the discharge point.

SOP# GEO_04.02.00
Date 10/30/2013
Revision # Original
42
ConductingAnAquiferPerformanceTest
PURPOSEEstablishment of a uniform procedure for conducting aquifer performance tests (APTs).
EQUIPMENT1. APT trailer 2. Electronic water level tape 3. Carpenter’s ruler to measure casing height 4. Survey equipment (transit and rod) 5. Laptop computer with software installed (Win‐Situ, Virtual Hermit, Excel) 6. In‐Situ Rugged Reader (handheld computer) 7. In‐Situ Level Troll 700’s (30 pound per square inch (psi) and 100 psi), Baro‐Troll, Troll Net
Hub (8 ports), In‐Situ extension cables, other ancillary equipment (all stored in large black pelican box)
8. Campbell CR1000 data logger for recording flow meter. 9. Marine batteries to supply power for flow meter. 10. Extension cables (4‐20) to connect flow meter to Campbell CR 1000 data logger. 11. Rain gauge
PROCEDURE1. Prepare for test:
a. Submit work order for the Survey Section to determine the top of casing (TOC) elevation to the North American Vertical Datum of 1988 (NAVD 88) for all on‐site monitor wells.
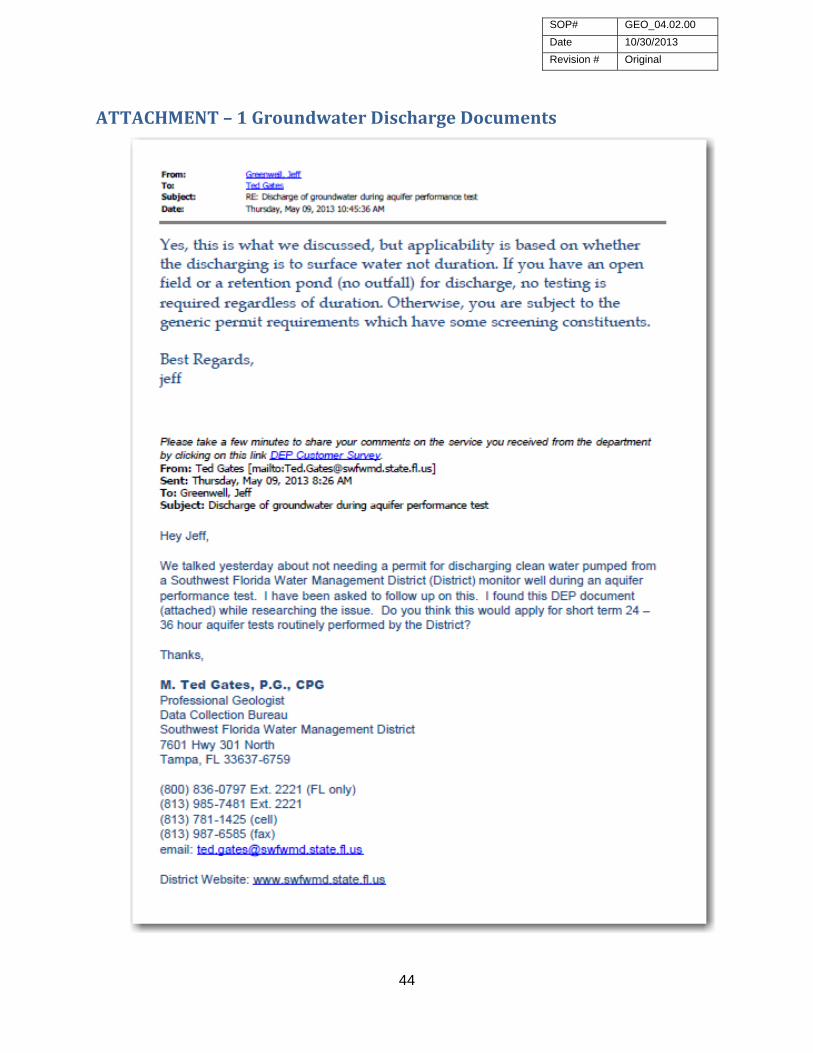
b. Obtain discharge permit [62‐621‐300 (2)] from the Florida Department of Environmental Protection if required (discharge of non‐contaminated water to an open field or retention pond does not require permit [Attachment D‐1]).
c. Request drilling staff to conduct specific capacity test on each pumped well. d. Determine the appropriate pumping rate, duration and estimated drawdown in
the pumped well and in the observation wells. 2. Collect background data:
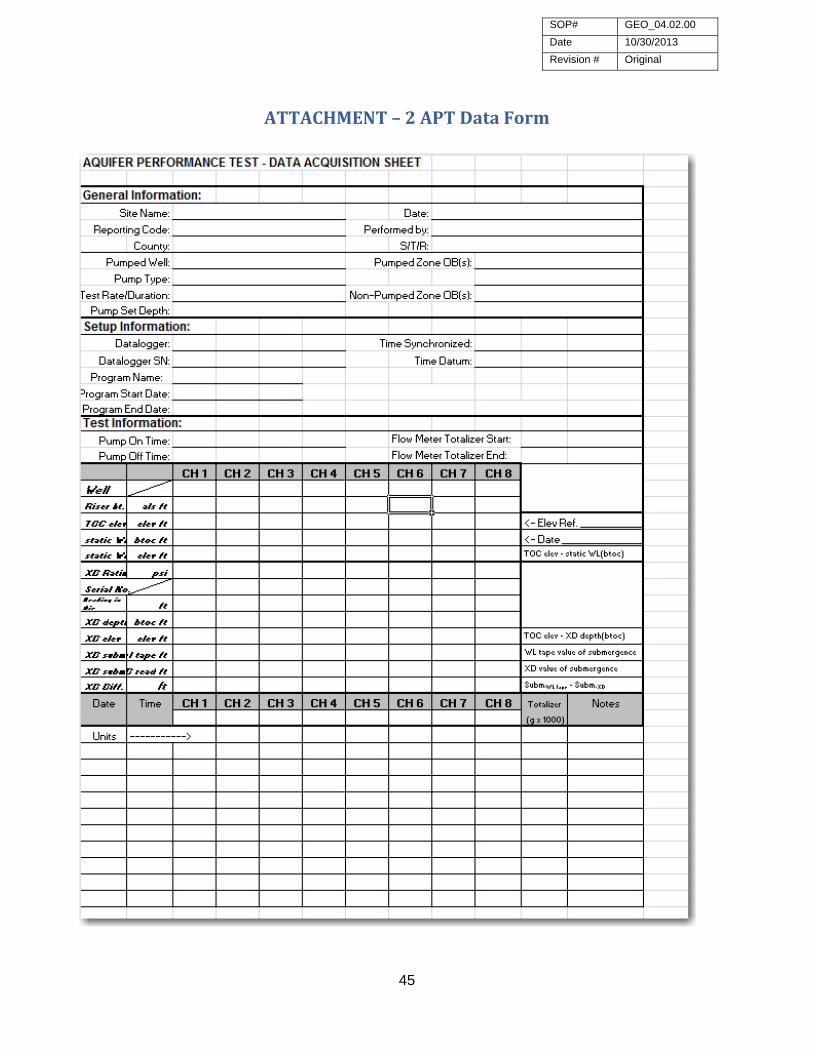
a. Record all measurements on the APT_dataform_revised.xls form (Attachment D‐2).
b. Install rain gauge on‐site. c. Measure static water levels in all wells. d. Determine the appropriate depth to install Level Trolls in the pumped and
observation wells (account for possible water level increase during background phase and drawdown during pumping phase).
e. Install Level Trolls in all wells and connect to laptop computer. f. Determine background data collection (usually 15 minute intervals for minimum
of 1 week before pumping phase). g. Start Virtual Hermit data logger for background data collection. h. Disconnect cables from Level Trolls and install caps on wells. i. Secure equipment in APT trailer for background phase.
SOP# GEO_04.02.00
Date 10/30/2013
Revision # Original
43
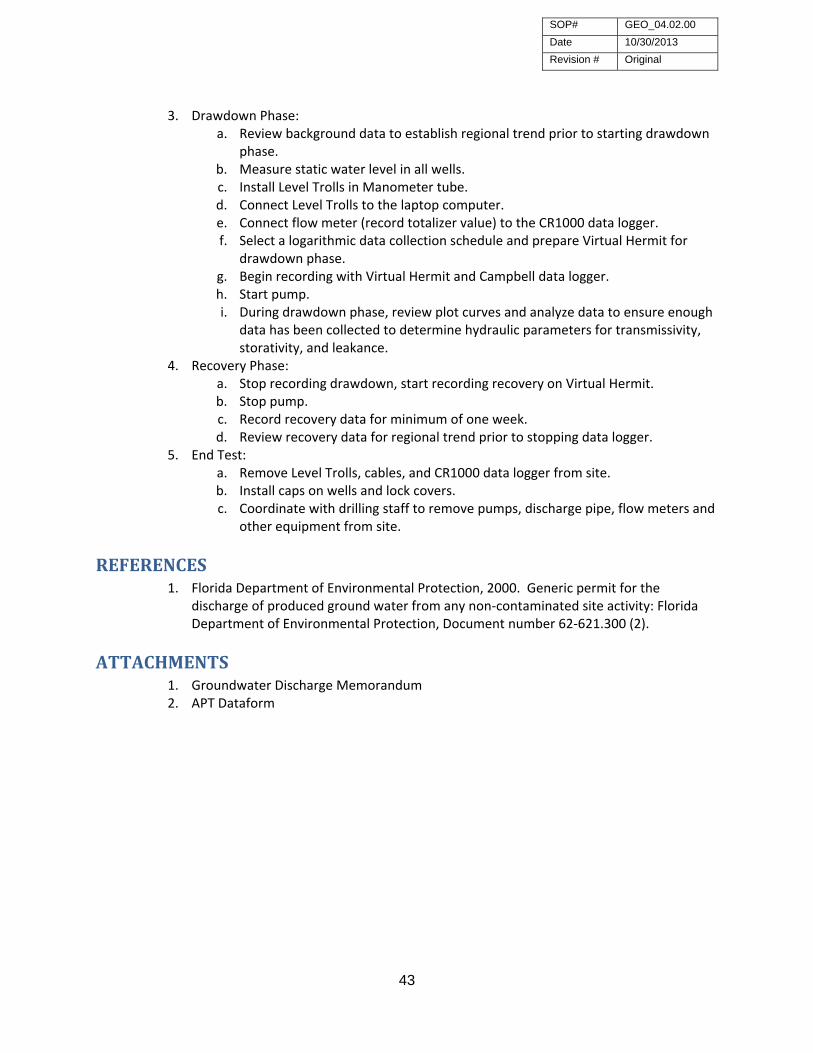
3. Drawdown Phase: a. Review background data to establish regional trend prior to starting drawdown
phase. b. Measure static water level in all wells. c. Install Level Trolls in Manometer tube. d. Connect Level Trolls to the laptop computer. e. Connect flow meter (record totalizer value) to the CR1000 data logger. f. Select a logarithmic data collection schedule and prepare Virtual Hermit for
drawdown phase. g. Begin recording with Virtual Hermit and Campbell data logger. h. Start pump. i. During drawdown phase, review plot curves and analyze data to ensure enough
data has been collected to determine hydraulic parameters for transmissivity, storativity, and leakance.
4. Recovery Phase: a. Stop recording drawdown, start recording recovery on Virtual Hermit. b. Stop pump. c. Record recovery data for minimum of one week. d. Review recovery data for regional trend prior to stopping data logger.
5. End Test: a. Remove Level Trolls, cables, and CR1000 data logger from site. b. Install caps on wells and lock covers. c. Coordinate with drilling staff to remove pumps, discharge pipe, flow meters and
other equipment from site.
REFERENCES1. Florida Department of Environmental Protection, 2000. Generic permit for the
discharge of produced ground water from any non‐contaminated site activity: Florida Department of Environmental Protection, Document number 62‐621.300 (2).
ATTACHMENTS1. Groundwater Discharge Memorandum 2. APT Dataform
SOP# GEO_04.02.00
Date 10/30/2013
Revision # Original
44
ATTACHMENT–1GroundwaterDischargeDocuments
SOP# GEO_04.02.00
Date 10/30/2013
Revision # Original
45
ATTACHMENT–2APTDataForm
SOP# GEO_05.01.00
Date 10/22/2013
Revision # Original
46
SlugTestAnalysis
PURPOSEEstablishment of a uniform procedure for analyzing data from slug tests.
PROCEDURE1. Compile raw data from all slug tests conducted for the selected test interval (see SOP#
GEO 02.03.00 for procedure on conducting slug tests), normalize, graph and format for AQTESOLV input:
a. Data for AQTESOLV should be adjusted time in minutes since t0 (first value will be 0 minutes) versus displacement since t0.
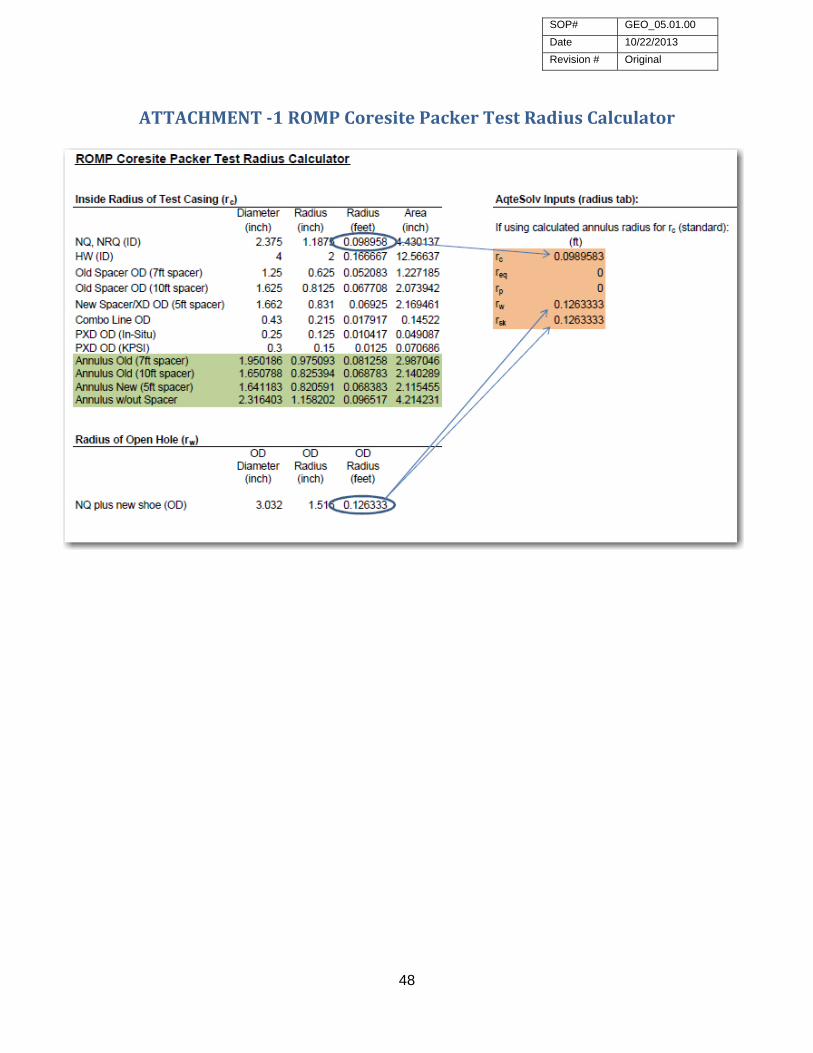
2. Input calculated annulus radius of test casing (rc) and open test interval (rw): a. Fill in all fields in AQTESOLV – Radius Tab using the values as specified in the
attached table (Attachment ‐1) for the calculated annulus radius. b. Specified values apply to typical GEO Section slug tests performed with the
following criteria: 1. NQ drill rods function as the test casing 2. Packer and spacer are used
c. If packer and spacer are not used, the radii will be equivalent to the NQ rods or HW casing inside diameter (see Attachment ‐1)
3. Apply frictional well loss correction (see RIMS 09‐07). 4. Filter data if necessary:
a. This keeps automatic parameter estimation and re‐drawing of type curves during analyses to a reasonable duration
b. Suggested filter for observations is to retain every five observations (on “Observation” tab, click “Filters” button, check “Retain every 5 observations”)
c. If data is filtered, be sure to keep the H0 selected on the “General” tab as the original maximum displacement prior to filtering our observations.
5. Adjust x and y axes. Display as appropriate for length of test and amplitude of displacement.
6. Use Midwest Geosciences Field Guide for Slug Testing and Data Analysis (Attachment ‐2) to help determine the appropriate analysis method.
SUGGESTEDREFERENCES1. Janosik, A., and Clayton, J.M., 2007. Recommended use of the correction for frictional
well losses when using the Butler solution to analyze slug test data in AQTESOLV. Southwest Florida Water Management District, Geohydrologic Data Section, ROMP Instructional Memo Series RIMS 09‐07, 3 p.
2. LaRoche, J.L., 2010. Tips for ROMP slug test analyses in AQTESOLV. Southwest Florida Water Management District, Geohydrologic Data Section, ROMP Instructional Memo Series RIMS 05‐10, 3 p.
3. LaRoche, J.L. R102.5_102.5_ST14_1689‐1907_TEMPLATE.xlsx. File last modified 5 April 2011. Microsoft Excel file.
4. SOP #GEO GEO 02.03.00 “Slug Testing”, current version.

SOP# GEO_05.01.00
Date 10/22/2013
Revision # Original
47
ATTACHMENTS1. Table ‐ ROMP Coresite Packer Test Radius Calculator 2. Midwest Geosciences’ Field Guide for Slug Testing and Data Analysis
SOP# GEO_05.01.00
Date 10/22/2013
Revision # Original
48
ATTACHMENT‐1ROMPCoresitePackerTestRadiusCalculator

SOP# GEO_05.01.00
Date 10/22/2013
Revision # Original
49
ATTACHMENT–2MidwestGeosciences’FieldGuideforSlugTestingand

SOP# GEO_05.01.00
Date 10/22/2013
Revision # Original
50
DataAnalysis
AquiferPerformanceTestAnalysis
PURPOSEEstablishment of a uniform procedure for analyzing data from an aquifer performance test (APT).
PROCEDURE1. Create Hydrograph from Data Logger File:
a. Open APT_ANALYSIS_INSTRUCTIONS_mtg.xlsx file for examples to the following steps
b. Copy raw data from data logger to new EXCEL file to make hydrograph c. Create column of elapsed time (in days) d. Create columns of water level submergence data that adds background +
drawdown + recovery e. Convert water level data to elevation (from top of casing surveyed elevation
data (in feet) f. Create graph of time (in days) versus water level elevation (in feet)
2. Analyze Hydrograph to Determine Regional Trend: a. On new tab in EXCEL file, paste time (in days) and water level elevation (in feet) b. Copy the water level column to new column and remove the drawdown and
recovery data c. Create graph of time (in days) versus water level elevation (in feet) d. Add trend line to the data and plot the equation and R2 data on the chart e. Determine the slope of the line (the value next to the x in the equation) in
feet/day f. Convert the regional trend to feet/minute by dividing by 1440 minutes/day
3. Create Data Set for Input Into AQTESOLV: a. Create column of elapsed time (in minutes) for drawdown and recovery phases
of test b. Create column of drawdown + recovery data for the observation well using the
formula" " c. Create graph that plots time versus uncorrected data and regionally corrected
data – confirm it is correct 4. AQTESOLV Analysis:
a. Paste the regionally corrected drawdown + recovery data into the “Observations” tab for the observation well (in AQTESOLV)
b. Input the rate of discharge (must include an initial rate of 0 and the time pump stopped)
c. Match the drawdown data using appropriate solution d. Match recovery data using the Theis recovery method or other solutions
5. Determine Leakance: a. Calculate the value for leakance using the leakance spreadsheet, input r/B and T
values determined from the drawdown data in AQTESOLV

SOP# GEO_05.02.00
Date 10/23/2013
Revision # Original
51
REFERENCE:APT_analsis_instructions_mtg.xlsx
SOP# GEO_05.03.00
Date 12/16/2013
Revision # Original
52
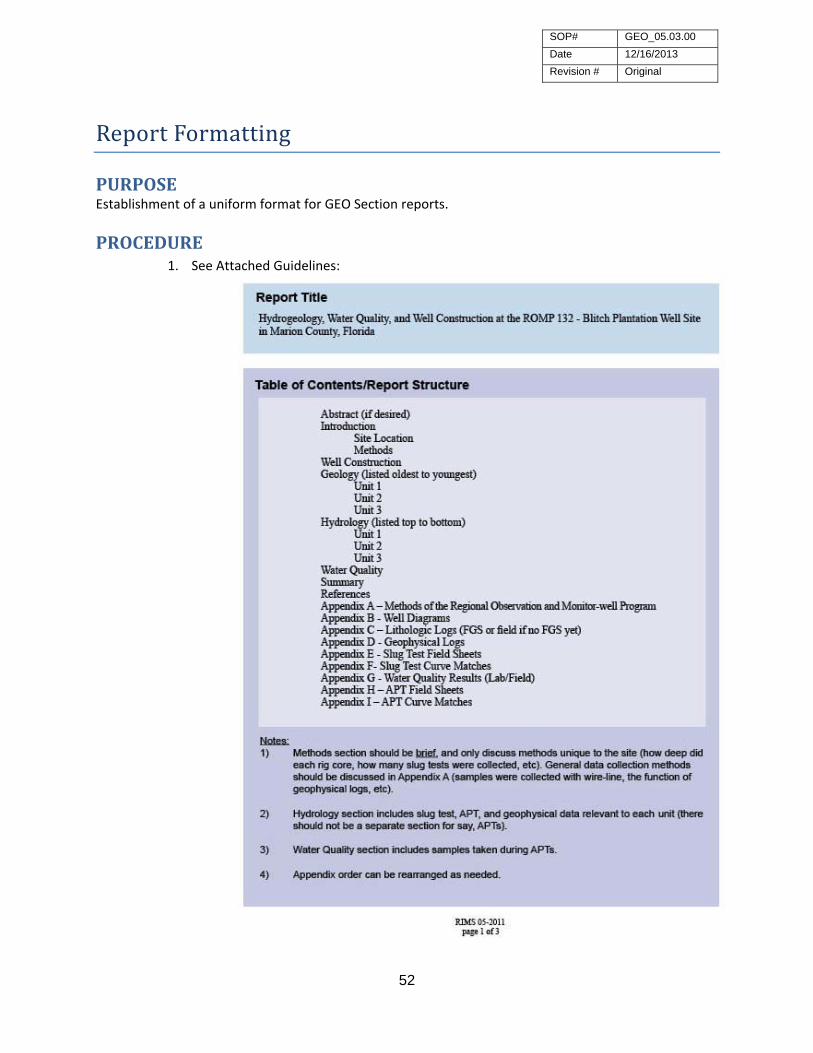
ReportFormatting
PURPOSEEstablishment of a uniform format for GEO Section reports.
PROCEDURE1. See Attached Guidelines:

SOP# GEO_05.03.00
Date 12/16/2013
Revision # Original
53

SOP# GEO_05.03.00
Date 12/16/2013
Revision # Original
54

SOP# GEO_05.04.00
Date 12/17/2013
Revision # Original
55
ReportReviewandPublicationFlowchart
SOP# GEO_06.01.00
Date 10/23/2013
Revision # Original
56
WellSiteRestoration
PURPOSEEstablishment of a uniform procedure for restoring a monitor well site following completion of all construction activities.
EQUIPMENT1. Backhoe 2. Cutting Torches. 3. Crane
PROCEDURE1. After all exploratory coring, well construction, aquifer performance testing, back‐
plugging, and liners have been completed: a. Remove all trash, airlines, and waterlines from site b. Properly abandon all observation wells, cut well casing three feet below land
surface and fill with soil c. Have all rental equipment, dumpsters, and portable toilets removed from site d. Complete an Operations work order and specify the following:
1. Remove all mud from mud pit and fill with clean soil 2. Remove all shell from site and grade soil 3. Remove all silt fencing 4. Remove all temporary fencing from well site 5. Install permanent fencing around permanent well site
e. Submit a request for a new Data Collection Site through the Water Management Information System

SOP# GEO_06.02.00
Date 12/17/2013
Revision # Original
57
DataManagement
PURPOSEEstablish a comprehensive list of required data management tasks and procedures for projects completed by section (tasks may not apply to all project types).
PROCEDURE–ForProjectGeologist1. Water Management Information System(WMIS) Site Identification (SID) Data Collection
Requests – Contact data technician to submit requests for wells for the following: a. Coreholes and Exploratory Boreholes – Must complete SID request prior to
Phase 1 in order to submit laboratory samples b. Baseline Water Quality (WQ) sampling – Submit right after Phase 2 well
construction so Water Quality Monitoring Program (WQMP) can sample without removing equipment
c. Water Level (WL) monitoring – Submit following Phase 3 Aquifer Performance Tests (APTs) (use existing SIDs if applicable)
d. Note: Data technician will need the following to complete SID requests: 1. Trimble‐derived and post‐processed Latitude/Longitude coordinates 2. Well construction details (s‐built diagram is sufficient) 3. All Well Construction Permit (WCP) numbers associated with each well
2. Geohydrologic Data Section (GEO) parameter data – create your own project folders at L:\GEO Section\ROMP\ROMP data, copy your files and/or paste your data into WMIS loading. Include:
a. Geophysical logs 1. Copies of .LOG and .LAS files 2. Paste data from .LAS into .xlsx geophysical template (for WMIS loading)
b. Lithologic log(s) 1. Copies of .DAT and .TXT files from FGS
c. Slug test data 1. Paste your data into .xlsx slug test template (for WMIS loading) 2. APT data ‐ paste your data into .xlsx APT template (for WMIS loading)
3. GEO site data summary – Fill out (use .xlsx template) and submit to data technician. 4. Field data deliverables – Submit form for all laboratory WQ samples to SWFWMD
laboratory OR send returned copies of laboratory Chain of custody (COC) forms for all samples to data technician for submission.
5. Hard Copy Files of Record: a. Organize/label all files using project folder hierarchy (Identify any files already
scanned and/or uploaded to Collaboration) b. Submit files to section administrative assistant for scanning, archiving, and
storage 6. GEO Well Site Completion Checklist – Complete all applicable tasks on form; template
located at L:\GEO Section\ROMP\ROMP information\Technical Information\Tools_Hydros\Forms\E‐Data QC Templates and submit to data technician for QC check.
SOP# GEO_06.02.00
Date 12/17/2013
Revision # Original
58
PROCEDURE–ForGEOE‐DataTechnician1. WMIS SID Data Collection Requests:
a. SIDs created for all wells (temporary and permanent) b. Also create separate SID(s) created for any well construction modifications that
subsequently change the monitored interval of the well c. SID latitude/longitude coordinates are Trimble® Geographic Positioning System
(GPS) derived and post‐processed (DCGPS‐Pathfinder®) d. SID Request Details:
1. Step 1 of 5 (three scenarios). a. If requesting SID for corehole or exploratory borehole:
1. Select ‘Geologic/Lithologic’ for ‘Parameter Type’ 2. Select ‘One‐Time Sampling’ for ‘Frequency’ 3. Select ‘Temporary’ for ‘Duration’ 4. Select ‘Geohydrologic Data Section’ for ‘Who is
Collecting?’ b. WQMP notified of permanent well(s) for baseline WQ sampling
(consider completing this step right after phase 2 well construction to allow WQMP.
1. Select ‘Water Quality’ for ‘Parameter Type’ 2. Select ‘Baseline’ for ‘Frequency’ 3. Select ‘Temporary’ for ‘Duration’ 4. Select ‘Water Quality Section’ for ‘Who is Collecting?’
c. DAT notified to equip permanent well(s) for WL monitoring. 1. Select ‘Water Level’ for ‘Parameter Type’ 2. Select ‘Hourly/Recorder’ for ‘Frequency’ 3. Select ‘Ongoing’ for ‘Duration’ 4. Select ‘Hydrologic Data Section’ for ‘Who is Collecting?’
2. Step 2 of 5 a. Requesting Organization = 6930 Geohydrologic Data b. Project = multiple selections (function pending)
1. Data – Aquifer Exploration & Monitor Well Drilling Program (ROMP) District‐wide Initiative C005
2. Data ‐ Geohydrologic Data Support Z693 3. ROMP ## ______ CA##
3. Step 3 of 5Site Location Review Page (Informational Only). 4. Step 4 of 5
a. Finalized well construction details b. Previous/Subsequent SID(s) and comments as necessary
5. Step 5 of 5 a. ‘Purpose of Site’ – Modify standard language examples provided
in ‘WMIS Site Purpose Examples’ on (L:) drive b. Comments Regarding Site Setup – List all WCPs associated
(temporary work‐around)

SOP# GEO_06.02.00
Date 12/17/2013
Revision # Original
59
2. Create project portfolio with all SIDs and corresponding project numbers (C005, Z693, CA##)
a. Add well site SIDs to appropriate portfolios (portfolio maintenance): 1. GEO ‐ All Constructed Wells 2. GEO – ROMP Inland Grid Wells 3. GEO – ROMP Coastal Transect Wells 4. GEO – Project Support Wells
3. All GEO parameter data uploaded using GEO loaders: 1. Geophysical 2. Lithologic Log 3. Slug Test 4. APT 5. Stratigraphy (based on geologist‐provided site summary)
4. Review GEO End‐of‐Site Checklist from Geologist: a. Verify for completion/accuracy all steps pertaining to electronic data b. If complete, forward copy to manager with statement that it has been QC
checked for all applicable steps and archive copy in QC folder c. If incomplete, return to geologist with list of needs
SOP# GEO_06.03.00
Date 10/23/2013
Revision # Original
60
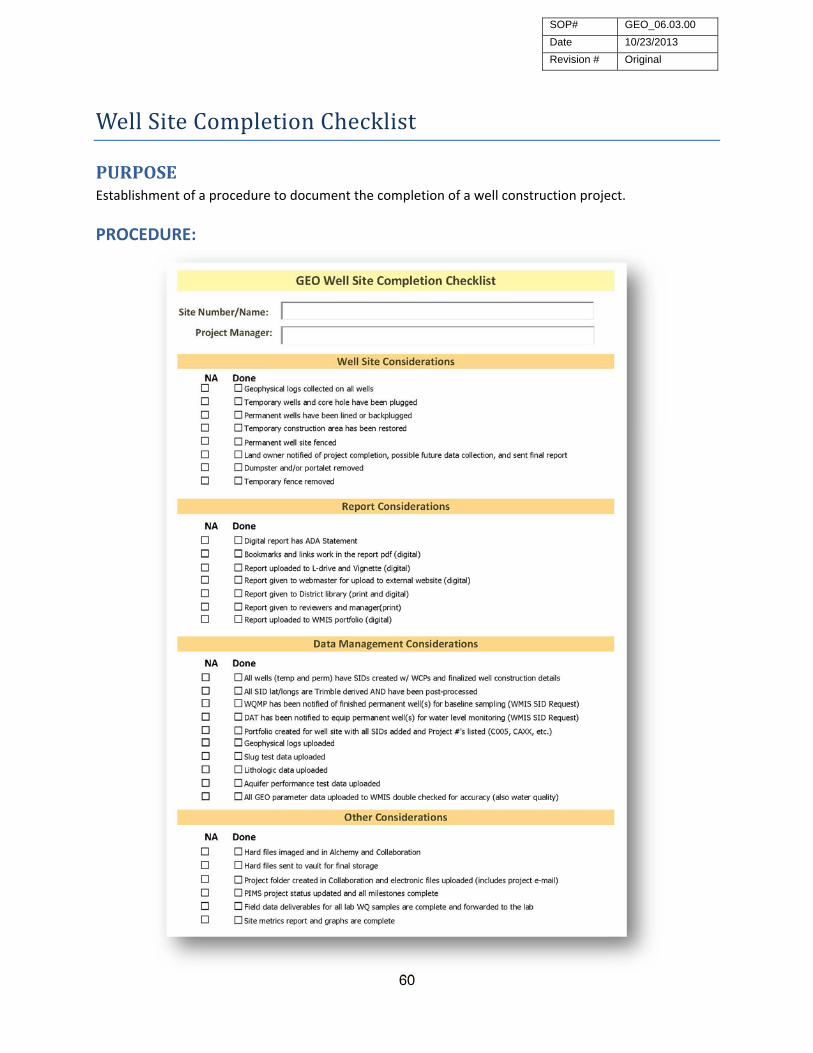
WellSiteCompletionChecklist
PURPOSEEstablishment of a procedure to document the completion of a well construction project.
PROCEDURE:
SOP# GEO_07.01.00
Date 12/16/2013
Revision # Original
61
GeophysicalandVideoWellLogging
PURPOSEEstablishment of a uniform procedure for collecting geophysical and video logs for various projects.
GeohydrologicDataSectionWells
PROCEDURE1. Receive request from site hydrologist to perform geophysical logging at site. Collect the
following information: a. Date that the logging needs to be completed b. Time the wells need to be logged c. Site Identification Number (SID) and name for the well to be logged d. Depths or intervals required for logging e. Which logging tools to be run? f. Will assistance be available from site hydrologist or drilling staff while logging?
2. After arriving on‐site: a. Inspect the site for possible hazards (i.e., mud pits, electric lines, vehicles or
moving equipment) b. Collect well and site information from site hydrologist or driller to complete log
header information. If information is not available at the time of logging, complete the logging and enter header data prior to uploading files to database or converting to Log ASCII Standard (LAS) file
c. Install cable pulley in a suitable location above the well to be logged d. Consult user guide for logging directions for specific tool
3. Geophysical log calibration: a. Caliper tool should be calibrated between a range of 3‐inch to 8‐inch in
diameter when logging a core hole b. Caliper tool should be calibrated with the long arms if the expected borehole
size or casing is greater than 12‐inches in diameter c. The multi‐tool should always be calibrated before logging a well
4. Order for running logging tools: a. Core hole (core rods in hole) – run the #9165 slim‐line caliper/gamma or the
#9060 slim‐line caliper/gamma through the core rods. After the rods have been removed from the core hole, run the (#9511 or 9512) induction tools and/or (#8043, 8044, or 8143) multi‐tools prior to running any of the caliper tools
5. Log Quality: a. Confirm that log is collecting accurate data during logging. If a log appears to be
collecting erroneous data: 1. Attempt to re‐run the log 2. Restart the computer 3. Use another available tool 4. If unable to correct the situation, note the problem in the information
area in the log header b. Edit all header information prior to converting the log to a LAS file or placing the
log in the geophysical log database

SOP# GEO_07.01.00
Date 12/16/2013
Revision # Original
62
QualityofWaterImprovementProgram(QWIP)Wells
PROCEDURE1. Locate well on landowner property:
a. Inspect site for objects that could be damaged by driving logging equipment onto property (sprinkler heads, septic tanks, flowerbeds, etc).
b. Inspect site for possible hazards (power lines, homeowner animals, etc). 2. Set‐up the logging unit:
a. Remove well cap, well seal, or cover from well casing 3. Gather pertinent well information:
a. Measure casing diameter and determine the casing material; i.e., Poly Vinyl Chloride (PVC), black or galvanized steel
b. Measure water level depth or measure the height and orifice diameter of the artesian flow above top of casing
c. Take water sample from well bore with hand thief sampler if not flowing. If well is flowing, collect sample from flow. (Follow procedure for collecting water quality samples)
d. Collect conductivity, pH and temperature of water sample e. Collect the latitude & longitude of the well location f. Record all information collected above onto Well Site Data Sheet, (WSDS).
4. Install pulley device or tripod. 5. Run dummy tool in well prior to running geophysical tools. 6. Calibrating the caliper tool (Review User’s Guide):
a. Connect caliper probe to the logging cable‐head. Tighten locking nut on cable‐head and wrap black tape around locking nut to prevent unscrewing
b. Turn on computer and log in with the user name and password (both inputs are “user”)
c. Unspool enough cable to place tool into well. Adjust tool elevation until the taped locking nut is at land surface
d. If a manual counter is available on the draw works set it to zero e. Record total depth and casing depth on WSDS. The total logged depth of the
well will be listed at the top of the page in the file name f. Monitor the data collected while in Real Time Logging to confirm that the data
looks accurate and the tool is functioning properly 7. Editing the log header:
a. With the log pulled up in Display, select “Edit” then “Header” then uncheck API header Template on the bottom of the header information
b. Scroll down and enter the casing depth where indicated c. Scroll down to Other Services #1 and enter the average borehole diameter
obtained from the Excel processed log d. Select “Done” and save log. At the prompt “Overwrite current log?” Select “Yes
8. Determining the average borehole diameter: a. Note ‐ The process to determine the average borehole diameter can be
performed in the field or in the office b. Open the Office Excel program:

SOP# GEO_07.01.00
Date 12/16/2013
Revision # Original
63
1. From the main menu, select “File, open” and select the LAS file to be averaged. Select “Fixed Width” then select “Next.” Scroll down to data columns and place vertical lines between columns to separate. Select “Next,” select “General” for the format then select “Finish”.
2. Scroll down to bottom of Caliper/Diameter column place cursor on first empty space; select the “AutoSum Formula” button (from top of Excel menu). Select “Average” and the average diameter of the borehole will be displayed. Go to the top of the column and delete all “zeros” from the averaging column so they aren’t added to the borehole average.
c. Transfer the average borehole diameter number onto the WSDS d. When prompted to save changes select “No”
9. Converting caliper log to LAS file: a. Select “Display” in the Main Menu, select “Processing”, select “File Conversion”,
and Input the file you want to convert. Select “Las Unwrapped” then the “Convert” button. Select the curves to be modified then select “Continue” then select “OK”
10. Printing log and header: a. In Display with the log pulled up that you want to print, Select “Print Log” from
menu, check “Print Wide Header” on the bottom of the Log Printer Parameters Box
b. For single sheet printing of just the log, multiply the total depth of the log by a factor of 1.3. Enter this new number in the “Ratio” block. Enter 100 in the “Depth Label Increment” block, enter 20 in the “Major Divisions” block, enter 1 in the “Medium Divisions” block, enter 2 in the “Minor Divisions” block. Select “Both” on the Print Scales, Select “Print Log”
c. Save Log and LAS log to a flash drive 11. Exit out of the program and turn off computer
WaterUsePermittedWells(WUP)
PROCEDURE1. When logging for WUP wells, follow the same procedures above for collecting pertinent
information, editing the header, saving the file and converting the file to a LAS file. WUP wells require a caliper, multi‐parameter and in some occasions a water quality sample. Consult user guide for logging directions for specific tools.
FacilitatingAgriculturalResourceManagementSystems(FARMS)Wells
PROCEDURE B. When logging for FARMS wells, follow the same procedures above for collecting
pertinent information, editing the header, saving the file and converting the file to a LAS file. FARMS wells require a caliper, multi‐parameter, induction and a water quality sample. Consult user guide for logging directions for specific tools.

SOP# GEO_07.01.00
Date 12/16/2013
Revision # Original
64
LegalComplianceLogging
PROCEDURE 1. Typically logging for legal compliance requires only a caliper log. These requests are usually for casing and total depths only. Consult user guide for logging directions and proper calibration procedures for this tool.
VIDEOLOGGING
PROCEDURE 1. Set up file and/or location map to well site. Get contact names and obtain permission to
run video log in well. 2. Turn on control panel power supply to video camera and monitor. 3. Determine which light head to use the smallest diameter that is expected to be in the
well. Longer light heads should be used for larger diameter wells and short light heads and light ring for the smaller diameter wells.
4. Turn on control panel power supply to video camera. 5. Verify both views on camera are functioning using joystick. 6. Set up tripod over well or use block suspended from cable line from the rig. 7. Secure tripod down with rope and stakes. 8. Adjust cable so the top of the video camera connection is at land surface or at the top of
the wellbore. 9. Reset manual counter on draw works to zero. 10. Reset the preset depth button on the control panel to three feet (the approximate
length of the video camera when the camera connection is at land surface. 11. Insert blank DVD into DVD unit, use controls on DVD remote to specify well name, date,
time, WUP, and DID numbers and enter this information on the inspection sheet. 12. Adjust light level controls on joystick. 13. Adjust centralizers on camera for smallest diameter borehole expected to encounter.
Push the “record” button on remote or on the DVD unit. 14. Using draw works controller, proceed slowly into wellbore. 15. Check casing integrity as video camera goes deeper into the well. Stop and inspect
casing or joints with side‐looking lens if anything needs inspecting. 16. When the camera reaches the bottom of the casing, stop and inspect using the side
looking lens. 17. Record casing depth on video logging inspection sheet. 18. Use the side looking lens to view large vertical cracks. 19. After reaching the bottom of the wellbore, reverse draw works direction and return to
land surface. 20. At the top of the well press “Stop” on the remote to end recording. 21. Using the remote, finalize DVD recording. Make copies of the recording using the DVD
copier in the trailer. The original goes in the top tray; the other two other trays are for the blank discs. Provide copies to the requestor and send original to supervisor.

SOP# GEO_07.01.00
Date 12/16/2013
Revision # Original
65
SUGGESTEDREFERENCES1. ASTM Standard D5753, 2005 (2010) Standard guide for planning and conducting
borehole geophysical logging, ASTM International, West Conshohocken, PA, 2010, DOI: 10.1520/D5753‐05R10, www.astm.org.

SOP# GEO_08.01.00
Date 12/17/2013
Revision # Original
66
QualityofWaterImprovementReimbursementProcessFlowchart
SOP# GEO_08.02.00
Date 12/17/2013
Revision # Original
67
EstablishingNewQualityofWaterImprovementProgram(QWIP)WellFile
PURPOSEThe following guidelines are to be used when establishing a new QWIP well file.
PROCEDURE1. Receive request for well plugging funding assistance. 2. Determine if the well meets funding assistance requirements:
a. Four‐inch diameter or larger OR
b. Well was drilled for a water supply OR
c. Well was completed into an “Artesian Aquifer” OR
d. Well is at least one year old 3. Establish and complete a “Well Site Data Sheet” containing:
a. Landowner’s name, mailing address, and phone number b. Contact name and phone number (if different than landowner) c. Physical address of well location (if no address available, request specific
directions or request map of well location) d. Determine County, Section, Township and Range of well location
Determine what the well was used for, i.e., irrigation, domestic, public supply, or abandoned
4. Record reason well is to be plugged, i.e., poor water quality, development, abandoned. 5. Record if there is a pump in the well. If yes, enter when is it scheduled to get pulled.
State the type of pump (submersible, jet, centrifugal or turbine). 6. Establish Section, Township and Range, and Quad Map name by reviewing “Political
Basin & Regional Observation and Monitor‐well Program (ROMP) map”. 7. Assign next available QWIP well number for that Political Basin. 8. Verify the landowner information through the County Property Appraiser’s web site. 9. Verify if the well has a Water Use Permit (WUP) from WMIS data base. 10. Enter well number and landowner information into QWIP Database. 11. Print road map of well location (Google, AAA, or MapQuest). 12. Schedule time and meeting place to perform inspection and well logging.
AFTERWELLLOGGINGISCOMPLETE1. Input well information into the database. 2. Determine the average borehole diameter of the well from the processed LAS file to
determine the reimbursement amount. 3. Input landowner and well information into the Reimbursement Claim Form (RCF); print
out two copies of RCF.
4. Place copy of the RCF in the selected file for Claim Form PDFs.

SOP# GEO_08.02.00
Date 12/17/2013
Revision # Original
68
5. If requested, fax a copy of logs to well contractor, and local permitting authority (i.e., Tampa/Bartow REG, Sarasota Health Department, or the Manatee Environmental Services Management).
6. Transfer the geophysical and LAS files from flash drive and place into the appropriate electronic storage file.
7. Place a paper copy of the logs and RCF in overnight mail to the appropriate administrative assistant along with a note as to which letter to send to the landowner or their contact.
a. Letter number 1 ‐ Open well b. Letter number 2 ‐ Plugged well c. Letter number 3 ‐ Obstructed well
8. Place all paperwork into the proper ACTIVE Fiscal Year three‐ring binder. A Check Request Packet will be emailed after the claim is processed for reimbursement.
UPONRECEIVEINGREIMBURSEMENTPACKETVIAEMAIL1. Enter plugged date and action taken into the electronic database. DO NOT PRINT
PACKET. 2. Transfer the Well Site Data Sheet packet from the ACTIVE binder to the PLUGGED
binder. 3. The binders will remain with the Sarasota Service Office for future technician
referencing.
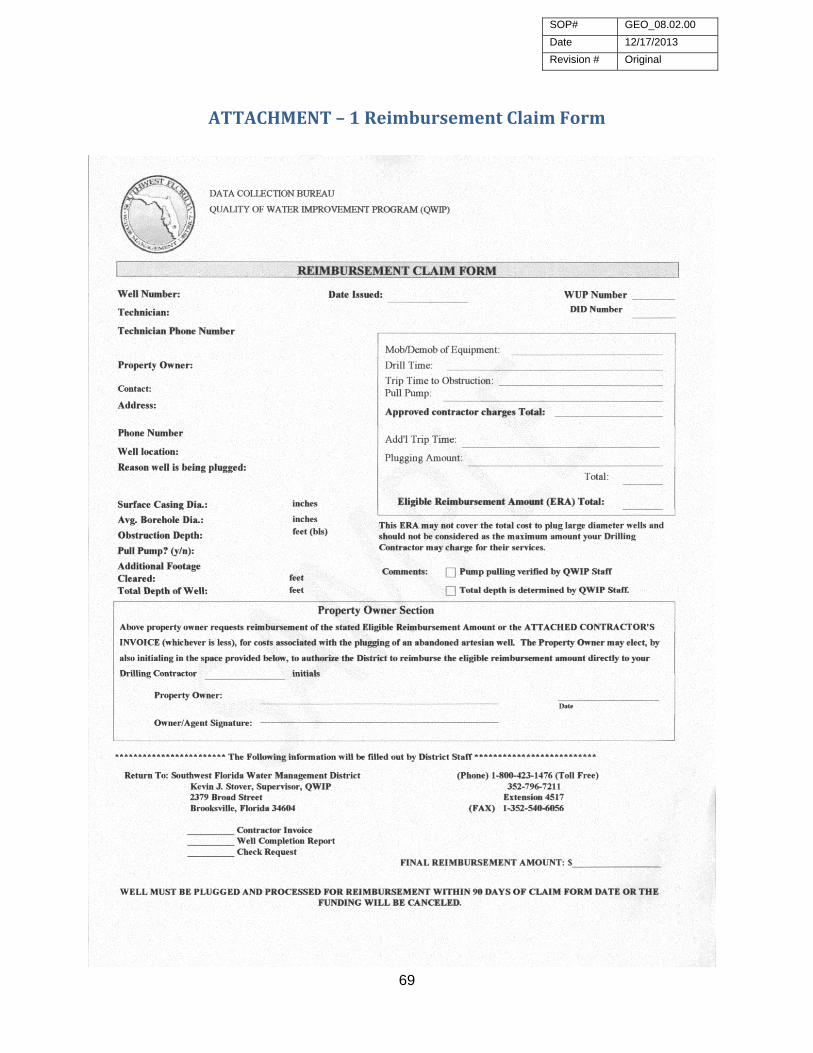
ATTACHMENTS1. Reimbursement Claim Form
SOP# GEO_08.02.00
Date 12/17/2013
Revision # Original
69
ATTACHMENT–1ReimbursementClaimForm