geoinformation solutions for agriculture based on big data...
TRANSCRIPT
Geoinformation solutions for agriculture based on Big Data analytics
Volpe, Fabio (1); Tricomi, Alessia (1); Pistillo, Pasquale (1); Biscardi, Mariano Alfonso (1); Chiara Francalanci (2); Angela Geronazzo (2); Paolo Giacomazzi (2); Paolo Ravanelli (2)1: e-GEOS, Italy; 2: Politecnico di Milano, Italy
:

Data
Value Added Services
InformationProducts
Big dataanalysis
Low
High
Level of Value Addition
Progressive shift from simple mapping to complex monitoring applications.

The ESA Earth Observation Φ-week
Solutions tailored on userrequirements
USER-DRIVEN
Generation of analyticsfrom the processing of
huge time series of different data
FROM BIG DATA TO ANALYTICS
Turning data and images into information that can
be browsed and analyzed
INFORMATION NOT ONLY
IMAGE DATA

Operational workflows
The ESA Earth Observation Φ-week
• Services provided by AgriGEO strongly rely on the usage of satellite time series, organised in multi-source Data Cubes • They are managed in a fully scalable
environment, allowing a fast and efficient extraction of information for feeding vertical workflow pipelines, often requiring near-real-time delivery performances. • One main driver for the provision of
these services is the availability of big data analysis techniques enabling the extraction of information and analytics from huge amounts of data
Data Cube
Processing workflows
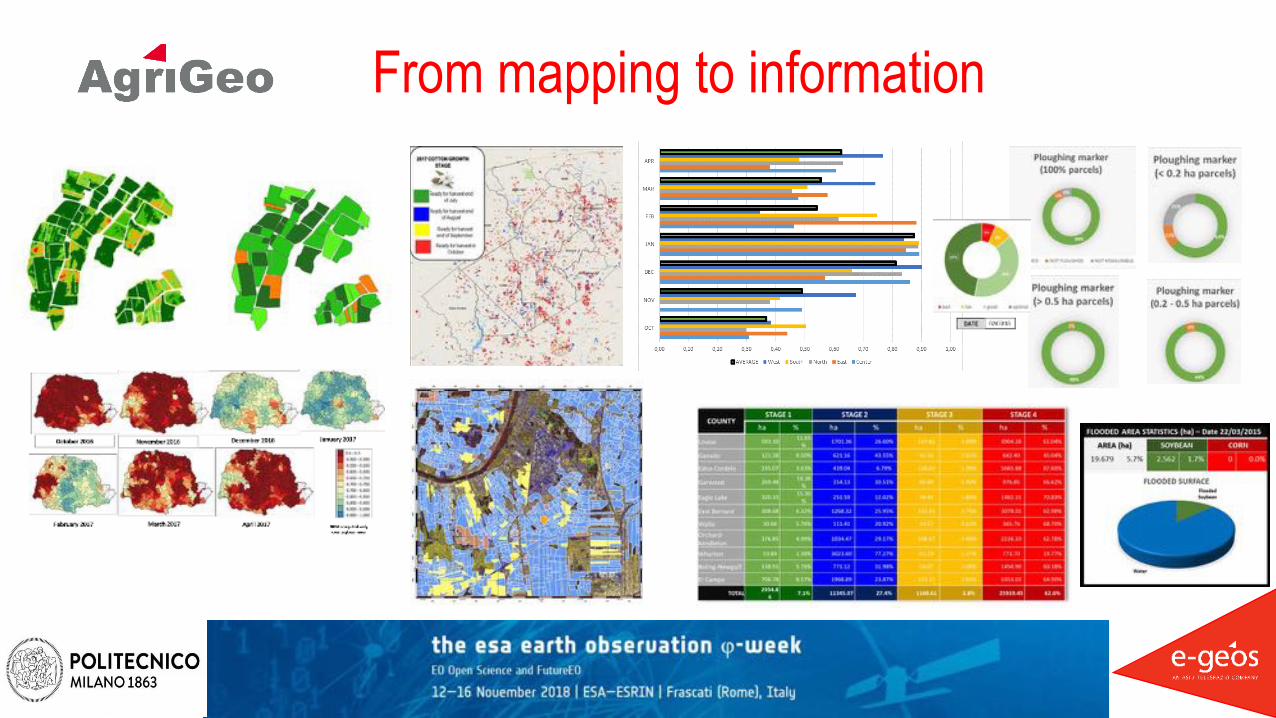
From mapping to information


Acreage statistics composite modelThe approach exploits multiple data sources and creates a composite model:¾Random Forest model based on optical data¾Bayesian model based on USDA historical series
The model has been developed on different test area, therefore considering differences in climate and growing crops.

The RF model
• Images can be seen as a multidimensional matrices where each value (i,j) represents a set of spectral bands. • USDA classification is used as ground truth to train ML models.• An extensive tuning procedure was applied to fit the best set of hyperparameters at single test area
level.• Class labels were grouped to train a set of binary models, final prediction was assigned according
to the highest probability label.
Select images at tile
level
Remove observations
hidden by clouds and
missing obs.
Add ground truth
Select high-confidence
observations (>97)
Replace missing obs. with the most recent historical
obs.

Sentinel-2 May 30, 2018

Soyben crop mask at May 30, 2018
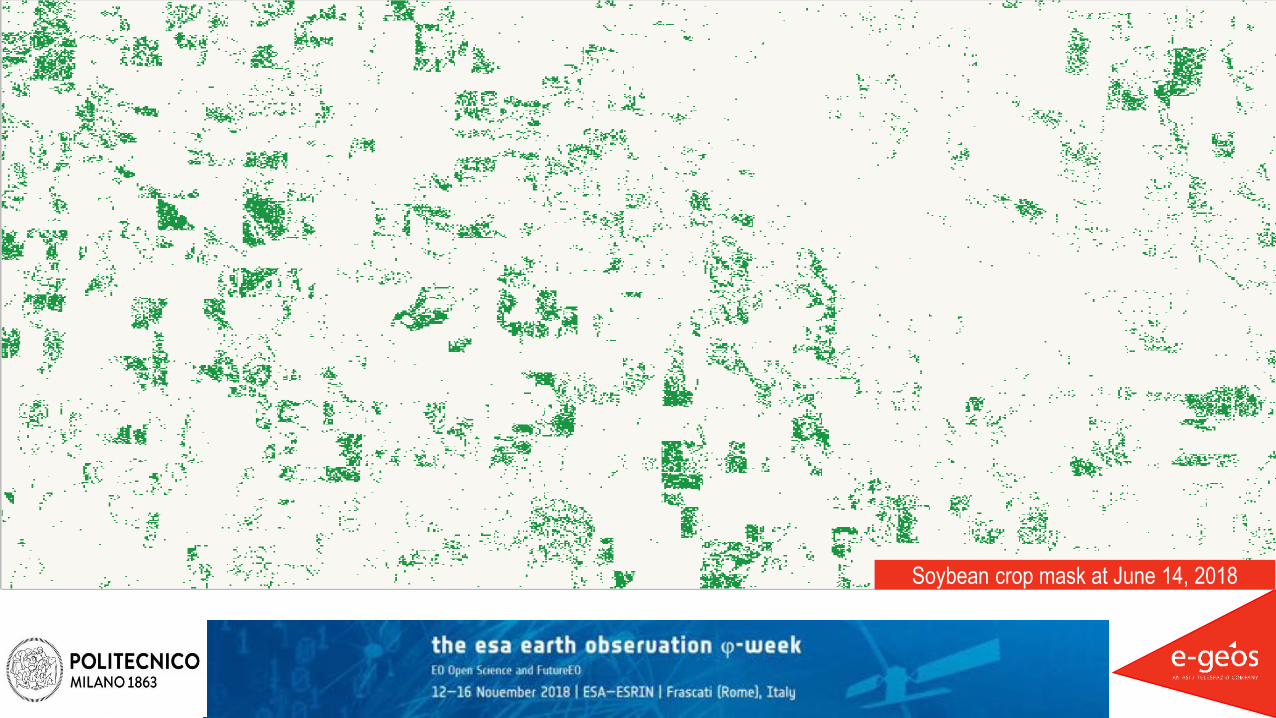
Soybean crop mask at June 14, 2018

Sentinel-2 July 24, 2018


2017

2016

2015
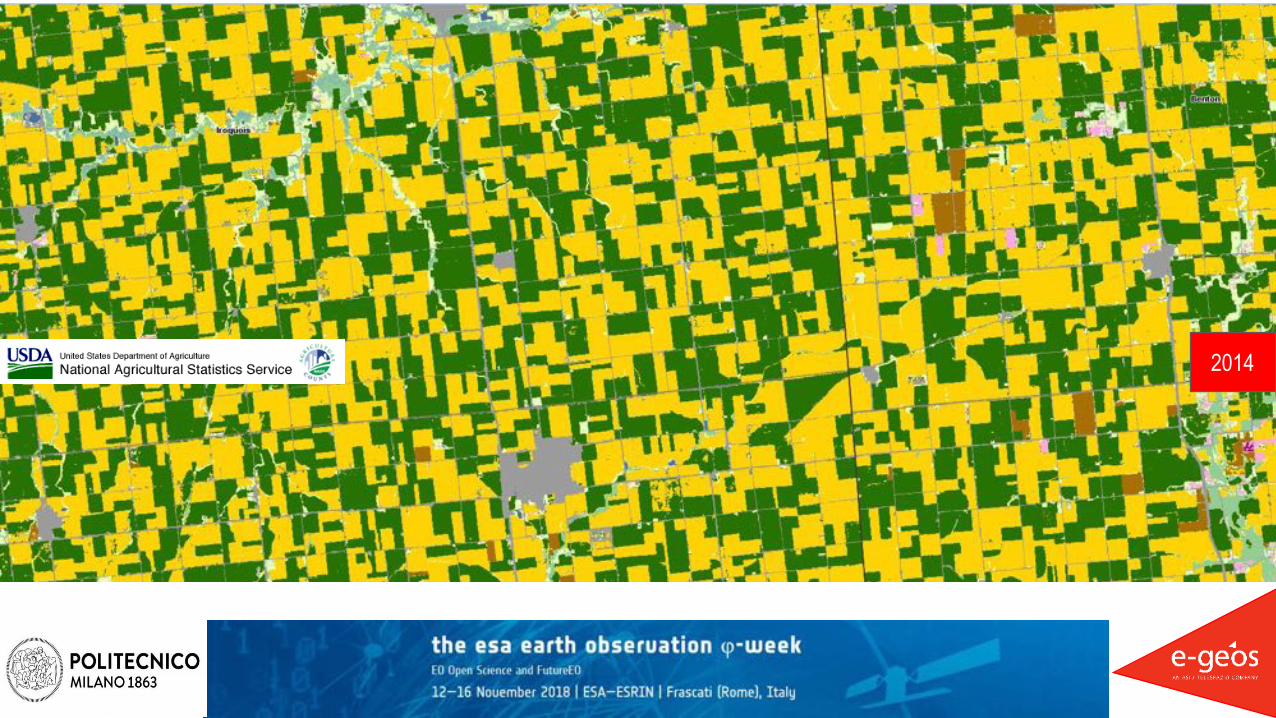
2014

2013

The Bayesian model
The Bayesian model considers 10 years of historical data and estimates periodic crop variation at test area level.The model comprises a pattern based component to account for longer sequences variation.
Process USDA yearly
prediction
Create pixel-based
sequence
Produce 10-years pixel-based sequence
Extract relevant labels and aggregate

Sentinel-2, May 30, 2018


Sentinel-2 July 24, 2018


NEBRASKA – Bayesian model 2018

NEBRASKA – Sentinel-2, June 29, 2018

NEBRASKA – Situation at June 29, 2018 –CORN FIELDS Bayesian model

NEBRASKA – Bayesian model 2018

NEBRASKA – Situation at June 29, 2018

NEBRASKA – Situation at June 29, 2018 –SOYBEAN FIELDS Bayesian model

• Average difference betweenpredicted and referencevalue: • For larger acreage : 3.2%• For smaller acreage : 11.5%

Summary
• Satellite time series are a powerful enabler for EO services dedicated to agriculture• By leveraging on these time series, e-Geos is adopting its Agrigeo platform for products
generation and services provision, also carrying out research activities for enlarging and improving service portfolio. • Together with Politecnico of Milano has been analized the computation of crop acreage over
adminstrative units, with focus on its continuous update during the growing season• A promising solution is based on the integration of a bayesian model for the provision of
crop acreage in the very early stage, with an RF model for later stages

All COSMO-SkyMed images © ASI - Agenzia Spaziale Italianae-GEOS S.p.A – L.O. Contrada Terlecchie snc – Matera / HQ Via Tiburtina, 965 – Roma