geologic structure in the gushing oil and gas … · map of the cushing oil field, okla., showing...
TRANSCRIPT

DEPARTMENT OF THE INTERIORFRANKLIN K. LANE, Secretary
UNITED STATES GEOLOGICAL SURVEYGEORGE OTIS SMITH, Director
Bulletin 658
GEOLOGIC STRUCTURE IN THE GUSHING OIL AND GAS FIELD, OKLAHOMA
AND ITS RELATION TO THE OIL, GAS, AND WATER
BY
CARL H. BEALPETROLEUM TECHNOLOGIST, U. 8. BUREAU OP MINES
Prepared in cooperation with the Bureau of Mines
WASHINGTONGOVERNMENT PRINTING OFFICE
1917


CONTENTS.
Page.Purpose of the work. ...................................................... 7Summary ................................................................ 8Acknowledgments. ....................................................... 8Development. ........................................................... 9Stratigraphy. ............................................................. 11
Rocks exposed at tHe surface .......................................... 11Rocks penetrated by the drill ......................................... ] 2The productive sands. ................................................. 14
Layton sand. ..................................................... 14Jones sand. ....................................................... 14Cleveland sand. .................................................. 14Wheeler sand. ................................................... 14Skinner sand. .................................................... 15Bartlesville sand. ................................................. 16Tucker sand ..................................................... 16
Structure. ............................................................... 16Definition of geologic structure ........................................ 16Value of a knowledge of geologic structure. .............................. 17Relation of initial production to structure. .............................. 17Graphic method of representing structure. .......... J .................. 18Determination of the structure of beds exposed at the surface. ............ 19Determination of underground structure. ............................... 20Structure in the Gushing field. ......................................... 21
General features. .................................................. 21Dropright dome. ................................................. 22
Surface structure. ............................................. 22Layton sand ................................................. 23Wheeler'sand. ............................................... 23Bartlesville sand. . ............................................ 23 Elevation of sands .... .................................... ... 24
Wheeler saddle. .................................................. 24Drumright dome. and near-by structural features. .................... 25
Surface beds. ................................................ 25Layton sand ................................................. 25Wheeler sand ................................................ 25Bartlesville sand. ............................................. 25
Mount Pleasant dome ...........................:.............,.... 25Surface beds. ................................................ 25The oil sands .................................................. 26
Wheeler terrace. .................................................. 26Shamrock dome. .................................................. 26
Surface beds. ................................................ 26The oil sands. ................................................. 27
Other structural features. .......................................... 27
3

4 CONTENTS.
Structure Continued. page .The Layton-Bartlesville interval....................................... 27
Attempt to prepare a "convergence map ".......................... 27 ^Distribution of the .intervals....................................... 29Relation of intervals to structure.................................. 31
Possible causes of differences in folding................................. 31Items considered................................................. 31Difference of hard and soft beds in resistance to compression.......... 32Lenticular form of the Bartlesville sand............................ 32Unconformities................................................... 33Folding during deposition......................................... 33Cross folding..................................................... 34
Relation of oil and gas to structure.......................................... 35Method of mapping.................................................... 35Layton sand......................................................... 35Wheeler sand........................................................ 37Bartlesville sand...................................................... 38Tucker sand........... I............................................. 39Occurrence of water.................................................. 39Peculiarities in distribution of oil and gas............................... 39
Direction of migration of oil and gas....................................... 42Layton sand......................................................... 42Wheeler sand........................................................ 43Bartlesville sand...................................................... 43Re'sume'.............................................................. 44
Water in the sand.. ......................................................... 44Classification......................................................... 44Top water............................................................ 45Bottom water..... 1................................................... 45Edge water........................................................... 46Necessity of excluding water from the oil and gas sands.................. 47Water surfaces........................................................ 48
General conditions................................................ 48Layton water surface............................................. 51Wheeler water surface............................................ 52Bartlesville water surface............................ .. ............ 53Variations in the water surfaces around the Gushing field............ 53Possible causes of the inclined water surfaces....................... 55
Necessity of similar work elsewhere........................................ 61 .Index.................................................................... 63 ~

ILLUSTRATIONS.
PLATE I. View westward across Cimarron River near the crest of the Droprightdome.......................................................... 8
II. River-bed lease on west side of Dropright dome................... 9III. Geologic sketch map of Oklahoma................................. 12IV. Map of the Cushing oil field, Okla............................ In pocket.V. Map showing surface structure in the Cushing oil field, Okla... In pocket.
VI. Sketch map of the Cushing oil field, Okla., showing general struc ture of the Layton, Wheeler, and Bartlesville sands, the distri bution of oil and gas in each sand, and initial production of certain areas................................................... 16
VII. Map of the Cushing oil field, Okla., showing the structure of the Lay: ton sand, the distribution of oil and gas, initial production of cer tain areas, and the contours on the water surface in the sand ..In pocket.
VIII. Map of the Cushing oil field, Okla., showing the structure of the Wheeler sand, the distribution of oil and gas, initial production of certain areas, and contours on the water surface in the sand. In pocket.
I.. Map of the Cushing oil field, Okla., showing the structure of the Bartlesville sand, the distribution of the oil and gas, initial pro duction of certain areas, and the contours on the water surface in the sand ................................................. In pocket.
X. Map of the Cushing oil field, Okla., showing the variations in the interval between the Layton and Bartlesville sands and the rela tion of the variations to the structure of the Layton sand..... In pocket.
XI. Sketch showing how the oil in several wells has been drowned out by" unsystematic casing. .../...................................... 44
FIGURE 1. Curves showing number of wells completed, by months, average daily production of oil per well, and quantity of oil marketed per month....................................................... 10
2. Generalized columnar section showing the positions of the oil and................................................... 15
3. Sketch section along south line of T. 18 N., R. 7 E., showing the stratigraphic relations of the Pawhuska limestone and the Lay- ton, Wheeler, and Bartlesville sands, the increase in the Layton- Bartlesville interval, and the inclination of the water surface....
4. Sketch showing the probable inclination of the water surface in the northern part of the Cushing field before and after development..
5
30
49


GEOLOGIC STRUCTURE IN THE GUSHING OIL AND GAS FIELD, OKLAHOMA, AND ITS RELA TION TO THE OIL, GAS, AND WATER.
By CARL H. BEAL.
PURPOSE OF THE WORK.
The publications of the Bureau of Mines, which was created in 1910 to carry on investigations in connection with the waste, recovery, and utilization of this country's mineral products, have included many papers dealing with technologic problems arising in the oil fields of the United States. This bulletin is based on studies made in connection with the inspection of oil and gas lands belonging to members of the Five Civilized Tribes in Oklahoma and is written in the hope of preventing or diminishing economic waste in the produc tion of oil by showing the value of geology in the development and operation of an oil field.
On August 1,1914, Congress passed the following act:For the salaries and expenses of not to exceed six oil and gas inspectors, in
addition to those now employed, under the direction of the Secretary of the Interior, to supervise oil and gas mining operations on allotted lands leased by members of the Five Civilized Tribes from which restrictions have not been removed, and to conduct investigations with a view to the prevention of waste, $25,000, to be immediately available.
The six positions thus provided for have been held during the latter part of 1915 and the first few months of 1916 by five practical oil men and one geologist. The duty of the geologist was to correlate formations containing oil, gas, and water and to determine the rela tions of these substances in different formations so that the inspection force might carry on their work most intelligently.
On account of the rapid development of the Gushing field, which lies in the western part of the Creek Nation, much work was done there by this inspection force from the fall of 1915 to the summer of 1916. This field, the most productive light-oil field in the world (Pis. I and II), embraces nearly 35 square miles of productive territory, in which have been drilled about 2,500 wells ranging in depth from about 1,200 to nearly 3,000 feet.
In the course of the geologic studies necessary to carry on success fully the work of inspection a large amount of information was col lected which, on analysis, has disclosed some interesting facts that are thought to be related to the accumulation of oil and natural gas.
7

8 GUSHING OIL AND GAS FIELD, OKLA.
These facts are published in the hope that they may be of use to the oil geologist and may show the " practical man " the value of geology in developing and operating an oil field. Not much more than the bare facts determined have been recorded, for until other fields have been similarly studied and more facts become available, only tenta tive theories can be advanced to account for the phenomena observed.
SUMMARY.
The geologic work done in the field has disclosed the following principal facts:
1. The folding of the formations in the Gushing field usually be comes greater with increase of depth, and there are many marked differences in structure among the Layton, Wheeler, and Bartlesville sands and the surface beds.
2. The interval between the Layton and Bartlesville sands is gen erally greater around the edges of the anticlines than on their crests.
3. The distribution of the bodies of oil, gas, and water indicates that the source of the oil lay west of the Gushing field.
4. In general the oil area in an elongated dome, where folding is simple, extends farther down on the long axes of the anticline or dome than on the steeper sides.
5. The water surfaces on which the oil and gas rest in the different sands are not level but are inclined away from the centers of the anticlinal folds.
ACKNOWLEDGMENTS.
In carrying on this investigation it has been necessary to obtain logs of wells and other statistics from the records of many of the companies operating in the Gushing field and nearly every operator has shown courtesy as well as willingness to assist in the investiga tion. Acknowledgments are especially due to the Gypsy Oil Co., the Carter Oil Co., the Southwest Oil Co., the McMan Oil Co., the Prairie Oil & Gas Co., the Slick Oil Co., B. B. Jones, and C. B. Shaffer. Mr. W. A. Williams, chief of the petroleum division, Bu reau of Mines, under whose direction the work was done, and Mr. J. O. Lewis, of the Bureau of Mines, offered many valuable sugges tions. Special thanks also are due to Mr. M. J. Munn, chief geolo gist of the Gypsy Oil Co., whose suggestions and ad vie, e have been invaluable, and to Mr. Max W. Ball, who carefully read the manu script of the report. The figures giving the heights above sea level of the mouths of the wells figures that made it possible to prepare the accompanying maps showing the underground structure of the oil sands were in part furnished by the Gypsy and Carter oil com panies ; the remainder were taken by the writer with a plane-table in the spring of 1916.

U. 8. GEOLOGICAL SURVEY BULLETIN 658 PLATE I
VIEW WESTWARD ACROSS CIMARRON RIVER NEAR THE CREST OF THE DROPRIGHT DOME.
Drumright in the distance. Wheeler terrace tin the left.

U. S. GEOLOGICAL SURVEY ULLETIN 658 PLATE II
RIVER-BED LEASE ON WEST SIDE OF DROPRIGHT DOME.

GUSHING OIL AND GAS FIELD, OKLA. 9
DEVELOPMENT.
Although geologists who visited the western part of the Creek Nation in preceding years recognized the fact that the geologic structure in the Gushing field was favorable to the accumulation of oil, no oil was discovered there until March, 1912, when C. B. Shaffer and others drilled well No. 1 on the Annie Jones (F. M. Wheeler) farm, in the NW. £ sec. 31, T. 18 N., K. T'E., about a mile north of the present site of Drumright. This well was drilled to the Wheeler sand, and for more than a year and a half this and the Layton sand produced the entire output of oil made by the field. In December, 1913, however, the Prairie Oil & Gas Co. completed the first well to the Bartlesville sand, in sec. 3, T. 17 N., R. 7 E.
The development has been extremely rapid, especially since the discovery of oil and gas in the Bartlesville sand so rapid that it has resulted in great waste of oil and gas. The production of the field reached more than 300,000 barrels of oil a day, and at one time about 160,000 barrels of oil were being produced daily by 160 wells from the Bartlesville sand alone. The " break " in the market that followed this flood of oil and the inadequate transportation facilities made it necessary to store great quantities of oil on tank farms. The total marketed output of all the oil sands in the Gushing field to October 1, 1916, was about 165,000,000 barrels.
Figure 1 'shows the development of the field by months since the first well was drilled to the Wheeler sand from March, 1912, to September, 1916.
In view of the large number of producing sands the field is, on the whole, easy to .operate. Drilling is rapid, the formations "stand up" well, the productive formations lie at moderate depths, and wells that produce an excellent quality of high-grade oil can be sunk at comparatively low cost.
The field has been well defined by dry holes, most of which have been drilled sufficiently deep to constitute a thorough test of its limits. The locations and depths of these dry holes are shown on Plate IV (in pocket). The field will probably not be extended far in any direction. The district southeast of Shamrock is not yet so com pletely drilled as the other parts of the field, but it is practically out lined. In less developed parts of the field the greatest new output will probably be derived from the more porous parts of the oil sands and from small anticlines or domes defined by geologists or drilled into accidentally. Another possible source of more produc tion is the deeper formations. The Tucker sand has been thoroughly exploited, but what may lie below the " Mississippi lime " the upper part of the Mississippian, a few hundred feet below the Bartlesville sand is not yet disclosed, as no well that is known to the writer has

Q e 00
FIG
UEB
1.
Curv
es
show
ing
num
ber
of
wel
ls
com
plet
ed,
by
mon
ths,
av
erag
e da
lly
pro
duct
ion
of o
il p
er w
ell,
and
qu
anti
ty
of o
il m
arke
ted
per
mon
th.
Sta
tist
ics
obta
ined
fr
om
Oil
and
Gas
Jo
urn
al.

StBATiGBAPSY. 11
penetrated the Mississippian in the Gushing field to a depth of more than 200 feet. Possibly more oil may be obtained on some of the folds of sands between the Tucker sand and the " Mississippi lime."
Much of the information in this report is derived from well logs. Detailed logs are scarce, for most operators in the Gushing field record only the depth and thickness of sands that may be productive. The water sands are omitted from many logs, and also the depth and thickness of members intervening between productive sands.
The incompleteness of these records seems to be due to the failure of the operators to realize the value of complete well logs, which should include not only a detailed list of the formations penetrated by the drill but measurements made by a steel line from the mouth of the well to the top of each productive sand. The log should show the character and content of each sand and the height to which water or oil rises in the well when the formations containing them are penetrated. The dates of completion, redrilling, deepening, and shooting, and all other information that may be of value should be recorded, for this record may greatly assist future operators of the property, especially when the field reaches the first stages of deple tion and is being encroached upon by water.
STRATIGRAPHY.
BOCKS EXPOSED AT THE SURFACE.
This report does not include an account of the areal distribution of the formations or a detailed description of their features, for the surface geology of the district has not been studied extensively by the writer. Some of the statements here given regarding the surface rocks are in substance those made by Buttram,1 of the Oklahoma Geological Survey.
The rocks of the Gushing field are exclusively sedimentary (see PI. Ill) and, except the terrace sands and alluvial deposits, are all of late Pennsylvanian age. The Pennsylvanian rocks exposed at the surface lie near the top of that series. Between the western limit of the field and the upper or western limit of the Pennsylvanian series about 400 feet of strata crop out, including the Neva limestone and representa tives of the Elmdale and underlying formations. In accordance with the provisional current usage of the United States Geological Survey, the line between the Pennsylvanian and Permian is drawn at the base of the Cottonwood limestone, which is about 50 feet above the Neva limestone. It should perhaps be drawn as low as *the Neva limestone, or possibly at the base of the Elmdale, which embraces 130 feet of sediments below the Neva limestone of the Kansas section. This limestone forms an escarpment just west of the town of Gushing, Okla., and 12 miles west of the oil field.
1 Buttram, Frank, The Gushing oil and gas field, Okla.: Oklahoma Geol. Survey Bull. 18, 1914.

12 GUSHING OIL AND GAS FIELD, OKLA.
The following table gives the geologic formations of the Penn- sylvanian series as reported by Buttram in the vicinity of Gushing field the oldest at the bottom and the youngest at the top:Neva limestone.Sandstones and shales and thin limestones (556.5 feet).Pawhuska limestone (provisional correlation). Is 2,340 feet above Fort Scott
limestone and 1,243 to 1,262 feet above Lost City limestone. Shales and sandstones (134 feet). Elgin sandstone. Interval.Lost City limestone. Interval (1,078 to 1,097 feet). Includes Lay ton sand at 700 to 810 feet above
Wheeler sand.Fort Scott or Oswego limestones (75 feet) (= Wheeler sand). Interval. Bartlesville sand. (Belongs in Cherokee shale.)
According to Mr. Buttram, who has carried preliminary field work from the northern limit of the Gushing field northeastward toward the Cleveland oil field, the most prominent outcropping stratum is a bed of limestone that is in part at least equivalent to the Pawhuska limestone of northern Oklahoma, as described by Smith,1 although careful and accurate correlation is yet to be made. Later investiga tions made by the United States Geological Survey in regions north east of the Gushing field indicate a necessity for some nomenclatural revisions, which, however, are not yet completed. It is even some what probable that the limestone called by Buttram the Pawhuska and used in this report as a key horizon may not be the same as that which is conspicuously exposed near Pawhuska.
The rocks exposed at the surface within the Gushing field repre sent strata aggregating in thickness about 225 feet.
BOCKS PENETRATED BY THE DRILL.
The drill penetrates a series of alternating sandstones, shales, and limestones, the limestones apparently becoming less prominent and the sandstones most prominent toward the south end of the field, near Shamrock. According to Buttram the Pawhuska limestone near the center of the field, in the vicinity of Drumright, lies about 2,340 feet above the Wheeler sand, which is thought to be equivalent to the Fort Scott ("Oswego") limestone. The Bartlesville sand here is supposed to be equivalent to the Bartlesville sand of the fields of northeastern Oklahoma.2
The following are typical logs of the strata encountered in the northern part of T. 17 N., R. 7 E., in the central part of the field.
1 Smith, J. P., The Arkansas coal measures in their relation to the Pacific Carbonifer ous province : Jour. Geology, vol. 11, p. 199, 1894.
2 Buttram, Frank, The Cushing oil and gas field, Okla.: Oklahoma Geol. Survey Bull. 18, p. 43, 1914.

U. S. GEOLOGICAL SURVEY BULLETIN 658 PLATE
641-B AIN fc> O<H-B A __.,_^_ __---,, ;" ~ ~i~T^ ~.S-nT,.~7 r~~Tn"~»;: - -fT5i I» i V / i
r: r*m L.?.-?'*&*FT- i--^--r-\ F.nid
/i-'/ R F i E" L
rf'E'gWV ^ \
.. ,v,. ,L_\^=(CAN
LMARSHAL SliOVE - A JRRYAN
Ruled area shows position of Gushing oil field
LEGEND
Tertiary andQuaternary formations
( Upland gravel and sands)
GEOLOGIC MAP OF OKLAHOMA SHOWING OIL AND GAS POOLSHeavy numbers refer to numbered bulletins in which other oil fields
in Oklahoma are described
Gas
50 50 Miles
1917

STRAT1GEAPHT.
Record of well No. 24, sec. 8, T. 11 N., R. 7 E. [Lessor, N. Yarhola.]
13
Record of strata. Thick ness.
Feet. 10504050^ft
153520Qf\
nc
5025ttf
60160
70140
102010t,n4015
2705
15
Depth.
Feet. 1060
100150200215250270350375425450500560720790930940960970
1,0201.0601,0751.3451,3501,365
Record of strata.
Sand, white, soft (Layton
Shale, black, soft .............Lime, white, hard ............Shale, white, soft .............Sand, white, soft (Wheeler
Shale, white, soft .............Shale, black, soft. ............
Lime, white, hard ............Sand, white, soft (Bartlesville
Thick ness.
Feet.65
2105
4011540
1404075176038
30195
10204515
10341
103
2
Depth.
Feet.1,4301,6401.6451,6851,8001,8401,9802.0202,095
' 2, 1122,1722,210
2,2402,4352,4452,4652,5102,5252,6282,6692,672
2,674
Record of well No. 1, sec. 10, T. 17 N., R. 7 E. [Lessor, Sandy Fox.]
Record of strata.
Soil...........................
Shale, white......... .........
Sand.........................Shale, white. .................Sand.........................Shale.........................Slate.........................
Shale.........................Sand.........................Shale.........................
Slate.........................
Shale.........................Lime.........................Shale.........................
Shale........................." Blackjack". . ...............Shale.........................Sand, water. .................
Sand.........................
Slate......!..................
Thick ness.
Feet. 2
388
146
10208
306
33401530109^
2540151520992115
5401524
2191034
2536
10201897
105
1510
Depth.
Feet. 2
404862687898
1061361421752152302602709Q5
320360375390410509530un550590605629631650660fiQA
6967017047107207407587QE
70 e
Rnn815825
« Record of strata.
White lime....... ............Slate............ ...Sand...........Slate.........................Lime.......................Shale.......................Sand, water, etc. .............Break........................Sand, hard. ................
Lime..............'...........Shale.........................Lime.........................Shale.........................Lime.........................Shale........................Sand, hard. ..................
Shale.........................Lime.'........................Shale, blue ...................Lime.........................Shale.........................
Shells........................Sand. ........................
Slate....................'.....
Slate.........................
Shells........................
Thick ness.
Feet. 555
20155
OA
C
30105
59>;5
107
10
2020is
2891711
511491
2000
00
55
inqort
lag
461024
Depth.
Feet.09ft
QOff
s<insfinfi?f;CCfi
oinQI <;041
1,0501,0551.0801,0851,1241 131
1,1411,1501,170i ion1,2081 4971*514i eo7
i e7Q
1 ciQ9
I n of
1 flft0.1 ft0.**
1,840
1 Q7("
2,205
9 993
2 QOO
9 9.7Q9 °.ftfi
2 419
14 GUSHING OIL AND GAS FIELD, OKLA.
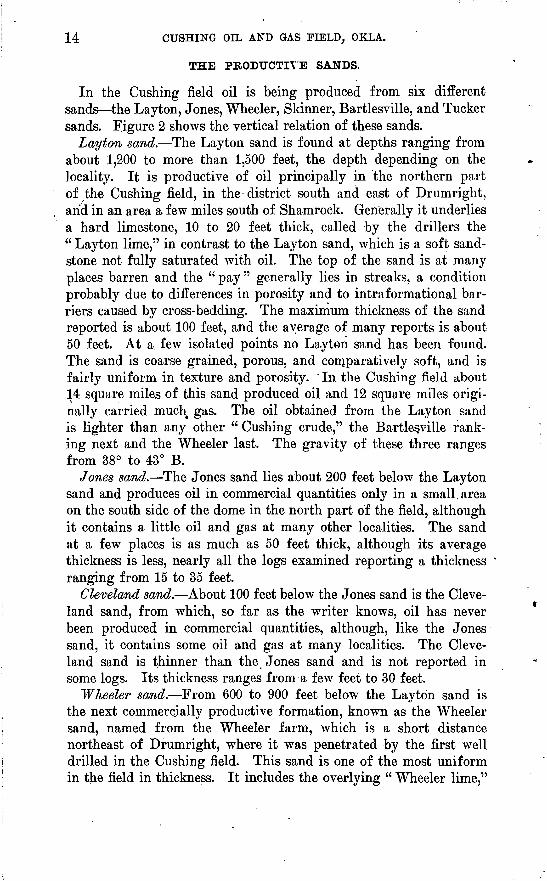
THE PRODUCTIVE SANDS.
In the Gushing field oil is being produced from six different sands the Layton, Jones, Wheeler, Skinner, Bartlesville, and Tucker sands. Figure 2 shows the vertical relation of these sands.
Layton sand. The Layton sand is found at depths ranging from about 1,200 to more than 1,500 feet, the depth depending on the locality. It is productive of oil principally in the northern part of the Gushing field, in the district south and east of Drumright, and in an area a few miles south of Shamrock. Generally it underlies a hard limestone, 10 to 20 feet thick, called by the drillers the " Layton lime," in contrast to the Layton sand, which is a soft sand stone not fully saturated with oil. The top of the sand is at many places barren and the "pay" generally lies in streaks, a condition probably due to differences in porosity and to intraformational bar riers caused by cross-bedding. The maximum thickness of the sand reported is about 100 feet, and the average of many reports is about 50 feet. At a few isolated points no Layton sand has been found. The sand is coarse grained, porous, and comparatively soft, and is fairly uniform in texture and porosity. In the Gushing field about 14 square miles of this sand produced oil and 12 square miles origi nally carried muchk gas. The oil obtained from the Layton sand is lighter than any other " Gushing crude," the Bartlesville rank ing next and the Wheeler last. The gravity of these three ranges from 38° to 43° B.
Jones sand. The Jones sand lies about 200 feet below the Layton sand and produces oil in commercial quantities only in a small, area on the south side of the dome in the north part of the field, although it contains a little oil and gas at many other localities. The sand at a few places is as much as 50 feet thick, although its average thickness is less, nearly all the logs examined reporting a thickness ' ranging from 15 to 35 feet.
Cleveland sand. About 100 feet below the Jones sand is the Cleve land sand, from which, so far as the writer knows, oil has never been produced in commercial quantities, although, like the Jones sand, it contains some oil and gas at many localities. The Cleve land sand is thinner than the Jones sand and is not reported in some logs. Its thickness ranges from a few feet to 30 feet.
Wheeler sand. From 600 to 900 feet below the Layton sand is the next commercially productive formation, known as the Wheeler sand, named from the Wheeler farm, which is a short distance northeast of Drumright, where it was penetrated by the first well drilled in the Gushing field. This sand is one of the most uniform in the field in thickness. It includes the overlying " Wheeler lime,"

STBATIGBAPHY. 15
from which it is separated by a shale " break " ranging in thickness from 50 to about 100 feet. The lower sandy member is correlated by the drillers with the "Oswego lime" of north eastern Oklahoma and south eastern Kansas. It is a coarse-grained, brownish limestone that includes po rous or sandy layers which contain the oil. The part below the. shale "break" is more porous than the part above it and comprises about half the formation. At some places the limestone above the shale "break" carries gas in commercial quanti ties, and at others, on the sides of the folds, it carries water.
The shale "break" be tween the two members ranges in thickness from 5 to 25 feet. In the Gushing field about 11 square miles of the Wheeler sand pro duced oil, and about 21 square miles produced gas exclusively. The Wheeler sand, like the Layton and Bartlesville sands, is not completely saturated.
Skinner sand. The Skin ner sand lies 250 to 400 feet below the Wheeler sand and is locally utilized for oil in the northern part of the Gushing field and at a few places near the center of T. 17 N., R. 7 E., southeast of Drumright.
FEET,.Pawhuska limestone
200
400-
600-
800
1,000-
1,200-
1,400
1,600-
1,800-
2,000-
2,200-
2,400-
2 ,£00'
Surface of ground
Fresh water
Fresh water
Fresh water
Salt water Salt water
Salt water
Layton lime"(some£as)BreakLayton sand (oil)
Jones sand
Cleveland sand (.some gas)
'Wheeler lime" (some)") Wh .- Break ^ gas/ lw "e_eJ ei> Sandy member (oil) J sana
Skinner sand
I Bartlesville^ > sand
^second payDry sand
^salt waterj
'Tucker sand (oil_)i water in bottom
FIGUBH 2. Generalized columnar section show ing the positions of the oil and gas sands.

16 GUSHING OIL AND GAS FIELD, OKLA.
Bartlesville sand. From 350 to 550 feet below the Wheeler sand lies the Bartlesville sand, the most productive oil sand in the Gush ing field. This "sand" ranges in thickness from a few inches to about 200 feet, and in porosity from compact brown shale to lenses of porous brown coarse-grained sandstone. In different wells it varies greatly in thickness, texture, and porosity and in its content of oil, gas, or water. In some wells in the northern part of the field it attains a thickness of over 200 feet, and one part of the sand may be " dry," another part may carry great volumes of gas under tremendous pressure, still another part may furnish great quantities of oil, and others may be filled with salt water. These so-called "streaks" are probably due to differences in porosity and appar ently occur in no regular order, salt water under great pressure be ing found in some wells above excellent oil " pay," below which more water may be found, and below that more " pay." Notwithstanding these facts the sand has been immensely productive, though its yield has not been so great as that which might be expected from a body of sand so thick, for the real " pay " may form only a small per centage of the total thickness of the sand. The total oil and gas area in the Bartlesville sand is about 20 square miles, of which but 2 square miles carries gas only.
Tucker sand. The Tucker sand lies from a few feet to about 200 feet below the Bartlesville sand, and is thought by some to be a part of that sand. The principal area in which oil is produced from the Tucker sand lies near Drumright and is not large. This sand is uni form in porosity, medium grained, and blue or bluish green, and although its average thickness is perhaps less than that of the Bar tlesville, not enough wells have been drilled through it to determine this question. Many of the logs show that the Tucker sand is sepa rated from the Bartlesville sand by a thin bed of green shale, which is recognized by the drillers as a " marker."
STRUCTURE.
DEFINITION OF GEOLOGIC STRUCTURE.
For the benefit of the reader who is not a student of geology, it may be stated that the term " geologic structure " means the form of the rock beds the way in which they are folded or broken. Trough- like downfolds of the beds are called synclines; arches or upfolds are called anticlines or domes, the term used depending on their form. The angle between a sloping rock bed and a horizontal plane is called the angle of dip, and this angle may be expressed in degrees or in the number of vertical feet the bed slopes in a mile. A place at which the dip of the beds becomes more nearly flat is called a "terrace." An anticline may have high places or domes along its

U. S. GEOLOGICAL SURVEYBULLETIN 658 PLATE VI
R.7E LEGEND
(.Giving depth of sand below sea levelcontour interval 100 feet)
Area in which sand yields
Initial production100^500 barrels daily, light stipple1WJ-&W oar-ret* ttw,«,w , vvy , vv ~^,,,. r -_
More tfwwt 500 barrels daily, heavy stipple
(Giving depth of sand below sea level;contowr interval 100 feet]
Area in which sand yields
Mare than 100 barrels daily
(.Giving depth of sand below sea level;contour interval 100 feet)
Area in which sand yields
Initial production1,000-S.OOO barrels daily, light stipple
More than $,000 barrels daily, heavy stipple
R.7 E
SKETCH MAP OF THE GUSHING OIL FIELD, OKLAHOMAShowing the general structure of the Layton, Wheeler, and Bartlesville
sands, the distribution of oil and gas in each sand, and initialproduction of certain areas
By Carl H. Beal
1 3 MacsDatum is mean sea level
1917

STRUCTURE. 17
axis, the axis being the line along which, the beds are folded. The low place on the axis of the anticline between two domes or high places is called a " saddle."
VALUE OF A KNOWLEDGE OF GEOLOGIC STRUCTURE.
For various reasons, some of which are not yet thoroughly under stood, oil ordinarily accumulates in the higher parts of anticlines and domes, and experience has taught oil men and geologists that synclines are more likely to contain salt water than oil. Thus the ultimate success of the operator in most of his test drillings depends on the form or structure of the beds beneath the place at which he drills, and he should therefore learn the location of the synclines and anticlines before drilling. The careful work of an experienced geologist is thus of great assistance to the operator, for if sufficient data are available the geologist is able to determine the structure of any region. No geologist can forecast with certainty in advance of drilling that oil ojr gas will be found at any particular place, but by careful work he is able to locate the places that are structurally the most favorable for the accumulation and the retention of oil and gas. The final and most important testimony is that recorded by the drill, ond the claim by any one that he can certainly locate oil or gas should be looked upon with suspicion.
Although a capable geologist is of invaluable aid in selecting ter ritory favorable for drilling, his work should not end after the first well is drilled, especially in a field as irregular as the Gushing, where the Bartlesville sand, the chief producer, is uneven in thickness, irregular in porosity, uncertain in minor structures and. in rich " pays."
RELATION OF INITIAL PRODUCTION TO STRUCTURE.
The attitude or form of the beds of rock the structure is among the things first to be considered in drilling for oil, and one of the objects of this report is to show the practical man the value of drill ing "on structure." The initial production of a large number of wells drilled to the three sands studied has accordingly been plotted, and lines have been drawn to outline the areas where the wells had certain initial production (Pis. VI-IX). ^Representative areas of each sand show that most of the places of greater initial production are on domes or anticlines or that they correspond in part at least to areas on the sides of the folds, where both oil and gas are found in the same sand. This fact is interesting, as many of the areas in the Layton and Wheeler sands that produce much oil occur down on the western side of the anticlines whose higher parts are completely
86503° 17 Bull. 658 2

18 GUSHING OIL AND GAS FIELD, OKLA.
filled with gas (Pis. VII-IX). The prolific areas of Layton oil near Drumright and in the southern part of the field conform closely to areas wherein oil and gas occur together in the same sand (PI. VII). On one side of the area of high-oil production, oil wells with smaller initial production are found without any marked amount of gas, whereas on the other side gas occurs without oil. The high initial productions from the Layton sand on the Dropright dome occur mainly on the north and northwest sides of the dome near the area where both oil and gas are found in the sand. The same relation is shown where oil and gas are found together in the Wheeler sand (PL VIII).
The areas of higher initial production of the Bartlesville sand east and southeast of Drumright are on the crests of nearly all the arches in that sand, where the oil and gas occur together (PI. IX). The areas of large initial production in the Bartlesville sand on the Dropright dome coincide very closely with the structural crests and the initial production of areas outside the line inclosing wells with initial pro ductions below 1,000 barrels a day drops off very rapidly on the flanks of the folds. In the area east of Drumright the line inclosing wells of initial production exceeding 3,000 barrels was not drawn, because not many wells that were so productive were found in this area. The line inclosing an area in which the initial production of wells is 1,000 barrels has been drawn, however, and this area incloses not only the dome that stands about 4 miles from Drumright but also the top of the flat anticline between this dome and the town of Drum- right. These lines of initial production were not drawn in other parts of the field because of the lack of information and because they have not been considered necessary, for the map of the surface structure (PI. V), which shows also the productive oil wells and the limits of production, indicates very exactly the intimate relation of production to geologic structure. If a geologist had entered this field prior to its development for the purpose of reporting on the probable value of the land for oil and gas, he probably would have chosen most of the territory now so thickly covered by oil wells as the productive part, for it conforms well with the upf olds of the outcropping beds, except, possibly, in the western part of the Wheeler terrace.
GRAPHIC METHOD OF REPRESENTING STRUCTURE.
The geologic structure or form of a rock bed can be best shown graphically by drawing a map bearing structure contours that repre sent lines of equal elevation of the bed. All points traversed by one of these lines are the same distance above or below sea level or some other chosen datum plane. For example, on a map where the contour interval is 25 feet, such as Plate V, all points on a certain

STRUCTURE. 19
contour line are 900 feet above sea level, all points on the next higher contour line are 925 feet above sea level, all points on the third suc cessive contour line are 950 feet above sea level, and so on. The inter val between the lines the contour interval is thus 25 feet. The reader may obtain a fanciful conception of this device by imagining that all the formations have been removed above the bed contoured and that he is walking on this bed, keeping at all times a certain distance above sea level. The level course that he thus takes marks a contour, every point on which has the same elevation. The number of contours in a given space is thus determined by the steepness of dip. The con tours thus drawn are of service in determining the places that are structurally favorable to the accumulation of oil and gas, because they show the location, size, and form of the arches and downfolds in the rocks, and anyone who has learned to read such structure maps is able to obtain at once a clear conception of the folding in the district which they represent.
In a region where the formations are deposited in nearly parallel layers the folds that occur in oil sands can be inferred from the folds that occur in the surface formations. The structure of some prominent rock bed on the surface that can be easily followed is approximately the same as the structure of the underlying beds, so that in order to determine the structure of an oil sand before any wells have been drilled the geologist first determines the structure of the surface beds. The structure of the surface beds may or may not be exactly the same as the structure of the oil sand, but in regions like the Mid-Continent field the two are in some degree con cordant, so that a detailed map showing the structure of the surface beds is an excellent guide for prospectors. The value of a map of this sort may be seen by referring to Plate V, which shows the surface structure of this field as it was determined before much drilling was done and the limits of production of oil and gas.
The difference between contours drawn on the top of a rock bed that is here and there exposed at the surface and contours drawn on the surface of the ground itself should be clearly understood. The former show the form of the folded rock bed; the latter show the actual configuration of the earth's surface.
DETERMINATION OF THE STRUCTURE OF BEDS EXPOSED AT THESURFACE.
The form or structure of a bed that is widely exposed at the surface in the Mid-Continent field is ordinarily determined by tak ing its elevation at many points where it is exposed. A persistent bed whose varying elevation is thus determined is called a "key bed," because it thus gives a key to the elevation of other beds that throughout the filed lie at nearly equal distances below or above it.

20 GUSHING OIL AND GAS FIELD, OKLA.
At some places this key bed dips below younger beds; at others it has been eroded away; and if the geologist wants to know the former elevation or the present elevation of this key bed at these places, he may learn it by determining the elevation of some other bed that throughout the field lies at a uniform distance above or below the key bed, and by deducting from or adding to the elevation of the bed observed the number of feet representing the interval between that bed and the key bed. In this way he reduces to figures applying to a single bed or stratum all elevations thus determined. After he has determined the elevation of a sufficient number of points on the key bed and plotted them on a map he can draw contour lines through points representing places of equal elevation above sea level, and thus prepare a map showing the form or structure of the bed plotted and by inference the form of other beds that lie at equal distances above or below it. By this method the surface of the Pawhuska limestone, which crops out over part of the Gushing field, as shown on Plate V (in pocket), was determined. The contours drawn on this bed represent vertical intervals of 25 feet, and each contour represents a continuous line having a certain elevation in feet above sea level the elevation indicated by the figures marked on it.
DETERMINATION OF UNDERGROUND STRUCTURE.
The maps forming Plates VII, VIII, and IX (in pocket) show the folding the form or structure of the series of beds in the Gushing field. If there is no angular unconformity or thinning or thicken ing in the beds of the series the structure shown by these maps should be essentially like that of the surface bed. In preparing these maps the surface elevation and the logs of nearly all the wells in the Gush ing field were obtained, and the elevation of each well was then sub tracted from the depth of each sand given in the log of that well, the difference being the depth of the sand below sea level. After the elevations of the oil sands were plotted on a map, contours were drawn in the same way that they were drawn to determine the struc ture of the surface key bed. Obviously the accuracy of the struc ture contours on maps of this sort depends upon the accuracy of the logs and the well elevations, and inasmuch as a large number of the well elevations were obtained from different companies it is pos sible that they contain discrepancies and minor errors. Errors may also occur in the interpretation of the structure of a sand where it is discontinuous or where more than one interpretation of the data at hand is possible.
Contour maps of the principal producing sands in the Gushing field the Layton, Wheeler, and Bartlesville sands have been pre pared. (See Pis. VII, VIII, and IX.) These maps show the struc-

STRUCTURE. 21
ture of the sands, the distribution of oil and gas in each sand, the areas of higher initial productions, and the contours on the water surfaces in the three principal sands.
The structure map of the Layton sand was prepared by taking the drillers' measurements to the Layton sand and not those to the " Lay- ton lime," which lies a few feet higher, but on the map showing the structure of the Wheeler sand the contours were drawn on the "Wheeler lime" and not on the lower sandy member, the term " Wheeler sand " as here used including the " lime " and the " sand."
Wherever the calculations made from the log of one well showed a marked change in structure that was not indicated in the logs of the neighboring wells, it has been assumed that the log or the well ele vation is inaccurate, and the contours have been drawn as if the change indicated did not exist. If the logs of more than one well showed a change in structure, however, it was considered in draw ing the contours.
STRUCTURE IN THE GUSHING FIELD.
GENERAL FEATURES.
The sediments that formed the rocks in the Gushing field are of Carboniferous age and were deposited in Pennsylvanian time. These sediments were laid down over a large area in almost horizontal layers that are now alternating beds of sandstone, shale, and lime stone, some of which are carbonaceous and are supposed to have con tained the material that formed most of the oil found in Oklahoma.
After the beds of the Pennsylvanian series were laid down, the Ozark Mountains in Arkansas, Missouri, and northeastern Oklahoma were formed by an uplift that gently folded the rock beds into arches and depressions, the general direction of the dip of the beds being away from the center of the uplift or, in general, toward the west or northwest. The uplift of the Wichita, Arbuckle, and Ouachita Mountains has doubtless influenced to a slight extent the folding of the rocks in this part of Oklahoma.
The dominant structural feature in the Gushing field is a broad north-south anticlinal fold along whose axis there are domes and along whose sides there are many subsidiary folds and irregulari ties. (See cross sections A-B and C-D, PI. V, in pocket.) This great fold is one of the largest structural features in Oklahoma. The con tours of the three oil sands are very irregular and differ locally from the contours of the surface rocks, although the general structure axes are practically identical. Each sand in the field exhibits small irregu larities that apparently bear no definite vertical relations to each other; for example, the Bartlesville sand may have in it a small dome that has no counterpart in the Layton and Wheeler sands. On the other hand, one of the upper sands may have small structural features that do not occur in the lower sands. The differences may be due to

22 GUSHING OIL AND GAS FIELD, OKLA.
inaccuracy of the logs, as the drillers in some parts of the field have seldom made accurate measurements to any but the Bartlesville sand, or they may indicate actual irregularities in the structure of the sands, due to crumpling.
Not only do minor irregularities exist in the structure of the three~ sands, but at a few places the structure of one sand is radically dif ferent from that of the other two, although all may possess the same general structural features. In every part of the field the surface beds (PL V) are folded much less than any of the underground beds.
The large dome in the northern part of T. 18 N., R. 7 E., has already been called the Dropright dome,1 and three other domes have also been named 2 the Mount Pleasant dome, the crest of which is in the northeastern part of T. 17 N., E. 7 E.; the Drumright dome, which centers in sec. 33, T. 18 N., R. 7 E.; and the Shamrock dome, a large dome whose crest lies near the center of T. IT N., R. 7 E.
Another dominant structural feature to which reference will often be made is the large saddle between the Drumright and Dropright domes, for which the name Wheeler saddle is proposed. The Wheeler sand has been extremely productive on rather a prominent terrace south of Drumright, iand for this structural feature the name Wheeler terrace is suggested.
The saddle near the south edge of T. 17 N., R. 7 E., just south of the Shamrock dome, will be called in this bulletin the Shamrock saddle.
DROPRIGHT DOME.
Surface structure. The Dropright dome (PI. V) is one of the largest structural features in the Gushing field, occupying about 10 square miles.
The surface structure is simple. The crest of the dome lies on the east side of sec. 17 (PL III), and the formations dip in every direc tion away from the crest, but most steeply toward the east. Measure ments made northeastward from the crest of the dome to a point less than a mile distant and from the crest of the dome to the bottom of the syncline, about 1^ miles distant, show dips of about 125 feet and over 175 feet, respectively. On the crest of the dome the "key bed," the Pawhuska limestone, which has been removed by erosion, would have an elevation of about 1,050 feet above sea level. From the crest an anticlinal axis extends a little east of north into the southern part of T. 19 N., R. 7 E. All sands in this anticline except the Wheeler have been extremely productive'of oil. An other anticline extends northwestward from the crest of the dome
1 Buttram, Frank, The Cushing oil and gas field, Okla.: Oklahoma Geol. Survey Bull. 18, p. 21, 1914.
2 Idem, pp. 22, 23.

STRUCTURE. 23
but plunges more abruptly and is broader and shorter than the one that extends northeastward.
Layton sand. The highest contour on the Layton sand on the Dropright dome (see PL VII) is 400 feet below sea level. The crest of the dome is divided into two parts, one of which is in the NE. \ sec. 17, the other in the NW. \ sec. 16, T. 18 N., K. 7 E. From the latter the Layton sand dips steeply to the east, there being a differ ence of about 200 feet in its elevation within half a mile. In the Dropright dome the Layton sand has much stronger relief than the surface beds and "a much steeper dip between the crest of the dome and the syncline on the east. The Dropright dome includes many subsidiary domes and many small "noses." Depressions in the Layton sand occur here and there on this dome, but the general structure is the same as, that of the surface beds, and, of course, these minor irregularities may occur in the surface beds, though it. was impossible to detect them.
Wheeler sand. The structure of the Wheeler sand (PI. VIII) on the Dropright dome is in general similar to that of the Layton sand, and the folding of the two is about the same, except that the east dip of the Wheeler is 100 feet greater in three-quarters of a mile than that of the Layton. ^
The top of the dome is broader and larger in the Wheeler sand than in either the Layton sand or the surface beds. The crest in the surface beds lies about a quarter of a mile southeast of the corre sponding crest in the Layton sand. The dome is divided into two flat-topped parts, the eastern lying along the line between sees. 16 and 17, the western along the line between sees. 7 and 8. The crest of the higher or eastern part is less than 1,075 feet below sea level; that of the lower or western part is less than 1,125 feet below sea level. The western part has itself two crests, the southern standing just north of the common corner of sees. 7, 8, 17, and 18, the other about half a mile northeast of that corner. Lower down on the sides of the dome there are several other irregular domelike struc tures in the Wheeler sand.
Bartlesville sand. The area of the dome in the Bartlesville sand (PL IX) is about the same as that in the Wheeler. In place of the two principal crests in the Wheeler sand there are three, all between 1,500 and 1,525 feet below sea level, arranged in a general northwest- southeast line and separated by depressions that extend northeast ward. The southeastern crest is in the E. £ sec. 17. It is slightly east of the eastern crest in the Wheeler and is much less pronounced. The middle crest lies in the SW. \ sec. 8, a quarter to a half mile west of the double-crested eastern dome in the Wheeler. The north western crest is on the line between the N". £ sees. 7 and 8, half

24 GUSHING OIL AND GAS FIELD, OKLA.
a mile a little east of north of the northern crest of the western dome in the Wheeler. In the Bartlesville, as in the higher sands, there are structural " bumps " on the side of the general uplift, but they are smaller than the features already described. In the Drop- right dome, though not elsewhere in the field, the Bartlesville sand, except at a few places, is less steeply folded than either the Layton or the Wheeler sand but is more steeply folded than the surface beds.
Elevation of sands. The relations of the folds in these sands are shown in the following table:
Elevation in feet of highest contour on crests of four folds in the surface bed, the Layton sand, the Wheeler sand, and the Bartlesville sand, and the dip in different directions from the crests.
[+, above sea level; , below sea level.]
0
Surface beds. ...................
Dropright dome.
Elevation of crest.
+ 1,050 - 400 -1,075 -1,525
Amount of dip.
2$ miles northeast of crest along
anticline.
100 225 225 175
1J miles west of crest.
150 175 200 200
f mile east of crest.
125 o250 o350
200
Shamrock dome.
Elevation of crest.
+1,125 - 325 -1,150 -1,550
Mount Pleasant dome.
Elevation of crest.
+1,100 - 275 -1,100 -1,450
Amount of dip.
2i miles west of
crest.
150 300 350 350
4 miles west of crest.
225 425 475
6475
Jmilesouthwest
of crest.
75 325 325 325
f mile northeast of crest.
75 325 400 400
Amount of dip.
1| miles west of crest.
135 325 175 325
Jmile east of crest.
60 250 200 250
Anticline in north ern part of T. 16 N., R, 7 E.
Elevation of crest.
+1.050 - 400 -1,325 -1,700
Amount of dip JmJle east of crest.
50 75 50
100
o Part of vertical distance estimated.b Part of horizontal and vertical distances estimated.
WHEELER SADDLE.
The Wheeler saddle lies between the Dropright and Drumright domes in the surface beds and is bounded on the northeast by a bowl- shaped structural depression over 30 feet in depth. Except for this depression the structure of the Layton and Wheeler sands is practi cally the same as that of the surface beds. The lowest point on the top of the Layton sand is about 575 feet below sea level. As the Bartlesville sand contains water on this saddle and as not many wells have been drilled to it, no map of that sand as it occurs in this saddle can be compiled.

STRUCTURE. 25
DRUMRIGHT DOME AND NEAR-BY STRUCTURAL FEATURES.
Surface leds. The Drumright dome (PL V), in the southern part of T. 18 N., K. 7 E., is separated from the Dropright dome by the Wheeler saddle and is a part of the general structural complex that includes the Mount Pleasant dome the crest of which lies about 2 miles to the southeast. In the surface beds this dome is by no means so well developed as the Dropright or the Mount Pleasant dome. Its highest contour stands 1,025 feet above sea level, and a saddle about 20 feet lower lies between this crest and the Mount Pleasant dome.
The surface beds in this part of the field dip gently to the west from the Mount Pleasant dome about 225 feet in 4 miles, but the normal western dip in the Laytori5, Wheeler, and Bartlesville sands is interrupted along a line extending southwestward through the Drumright dome, where these sands rise over an anticlinal fold. From the crest of this fold these three sands continue their westward slope, dipping 425, 475, and 475 feet, respectively, in a distance of 4 miles measured westward from the Mount Pleasant dome.
Layton sand. On the fold extending southwestward from the Drumright' dome the Layton sand (PI. VII) is broad and very pro ductive. It plunges southwestward for 2| miles and dies out. North west of this fold and parallel with it is a much smaller fold which, plunging southwestward from the Drumright dome, passes through the town of Drumright and dies out near the west line of T. 17 N., R. 7 E.
Wheeler sand. In the Wheeler sand (PI. VIII) the larger fold does not plunge so far to the southwest as it does in the Layton sand but turns southward and connects in a broad, flat-topped anticline with the Shamrock dome.
Bartlesville sand. The Bartlesville sand (PL IX) is folded much the same as the Wheeler, but the anticline that connects the plunging fold with the Shamrock dome is broader and is interrupted here and there by flat-topped domes. The Bartlesville and Tucker sands in these domes have been extremely productive.
MOUNT PLEASANT DOME.
Surface beds. The Mount Pleasant dome (PL V) lies farther east than any other structure in the Gushing field and, with the exception of the Shamrock dome, stands the highest above sea level. The highest contour on the Mount Pleasant dome is 1,100 feet above sea level, or 50 feet higher than the highest contour on the Dropright dome and 75 feet higher than the highest on the Drumright dome.
The crests of the Mount Pleasant dome in the three different sands coincide very closely, but the surface beds form an anticlinal fold

26 GUSHING OIL AND GAS FIELD,. OKLA.
that plunges rather steeply toward the southeast. About 1£ miles northeast of the Mount Pleasant dome is a syncline into which the surface beds dip a vertical distance of 100 feet from the top of the dome. The dome is bounded on the south and southwest by another. syncline, which is connected with the one on its northeast side. The beds on the south of the dome dip about 75 feet into this syncline. From the northern part of the dome the surface formations dip regularly to the west at the rate of 50 to 60 feet to the mile, except at a few places. There are very few surface indications of the irregu larities in the underground structure that have been disclosed by the wells drilled.
The oil sands. The structure of the Layton sand on the Mount Pleasant dome is somewhat like that of the surface beds, but the dip away from the crest is much Steeper. About three-fourths of a mile southeast of the crest of the dome the Layton sand flattens out into a terrace and a small dome. This feature is repeated in the Wheeler sand, which is very similar in structure to the Layton sand, but the Bartlesville sand shows not only this subsidiary dome but another of about equal size, which lies near tha center of the NE. £ sec. 11, T. 17 N., R. 7 E. (See table on p. 24.)
WHEELER TERRACE.
Except in an area near the west line of T. 17. K, R. 7 E., and a few small "noses" here and there, the Wheeler terrace is by no means so pronounced in the surface as in the underground beds, This surprising fact was brought out in the compilation of the under ground-structure maps. It is evident that the surface-structure map of the area near Drumright shows few facts which would indicate that the Wheeler sand in that area would be as productive of oil as it has proved to be.
SHAMROCK DOME.
Surface beds. Comparable in size to the Mount Pleasant dome is the structure called the Shamrock dome (PI. V), which stands near the center of T. 17 N., R. 7 E., and is bounded on the east by a large syncline. The highest contour on the Pawhuska limestone on this dome is 1,125 feet above sea level, 25 feet higher than that on the Mount Pleasant dome, and is the highest in the Gushing field. The eastern dip between the crest of the dome and the syncline amounts to about 90 feet in 1£ miles. On the north the fold dwindles out into normal westward-dipping beds, but on the south it is drawn out in a long, plunging anticline, which begins to ascend as it crosses the township line between T. 16 N., R. 7 E., and T. 17 N., R. 7 E. The dip measured from the crest of the dome westward for about 2 miles amounts to 175 feet. In the next mile the dip flattens into the normal westerly dip of about 50 feet, or less, to the mile.

STBUOTUBE. ' 27
. The oil sands. The crests of the Shamrock dome in the Layton, Wheeler, and Bartlesville sands (Pis. VII, VIII, IX) are practically coincident and extend from north to south, but the crest of the surface structure appears to be about one-fourth of a mile farther west an appearance that may represent the facts or that may be due to a slight error in the determination of the surface structure.
The folding of the formations in this dome, with the exception of the Wheeler sand, becomes greater with increase of depth. (See table on p. 24.) In a distance of 1£ miles west of the crest of the dome the Layton sand dips about 325 feet, the Wheeler 175 feet, and the Bartlesville 300 feet. The surface beds dip but 135 feet. The east ern dip in about three-fourths of a mile in the Layton is 250 feet, in the Wheeler 200 feet, and in the Bartlesville 250 feet.
OTHER STRUCTURAL FEATURES.
In the northern part of T. 16 N., E. 7 E., an anticline in the sur face rocks extends northeastward across the township line just south, of the Shamrock saddle, the highest part apparently being at the southwest corner of sec. 3. This anticline is a southern extension of the folding that resulted in the Shamrock dome, from which it is sepa rated by the Shamrock saddle, the lowest part of which in the sur face beds lies probably not more than 10 feet lower than the crest of this fold. From the crest of this fold the anticline plunges rather steeply southwestward for over 2 miles and finally dies out. The syncline on the east is a little over a mile distant, and the dip from the southwest corner of sec. 3 to this syncline amounts to about 120 feet.
Although the surface beds show that the highest part of this fold lies near the southwest corner of sec. 3, drilling has proved that the highest point in the three sands contoured is about a mile north east of that point, although a sufficient number of deep wells have not yet been drilled west, east, and south of this fold to determine the exact differences in structure. The surface beds on the Shamrock saddle dip gently to the east and to the west from the top of the fold, but the structure of the Layton sand is in general that of a saddle but is much more irregular. A small dome occurs in the Wheeler and Bartlesville sands just east of Shamrock and on the west side of the Shamrock saddle.
Although there are faults in the Gushing field none have been drawn on the maps showing the structure of the oil sands or the sur face beds, because the structure can be explained without assuming the existence of faults.. A fault may exist on the Drumright dome in both the Layton and Bartlesville sands, and the northwestward- trending scarp on the north side of the Dropright dome in the Wheeler and Bartlesville sands may be due to faulting.

28 GUSHING OIL AND GAS FIELD, OKLA.
THE LAYTON-BARTLESVILLE INTERVAL.
ATTEMPT TO PREPARE A " CONVERGENCE MAP."
Geologic studies of the structure of some regions, especially a region where the rocks have low dips, show that the formations be come thinner or thicker in certain directions. The structure of an oil sand is ascertained by determining the structure of a " key bed," as explained on pages 19-20, but if the thickness of the beds between the " key bed " and the oil-bearing sand varies from place to place it becomes necessary to map that variation before attempting to determine the structure of the oil-bearing beds. Therefore a " con vergence map " is prepared on tracing cloth or paper by determining from available well logs the aggregate thickness of the formations between the "key bed" and the oil sand at a number of places in the area and by interpolating lines of equal interval, or "iso- chore " lines, to show how the beds converge and diverge. This trac ing is then superposed on the map of the surface structure, and wher ever the isochores cross the surface-structure contours the interval between the "key bed" and the oil sand at that point is deducted from the elevation of the " key bed " to obtain the elevation above or depth below sea level of the oil sand. After as many elevations as pos sible are obtained contours are drawn to show .the structure of the sand.
In the present investigation the thickness of the formations be tween the Lay ton and Bartlesville sands was found to be exceedingly variable, and as the structure of the Layton sand was so different from that of the Bartlesville and showed even greater variations from that of the surface beds, it was decided to construct a " convergence map " to determine if possible whether there is a regular increase or decrease in the interval between the Layton and Bartlesville sands. This determination would be of service in ascertaining the structure of the Bartlesville sand over rather large areas in which wells had not been drilled deeper than the Layton or Wheeler horizons.
Figures showing the Layton-Bartlesville interval in all the wells from which data were available were accordingly calculated and plotted on a suitable map, but the results were so irregular that it was found impracticable to construct a " convergence map." As the information had been assembled, however, it was decided to separate, from one another the areas where the intervals lay between certain limits and to record these on a map showing the structure of the Layton sand. (See PI. X.)
One of the results of this study has been to show that the distance between the Layton and Bartlesville sands increases gradually from north to south. The smallest interval recorded in the logs is 1)45 feet and lies on the west side of the Dropright dome; the largest

STRUCTURE. 29
interval is 1,366 feet, and lies about 12 miles southeast in the north ern part of T. 16 N., R. T E. The gradations between these limits are very irregular and are indicated on the map in irregular areas, all wells showing an interval of less than 1,050 feet being separated from those in which the interval is between 1,050 and 1,100 feet, which in turn are separated from the areas where the interval is be tween 1,100 and 1,150 feet, and so on.
DISTRIBUTION OF THE INTERVALS.
The principal area that includes wells showing an interval of less than 1,050 feet lies on the crest and the west side of the Dropright dome, and a smaller area, in which the wells show the same interval, is found on the east side of that dome. A large, irregular area that includes wells showing an interval of 1,050 to 1,100 feet lies princi pally on the crest of the Dropright dome, but includes a few small patches in the same locality. Three other areas that show the same interval lie east and southeast of Drumright. Many irregular patches that show intervals between 1,100 and 1,150 feet are found in the northern part of the Gushing field, the largest occupying a part of the crest and the northern slope of the Dropright dome as well as a narrow band that extends down the east side of the dome and curves around to the south side, where it occupies the greater part of the Wheeler saddle. Wells that show this interval are found also in a large area southeast and east of Drumright, the southwestern extension of which lies at about the middle of sec. IT, T. IT N., K. T E.
An area that shows intervals between 1,150 and 1,200 feet lies in the northern part of the field, mainly on the eastern side of the Drop- right dome. The area curves around the south side of the dome, trends thence southward over the Wheeler saddle, and, except for a space near the township line in which information was insufficient to determine completely its limits, completely surrounds the areas of lesser intervals lying east and southeast of Drumright. In the NE. £ sec. 22, T. IT N., R. T E., there is another area in which the interval is the same, and still another was determined from the logs of a few wells about 1£ miles east of Shamrock.
The areas in the northern part of the field that show intervals be tween 1,200 and 1,250 feet are small and are found in two patches on the east side of the Dropright dome, and in two other small patches on the south and southeast sides of that dome. Another small area in which the interval is the same lies southeast of Drumright, in sec. 8, T. IT N., R. T E., but a larger one extends from sec. 1, T. IT N., R. T E., southwestward to sec. 21, T. IT N., R. T E., and is continued in a northward-trending band south and southeast of Shamrock.

CO o
FIG
UR
E 3
. S
ketc
h s
ecti
on a
long
sou
th H
ne o
f T
. 18
N.,
R.
7 E
., th
roug
h th
e D
rum
righ
t do
me,
sh
owin
g th
e st
rati
gra
ph
ic
rela
tion
s of
th
e P
aw-
husk
a li
mes
tone
and
th
e L
ayto
n,
Whe
eler
, an
d B
artl
esvil
le s
ands
, th
e in
crea
se i
n th
e L
ayto
n-B
artl
esvi
lle
inte
rval
, an
d th
e in
clin
atio
n of
th
e w
ater
su
rfac
es.

STRUCTURE, 31
The areas that show intervals of 1,250 to 1,300 feet are irregularly distributed from sec. 1, T. 17 N., K. 7 E., southwestward and south ward to the vicinity of Shamrock, where they open out into a large area that extends southward nearly to the southernmost well drilled to the Bartlesville sand.
Most of the areas that show intervals of 1,300 feet and more lie south of Shamrock, but a few small areas are found in sees. 2 and 11, T. 17 K, K. 7 E.
RELATION OF INTERVALS TO STRUCTURE.
The map that forms Plate X shows not only that the interval between the Layton and Bartlesville sands is greater at the south end of the Gushing field but that a definite relation exists between the folds and the thickness of the beds in the interval, for the interval is generally less on the crests of the folds. For example, the interval between 1,050 and 1,100 feet lies on the crest of the Drumright dome (fig. 3), on the broad, flat-topped fold in the Bartlesville sand about 2 miles south of that dome, and on the Mount Pleasant dome. These areas are completely surrounded by areas showing an interval be tween 1,100 and 1,150 feet, which in tur.n are nearly surrounded by areas that show greater intervals and that lie farther down on the folds. The same relation is shown by the Shamrock dome, where areas that represent intervals between 1,150 and 1,200 feet lie on the crest and are completely surrounded by areas representing greater intervals. On the Dropright dome the relation is not so decidedly shown, though it evidently exists on the east and south sides.
POSSIBLE CAUSES OF DIFFERENCES IN FOLDING.
ITEMS CONSIDERED.
The relations indicated would naturally be expected if the Bartles ville sand is more steeply folded than the Layton sand, and to explain the difference in interval with relation to structure we must look to the causes of the difference in folding. It must not be thought, how ever, that the general increase from north to south in the Layton- Bartlesville interval can be attributed to differences in folding. This increase is undoubtedly due to the conditions under which the forma tions between the Layton and Bartlesville sands were deposited.
The differences in the folding may possibly be due to any one or a combination of two or more of the causes enumerated below.
1. The difference in resistance to compression of the hard and soft beds of which the formations in the Gushing fields are composed.
2. The lenticular form of the Bartlesville sand.

32 GUSHING OIL AND GAS FIELD, OKLA.
3. One or more unconformities between the surface beds and the Bartlesville sand.
4. Folding during deposition.5. Cross folding.
DIFFERENCE OF HARD AND SOFT BEDS IN RESISTANCE TO COMPRESSION.
Although the difference of the hard and soft beds in resistance to compression might account for some of the difference in folding in a region of gentle folding like this, it seems unreasonable to attribute to this cause an increase of 325 feet in thickness in a horizontal dis tance of a little over three-fourths mile, such as exists in sees. 2 and 3. T. 17 N., E. 7 E. Here the Layton dips 325 feet, the Wheeler 400 feet, and the Bartlesville 400 feet in that distance, whereas the sur face beds have a dip of but 75 feet.
LENTICULAR FORM OF THE BARTLESVILLE SAND.
It Jias been suggested that the Bartlesville sand may not be actu ally folded more than the other sands above it, but that the difference in interval is due to the thinning out of the Bartlesville sand around the edges of the anticlines and domes. At many places around the edges of the pools the Bartlesville sand " pinches out," and through out the field it is very irregular in thickness. In a well on the east side of the Dropright dome, in sec. 9, the 'Bartlesville sand is missing, and in sec. 4 the sand is "broken" that is, it is full of streaks of shale. On the west side of the same dome the sand " pinches out," and on the southwest side it is much thinner than it is. nearer the top of the dome. In sec. 28, T. 18 N., E. 7 E., it again thins out, and in the logs of several wells in sec. 33 it has been described as "dry" and "broken." The sand thins rapidly as it approaches the " water line " in the area south of Drumright. On the northeast side of the Mount Pleasant dome, in sees. 2 and 3, T. 17 N., E. 7 E., the sand again "pinches out" and is only 8 feet thick in one well in sec. 12. On the south, east, and west sides of the Sham rock dome the sand is either lacking or is thin and broken, and it becomes much thinner in the extreme southwestern end of the field, in sec. 8, T. 16 N., E. 7 E., and on both the southeast and northwest sides of the anticline in the northern part of T. 16 N., E. 7 E.
It thus appears that the Bartlesville sand at many places thins out toward the edges of the pool, but whether this thinning causes the apparent differences in folding depends upon the conditions under which the sand was deposited. If it was deposited in the form of a lens on an apparently flat surface, the differences in the interval at places where the sand " pinches out" or thins perceptibly might be attributed partly to this fact, because the thickness of the sand
STRUCTURE. 33
is at many places 130 to 200 feet. On the other hand, if all the dif ference in the interval is due to the lenticular form of the Bartles- ville sand, it would naturally be supposed that measurements from the Wheeler sand to the Bartlesville sand at many localities would show the increase in interval as well as measurements from the Layton to the Bartlesville sand, or, in other words, that the interval between the Layton and Wheeler sands would remain constant. The Layton-Wheeler interval, however, like the Layton-Bartlesville inter val, is greater around the edges of the domes and anticlines, a fact that can not be attributed to the " pinching out" of either sand, for the two sands are comparatively uniform in thickness throughout the Gushing field. The lenticular form of the Bartlesville sand is prob ably, therefore, only a secondary cause of the observed differences in the folding and in the interval in the Gushing field. The local conditions when this part of the Pennsylvanian series was deposited were certainly complex, and it would be difficult to determine just what effect the lenticular form of the sand has had on the interval and on the apparent discrepancy from place to place in the folding. Under some conditions of deposition it might have the effect of add ing to the interval, under others it might have the effect of subtract ing from it, but under still other conditions no effect whatever.
UNCONFORMITIES.
The lack of detailed logs of wells in this field has made it impos sible to construct cross sections to show the exact relations of the for mations that lie between the Layton and Bartlesville sands, and it is therefore impossible to state positively whether or not there are un conformities in these beds. If an unconformity should exist and the beds were folded before and after the break in sedimentation the difference in folding, so far as the Layton and Bartlesville sands are concerned, would be accounted for, but the difference in folding be tween the surface beds and the Layton sand is usually greater than that between the Layton and the Bartlesville sands (see table, p. 24), and although more than one unconformity may exist in the series between the surface beds and the Bartlesville sand, this alone can hardly have caused the differences in the folding and the interval.
FOLDING DURING DEPOSITION.
Were it not for the fact that in some parts of the field the Bartlesville sand is not folded so strongly as the upper formations, the differences in folding might seem to be due to folding along lines of weakness during the deposition of the beds, but if folding proceeded continuously during deposition, the Bartlesville sand would everywhere be folded more steeply than the other beds. But
86503° 17 Bull. 658 3

34 GUSHING OIL AND GAS FIELD, OKLA.
this is not true. (See table, p. 24.) In comparatively sharp folds the intervals shown between two beds by drilled wells are greater where the beds are penetrated on the slopes of the folds, but the folds in the Gushing field are gentle, and the Layton-Bartlesville interval would appear to be increased only a few feet in records of wells drilled on the beds that have the steepest dip.
CROSS FOLDING.
Many of the differences in folding may be due to cross folding. The regional forces that produced the larger features of the structure in the Gushing field acted from the east, for the axis of the general uplift extends northward. Among the most striking features of the structure of the three oil sands are the systems of local cross folds which have two general trends one about N. 40°-55° W. and the other about N. 35°-40° E.
One of the principal cross folds, which trends about N. 50° W., extends through the Mount Pleasant and Drumright domes. This fold is very evident in all the underground sands and also in the surface beds. (See Pis. V, VII, VIII, and IX.) The Dropright dome has been deformed by another parallel cross fold, which extends through its crest and forms a northwestward-plunging anti cline in the surface beds and in the three underground sands.
Another cross fold extends in practically the same direction through the Shamrock dome. This fold is not so pronounced in the surface beds and in the Layton sand as it is in the Wheeler and Bartlesville sands.
Another system of parallel cross folds extends about N. 35°-40° E. One of these folds is in ,the northern part of T. 16 N., R. 1 E., and is rather pronounced in all the sands contoured, although the Wheeler and Bartlesville sands show it more plainly.
Another line of cross folding, not quite so prominent, is in the Layton, Wheeler, and Bartlesville sands and extends about N. 40° E. through the Mount Pleasant dome. On this cross fold lie the crest of the Mount Pleasant dome and the high place on the large flat- topped area just northwest of the Shamrock dome.
Still another line of cross folding parallels this, extending about N. 35° E. through the Drumright dome. This fold is very prominent and prolonged in the Layton and Bartlesville sands, though its southwestward extension is not so plainly shown in the Wheeler sand.
A less prominent line of folding occurs in the Layton sand about a mile northwest of that just described and extends in the same direction through the Wheeler terrace and the southern part of the Wheeler saddle. The well records now available do not show that this small fold occurs in the Wheeler or Bartlesville sands.

RELATION OF OIL AND GAS TO STRUCTURE. 35
As the differences in folding can not reasonably be attributed solely to any one of the other causes stated, it is probable that they may have been produced by a combination of cross folding and the difference in resistance to compression of hard and soft beds.
RELATION OF OIL AND GAS TO STRUCTURE.
METHOD OF MAPPING.
The map represents the structure of the surface beds (PI. V), and the cross sections A-B and C-D on that map show how the surface beds are folded. This map was constructed from eleva tions taken on top of the Pawhuska limestone or on some other bed a known distance above or below it, in the way that any sur face-structure map is made before drilling has been done. The red line on the map incloses wells in which oil or gas has been found in any sand and shows that most of the productive areas conform to the arches and terraces in the rocks.
Plates VII, VIII, and IX (in pocket) show the areas of oil and gas in the Layton, Wheeler, and Bartlesville sands, respectively. These areas were determined by examining all the logs collected and by plotting from them on a map the contents of each sand encountered in each well. In some localities of minor commercial importance the areas determined may be wrong because some of the logs were incomplete and others were not available, but the map shows in general the shape and position of each area. The areas overlap in each sand and have narrow irregular strips in common, where both oil and gas were originally found in each sand. These strips sepa rate the strictly oil areas from the strictly gas areas.
LAYTON SAND.
Gas occurs in the Layton sand (see PI. IX) in an area that covers practically all the top of the Dropright dome. On the Wheeler saddle the Layton sand does not carry gas exclusively, but farther south, on the crest and eastern side of the Drumright dome, the sand is filled with gas. The western margin of this gas area extends southwestward roughly along the crest of the plunging anticline that terminates in sec. 8, T. 17 N., E. 7 E. The western boundary of the Layton gas then bears southeastward to sec. 16, and thence southward along the western flank of the Shamrock dome, the Shamrock saddle, and the anticlinal fold in the northern part of T. 16 N., E. 7 E. Practically all the Layton sand east of this line, including the Mount Pleasant dome, the Shamrock dome, the Shamrock saddle, and the anticlinal fold in the northern part of T. 16 N., E. 7 E., is filled with gas as far east as the water line.

36 GUSHING OIL AND GAS FIELD, OKLA.
The area in which both oil and gas are found on the Dropright dome forms a roughly circular strip around the sides of the dome, and the area that contains oil alone continues outward from this strip in all directions to the water level. The bulk of the oil pro duced from the Layton sand on this dome is derived from its north and northwest sides, but the oil extends on southward over the Wheeler saddle and joins the productive area on the Wheeler ter race in the northern part of T. 17 N., K. 7 E. In the Layton sand on the west slopes of the Shamrock dome and the fold in the northern part of T. 16 N., R. 7 E., oil is found in a narrow strip that extends southward and widens toward the southern end of the field into a highly productive pool.
A little oil has been found in the Layton sand on the east side of folds in T. 17 N., R, 7 E., and T. 16 N., R. 7 E., but only three small areas have thus far been commercially productive. One of these areas lies just south of the Mount Pleasant dome, another on the eastern flank of the Shamrock dome, and the third about a mile east of the crest of the fold in T. 16 N., R. 7 E. The initial production of wells drilled in these areas is low, and the total production of the wells in them is small as compared with that of the wells that tap the Layton sand on the west side of the field, in T. 17 N., R. 7 E., and T. 16 N., R. 7 E.
The lowest level at which gas alone was found in the Layton sand on the west side of the Dropright dome is about 525 feet below sea level, whereas the lowest corresponding level at places on the east side of the dome is about 550 feet below sea level. Much of the lowest gas on the east side is found as high as 450 feet below sea level.
On the west side of the field, on the Wheeler terrace, in T. 17 N., R. 7 E., the depth of the lowest gas ranges from about 500 to 550 feet below sea level, and on the west side of the Shamrock dome, the Shamrock saddle, and the fold in the northern part of T. 16 N., R. 7 E., the lowest gas remains fairly constant at a depth of 475 feet below sea level. On the east side of the field, in T. 17 N., R. 7 E., and T. 16 N., R. 7 E., however, the gas nearly everywhere rests on water, the surface of which ranges in depth from about 475 feet to 550 feet below sea level. The lowest oil on the west slope of the Dropright dome is about 575 feet below sea level, but the lowest oil on the north and northwest slopes is 650 feet below sea level. The lowest oil on the west side of the Wheeler saddle is nearly 650 feet below sea level, and the lowest on the east side is about 600 feet below sea level. The lowest oil obtained in commercial quantities on the Wheeler terrace lies 600 to 650 feet below sea level, and the high est oil on that terrace lies near the crest of the Drumright dome about 475 feet below sea level. The lowest oil on the west slope of the Shamrock dome lies about 600 feet below sea level and maintains

RELATION OP OIL AND GAS TO STRUCTURE. 37
this elevation to the southern extension of the field, where the lowest oil lies from 550 to 575 feet below sea level.
The map (PI. VII) shows that the distribution of the oil, gas, and water on the Dropright dome is in accordance with the anticlinal theory of oil accumulation as it was originally formulated, for gas occupies the crest of the dome, oil the flanks, and water lies below the oil. The arrangement of oil, gas, and water in the remainder of the field is different, as a great body of gas extends from the east side of the field, where it rests directly on water, westward over the crests of the folds to a line of uncertain elevation, where oil is encountered. From this line westward oil is found to the plane where " edge water " occupies the sand. Figure 3 (p. 30) shows this relation.
WHEELER SAND.
In the Wheeler sand (see PL VIII) on the Dropright dome gas is found almost exclusively, except in a small area about a mile south west of Oilton, where some oil has been obtained from the Wheeler sand. The Wheeler gas extends southward across the Wheeler sad dle and occupies all the Wheeler sand that lies between the eastern water level and a point just east of Drumright. The western bound ary of Wheeler gas extends southward from the vicinity of Drum- right for about 2£ miles and thence turns southeastward toward the Shamrock saddle. Most of the Wheeler sand on the Shamrock dome and saddle and on the dome in the northern part of T. 16 N., E. 7 E., is filled with gas even to the eastern water line", no oil, intervening.
The small area of Wheeler oil production about a mile southwest of Oilton has already been mentioned. The principal area of Wheeler oil begins on the extreme southwest side of the Dropright dome and extends in a narrow band, southeastward around the southern end of the dome and widens out to a large broad band that occupies a part of the crest and much of the western flank of the Wheeler saddle. At the township line near Drumright the band of Wheeler oil is over a mile wide, and north of Drumright where it occupies the Wheeler terrace it becomes still wider. Another area of oil pro duction from the Wheeler sand comprises less than half a square mile at the head of a syncline between the Mount Pleasant and the Shamrock domes. Still another area, a little larger, begins about a mile north of Shamrock and extends southward through the town, occupying also a part of the west slope of the dome in the north part of T. 16 N., B. 7 E. This area has not yet been drilled for oil, which may not occur there in commercial quantities.
Wherever gas lies above oil in the Wheeler sand, the plane sepa rating them is between 1,300 and 1,350 feet below sea level. The low est gas on the eastern side of the field lies at depths ranging from

38 GUSHING OIL AND GAS FIELD, OKLA.
1,300 to 1,400 feet below sea level. On the west side of the Wheeler saddle, the oil lies as far down as 1,425 feet below sea level, but on the Wheeler terrace the oil is as far down as 1,475 feet below sea level. The lowest oil found west of the anticline in the northern part of T. 16 N., K. 7 E., is about 1,450 feet below sea level.
BABTLESVILLE SAND.
The Bartlesville sand (see PL IX) varies to a greater extent in thickness than either the Layton or Wheeler sand, and contains many strata of different textures and porosities. The coarse sandstone layers are interlaminated with the fine sandstone layers, and the whole Bartlesville sand is often divided vertically into many parts by thin shale layers called " breaks." These breaks may be so thin as to be unnoticeable to the drillers, but they are nevertheless ade quate in thickness to form an effective barrier between the porous layers. Some of the porous streaks in the sand contain tremendous quantities of oil and are designated " pay streaks " or " pays." The volume and pressure of the gas in this sand were great on the crest of the Dropright dome so great as to interfere seriously with the drilling of wells that were being deepened to oil. Some of the gas had a pressure of over 1,000 pounds per square inch and an open- flow volume of more than 50,000,000 cubic feet per 24 hours. The volume of gas decreased on the slopes of the dome and only small oil wells were obtained near the edges of the productive area. The Bartlesville gas does not extend over the saddle south of the Drop- right dome, but it occurs with oil on the crest and east side of the Drumright dome, on the Mount Pleasant dome, and in a large area that extends from the Shamrock dome northwestward along the higher parts of the beds an area in which it apparently overlies the oil. This area lies on the eastern side of the principal oil area. On the south and southeast sides of the Shamrock dome gas under heavy pressure occurs in the Bartlesville sand above the oil, but on the west side of the dome less gas and more oil are found. On the crest and the east side of the anticline in the northern part of T. 16 N., R. 7 E., gas alone occurs in the Bartlesville sand, and open-flow meas urements made there run as high as 60,000,000 cubic feet daily and the rock pressure is over 1,000 pounds to the square inch. Large quantities of oil are found on the west side of this anticline.
On the north side of the Dropright dome the oil in the Bartles ville sand extends down to about 1,800 feet below sea level, but on the west side of the dome the plane between the oil and water is 200 feet higher. The same plane on the east side of the dome ranges from 1,650 to 1,800 feet below sea level.
On the sides of the Mount Pleasant dome the Bartlesville oil extends to depths of 1,650 to 1,750 feet below sea level, but on the

RELATION OF OIL AND GAS TO STRUCTURE. 39
west side of the field, in T. 17 N., E. 7 E., and T. 16 N., E. 7 E., the oil becomes progressively lower from 1,750 feet near Drumright to 1,850 feet at the south end of the field. On the east side of the field, in the northern part of T. 16 N., E. 7 E., Bartlesville gas under heavy pressure extends down to 1,775 feet below sea level.
TUCKER SAND.
Although the areas of oil in the Tucker sand are of great commer cial importance, they are so small as to be of very little value in the present study. Oil has been obtained in commercial quantities from this sand in a few wells in T. 18 N., E. 7 E., but the largest develop ment is in T. 17 N., E. 7 E., not far from Drumright, where, in an area of about a square mile, wells derive oil from this sand on the fold extending southwest from the Drumright dome.
In February; 1916, the Gypsy Oil Co. completed a well to the Tucker sand in sec. 5, T. 17 N., E. 7 E., which had a reported initial daily production of 14,000 barrels of oil, and as a result of the suc cess of this well many other wells have been drilled to the Tucker sand and many wells that had reached the Bartlesville sand have been deepened. A few wells on the Shamrock dome, a few in sec. 16, T. 17 N., E. 7 E., and about half of those on the Mount Pleasant dome have been deepened to the Tucker sand with successful results.
The Tucker sand yields oil only on the crests of the larger folds, in areas that are smaller in the aggregate than those which contain wells that reach any of the other sands because the sand is much more sharply folded. Gas under high pressure has been found in large quantities in the Tucker sand by a few wells drilled on or near the crest of the anticline in the northern part of T. 16 N., E. 7 E.
OCCURRENCE OF WATER.
Water is found in all the sands in nearly every well that has been drilled at points low down on the anticlines around the edges of the field except in a few wells sunk to the Wheeler and Layton sands on the west side of the Dropright dome and on the southeastern part of the Mount Pleasant dome, which have been reported dry. It seems rather peculiar that in these places the sands should be dry, but it is probable that the sands in such places are " tight." Water would not be noticed in a close or " tight" sand by drillers, even if it were present, whereas in the same horizon not far distant water would be noticed because the sands are less cemented.
PECULIARITIES IN DISTRIBUTION OF OIL AND GAS.
In a field where the sands were uniformly porous and the condi tions of folding and of accumulation were uniform one would think that the line which separates the oil or gas areas from the water areas

40 GUSHING OIL AND GAS FIELD, OKLA.
would follow a structure contour, but in the Gushing field this is not true, for in some places the areas that contain only water lie much higher structurally than in other places, a fact shown on Plates VII, VIII, and IX by the line dividing the areas that contain oil or gas from those that contain only water.
The evidence indicates that in general the oil and gas areas in an elongated dome, where folding is simple, extend farther down on the long axis of the anticline or dome than on the steeper sides. In other words, the area that contains water only occurs at a higher structural position on the steeper sides of an elongated dome than it does on its plunging axis. This fact is shown particularly well in the Layton sand on the Dropright dome; on the west side the water com pletely occupies the sand at a depth of 500 feet below sea level, whereas on the north side the oil extends down as far as 650 feet below sea level and also completely occupies the Wheeler saddle on the south side of the Dropright dome. The lowest point on the Lay- ton sand in the Wheeler saddle is about 575 feet below sea level, and oil extends down on the sides of the saddle to 650 feet below sea level on the west and 625 feet on the east.
The same condition is fairly well shown in the Layton sand on the Mount Pleasant dome, although this contains principally gas; on the steep southwest side of the dome the water completely occupies the sand at one place as high as 400 feet below sea level, and on the north east side the water lies about 500 feet below sea level; whereas on the southeastward-plunging axis of this dome the lowest oil lies about 550 feet below sea level. On the east side of the Shamrock dome the gas extends down to about 500 feet below sea level. On the north side of the same dome the lowest gas is found resting on water at 425 feet below sea level, but this figure may be inaccurate, as very few wells have been drilled in that vicinity. South of the Shamrock dome the Shamrock saddle is completely filled with oil and gas, although its lowest point is about 475 feet below sea level. The gas extends down on the east side of the anticline in the northern part of T. 16 N., R. 7 E., where the lowest oil and gas are about 500 feet below sea level, but on the southwest extension of this plunging anticline the lowest oil is about 575 feet below sea level.
Practically the same conditions were observed in the Wheeler sand on the Dropright dome, where the lowest oil on the north side of the dome lies about 1,375 feet below sea level; the highest water on the west side is between 1,275 and 1,300 feet below sea level, and on the east side it ranges from 1,300 to 1,400 feet below sea level. The Wheeler saddle is filled with gas and oil in the Wheeler sand. The highest point on the saddle lies between 1,325 and 1,350 feet below sea level, and the oil is found as far down on the west side of the saddle as 1,400 feet below sea level. Similar conditions exist on

RELATION OP OIL AND GAS TO STRUCTURE. 41
the Mount Pleasant dome, where the lowest gas on the southwest and northeast sides is about 75 feet higher structurally than the lowest gas on the southeastward-plunging axis.
This feature is plainly shown on the east side of the Shamrock dome, where the lowest gas rests on water at about 1,250 feet below sea level and the line separating the gas from the water extends southward, cutting across the structure contours to a point on the Shamrock saddle where the lowest gas lies 1,325 feet below sea level.
The same condition was observed in the Bartlesville sand on the Mount Pleasant and Dropright domes. The occurrence of this con dition in the Bartlesville sand on the Dropright dome is especially interesting because the Bartlesville sand on the Wheeler saddle is completely filled with water, and no accumulation of oil and gas on the Wheeler saddle modifies the shape of the oil and gas area in the Dropright dome. The lowest oil on the more gently dipping south side of the Dropright dome lies 1,725 feet below sea level. On the north side the lowest oil lies about 1,800 feet below sea level, whereas on the eastern and western sides, where the dips are steeper, the low est oil lies about 1,650 feet and 1,600 feet below sea level, respectively. The lowest oil in the Bartlesville sand on the steep southwest side of the Mount Pleasant dome is 1,700 feet below sea level; that on the northeast side of the dome ranges in depth from 1,675 to 1,750 feet below sea level. On the southeastern axis of the dome the lowest oil lies between 1,775 and 1,800 feet below sea level. The axis of the Mount Pleasant dome rises over the Drumright dome on the north west, the lowest point on the axis between the two domes lying from 1,600 to 1,625 feet below sea level. The sands along this axis are completely filled with oil and gas. In the northwesterly extension of the same axis from the Drumright dome the oil in the Bartlesville sand lies more than 1,875 feet below sea level. On the northeast side of the Drumright dome the lowest oil lies between 1,625 and 1,650 feet below sea level. The southwest side of the Drumright dome is complicated by folding and no information about it is available.
The Shamrock dome furnishes more information. On the north east and east sides the lowest oil lies from 1,700 to 1,725 feet below sea level, and oil fills the Bartlesville sand on the Shamrock saddle to the south, although its highest point lies about 1,775 feet below sea level. The line dividing the oil from the water on this side of the dome trends southward and crosses the structure contours to a point east of the Shamrock saddle, where the lowest oil is found be tween 1,800 and 1,825 feet below sea level. On the east side of the anticline in the northern part of T. 16 N., E. 7 E., the line between the gas and the water is about 1,775 feet below sea level, whereas on the southwesterly extension of this plunging anticline the lowest gas is about 1,825 feet below sea level.

42 GUSHING OIL AND GAS FIELD, OKLA.
Much detailed work might be profitably done, both experimentally and in the field, in connection with this interesting subject, which is obviously of great economic importance. If it can be determined that in domes and anticlines which are folded to a certain degree of intensity the oil is universally found lower on the long axes than on the steeper sides, this fact will be of great aid to geologists in the work of selecting lands for leasing, locating test wells, estimating oil content, and in considering the mode of accumulation of petro leum and natural gas. The present method of estimating the total oil content of an anticline or a dome after a few wells have been drilled in the middle of the productive area, and perhaps one or two into edge water, will necessarily prove inaccurate if the facts ob served in the Gushing field are found to apply to other similar fields, because the elevation of the surface of edge water not only may vary greatly from one end of a large field to another, but the oil in a dome that is unaffected by other large folds and minor undulations will extend structurally much lower on the axes than on the sides, a fact that would introduce a great error in computing the total oil held in the crest of the dome by edge water.
DIRECTION OF MIGRATION OF OIL, AND GAS.
The hydraulic theory of the accumulation of oil and gas is based on the assumption that the .hydrocarbons were concentrated by a body of water that moved through a sand, and although the deter mination of the direction from which the Gushing field derived its oil and gas is not the primary object of this paper, the relations of the oil and gas bodies in this region indicate that they migrated from the west or northwest, because most of the gas in the field lies to the east and most of the oil to the west.
LAYTON SAND.
Plate VII (in pocket), which maps the oil and gas in the Layton sand, shows that in the district east and southeast of Drumright gas occupies the Layton sand in the area stretching eastward from the top of the anticline that extends southwestward through the Drum- right dome over the Mount Pleasant dome to the eastern water line and that oil occupies the same sand in an area that lies west of the gas area and extends as far west as the western water line.
The same arrangement of oil and gas in the Layton sand occurs on the Shamrock dome, on the Shamrock saddle, and on the fold in the northern part of T. 16 N., R. 7 E., where nearly all the principal gas areas lie on the crests and the east sides of the folds and the oil areas lie on the west sides. With the exception of the Dropright

DIRECTION OF MIGRATION OF OIL AND GAS. 43
dome, only three areas on the eastern side of the field derive oil in commercial quantities from the Lay ton sand, and these areas lie.- respectively, on the south slope of the Mount Pleasant dome, on the east side of the Shamrock dome, and on the east slope of the anti cline in the northern part of T. 16 N., R. 7 E. Showings of oil have been found at many places in the Layton sand on the eastern side of the field, but the sand has produced only a small quantity of oil on this side of the field. Gas is obtained from the Layton sand on the crest of the Dropright dome, where it is surrounded by oil, but the heaviest production is obtained on the north and northwest sides of the dome.
' WHEELER SAND.
The features indicated are shown even more plainly in the dis tribution of gas and oil in the Wheeler sand. A broad band in which the Wheeler sand produces oil extends from the southwest side of the Dropright dome southward through the town of Drumright, broadens out on the Wheeler terrace south of Drumright into a rich pool nearly 2 miles wide, and terminates in sees. 19 and 20, T. 17 N., R. 7 E. East of this broad band is a still larger area in which the same sand produces gas, which except at one place occupies all favorable structural positions as far east as edge water. This ex ception is a small area, less than half a square mile, that lies chiefly in sec. 10, T. 17 N., R. 7 E., in which the gas is trapped at the head of the syncline that separates the Mount Pleasant dome from the Shamrock dome. North and south of Shamrock the oil in the Wheeler sand lies well down on the west side of the uplift extending southward from the Shamrock dome to the anti cline in T. 16 N., R. 7 E., though it has not been extensively devel oped, and the gas occupies the higher structural positions farther east and the eastern slopes of all the upfolds as far as the water line. In this area there is scarcely a trace of oil in the Wheeler sand.
On the Dropright dome the gas in the Wheeler sand is especially noticeable and in all the higher parts of the sand is under great pressure. Practically the whole of the Wheeler sand on this dome is occupied by gas except a small area of irregular structure in a part of sec. 5, T. 18 N., R. 7 E., where the oil, like that in the small area in sec. 10, T. 17 N., R. 7 E., has apparently been in some manner trapped and is almost surrounded by gas. Thus practically no oil has been produced from the Wheeler sand on the eastern side of the field.
BABTLESVILLE SAND.
Gas occupies the Bartlesville sand on the east side and crest of the anticline in the northern part of T. 16 N., R. 7 E., and oil occupies

44 GUSHING OIL AND GAS FIELD, OKLA.
it on the west side. On .the southeast side of the Shamrock dome gas is very plentiful in the Bartlesville sand, is under high pressure, and is accompanied by but little oil, but on the west side of the dome the sand contains more oil and less gas. The crest of the dome in the Bartlesville sand contains gas under high pressure but little oil. In all the higher structural positions in the district north of the Shamrock dome the Bartlesville sand contains gas and oil. Gas is associated with oil on the crest of the Dropright dome, and the area containing it is entirely surrounded by oil.
RESTJM&
The unusual distribution of oil and gas in the sands in the Gush ing field indicates that the source or gathering ground of the oil and gas was west or northwest of the field. The direction taken by them may be due in part to the fact that in the Gushing field, as in many other prolific gas and oil fields in northeastern Oklahoma, the domi nant structural feature is an anticline on a great monocline, the fold having a short east limb and a long west limb. The gathering area is therefore practically all on the west limb. Gas first fills up the crest of the fold and acts as a barrier between the water on the east side and the oil migrating up the west limb. The oil, on account of its slower rate of movement through porous rocks, collects after the gas and forms a pool against the gas on the west or long limb. Although the evidence presented does not conclusively prove this, the facts related have been presented in the hope that they may be of use to others who are interested in this subject. Certainly if other pools in the same province are studied with the same objects in view and similar facts are determined, many interesting and valuable con clusions may be drawn, which will ultimately have an important bearing on the problem of oil and gas accumulation in the Mid- Continent field.
WATER IN THE SAND.
CLASSIFICATION.
In a sand that contains water, oil, and gas, the oil and gas gen erally occupy the higher structural positions, but in a sand that con tains oil and gas but no water the oil and gas usually occupy the lower positions. In the Gushing field the three sands considered are satu rated with water, which holds the oil and gas in the higher struc tural positions in each sand.
Water that is ordinarily a source of trouble in an oil field may be divided into three classes (1) top water, which comes from a " sand " above the productive sand; (2) bottom water, which lies below the productive sand and is separated from it; and (3) edge water, which holds the oil and gas in the higher structural positions.

U. 8. GEOLOGICAL SURVEY
1
BULLETIN 668 PLATE XI
5
2000'
^ZOO
2000'
2800The numbers refer to depths and diameters of casings, respectively
SKETCH SHOWING HOW THE OIL IN SEVERAL WELLS HAS BEEN DROWNED OUT BY UNSYSTEMATIC CASING.
Diagram compiled from logs of five wells along a line in one of the most productive parts of the Gushing field.

WATER IN THE SAND. 45
TOP WATER.
The water in the Gushing field, except the shallow fresh water found at depths of 100 to 300 feet, from which the domestic and field supply is obtained, consists of salty and sulphurous waters that lie at different depths. The fresh waters do not ordinarily flow but stand about 100 feet from the surface. The force of gas, however, sends forth from some wells in the northern part of the field 5,000 or more barrels of water a day, a fact that has led some to believe that the water is artesian.
In the logs of many wells salt water has been recorded between the fresh water and the Layton sand, and also just above the tops of both the Layton and Wheeler sands.
Water is giving many operators in this field considerable Difficulty, which can not be attributed to edge water and which could have been avoided by reasonable cooperation between drillers and by proper methods of drilling and protecting the productive sands. Many wells have not been properly cased and packed. An example of bad packing and casing is seen in Plate XL In the Gushing field the operators of adjacent wells, through either indifference or ignorance, in their haste to reach the lower productive horizons, have failed to work in harmony with one another. Top water is thus allowed to circulate back and forth among the sands between two neighboring wells and to find its way into the main productive sands, which it floods. Many such floodings have occurred in the Gushing field, and nearly all of them have been due to a lack of foresight and of cooper ation among the operators and to their refusal to adopt methods that would protect the sands.
BOTTOM WATER.
In some oil fields the producing sand is separated from the water sand below by a bed of relatively impervious shale of varying thick ness, and great care must be exercised to stop drilling before this bottom water is reached, as in some places it is under great pressure, which makes its exclusion from a well difficult. The Gushing field is not much troubled with water of this sort, however, although many operators believe they have drilled into bottom water when they strike edge water. At some places water occurs under great pressure interstratified wi=th the oil and gas in the Bartlesville sand, and these streaks, which are separated by " breaks," or thin beds of shale, often lead the drillers to believe they have drilled into bottom water. There is an unusually large number of water streaks in the Bartles ville sand on the crest of the Dropright dome. Below and above these streaks at some places there is excellent oil and gas " pay," so that the operators, after producing first from the upper " pay," drill through the water into the.next "pay." Whether it was impos-

46 GUSHING OIL AND GAS FIELD, OKLA.
sible to case through this water or whether the operators considered it unnecessary, some of them failed to do so. Moreover, after a few days some of the heavy gas streaks " came on " water. Then, as the water, gas, and oil streaks had not been separated the water flowed into the well and " cut" the oil and in a short time drowned it out.
Many of the operators have attempted to shut off the water but with little success. It can seldom be shut out by setting lead plugs in wells, for the " shell" in which the plug is supposed to make a water-tight joint may be badly shattered or broken by the drill, by shooting with nitroglycerine, or by the tremendous force due to the expulsion of the oil, water, or gas. This unusual composition of the Bartlesville sand in the northern part of the Gushing field is there fore a serious obstacle to the economic production of the oil and gas.
EDGE WATER.
Top and bottom waters that occur in beds separated from the pro ducing sands by other formations have in a few wells been mistaken for edge water. A decrease in the oil content of a productive sand and especially a decrease in the gas pressure allows edge water to pass through the part of the sand that once was saturated with oil or gas, and although its advance may be temporarily retarded by various means, its access to the producing sands marks the end of every field that is " backed up by water."
Edge water usually encroaches on a field after much of the recov erable oil and gas have been obtained and after the gas pressure has become greatly reduced. Its encroachment can not be prevented, though it may be temporarily retarded by properly manipulating the tubing and pumps in the wells, by adopting certain cementing practices, or by forcing compressed air into the sand. In this way much oil may be obtained that would otherwise be lost.
Edge water has caused trouble in some wells in the northern part of the Gushing field and has led to the abandonment of many wells that tap the Wheeler sand on the Wheeler terrace. It has caused very little difficulty in wells in the southern part of the Gushing field, near Shamrock, and it has been reached by only a very few wells on the eastern edge of the field. Edge water advances rapidly in some parts of the Gushing field, probably on account of the rapid decline of the gas pressures, and wells that have ce'ased flowing are pumped with declining output, at length yielding a small settled production. The flowing life of the wells is short, and some wells in the Bartlesville sand with initial productions of 3,000 to 10,000 barrels daily soon decline to small pumpers. Wells that show this rapid decline are numerous. The average daily production of the

WATER IN THE SAND. 47
wells in a group in sec. 9, T. 17 N., B,. 7 E., during one month was 450 barrels each. Eight months later the same wells were making 45 barrels each. Another group of wells drilled early in the ex ploitation of the field at first yielded an average daily output of over 1,000 barrels each, but during the fourth month after they were drilled they yielded only a daily average of 44 barrels each. A year later the same wells were making 11 barrels each. The wells of a group on the Dropright dome averaged nearly 2,000 barrels a day each during the first month of their life, but after three months their daily output had declined to 190 barrels a day each. The history of nearly all the wells drilled to the Bartlesville sand during the "boom" is similar, and the decline in the output of the field as a whole has been remarkably rapid. .
The principal causes for the rapid decrease in production are the tremendous waste of gas during development due to improper con struction and operation of wells, such as inadequate casing and packing, and the practice of drawing without reserve on the oil and gas supply. The initial production of most of the Bartlesville wells was large, but the practice followed produced a rapid decline in the closed gas pressure, which is the motive force in expelling the oil, so that the decline in the output of the wells has been extraordinarily rapid, and the ultimate production of the properties will be much smaller than if the field had been developed wisely.
NECESSITY OP EXCLUDING WATER FROM THE OIL AND GASSANDS.
When the Layton and Wheeler sands no longer yield a profitable output the least productive wells are abandoned and plugged. Several such wells have already been so abandoned, especially in the area near Drumright, where most of the output was originally obtained from the Wheeler sand. If an abandoned well is properly plugged, it will not let water into a sand which may be producing oil and gas in a near-by well, but as an operator may not be able to determine when a well has ceased to be profitable he may tempo rarily cease pumping; and if the well is allowed to remain unpumped for more than a short time and it is making water, it soon becomes a great menace to all adjacent wells.
A prime necessity in the successful and economical development of an oil field, especially a field that is divided among a number of operators, is that the work be carried on uniformly and in close cooperation that is, that the casing points and other operations should be the same in wells on adjoining properties in an area hav ing the same geologic structure. (See PL XI.) If water is per mitted to come into contact with oil in a producing well the oil pres sure may at first exclude the water, but as the oil is reduced in volume

48 GUSHING OIL AND GAS FIELD, OKLA.
the pressure decreases and the water overcomes the oil, forming an emulsion which must be dehydrated on the surface to render it salable. The process of dehydration is not only expensive but it depreciates the value of the oil, because it drives off the more volatile constituents. The effect of the water on the quantity of oil produced may not be apparent in the first stages of its encroachment, but later the water will drive back the oil and replace it in the sand by ever- increasing encroachment until the well can no longer be worked profitably. Nor is the damage confined to the point where the water first enters; it progresses through the formation at a rate which depends mainly on the relative pressures of the oil, gas, and water, and the porosity of the sand, and eventually the oil will be trapped in minor irregularities in the sand, which are not likely to be reached by the drill.
The infiltrating water affects the gas the same as the oil, though more rapidly, because gas flows more readily than oil from a sand when replaced by water. A small quantity of water in the first stages of its intrusion in a gas sand can be handled by separating it from the gas by means of traps installed at the well. Later, however, the water will drive the gas back into the formation, trap it, and drown it out.
WATER SURFACES.
GENERAL CONDITIONS.
The expression " water surface " as here used denotes the level or inclined plane between the oil or gas in a sand and the edge water upon which the oil or gas rests. (See A, fig. 4.) This water surface must not be confused with the ground-water table, which in an undulatory region is not level and which is defined as the sur face below which the rocks are saturated with water. The ground- water table conforms in a measure to the undulations and to the bedding and nature of the rocks. The water surface referred to in this report is the surface that is confined to one porous stratum and might also be spoken of as the " water level," if it were not inclined. It might be further defined as the surface of the edge water which holds the oil and gas in the higher structural positions in a porous stratum.
In the course of the inspection work in Oklahoma many difficulties with water.were noted, and they were studied closely with a view of aiding the operators. It was decided at the outset to collect all avail able information about water and, if possible, to reach some conclu sions as to the rate and method of encroachment of edge water and the original and present levels of the water in each sand on all sides of the Gushing field.'
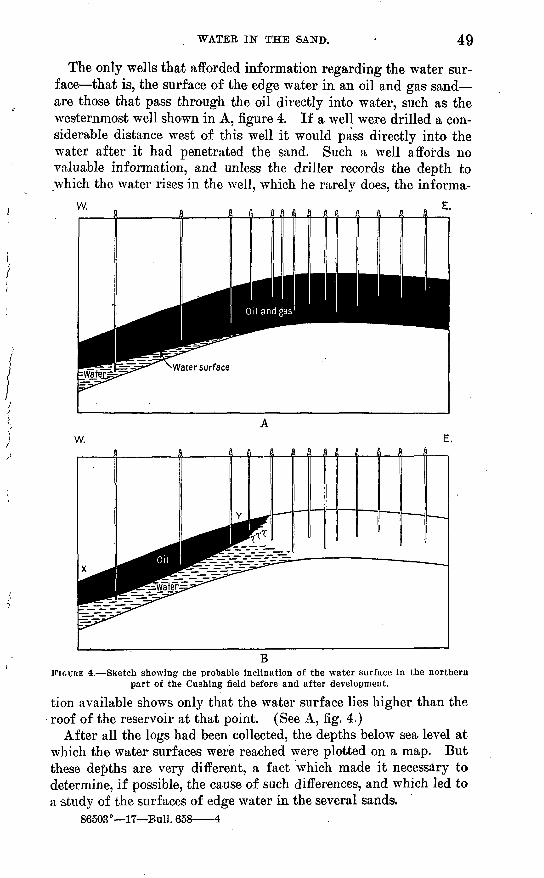
WATER IN THE SAND. 49
The only wells that afforded information regarding the water sur face that is, the surface of the edge water in an oil and gas sand are those that pass through the oil directly into water, such as the westernmost well shown in A, figure 4. If a well were drilled a con siderable distance west of this well it would pass directly into the water after it had penetrated the sand. Such a well affords no valuable information, and unless the driller records the depth to which the water rises in the well, which he rarely does, the informa-
. E.
FIGURE 4. Sketch showing the probable inclination of the water surface in the northern part of the Cushing field before and after development.
tion available shows only that the water surface lies higher than the roof of the reservoir at that point. (See A, fig. 4.)
After all the logs had been collected, the depths below sea level at which the water surfaces were reached were plotted on a map. But these depths are very different, a fact which made it necessary to determine, if possible, the cause of such differences, and which led to a study of the surfaces of edge water in the several sands.
86503° 17 Bull. 658 4

50 .GUSHING OIL AND GAS FIELD, OKLA.
As the height of the water in any sand may change materially in a few months after some of the oil and gas are taken from the sand, the date of completion of every well drilled to edge water was noted, and furthermore, as faulty methods of operation may allow inter communication between sands and may cause the oil and gas sands to be filled with top water, it was also necessary to consider the character of the operations.
The investigation has. disclosed some interesting facts which, if taken in connection with similar facts disclosed by studies in other fields, may help to solve the problem of oil and gas accumulation in the Mid-Continent field and may throw light on the rate and method of encroachment of edge water. Moreover, such detailed knowledge of the relations that exist between the oil and gas and the water in the same sand may enable geologists to determine more accu rately previous to drilling the underground conditions in similar fields.
The most important disclosure is the fact that the water surfaces upon which the oil and gas rest in the Layton, Wheeler, and Bartles- ville sands are not horizontal, and not only lie at different eleva tions on different sides of the domes but are also inclined away from the center of the upfolds, conforming roughly to the structure of the oil sand but not dipping so steeply as the roof of the reservoir in which the oil and gas are contained. (See fig, 3.) Not enough wells have been drilled to edge water, however, to determine the attitude of the water surfaces in all parts of the field. Plates VII, VIII, and IX show the inclinations of these water surfaces in the Layton, Wheeler, and Bartlesville sands. The interval between the contours, except those for the Bartlesville, is 10 feet. The data used in con structing the Bartlesville contours were insufficient to determine the location of all the lines, so only the lines representing depths of 1,750,1,800, and 1,850 feet below sea level were drawn for the north ern part of the field, where a line was drawn in the district east of Drumright to represent a depth of 1,870 feet below sea level.
These contours do not show accurately in detail the shape of the water surfaces in the sands; they show only the general form of the water surfaces; no attempt was made to make them conform to the irregularities in the structure of the sands. The only object in draw ing the contours has been to show that the surfaces of the edge water in the different sands are not level but are inclined away from the centers of production and structure. Many large errors may creep . into work of this sort, as all the information is obtained second hand or third-hand from the driller who made the observations, but the information used is believed to be sufficiently trustworthy to afford a substantial basis for the conclusions presented.

WATER IN THE SAND. 51
LAYTON WATER SURFACE.
By referring to Plate VII it will be seen that the Layton water surface conforms very closely to the geologic structure of the Lay- ton sand, the syncline on the north side of the Dropright dome and the anticline extending northeastward from the crest of the same fold defining the water surface very clearly. The water surface appears to be nowhere horizontal or inclined toward the center of the field.
The maximum dip of this water surface on the northwest side of the Dropright dome amounts to 100 feet in a little over half a mile. The dip from the north line of sec. 9, T. 18 N., E. 7 E., to a point due north as far as it was possible to obtain trustworthy information amounts to 90 feet in a mile. The dip on the east side of the Drop- right dome from the property of the Producers Oil Co., NE. I sec. 9, T. 18 N., E. T E., to the B. B. Jones well, in sec. 10, amounts to 100 feet, and the distance is approximately a mile. On the west side of the Wheeler saddle, where the most contours were determined, the dip amounts to about 90 feet in a mile.
In the Layton sand in the north part of T. 18 N., E. 7 E., and the south part of T. 19 N"., E. 7 E., the water occurs from about 660 to 700 feet below sea level. The water surface on the west side of the Dropright dome is variable, ranging from about 600 to 700 feet below sea level. In the Layton sand on the west side of the Wheeler saddle the water lies at depths below sea level ranging from about 620 to about 700 feet, the greater depths lying to the west. The in clination of the water surfaces in the Layton and Wheeler sands and the relation of the oil, gas, and water in the sands are shown in figures (p. 30).
The water surface in any sand on the sides of the Mount Pleasant dome could not be determined, and in the area east of Shamrock not many wells have been drilled into edge water. The water surface on the west side of the dome in the northern part of T. 16 N., E. 7 E., lies between 575 %nd 600 feet below sea level, which is the shallowest depth at which any edge water has been found in the Layton sand around the edges of the Gushing field. In this locality Layton oil was first struck in September, 1915, and it has been possible to determine two certain contours on the Layton water surface. Inas much as practically all the wells in this area were drilled within a very short period these contours probably show the original inclina tion of the water surface. The dip of the water surface amounts to about 20 feet in a little more than a quarter of a mile, and the con tours follow the geologic structure very closely.

52 GUSHING OIL AND GAS FIELD, OKLA.
WHEELER WATER SURFACE.
The information available as to the water surface in the Wheeler sand (see PI. VIII) was less than that compiled for the Lay ton sand. In the district west of the Wheeler saddle and on the Wheeler ter race, however, the water surface slopes toward the outer edge of the pool, as it does in the Layton sand around the Dropright dome, and if more wells had been drilled to water in the Wheeler sand the results determined would probably have been as great as those reached for the Layton sand. The Layton sand, however, has been penetrated of tener than the Wheeler sand because the areas of oil and gas in the Wheeler sand are a little more widespread than those in the Layton sand, and because it has not been wise to drill below the Wheeler sand in many places on account of the smaller areas of oil in the Bartlesville sand. For these reasons water has been encoun tered more often in the Layton sand than in either the Wheeler or the Bartlesville sand.
The maximum dip in the Wheeler water surface is 40 feet in about three-fourths of a mile on the Wheeler terrace, and just south of Drumright the westward dip is about the same. The elevation of the water surface on the west side of the Wheeler terrace ranges from 1,400 to 1,460 feet below sea level. Sufficient information is not available to determine the attitude of the water surf ace on the Drop- right dome, as most of the wells that.reached the Wheeler sand found gas, and water has seldom been recorded in the logs as occurring in the Wheeler sand.
On the southwest side of the Dropright dome and on the west side of the Wheeler saddle water has been struck in the Wheeler sand in a number of wells at depths ranging from about 1,400 to about 1,460 feet below sea level, the lower depths being on the west. (See fig. 3, p. 30.) On the east side of the main anticline that extends northward from the Shamrock dome the Wheeler water surface was found in one well at 1,331 feet below sea level, a fact which indicates that the water on the east side of the dome is higher than, that on the west side. This difference in level is further indicated by the fact that on the south slope of the Mount Pleasant dome the Wheeler sand was full of water at 1,360 feet below sea level, and the water surface in that locality must, of course, lie above this level.
On the west side of the dome, in the northern part of T. 76 N., E. 7 E., water was encountered in the Wheeler sand at 1,397 feet below sea level, and as it was found near the bottom of the sand this is probably about the highest elevation at which water occurs in the Wheeler sand in that locality. This level coincides closely with the highest level of the. water surface on the west sides of the Wheeler saddle and Wheeler terrace.

WATER IN THE SAND. 53
BARTLESVILLE WATER SURFACE.
The Bartlesville sand is much more difficult to deal with, for it includes not only oil, gas, arid water sands of different porosities but thin shale partings. At some places high up in the sand a streak of water under pressure was found by a few wells, which led the drillers to decide that " bottom water " had been struck, and it was so recorded in the logs. On the other hand, in many wells in the same vicinity this streak contains gas or oil, or the driller may have pro ceeded in spite of the water and found oil below. The records, therefore, show many depths to water in the Bartlesville sand, so that the information concerning the water surface is of much less value than that afforded by logs of wells sent to the Layton and Wheeler sands. Nevertheless a few of the principal contours on the water surface in the Bartlesville sand have been drawn by using only the depths at which the actual edge water is presumed to have been encountered without regard to any preconceived idea as to how the contours should run.
In the Bartlesville sand on the north, west, and east sides of the Dropright dome the water ranges in depth below sea level from about 1,700 to 1,850 feet, the water of lesser depth generally lying near the axis of the fold. The maximum dip of the Bartlesville water surface seen on the Dropright dome is 80 feet in about half a mile.
Water occupies the Bartlesville sand on the Wheeler saddle and on the Wheeler terrace near Drumright. East of Drumright, where many excellent Bartlesville wells have been drilled, the water surface lies 1,700 to 1,830 feet below sea level, but not enough informa tion was available to determine definitely the shape of the water surface. South and east of Drumright the water surface ranges from about 1,725 to 1,825 feet below sea level, but the data were too scanty to determine any contours. Water is found at two places in the Bartlesville sand on the east side of the Mount Pleasant dome at depths of 1,842 to 1,848 feet below sea level, and near the crest of the dome water has been recorded in two places at depths of 1,740 and 1,741 feet below sea level. Near Shamrock water occurs at depths ranging from about 1,800 to 1,875 feet below sea level. It is thus apparent that the water surface in this vicinity is slightly lower than in other parts of the Gushing field. South of Shamrock, on the west side of the dome in the northern part of T. 16 N., R 7. E., water is found at two places, not far apart, at depths of 1,370 and 1,872 feet below sea level.
VARIATIONS IN THE WATER SURFACES AROUND THE GUSHING FIELD.
An interesting and important feature observed is the fact that the water surfaces in the three different sands studied are very irregular

54 GUSHING OIL AND GAS FIELD, OKLA.
in shape, as may be seen by referring to the outer limits of oil or gas in the different sands shown on Plates VII, VIII, and IX. The line limiting the productive oil or gas territory defines the areas inside of which oil or gas has been found and outside of which only water
' occurs. Although a line on the map separates the area containing oil from the area containing water the two are in reality separated by a warped plane. The line represents the intersection of this plane and the surface of the sand contoured.
As has already been noted, the planes that separate the oil and water bodies in the three different sands lie higher on the steep sides of the domes and anticlines than on the slopes on their longer axes. For instance, the line representing this plane in the Layton sand on the Dropright dome lies about 600 feet below sea level on the east and west sides of the dome but about 650 feet below sea level on the north side. This feature is characteristic not only of the Dropright dome; it predominates in practically all the domes and anticlines in all the commercially produced sands in the Gushing field.
The water line in the Layton sand that is, the line representing the warped water surface ranges in depth below sea level from about 575 feet at the south end of the field to about 650 feet on the west side of the Wheeler terrace and Wheeler saddle. On the sides of the Mount Pleasant dome and on the east side of the Shamrock dome this line rises much higher.
The water line in the Wheeler sand around the Gushing structure is much more variable than the water line in the Layton sand; it rises as high-as 1,250 feet below sea level on the east side of the Shamrock dome, and is found as low as 1,475 feet below sea level on ^he west side of the Wheeler terrace.
The water line in the Bartlesville sand around the Dropright dome ranges from 1,650 to 1,800 feet below sea level, which is about the same range observed in other parts of the Gushing field.
As a matter of fact the water line the intersection of the warped plane of the water surface and the surface of the oil sand should be the boundary outside of which no water-surface" contours are drawn. This is not true, however, because the statistics from which the maps were drawn are not complete nor absolutely accurate. For example, a well drilled some distance outside the oil area as repre sented may have obtained only a showing of oil but may have fur nished sufficient ° information about edge water to enable the determination of water-surface contours, yet the showing of oil was so slight that the well was not included in the oil area.
If full and absolutely accurate information were available, the point of intersection of a structure contour and the water line would

WATER IN THE SAND. 55
be a point on the outer end of a water-surface contour, but the maps do not show this, because trustworthy information was not avail able for their preparation, and because the water-surface maps were prepared separately from the structure-contour maps and are designed to show only the general warping of the water surface.
POSSIBLE CAUSES OF THE INCLINED WATER SURFACES.
It may occur to some that the inclination of the water surface in adjacent wells that were completed on widely different dates may be apparent only that the water may be reached first on the edge of a pool, and then, after much oil and gas have been extracted from the sand, the level of the edge water may rise so that in the wells drilled later, near the center of the field, the water may be found higher on account of encroachment. This method of development, however, has been followed in but few oil fields, for development ordinarily proceeds outward from the richest part of the field. Where " wild- catting " is being carried on in an undeveloped territory a dry hole is seldom offset, and a small oil producer only occasionally; but if an excellent producer is drilled it is immediately offset and probably several times if the land is divided among many operators, as it usually is. Then if any of these offset wells proves a still better producer, more wells are drilled farther in that direction, as the- constant ambition of operators in " wildcatting" is to discover the center of the pool, where they naturally expect to obtain the greatest output.
The contours showing the water surfaces in these three sands (Pis. VII, VIII, and IX) are based on information which indicates that the water surfaces apparently slope away from the centers of pro duction. This inclination of the water surfaces may have existed originally, prior to the development of the field, or it may have been wholly a result of the extraction of oil and gas, or if it existed before the field was exploited it may have been rendered greater by the extraction of oil and gas. If the inclination existed before the field was developed, it may have significant. connection with the mode of accumulation of the oil and gas; if it has been acquired since development began, a study of its causes may contribute to our knowledge of the drainage of oil sands; if it existed prior to develop ment and was made greater by the extraction of oil arid gas, its study may afford valuable conclusions both as to the mode of ac cumulation of the oil and gas and as to the drainage of the sands. If the water surfaces were originally inclined or if the inclination is due wholly to the rapid extraction of oil and gas, certainly the oil, water, and gas must be in a state of unstable equilibrium during the period of this inclination. It is possible that such a disturbed equilibrium might exist after exploitation has begun, because the
56 GUSHING OIL AND GAS FIELD, OKLA.
removal of millions of cubic feet of gas under great pressure and the rapid expulsion of thousands of barrels of oil, even if no other factors entered the problem, certainly must cause many interesting and apparently unexplainable phenomena. It therefore becomes neces sary to decide, if possible, just when this inclination was acquired and then to suggest some plausible explanation for it; but if no such explanation can be suggested, the best that can be done is to make a record of the facts, which, after they have been correlated with similar facts collected by others, may furnish some satisfactory ex planation of the conditions observed. This record has accordingly been made, and in making it much information has been collected and classified according to the three possibilities enumerated above that is, information afforded by logs of wells completed on approxi mately the same dates during the early history of the field has been considered separately from that afforded by logs of wells completed later, and the information of the two kinds has then been compared or contrasted to determine whether or not the third possibility might be considered.
The most significant available evidence indicating the existence of the inclination prior to development is found in the logs of wells drilled at the extreme southern end of the Gushing field, where the .discovery of the productivity of the Layton sand about 2 miles south of Shamrock in September, 1915, caused rapid drilling by many companies in sees. 4, 9, and 16, T. 16 N., R. 7 E. (See PI. VII.) On the west side of the anticline in the north part of T. 16 N., R. 7 E., the depths at which water was found in two wells are 578 and 587 feet below sea level, and on the south side of the same fold water has been found in three wells at 568, 575, and 588 feet below sea level. The highest elevation at which water is found is 568 feet and the lowest 588 feet below sea level, indicating that the inclination of the water surfaces of the Layton sand is original, although the information is too meager to prove this decisively. Practically. all the wells drilled to the Layton sand at the extreme southern end of the field were completed within a period of three or four months. The production of these wells was not large, the closed pressure of the oil and gas in the Layton sand was not great, and the wells were economically spaced. Therefore, even if the wells had been com pleted through a longer range of time, the water surface probably would not have been so greatly affected by factors connected with production as it would have been in a field where the wells had larger initial production and were drilled closer together.
Similar corroborative evidence that the present inclination of the water surface was at least in part original and was not altogether the result of the exploitation of the field is found in the logs of wells

WATER IN THE SAND. 57
drilled on the north side of the Dropright dome to the Dayton sand. Here two wells were completed during November and December, 1913, in the SE. £ sec. 5, T. 18 N., E. 7 E. The one completed in November struck the Layton sand at 583 feet and struck water at 637 feet below sea level. The one completed in December, which is about a quarter of a mile northeast of the other, struck the Layton sand at 622 feet and water in the sand at 660 feet below sea level. As these wells were completed early in the exploitation of the field their logs probably show the true level of the water surface in the Layton sand, before much oil and gas had been removed. Between the two wells the beds dip 39 feet to the northeast and the water surface dips 23 feet in the same direction.
In a well in the center of the SW. £ sec. 5, T. 18 N., E. 7 E., com pleted in October, 1913, the Layton sand was struck 603 feet and water 631 feet below sea level, whereas in a well about half a mile to the west, in sec. 6, completed in November, 1913, the Layton sand was struck 568 feet below sea level and water 622 feet below, the difference indicating an eastward dip of the strata of 35 feet and of the water surface of 9 feet between the two wells. A comparison.of the well completed in November, 1913, with a well about half a mile farther west, completed in December, 1913, which struck the Layton sand at 592 feet and water at 632 feet below sea level, indicates a westward dip of the beds of 24 feet and a dip of the water surface of 10 feet. The well just mentioned, completed in December, 1913, may also be compared with one a quarter of a mile to the south, com pleted in November, 1913, which struck the Layton sand at 563 feet and water in the Layton sand at 628 feet below sea level, the difference indicating that the beds dip to the north 29 feet and that the water surface dips 4 feet in the same direction. Many similar data have been compiled from logs of wells drilled in other parts of the Dropright dome and on the Wheeler saddle. Thus, the dip on the water surface in the Layton sand appears to be considerably less than that on the Layton sand itself as determined from logs of wells completed early in the exploitation of the field.
The information gathered suggests that the inclination of the water surfaces existed prior to development of the field and was probably due to the forces that controlled the accumulation of the oil and gas, among which are the friction of low-dipping beds, the difference in the viscosity of oil and water, the differences in the porosity of the sands, the compressibility of gas, and the incompres- sibility of oil and water. It is also possible that the water in these sands was originally level, but that folding subsequent to the ac cumulation of oil and gas inclined the water surfaces. Much experi mental work might be done on this subject with profit.

58 GUSHING OIL AND GAS FIELD, OKLA.o
Whatever may have been the causes of the original inclination, it is possible that it may have become greater after the development began on account of the operation of various factors connected with production. This possibility is indicated by some of the evidence, and the following is given to show the character of the detailed data used in considering this problem and in constructing the contours of Plate VII.
In a well drilled near the center of the SW. i sec. 5, T. 18 N., R. 7 E., completed in October, 1913, early in the exploitation of the field, the Layton sand lay at 606 feet and the water surface at 634 feet below sea level. Just two years later, after much oil had been taken' from that district through this and other wells, a well was completed about half a mile to the northwest, along the east line of sec. 6. In this well the Layton sand lay at 641 feet and water at 651 feet below sea level, indicating a northwesterly dip of the Layton sand of 35 feet and of the water surface of 17 feet between the two wells.
In the SE. £ sec. 6 a well completed in February, 1913, struck the Layton sand at 580 feet and water at 605 feet below sea level. Another well one-fourth of a mile to the northwest, completed in December, 1915, nearly three years later, encountered the Layton at 615 feet and water at 655 feet below sea level, showing a north westerly dip of the beds of 35 feet and of the water surface of 50 feet between the wells.
A well near the center of the SW. I sec. 5, completed in October, 1913, encountered the Layton sand at 603 feet and water at 631 feet below sea level. Another well about three-fourths of a mile to the northwest, in the NE. \ sec. 6, completed in November, 1915, struck the Layton sand at 623 feet and wate rat 703 feet below sea level, indicating a northwesterly dip of the beds of 20 feet and of the water surface of 72 feet between £he two wells. Still another well, near the center of the south line of sec. 6, completed in November, 1913, struck the Layton sand at 570 feet and water at 616 feet below sea level, whereas a well about half a mile to the north, near the center of the section, completed in June, 1916, struck the Layton sand at 680 feet and water at 730 feet below sea level, indicating a northerly dip of the beds of 110 feet and of the water surface of 114 feet between the wells.
If, therefore, we can assume that the dip of the water surface is adequately determined by two wells drilled at widely different dates, then the water surface has been farther inclined by the extraction of oil and gas. The dip of the water surface, however, has been determined by evidence afforded by two wells drilled at different dates, and in the interval that elapsed between the drillings there

WATER IN THE SAND. 59
certainly must have been a change in the level of the water surface in the first well on account of the extraction of oil and gas. There fore, the actual dip of the water surface between these two wells is not known, but it must be greater than that given for each well, because of the reduction in the volume of oil and gas in the.sand during the period between the drilling of the two wells. Hencej .evidence from wells completed at widely different dates gives smaller dips than those actually existing, especially if the first well is drilled nearer the center of production. The data serve just as well, however, to prove that the water surfaces have been further inclined. The dips actually existing on the water surface after much oil and gas have been extracted will be determined by selecting favorably located wells drilled on nearly the same date during the later history of the field.
Records of such wells completed on approximately the same date late in the exploitation of the field corroborated the above conclusion that the water surface has been further inclined by the extraction of oil and gas. For instance, one well, completed in June, 1915, near the center of the NW. £ sec. 4, T. 18 N., R. 7 E., struck the Layton sand at 615 feet and water at 647 feet below sea level and another, completed in July, 1915, at a point 600 feet north of the first, struck the Layton sand at 634 feet and water in the sand at 669 feet below sea level, the difference indicating a northerly dip of the beds of 19 feet and of the water surface of 22 feet between the wells. The log of the well last mentioned, completed in July, 1915, if compared with that of a well half a mile northeast, completed in April, 1915, which -found the Layton sand at 635 feet and water at 641 feet below sea level shows a northeasterly dip of the beds of 1 foot and a southwesterly dip of the water surface of 28 feet. A com parison of the log of the well completed in July, 1915, with that of another well, completed in September, 1915, in the SE. £ sec. 33, T. 19 N., R. 7 E., which encountered the Layton sand at 653 feet and water at 702 feet below sea level, shows a northeasterly dip of the beds of 29 feet and of the water surface of 33 feet between the wells. A well completed in July, 1915, in the SW. £ sec. 8, T. 18 N., R. 7 E., struck the Layton sand at 508 feet and water in the sand at 520 feet below sea level. About a mile to the northwest a well that was com pleted in the same month struck the Layton sand at 551 feet and water in the sand at 614 feet below sea level, the difference indicating a northwesterly dip of the beds of 43 feet and of the water surface 94 feet between the wells.
Thus the information compiled from logs of wells completed dur ing the early stages of the exploitations of the field and that com piled from wells completed during the late stages, when considered separately and contrasted, indicates that the water surface has been

60 GUSHING OIL AND GAS FIELD, OKLA.
further inclined, for at many places the inclination of the water surf ace-is now greater than that of the roof of the reservoir.
Similar data indicate that the same condition exists at some places in the Wheeler sand. Figure 4 shows diagrammatically the inclination supposed to exist before and after development in the northern part of the Gushing field.
The causes of this additional inclination have not been clearly de termined, but probably one cause is the difference in the viscosity'of oil and water, which allows the water to be forced more readily up the dip through the sand. This cause probably operated as follows:
Before any oil or gas was produced the water surface was in clined, as shown in A, figure 4; the dip of the water surface was then less than that of the roof of the reservoir, and the closed pressure is assumed to have been the same throughout the reservoir. When the first well was drilled into the oil sand the gas expanded through the opening and carried oil with it. Each barrel of oil that flowed from the sand near the well reduced the pressure at that locality a certain amount. In a few months many wells were drilled into the highest part of the dome, which had by that time been well defined, and oil and gas were being rapidly expelled. This rapid expulsion of the oil and gas reduced the pressure in the sand over a wide area, so that it was less in that area than it was down on the edges of the pool, where fewer wells were producing, and those that were pro ducing were expelling much smaller quantities of oil because less gas is absorbed in the oil on the flanks of an anticline or dome. The water beneath the oil, being under pressure and less viscous than the oil, was forced through the sand below the oil to the area of less pressure, causing the condition shown in B, figure 4, and a continua tion of this operation probably caused the water surface to become inclined more than the roof of the reservoir.
In a distance of half a mile the Layton sand, at one place, as noted above, dips 1 foot to the northeast and the water surface dips southwest 28 feet, facts apparently not in harmony with the others given. This reverse dip of the water surface is thought to be due to the fact that the well on the northeast is drilled into a rich part of the Layton sand, to which many other wells have been drilled and from which much oil and gas have been extracted. This well, therefore, illustrates the explanation just given.
It is therefore possible that the wells in a very productive area on the crest of an upfold in beds of gentle dips will begin to show water as soon as or before those that are drilled lower on the domes or anticlines, and later, after the wells in the more productive areas yield very little oil and much water, a small deposit of oil may still remain on the sides of the domes or anticlines, as shown-between
GUSHING OIL AND GAS FIELD, OKLA. 61
X and Y in section B of figure 4 (p. 49). Sufficient information has not been obtained in any part of the Gushing field, however, to prove or disprove this idea, and it is given here for what it may be worth.
NECESSITY OF SIMILAR WORK ELSEWHERE.
A search through many publications on the geology of oil and gas disclosed no report or paper on the inclination of water surfaces in oil sands. 1 The results outlined above are therefore thought to be important, but though there is no reason to doubt the trustworthiness of most of the data upon which the results are based it is not con sidered desirable to advance any but tentative theories to account for the phenomena or to offer the evidence in substantiation of theo ries already formulated until similar information has been gathered in other districts in the Mid-Continent field.
The writer believes that the study of the laws governing the accu mulation of oil and gas is in its infancy and that many of the investi gations made to determine those laws have not been directed along proper lines. A study of all the fields in a great productive province would aid this work, but before positive results can be obtained each important field should be separately studied and all facts that would show the relations of oil, gas, and water their distribution and their relations to one another and to the structure and any other pertinent facts should be collected and analyzed. As fast as these studies are completed, the facts learned, garnished by as few theories as possi ble, should be placed before the public to stimulate similar investiga tions and to give other investigators the benefit of the studies.
A vast accumulation of facts will be necessary to explain some of the phenomena, for many factors are involved and sufficient knowl edge can be obtained, only by patiently and systematically gathering and recording all the facts. What is already known of the conditions under which petroleum and natural gas accumulate is of inestima ble advantage to geologists in selecting prospective oil lands and in the location of test wells, but the advantage will be greatly in creased if some of the factors which still remain unknown can be determined.
It is hoped that the facts here presented will stimulate other similar but more detailed studies on this subject, which will ulti mately broaden our knowledge of the accumulation of oil and gas and show the changing conditions under which oil and gas exist dur ing the development and productive life of a field.
1 Since this paper was prepared and transmitted for publication, John L. Rich, in a report on the " Oil and gas in the Birds quadrangle," published in Bulletin 33 of the Illinois Geological Survey, notes that the water surfaces in some of the pools in Illinois were inclined.


INDEX.
A.
Acknowledgments to those aiding__ Anticlines, definition of___________
oil and gas In________________Authorization of work-___________
B.
Page. 8
16 40
7
Bartlesville sand, elevation of 23, 24gas in______________ 38,43-44
map showing______ In pocket.lenticular form of________ 32-33occurrence and character of___ 16,
17, 23-27, 38oil in____________ 38-39, 41, 44
map showing _ In pocket.relation of, to Layton sand^_ 28-31
map showing___ In pocket.construction of 28
section showing______ 30structure maps of_!_____ In pocket.
construction of _ 35water surface in _ 53, 54
map showing. In pocket.Bottom water, danger from_ 45-46
nature of-_ _ ______- 45-46Bureau of Mines, cooperation with. 1, 7Buttram, Prank, on Cushing field 11
C.
Cimarron River, view across _____Clevelandcsand, occurrence and char
acter of _-_________Convergence map, attempt to pre-
paxe J
D.
14
28
Development in Cushing field __ 7, 9-11 chart showing _ _ 10
Domes, definition of _________ 16 list of ________________ 22 oil and gas in___________ 40 S.ee also particular domes.
Drilling, ease of_ ________ ' 9Dropright dome, elevation of____ 24
features of______________ 22-24gas in_____________ 35-36,37 oil in______________ 36-37,40 oil sands of __ _______ 22-24 view on_____________ 8, 9water surface in____ 40, 51, 52, 54
Drumright dome, features of____ 25 gas in ______________ 42-43Oil in____!________ 39, 41, 42-43 oil sands of ___________ 25
E.
Edge water, encroachment cf____ 46-47
F.Page.
Five Civilized Tribes, oil and gaslands of______ -____ 7
Folding, character of_______ 8, 21-27 differences in, causes of____ 31-35 See also particular folds, domes,
etc. Folding, cross, occurrence and effect
of __________ 34-35
G.
Gas, accumulation of _________ 17-18distribution of__________ 39-42migration of___________ 42-44relation of, to structure___ 35-42waste of, effect of___ '.__ 47
Geologic field work, disclosures by_ 8Geologic map of Oklahoma ___ 12
J.
Jones sand, occurrence and charac ter of _ 14
K.
Key bed, definition of________ 19-20 See also Structure.
L.
Layton lime, occurrence and charac ter of__________ 14
Layton sand, elevation of________ 23, 24gas In ___________ 35-36, 42-43
maps showing-____. In pocket.occurrence and character of_ 14,
23-27oil in__1_______ 36-37,40,42-43
maps showing _ In pocket, relation of, to Bartlesville
sand___________ 28-31map showing- _ In pocket.
making of_______ 28section showing__ ___ 30
structure maps of _ In pocket.construction of _______ 21,35
water surface in__ 40, 51, 54, 56-60map showing--__ _ In pocket.
M.
Map of Cushing field_______ In pocket. Map, geologic, of Oklahoma_____ 12 Maps, structure. See particular for
mations, sands, etc.Mississippi lime, oil from below__ 9, 11 Mount Pleasant dome, elevation
of_____________ 24,25 features of ____________ 25-26 gas in ___________ 35, 38, 40-43 oil in ______________ 36,38-43 oil sands in____ _______ 26 water surface iu 40, 52, 53, 54
63

64 INDEX.
O. Page.Oil, accumulation of 17,40
character of _-___ _ t 9discovery of _______ 9-17distribution of. See particular
sands.peculiarities of_____-_ 39-42
marketing of ____ _ 9chart showing _ _ 10
migration of __________ 8, 42-44production of ___ _ _ : 9
chart showing _______ 10relation of, to structure. 35-52
Oil field, definition of_.__,.___ 9-11geologic map of- _-_____ 12map of________-__ In pocket.shape of _ 8
Oil sands, columnar section showing- 15development of-_________ 9-11intervals between _______ 8, 28-31
relation of structure and__ 31irregularities of_________ 21-22list of _______________ 14occurrence and character of___ 14-16,
35-39water in __________.__ 39,44-61
menace of 47-48 See also particular sands.
Oil wells, completion of, chart show ing____________ 10
decline of __________ 46-47 drilling of____________ 9drowning out of, plate showing- 44 initial production of, maps
showing __ _ In pocket.,relation of, to structure_ 17-18
logs of, incompleteness of 11
P.
Pawhuska limestone, identificationof____________ 12
position of ____________ 11-13diagram showing--_____ 30
structure map of _ In pocket.Pennsylvanian series, occurrence and
character of______ 11-13 oil sands in__________ 12,14-16
S.
Shamrock dome, elevation of _____features of- _____ ____gas in _________ 35, 37, 38, oil in________________ oil sands in ___________water surface in ___ 41, 52,
Shamrock saddle, gas in_-_________oil in_______________________
Skinner sand, occurren.ce and char acter of
Stratigraphy, details of __ well records showing ___ _
Structure, character of-__________definition of __ delineation of-____________determination of '_ __
24,26 26-27 41-43 36-43
2753,54 35,37 36,40
1511-16
13
Page. Structure, effect of, on intervals
between sands __ _ 31 features of ___________ 21-35
names of___________ 22 knowledge of, importance of_ 17 mapping of_____________ 35 relation of, to initial produc
tion ___________ 17-18 to oil and gas________ 35-42
See also particular domes, etc. Structure contours, nature of____ 18-19
oflice of _______________ 19-21 Syncline, definition (of_________ 16
oil accumulation in_______ 17
T.
Terrace, structural, definition of 16Top water, character of_______ 45
difliculties due to________ 45Tucker sand, gas in___________ 39
occurrence and character of__ . 16oil in_ __________ 39
U.
Unconformities, occurrence and ef fect of, on relation of sands____ 33
W.Water in oil sand, character of__ 45
classification of ...______-__ 44difliculties due to_______ 45, 46-47
plate showing____ _ 44exclusion of _______ _ 47-48occurrence of ___________ 39shutting out of _ _ 46
Water surface, definition of_____ 48level of ________________ 48-50
diagrams showing ____ 30,49 variations in ________ 53-55
°cause of________ 55-61 investigation of, need
of__________ 61 See also particular sands.
Wells. See Oil wells.Wheeler saddle, features of_ 24
gas in __ ____________ 35,40oil in______________ 36,38,40
.oil sands of____________ 24water surface in_:____ 51, 52, 53, 54
Wheeler sand, elevation of 23, 24gas in __________:__ 37-38,43
maps showing ____ In pocket.occurrence and character of__ 12,
14-15, 22, 23-27oil in ______________ 37,40,43
maps showing ___ In pocket.relations of, section showing 30structure maps of____ In pocket.
construction of___ __ 35water surface in _____ 40, 52, 54, 60
map showing____ In pocket.Wheeler terrace, features of _ 26
oil in______________ 26,36,37water surface in _____ 52, 53, 54
O