geophysical survey report no. 27 - queen's … · traverse to sample ratio were ... these...
TRANSCRIPT

Geophysical Survey Report No. 27
Killuney,
Co. Armagh
Dr Siobhán McDermott & Grace McAlister

Contents
List of Figures ................................................................................................................................................ 1
List of Tables .................................................................................................................................................. 1
Site Specific Information ................................................................................................................................ 2
Survey methodology overview ....................................................................................................................... 3
Introduction .................................................................................................................................................. 9
Description and interpretation of anomalies ................................................................................................ 10
Discussion.................................................................................................................................................... 18
Recommendations ....................................................................................................................................... 19
Bibliography ................................................................................................................................................ 20
Acknowledgements ..................................................................................................................................... 20
Appendix one: Georeferenced geophysical survey grid ................................................................................ 21
Appendix two: Raw data plots ..................................................................................................................... 22
Appendix three: Processed data plots .......................................................................................................... 24
Appendix four: Supporting visualisations ..................................................................................................... 26
Appendix five: Historical mapping ................................................................................................................ 28

CAF GSR 025 Killuney, Co. Armagh
1
List of Figures
Figure 1 Location and landscape setting of the geophysical survey grid ...................................................... 6
Figure 2 Wider recorded archaeological landscape setting ......................................................................... 7
Figure 3 Location of geophysical survey areas in relation to the 2009 excavations ..................................... 8
Figure 4 Interpretation diagram with levels of archaeological potential ..................................................... 17
Figure 5 Location and coordinates of local geophysical survey grids ........................................................... 21
Figure 6 Greyscale plot of Area A and B raw data ....................................................................................... 22
Figure 7 Location of higher resolution data collection ................................................................................ 23
Figure 8 Greyscale plot grid square two surveyed with a west to east zig-zag traverse ............................... 23
Figure 9 Greyscale plot of higher resolution (20m x 20m) survey of grid square two .................................. 23
Figure 10 Greyscale plot of Area A and B processed data ........................................................................... 24
Figure 11 Greyscale plot of higher resolution (20m x 20m) survey of grid square two ................................ 25
Figure 12 Greyscale plot grid square two surveyed with a west to east zig-zag traverse. ............................ 25
Figure 13 Dot density graph plot of Area A with areas of medium and high archaeological potential ......... 26
Figure 14 Features over laid on 2006 ortho-rectified aerial photographs ................................................... 27
Figure 15 First Edition Ordnance Survey map series, c. 1835. ..................................................................... 28
Figure 16 Third Edition Ordnance Survey map series, c. 1905-9. ................................................................. 28
Figure 17 Fifth Edition Ordnance Survey map series, c. 1952-4. .................................................................. 29
List of Tables
Table 1 Description and interpretation of archaeological anomalies in Area A ........................................... 10
Table 2 Description and interpretation of archaeological anomalies in Area B............................................ 15
Table 3 Geophysical survey grid coordinates georeference to Irish National Grid ....................................... 21

CAF GSR 025 Killuney, Co. Armagh
2
Summary of results
An evaluation resolution gradiometery survey was carried out over a total area of 1.2 hectares in Killuney
townland. In 2009 archaeological investigations revealed significant multi-period human activity 100m south-west
of the survey area (Vuolteenaho & Bailie 2009). The current episode of geophysical survey identified a number of
features with high archaeological potential. Primarily an avenue-like feature (≥ 53m in length, ≥ 25m in width) with
a semi-circular terminal defined by pits associated with a group of positive anomalies to the north-east of Area A.
A modest (≤ 6m in diameter) penannular enclosure was noted to the east of Area B.
Site Specific Information
Site Name: Killuney, Co. Armagh
Townland: Killuney
SMR No: ARM012:045
Grid Ref: H 8905 4581
County: Armagh
Dates of Survey: 24th – 28th March 2014
Surveyors Present: Siobhán McDermott, Grace McAlister
Size of area surveyed: 1.2 Hectares
Weather conditions: Overcast, wet and windy
Solid Geology: Marine to fluvial: greywacke, shale, sandstone & conglomerate. Leadhills supergroup; Derryveeny
formation.
Drift Geology: Diamicton till
Current Land Use: Former agricultural land now lying fallow
Intended Land Use: Residential

CAF GSR 025 Killuney, Co. Armagh
3
Survey methodology overview
Survey type:
Gradiometery
Instrumentation:
Bartington Grad601-2 magnetic gradiometer
Probe spacing:
1m
Grid size:
30m x 30m [grid square 2a 20m x 20m]
Traverse interval:
The entire area was surveyed at 1m traverse intervals. A specific area ( ≤ 900 m²) of greater
archaeological potential, primarily grid square two (Figure 5), was surveyed at a 0.5m traverse interval
and at a perpendicular traverse e.g. the first traverse facing west instead of north.
Sample Interval:
0.125m
Traverse Pattern:
Zig-zag
Lecia TS06-plus total station
Station setup:
Floating grid orientation towards magnetic north using a spotting compass (+/- 3 degrees)
Spatial Accuracy:
Survey grade internal accuracy
Georeferencing:
The dataset was downloaded from the TS06 and imported into ArcGIS 10.2. It was georeferenced to
the Ordnance Survey 10km vector data. The grid points were extracted as a separate feature class and
used to georeference the geophysical survey datasets exported from Geolplot v.3.
Data processing:
The geophysical data was processed in Geoplot v. 3.
The primary processing type was low-pass filtering (LPF) which helps to eradicate minor spikes in the data.
The datasets were also interpolated which creates a smoothing effect. Because the data was collected with a
1:8 ratio of x:y, a consequence of the traverse to sampling interval, both these processes were implemented
with an emphasis on the x axis to compensate for this imbalance.1
Visualisations:
The datasets were visualised using Geoplot v.3 using shade, trace, dot density and relief plots. Statistical
analysis was carried out on the raw data unless dipolar magnetic spikes threatened to skew the information.
Processed datasets and bitmap graph plots were exported from Geoplot v.3 and imported into ArcGIS 10.2.
1 In this instance x,y refer to the local coordinate system where the centre of origin is the south-west corner of the grid
square. In regards to grid square 17, where the initial area of grid square two was resurveyed the traverse was at a
perpendicular angle to the previous grid squares, the centre of origin is the north-west corner.

CAF GSR 025 Killuney, Co. Armagh
4
Once georeferenced they were interpreted in relation to the First, Third and Fifth Edition Ordnance Survey
maps of the area, the 2006 orthorectified aerial photographs and relevant georeference bitmap imports.
Digital archive:
The geophysical datasets were collected, processed and archived in accordance with Archaeological Data
Services best practice.2
2 Schmidt, A. & E. Ernenwein, 2011, Guide to good practice: Geophysical data in Archaeology [Online]
http://guides.archaeologydataservice.ac.uk/g2gp/Geophysics_Toc

CAF GSR 025 Killuney, Co. Armagh
5

CAF GSR 025 Killuney, Co. Armagh
6
Figure 1 Location and landscape setting of the geophysical survey grid marked in red (OSNI* 10km vector data layered over 5km DEM Hillshade)

CAF GSR 025 Killuney, Co. Armagh
7
Figure 2 Wider recorded
archaeological landscape
setting. Geophysical survey
area in red with Key
NISMR** locations noted.

CAF GSR 025 Killuney, Co. Armagh
8
Figure 3 Location of geophysical survey areas in relation to the 2009 excavations and the surrounding housing
developments overlaid on 2006 ortho-rectified aerial photographs*.

CAF GSR 025 Killuney, Co. Armagh
9
Introduction
The survey area lies 1.5km north-east of Armagh city centre along the Portadown Road (Figure 1) in former
agricultural land. It is surrounded on all sides by low density housing with a school to the south. The site is
situated on the eastern slopes of a modest rise, c. 70 m OD, characteristic of the drumlin landscape of south
Ulster. The clay rich, slow-draining Diamicton till encourages water to gather at the drumlin bases creating a
web of streams, streamlets and rivers. A stream which circumvents the base of the drumlin, running within
c. 50 m of the south-eastern limit of the survey area, also demarcates the townland boundary.
Within the immediate vicinity of the geophysical survey area the Sites and Monuments Record notes a
possible early ecclesiastical site (ARM012:045), c. 100 to the south-west, and a rath (ARM012:010), c. 330m
due east. Two parallel ditches containing early medieval pottery were excavated in 2009 (Vuolteenaho &
Bailie). These were interpreted as enclosing elements of the early ecclesiastical site. The same excavations
revealed part of the ditch of a rath. The rest of this monument was left in-situ (Figure 3). The 2009
archaeological excavations also revealed evidence of Neolithic settlement and a number of ring-ditches
which were dated to the Early Medieval period as well as numerous pit features across the excavation.
The wider archaeological landscape setting is dominated by a strong medieval horizon of raths and crannogs
typical of south Ulster. The ecclesiastical city of Armagh would have had a significant influence on the
character of the area throughout the medieval period. A possible late Iron Age/Early Medieval antecedent
for ritual activity in the area, perhaps linked to Emain Macha, may indicate a proto-historical foci as well
(Simms 2009, 212). Archaeological investigations at Emain Macha and Haughey’s Fort have clearly
demonstrated that both these sites are part of a rich prehistoric landscape with clear ritual significance
(Waterman 1997; Neill 2009, 62-86).
The majority of areas A and B were surveyed at the sampling density recommended to evaluate their
archaeological potential.3 Because of advances both in the speed at which gradiometers can capture data and the
amount of data which can be logged the sampling density variable is set by the traverse interval rather than the
sample interval. In the case of the Killuney survey the sampling interval was a constant 0.125m whereas the
traverse interval ranged from 1m – 0.5m. This increased the traverse to sample ratio from 1:8 to 1:4 and
facilitated the characterisation of archaeological features as well as their evaluation. The differences in the
traverse to sample ratio were considered when the datasets were processing the data with both the LPF and
interpolation applied with a greater weighting along the x-axis.
Further, the datasets surveyed in a north – south zig-zag motion had a 1:8 traverse to sample density along their
x:y axis.4 The area of grid square two was resampled in an east – west zig-zag motion. The 90⁰ shift in rotation
provided a greater sampling density along the x axis. Because the data was being interpreted in ArcGIS, which
facilitates the layering of datasets, it effectively made a 0.125 sampling density along both the x- and y-axis
available for interpretation. This significantly increased the information available for the characterisation of the
archaeological potential of the area surveyed in this manner.
3 Geophysical survey in Archaeological field evaluation, (2nd Edition), English Heritage. [Online] https://www.english-
heritage.org.uk/publications/geophysical-survey-in-archaeological-field-evaluation/ 4 The x-axis running east to west, and the y-axis running north to south.

CAF GSR 025 Killuney, Co. Armagh
10
Description and interpretation of anomalies (Figure 4)
General comments:
Overall the site returned a significant amount of dipolar and high magnetic spotting. This is probably related to agricultural debris and the most recent
phase of activity, post-2009, as it was developed for residential housing. Very high magnetic readings to the west, south and east of Area B were edited out
of the dataset before import into Geoplot v.3. These were the result of magnetic contamination from metal perimeter fencing. Generally the dataset was
noisy which effected both processing and interpretation.
A grade of archaeological potential has been identified for each anomaly listed below. Features which have a form that suggests they are the consequence
of human activity have a high level of archaeological potential. Features which appear natural in form but by their association suggest human activity are
identified as having a medium level of archaeological potential. Features which appear natural in form, are not associated with other anomalies of high or
medium potential but cannot be explained are given a low level of archaeological potential. Finally features which can be explained due to geology, modern
interference (e.g. wire fencing), the survey methodology and data treatment are identified as having no archaeological potential. It is important to note that
these grades of archaeological potential are partly subjective and only applicable to the specific survey data covered in this report. Archaeological
anomalies may be present, but undetected by geophysical survey, in all areas of the site and this cannot be mitigated against without further ‘ground-
truthing’ i.e. test trenching or excavation.
Area A (Table 1 Description and interpretation of archaeological anomalies in Area A)
Code Description Interpretation Archaeological Potential
g1 Irregular, sub-circular positive magnetic feature in north-west quadrant of grid square four. Measuring c. 5m E – W, N – S.
May be associated with a dip in the ground surface noted during data collection. Medium
g2 Irregular, linear positive magnetic feature running diagonally from north-east to south-east corners of grid square five. Measuring c. 22m length, c. 5m max width.
The anomalies g2 and g3 appear to run roughly parallel and taper in towards each other to the north-east. They are c. 18m apart at their southern ends to 15.3m at their northern. Both anomalies are irregular in form and their limits not sharply defined. The apparent difference in width between the two features
High

CAF GSR 025 Killuney, Co. Armagh
11
g3 Irregular positive linear feature running diagonally north-east to south-west through bottom half of grid square four into north-west corner of grid square five. Measuring c. 32.5m length, c. 3m max width.
may be a consequence of a dipolar magnetic spike towards the centre of g2 which has skewed the data and widened the appearance of this anomaly.
The linear nature of the features and their apparent relationship suggests that this may have a high level of archaeological significance. They appear to open onto a range of anomalies (g4 – g7) which may mark a terminus feature.
g4 Positive magnetic (mean 6.8 NT) feature in south-east quadrant of grid square two. Measuring 2.2m E – W, 1.8m N – S.
The 2009 excavations to the south-west of geophysical survey areas A and B noted evidence for pitting across much of the excavated area. Some of these pits were substantial and filled with re-deposited natural. They were interpreted by the excavation directors as being associated with early medieval activity. Unfortunately the description does not give any more details on the pits dimensions. At roughly 2m in diameter it is possible that this is anomaly may relate to this pitting activity. Potential pits are noted elsewhere in the dataset.
Alternatively it could be associated with g5 – g7 immediately to its north. In a dot density diagram (Figure 14) of Area A the anomalies g4 – g7 appear to form an arc running north through to the south-east almost acting as a terminal to the avenue-like feature comprised on g2 and g3. The processed 0.5m traverse survey data hints at a positive linear feature further enclosing the terminal and associating g4 with the g5 – g7 anomalies.
High
g5 Sub-circular high magnetic feature associated with a magnetic peak (33.8 nT) towards the centre of grid square two. In the higher resolution data (Figure 12) it appears to be crescent-shaped with the high return, and the associated dipolar negative to its northern limit. Measuring 3m E – W, 3.4m N – S.
This feature lies 3m to the south of g6. It is an amorphous cluster of higher magnetic readings which may be part of a collection of features which defined the southern terminal of the avenue-like anomaly formed by g2 and g3.
High
g6 Measuring c. 6m E – W, 7m N – S overall this appears to be a collection of positive magnetic features: G6a is a circular return
This anomaly initially appeared as a crescent-shaped positive magnetic feature with spur on the north-east corner in the 1m traverse rapid survey.
High

CAF GSR 025 Killuney, Co. Armagh
12
(g6a, g6b, g6c)
measuring c. 2m N – S, 1.9m E – W. G6b is an irregular collection of mildly positive magnetic returns measuring c. 2m E – W, 3.7m N – S. G6c is an irregular linear, higher magnetic feature (24.9 – c. 10 nT) running E – W. Measuring c. 6m max length, 1.5m width.
The subsequent investigations (grid square 18 at a higher traverse reading of 0.5 and grid square 17 at 0.125m sampling on the y axis) suggest that this is a collection of anomalies rather than one feature. They appear to enclose a sub-rectangular area of c. 4.5m². They may be part of a collection of features, g4 – g7, which define the western terminal of an avenue-like anomaly created by g2 and g3.
g7 Very subtle curvilinear feature, in the centre of grid square two, which appears to arc from the north-east through g6 and g5 to the south-east. It comprises two elements g7a (c. 6.5m in length, 1.5m in width) and g7b (c. 3m in length, 1m in width).
The linear feature g6d is most easily identified in the higher resolution 0.5m traverse survey but can also be traced in the westerly orientated 1m traverse dataset.
It appears to curve through g6 and g5 with its end terminals orientated towards g2 and g3.
High
g8 Positive anomaly in the northern half of grid square two. Measuring c. 2.9m E – W, 2m N – S.
G8 may be related to the features which appear to cluster the southern end of the avenue-like anomaly formed by g2 and g3.
High
g9 Positive linear feature running north-east to south-west in the south-western quadrant of grid square five. Measuring c. 8.4m max length, 1.8m max width.
The anomalies g9 and g10 appear to run roughly parallel to g2. Their linear form and potential relationship to g2 indicate that they have archaeological potential.
High
g10 Positive linear feature running east to west in southern half of grid square five. Measuring 7.5m max length, 1.6m max width.
g11 Negative, irregular feature (mean -6.5 nT) in northern half of grid square eleven. Measuring c.5.1m E – W, 4.7m N – S.
Anomalous negative feature which may be a pit in-filled with stone or rubble. Medium

CAF GSR 025 Killuney, Co. Armagh
13
g12 Positive, irregular, y-shaped feature in the northern half of grid square eleven. Measuring c. 5.5m E – W, 7.7m N – S.
Irregular positive feature which lies directly beside g11. It could mark a separate episode of pitting or it may be part of the same episode of activity but with a different fill.
Medium
g13 Circular, positive feature in north-western quadrant of grid square eleven associated with a magnetic peak (≥100 nT). Measuring c. 1.5m E – W, 1.7m N – S.
Perhaps related to the pitting activity noted during the 2009 excavations for the area further to the south-west.
Medium
g14 Irregular feature composed of positive and negative returns along the eastern division between grid squares nine and ten. Measuring c. 3.9m max E – W, N – S.
This feature is more evident after processing with Low Pass Filter. It is poorly defined and does not appear to be related to any other discernable features. It may be a buried stone which has moved with in-filled stone socket.
Low
g15
(g15a, g15b, g15c, g15d, g15e, g15f, g15g, g15h, g15i, g15j)
Line of higher positive magnetic returns (ranging from 11 – 37 nT RAW) running east to west along northern half of grid squares three to four.
A series of small pits, c. 1.5m in diameter, which appear to from a line perhaps related to g20. No field boundaries were mapped by the Ordnance Survey until the third edition map series, c. 1905 – 1909. At this stage the northern limit of our study area was formerly mapped. The line of pits c. 10m further south may be associated to an earlier period of enclosure.
Medium
g16 Regular positive feature to the north-east quadrant of grid square eight. Measuring c. 2.7m E – W, 1.8m N – S.
These randomly placed positive features may related to the pitting activity noted during the 2009 excavations to the south-west of the geophysical survey area.
Medium
g17 Regular positive feature in south-east quadrant of grid square six. Measuring c. 2.5m E – W, 2.7m N – S.
g18 A five separate features which are typified by a collection of very high dipolar readings usually +/- 100 nT. Maximum measurements: G18a c. 7.5m E – W, 7m N – S. G18b c. 7m E –
These collections of very high responses and their associated halos of negative data occur in areas that were associated with magnetic contamination. Although the fields were bounded by mature hedgerows there was evidence of wire fencing which may explain g18b – g18e. Anomaly g18a was located on the
None

CAF GSR 025 Killuney, Co. Armagh
14
(g18a, g18b, g18c, g18d, g18e)
W, 19.5m N – S. G18c c. 13.2m E – W, 8m N – S. G18d c. 3.5m E – W, 18.7m N – S. G18e c. 12m E – W, 4.8m N – S.
perimeter of a mound of debris with some related fly tipping and indications of charring.
g19 Irregular anomaly comprised of high dipolar readings, with a predominance of low readings, in the south-west quadrant of grid square four. Measuring c. 6m E – W, 4.4m N – S.
A circular feature is evident at this location in on Google Satellite View. This could mark an episode of burning, although we would expect higher magnetic readings. It may also be a pit, perhaps a well, which has been filled in with local limestone rubble which is more likely to explain the negative magnetic readings.
Low
g20
(g20a, g20b, g20c, g20d, g20e)
Collection of higher magnetic anomalies which arc in a crescent across the boundary between grid squares twelve to three. Anomaly g20c is associated with very high dipolar readings (Figure 9). Measurements are in the range of c. 1.5m E – W, N – S.
A collection of pits c. 1.5m in diameter which appear to form an arc. Perhaps related to g15 or a feature in their own right. Their arcing form suggests they maybe of archaeological potential.
Medium
g21 Subtle positive magnetic linear feature running east to west across northern half of grid squares three to four. Measuring c. 1.5m maximum width and 23.5m E – W.
A subtle linear feature running roughly parallel with the modern field boundary. This feature is difficult to interpret given the subtlety of the readings. It may be an earlier plough furrow, although it occurs in isolation and does not fully respect the modern field boundary.
Medium - Low
g29 Randomly distributed spots of high magnetic readings with diameters of ≤ 1m which occur across Area A.
The 2009 excavations to the south-west of geophysical survey areas A and B noted evidence for pitting across much of the excavated area. The majority of the pits were described as being ‘fairly substantial’ and perhaps linked to early Medieval industrial activity.
The random distribution of these features and their modest dimensions make them difficult to interpret beyond they are evidence of pitting which may, or may not, be the product of human activity.
Low - None

CAF GSR 025 Killuney, Co. Armagh
15
Area B (Table 2 Description and interpretation of archaeological anomalies in Area B)
Code Description Interpretation Archaeological Potential
g22
(g22a, g22b)
Two dipolar returns: G22a located in the north-east quadrant of grid square 15, g22b in the north-east quadrant of grid square 13. Both associated with magnetic spikes (+/- 100 nT).
Probably related to magnetic contamination. None
g23 Magnetically positive linear feature running south-west to north-east across the boundary between grid squares 16 and 15. Measuring c. 11m max length, 2.5m max width.
The aerial imagery available through Google Maps satellite view was captured during the development of the Killuney Meadows to the south-west of the geophysical survey areas. These aerial photographs show heavy machine tracks in the vicinity of g23. It is possible that g23 is caused by this more recent episode of disturbance and therefore has limited archaeological potential.
Low - None
g24 Circular feature associated with subtle positive readings (4 – 8 nT) more clearly identified with a trace plot (Figure xxx). Located in the northern half of the boundary between grid squares 13 and 14. Measuring c. 7.4m E – W, 6.6m N – S, 1.5m width.
Although difficult to identify from the raster shade plots this appears more clearly in the trace plot. The semi-circle has an internal diameter of c. 4.2m. Its regular form suggests it has high archaeological potential.
High
g25
(g25a, g25b, g25c, g25d, g25e, g25f)
A series of five higher magnetic returns in the north-eastern quadrant of grid square 16 and the north-western quadrant of grid square 15. Reading range from 6 – 17.5 nT with the anomalies measuring c. 1.2 – 1.7m E – W, 1 – 1.5m N – S.
Of similar dimensions, and magnetic readings, as those recorded elsewhere in Area A it is argued that these may relate to the general pitting activity noted during the 2009 excavations.
However there appeared to be a lot of heavy machinery activity throughout Area B, g25 may be related to this.
Medium - Low
g26 Subtle, curvilinear feature in the northern half of grid squares 15 and 16. The anomaly runs from north-east to south-west and
These two features have a similar range of readings and could possibly map the one anomaly. That g27 appears to respect g23 would suggest that these may
Low

CAF GSR 025 Killuney, Co. Armagh
16
appears to curve southwards towards its southern limit. It measures c. 7.6m in length, 1m in width.
related to heavy machinery moving and manoeuvring around the entrance to the field.
g27 Subtle, oblong feature running north-east to south-west in the north-eastern quadrant of grid square 16. Measuring c. 3.5m in length, 1.6m in width.
g28 Higher magnetic (mean 33 nT) anomaly in north-west quadrant of grid square 15. Measuring c. 1.5m E – W, N – S.
Perhaps related to the general pitting or the most recent phase of development activity associated with g25 but it sits slightly outside the range for its magnetic readings.
Medium - Low
g29 Anomalous low magnetic feature in north-eastern quadrant of grid square 15. Measuring c. 5m E – W, 3.5m N – S.
The lower magnetic readings (mean -7 nT) suggest that this could be a limestone filled pit.
Medium
g30 A series of high dipolar readings around the perimeter of the survey area.
The magnetic contamination – metal perimeter fence and wire fencing in the hedgerows.
None
g31 Area of negative readings that runs outside the survey area in the south-eastern quadrant of grid square 13.
The dipolar readings in this area are probably related to a section of metal fence which ran along the eastern edge of grid square 13. However the mean (-15 nT) of the core of this anomaly suggests that ferrous contamination is not the entire explanation. It may be that this is an area of limestone hardcore laid down when car-parking and the entrance to the adjacent school was being developed
Low

CAF GSR 025 Killuney, Co. Armagh
17
Figure 4 Interpretation diagram with levels of archaeological potential
CAF GSR 025 Killuney, Co. Armagh
18
Discussion
The collection of anomalies, g2 – g10, in the north-eastern section of Area A appear to map a cut, avenue-
like feature with a semi-circular terminal defined by a series of pits. The anomalies, g2 & g3, which
demarcate the avenue extending beyond the north-eastern limits of the survey area. The features g9 & g10
cannot be excluded from this grouping and may represent another phase of activity focusing, on extending
or reducing the width of the avenue proper.
The structure as surveyed appears to be c. 53m in length with an internal width between two cut linear
features that demarcate the avenue ranging from c. 13m in the north-east to c. 25m in the south-west.
Linear earthwork occur elsewhere on the island, Newman (1999) has differentiated between linear boundary
markers such as the Dorsey and ‘ritual linear earthworks’ more readily paralleled with British cursus
monuments. The form and location of the Killuney anomalies do not appear to conform to the former. The
parallel cut-features taper towards each other running from the crown of the drumlin down its eastern face.
The boundary marker linear earthworks found elsewhere in Co. Armagh are more grandiose monuments of
banks and ditches which appear to limit movement through the landscape (Neill 2009, 153 – 177). If the pits
which appear to form the terminal are part of the same phase of activity then its presence is not in keeping
with this monument type either. The rest of the Killuney anomaly is now lost under the housing to its east so
it is impossible to say how much further it ran.
Elsewhere on the island avenue-like monuments defined by banks and ditches have been identified. The
most popularly known being the Banqueting Hall, Tara, Co. Meath (Newman 1997) which consists of two
large banks, c. 25 – 28m apart, running for a distance of 203m. The avenue-like structure from Loughcrew,
Co. Meath is formed from two low profile banks, c. 15m apart, with shallow internal ditches. It runs for a
total distance of 500m and appears to be an integral feature of the late prehistoric ritual landscape. The
Friar’s Walk, Kiltierney, Co. Fermanagh (Daniells and Willaims 1977) consists of two parallel banks with
internal ditches which runs for some distance through a rich archaeological landscape of barrows,
earthworks and raths.
In form the Creeveror linear earthworks (ibid, 158-160, pl.134), first identified in aerial photographs during
the 1980s, are more similar to the Killuney anomaly. In 1995 a programme of geophysical survey and
excavation confirmed that it was constructed of two parallel ditches 7.2m apart which were dated to the
Later Bronze Age. The monument appears to be related to late prehistoric activity in the vicinity of
Haughey’s Fort. A wider complex of earthworks, including further linear earthworks which may be an
extension of the original feature and possible barrows, were also identified through archaeological aerial
survey.
The anomaly g24 is situated along the boundary between grid squares 13 and 14 on an east-facing slope.
The penannular series of positive readings has an external diameter of c. 7m. It could mark the location of a
small barrow or a ring-ditch. Ring-ditches, internal diameter c. 11m, were noted to the west of the 2009
excavations. In this instance associated finds dated them to the Early Medieval period and they were
interpreted as being workshops related to the early ecclesiastical activity (J. Vuolteenaho Pers Comms).
However given the apparent association of Irish avenue-like structures and later prehistoric landscapes it is
possible that g24 is a late prehistoric barrow or ring-ditch.

CAF GSR 025 Killuney, Co. Armagh
19
A series of anomalies have been identified as having medium archaeological potential. These are primarily
pit-like features which occur throughout the site. Pitting activity was a constant feature of the 2009
excavations. These appear to have been associated with clay excavation and Early Medieval pottery
production. It is not possible to say whether the pits identified during this programme of geophysical survey
are in a similar vein. Those associated with g15 and g20 appear to form linear and curvilinear features
respectively. They may be pits which were excavated to hold posts, perhaps for a palisade.
Recommendations
Future development within areas A & B should be monitored. It is recommended that test trenching be
carried out over features associated with the avenue-like structure and its terminal and the penannular
ditch, g24, in Area B. Given the extensive nature of the archaeological record excavated to the south-west of
the survey area in 2009 it must be remembered that the grades of archaeological potential identified by this
report are subjective and only applicable to the specific survey data covered in this report. Archaeological
anomalies may be present, but remain undetected, in all areas of the site.

CAF GSR 025 Killuney, Co. Armagh
20
Bibliography
Aspinall, A., Gaffney, C., & Schmidt, A., 2008 Magnetometry for archaeologists. AltaMira Press: Lanham.
Daniells, M.J, Williams, B., & Larmour, R. A., 1977 ‘Excavations at Kiltierney Deerpark, County Fermanagh’.
Ulster Journal of Archaeology, Third Series, Vol. 40, pp. 32 – 41
Loveday, R., 2006 Inscribed across the landscape: the cursus enigma. Tempus: Stoud.
Neill, K., 2009 An archaeological survey of County Armagh. NIEA: Belfast.
Newman, C., 1999 ‘Notes on four cursus-like monuments in County Meath, Ireland’, in Pathways and
ceremonies. The cursus monuments of Britain and Ireland: Neolithic Studies Groups Seminar Papers 4 (Eds
Barclay, A & J. Harding). Oxbrow Books: Oxford, pp 141 – 147.
Simms, K., 2009 Early ‘Christian and Medieval: Historical outline’, in An archaeological survey of County
Armagh (Neill, K., ed). NIEA: Belfast, pp 212 – 229.
Vuolteenaho, J., & Bailie, W., [2009] ‘Killuney Park Road, Armagh – AE/09/65’ [Online] Database of Irish
Excavation Reports (http://www.excavations.ie/Pages/Details.php?Year=&County=Armagh&id=20475).
Waterman, D.M., 1997 Excavations at Navan Fort 1961 – 71. Stationary Office: Belfast.
Acknowledgements
* This material is based upon Crown Copyright and is reproduced with the permission of Land & Property
Services under delegated authority from the Controller of Her Majesty’s Stationery Office, Crown copyright
and database rights, MOU203. Northern Ireland Environment Agency Copyright 2014
** This material is based upon Crown Copyright and is reproduced with the permission of Land & Property
Services under delegated authority from the Controller of Her Majesty’s Stationery Office, Crown copyright
and database rights, EMOU206.2. Northern Ireland Environment Agency Copyright 2014
I would like to thank Ronan McHugh for his expertise and Grace McAlister for her assistance.

CAF GSR 025 Killuney, Co. Armagh
21
Appendix one: Georeferenced geophysical survey grid
Figure 5 Location and coordinates of local
geophysical survey grids for Area A (top) and
Area B (bottom).*
Area A Area B
Local Grid coordinate Irish National Grid coordinate Local Grid coordinate Irish National Grid coordinate
X Y Eastings Northings X Y Eastings Northings
0 0 289081.4828 345761.0189 0 0 289084.4291 345724.4388
0 30 289081.0869 289081.0869 0 30 289083.2245 345754.4838
0 60 289080.6212 345820.9213 30 0 289114.4018 345725.7186
0 90 289080.1428 345850.8142 30 30 289113.2035 345755.6075
0 120 289079.7548 345880.834 60 0 289144.295 345726.9103
30 0 289111.4965 345761.4049 60 30 289143.0798 345756.8056
30 30 289111.0855 345791.4021 90 0 289174.1746 345728.1025
30 60 289110.6187 345821.307 90 30 289172.9868 345757.9958
30 90 289110.1399 345851.2332 120 0 289204.0684 345729.2802
30 120 289109.6076 345881.2285 120 30 289202.9602 345759.2597
60 0 289141.4044 345761.876
60 30 289141.0113 345791.8734
60 60 289140.5357 345821.7777
60 120 289139.5817 345881.631 Higher resolution area of grid square two
90 0 289171.4806 345762.3594 35 65 289115.5393 345826.3104
90 30 289170.9095 345792.3539 55 65 289135.4533 345826.6983
90 60 289170.4234 345822.2452 35 85 289115.2194 345846.3078
90 90 289170.0337 345852.2426 55 85 289135.4533 345826.6983
Table 3 Geophysical survey grid coordinates georeference to Irish National Grid
CAF GSR 025 Killuney, Co. Armagh
22
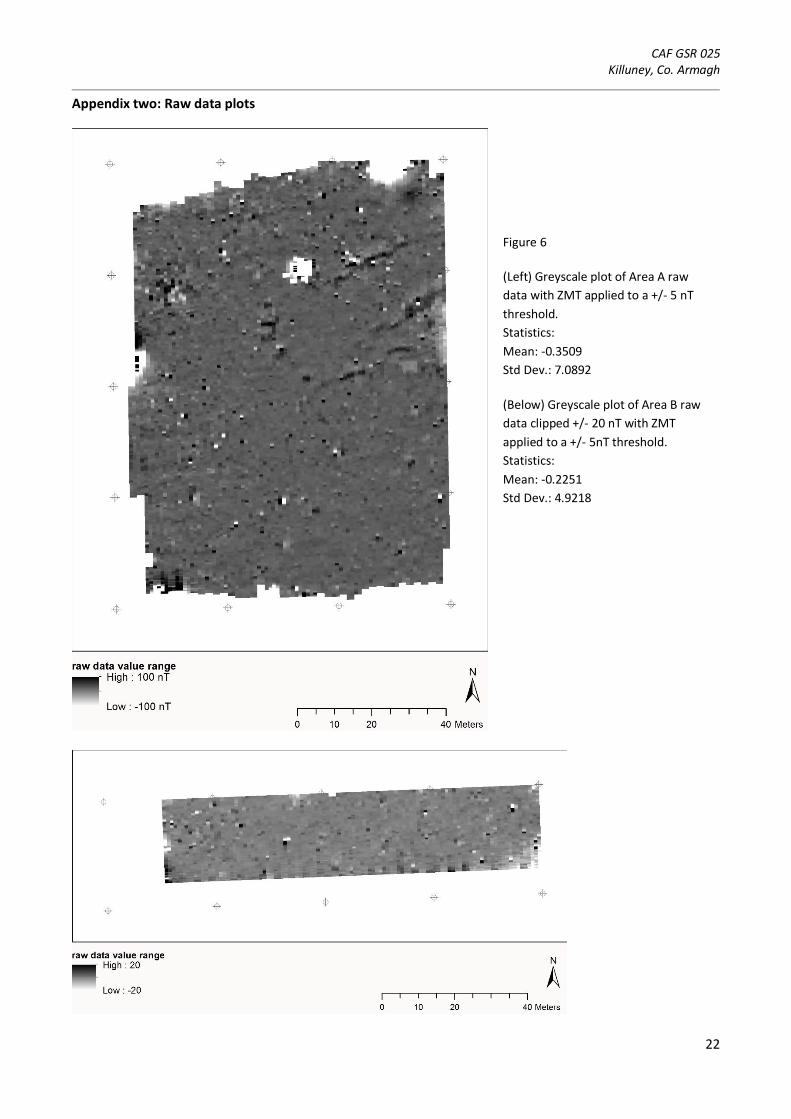
Appendix two: Raw data plots
Figure 6
(Left) Greyscale plot of Area A raw
data with ZMT applied to a +/- 5 nT
threshold.
Statistics:
Mean: -0.3509
Std Dev.: 7.0892
(Below) Greyscale plot of Area B raw
data clipped +/- 20 nT with ZMT
applied to a +/- 5nT threshold.
Statistics:
Mean: -0.2251
Std Dev.: 4.9218
Figure 7 (Above) Greyscale plot grid
square two surveyed with a west to
east zig-zag traverse. Raw data
clipped +/- 20 nT with ZMT applied to
a +/- 5nT threshold.

CAF GSR 025 Killuney, Co. Armagh
23
Figure 8 Location of higher resolution data collection – blue
boundary is 30m x 30m grid square two while the purple
boundary is 20m x 20m.*
Figure 10 (Above) Greyscale plot of higher resolution
survey of grid square two (0.5m traverse interval, 20m
x 20m grid square). Raw data clipped +/- 20 nT with
ZMT applied to a +/- 5nT threshold.
Statistics:
Mean: 0.1300
Std Dev.: 3.4104
Figure 9 (Above) Greyscale plot grid square two
surveyed with a west to east zig-zag traverse. Raw
data clipped +/- 20 nT with ZMT applied to a +/- 5nT
threshold.
Statistics:
Mean: -0.1316
Std Dev.: 7.0426

CAF GSR 025 Killuney, Co. Armagh
24
Appendix three: Processed data plots
Figure 11
(Left) Greyscale plot of Area A
processed data with ZMT, clipped +/-
15 nT, LPF Gaussian weighting
applied x2 on the x-axis, and sin(x)/x
interpolation along the x-axis.
Statistics:
Mean: -0.1209 nT
Std Dev.: 2.7496
(Below) Greyscale plot of Area B
processed data clipped +/- 10 nT,
ZMT, despiked, LPF Gaussian
weighting applied x2 on the x-axis,
and sin(x)/x interpolation along the
a-axis
Statistics:
Mean: -0.1830
Std Dev.: 2.4426

CAF GSR 025 Killuney, Co. Armagh
25
Figure 13 (Left) Greyscale plot grid square two
surveyed with a west to east zig-zag traverse.
Processed data with ZMT, clipped +/- 10 nT, LPF
Gaussian weighting applied x2 on the x-axis, and
sin(x)/x interpolation along the x-axis.
Statistics:
Mean: -9.2342
Std Dev.: 5.5496
Figure 12 (Left) Greyscale plot of higher resolution
survey of grid square two (0.5m traverse interval, 20m
x 20m grid square). Processed data with ZMT, LPF
Gaussian weighting applied x2 on the x-axis, and
sin(x)/x interpolation along the x-axis.
Statistics:
Mean: 0.1280
Std Dev.: 3.1392

CAF GSR 025 Killuney, Co. Armagh
26
Appendix four: Supporting visualisations
Figure 14 Dot density graph plot of Area A with insert of areas of medium and high archaeological potential

CAF GSR 025 Killuney, Co. Armagh
27
Figure 15 Features identified during magnetic gradiometery survey weighted according to archaeological potential and
over laid on 2006 ortho-rectified aerial photographs.*

CAF GSR 025 Killuney, Co. Armagh
28
Appendix five: Historical mapping*
Figure 16 Geophysical survey areas in relation to the First Edition Ordnance Survey map series, c. 1835.
Figure 17 Geophysical survey areas in relation to the Third Edition Ordnance Survey map series, c. 1905-9.

CAF GSR 025 Killuney, Co. Armagh
29
Figure 18 Geophysical survey areas in relation to the Fifth Edition Ordnance Survey map series, c. 1952-4.