geospatiotemporal data mining in an early warning …
TRANSCRIPT
GEOSPATIOTEMPORAL DATA MINING IN AN EARLY WARNING SYSTEM FOR FORESTTHREATS IN THE UNITED STATES
F. M. Hoffman∗, R. T. Mills†, J. Kumar‡, S. S. Vulli§
Computer Science & Mathematics DivisionOak Ridge National Laboratory
1 Bethel Valley Rd.Oak Ridge, TN 37831
W. W. Hargrove¶
Southern Research StationUSDA Forest Service200 WT Weaver Blvd.
Asheville, NC 28804-3454
ABSTRACTWe investigate the potential of geospatiotemporal data mining ofmulti-year land surface phenology data (250 m Normalized Differ-ence Vegetation Index (NDVI) values derived from the ModerateResolution Imaging Spectroradiometer (MODIS) in this study) forthe conterminous United States as part of an early warning systemto identify threats to forest ecosystems. Cluster analysis of this mas-sive data set, using high-performance computing, provides a basisfor several possible approaches to defining the bounds of “normal”phenological patterns, indicating healthy vegetation in a given geo-graphic location. We demonstrate the applicability of such an ap-proach, using it to identify areas in Colorado, USA, where an ongo-ing mountain pine beetle outbreak has caused significant tree mor-tality.
Index Terms— Remote sensing, data mining, phenology, clus-ter analysis, high-performance computing
1. THE FOREST INCIDENCE RECOGNITION AND STATETRACKING (FIRST) SYSTEM
Early identification of forested areas under attack from insects ordisease can enable timely response to protect forest ecosystems fromlong-term or irreversible damage. Unfortunately, given the sheer sizeof the United States and limited resources of agencies such as theUSDA Forest Service to conduct aerial surveys and ground-basedinspections, many threats go unnoticed until a great deal of dam-age has already been done. To improve threat detection, the USDAForest Service, in partnership with Oak Ridge National Laboratoryand the NASA Stennis Space Center, is developing The Forest In-cidence Recognition and State Tracking (FIRST) early warning sys-tem. FIRST will detect and monitor threats to forests and wildlandsin the conterminous United States (CONUS) as part of a two tiersystem: An early warning system that monitors continental-scale ar-eas at a moderate resolution using remote sensing data to spatiallydirect and focus efforts of the second tier, consisting of higher reso-lution monitoring through airborne overflights—called Aerial Detec-tion Survey (ADS) sketch-mapping—and ground-based inspections.Tier 2 is largely in operation today, but the strategic direction pro-vided by the FIRST system in Tier 1 will improve the efficiency andutility of these costly and labor-intensive surveys.
∗[email protected]†[email protected]‡[email protected]§[email protected]¶[email protected]
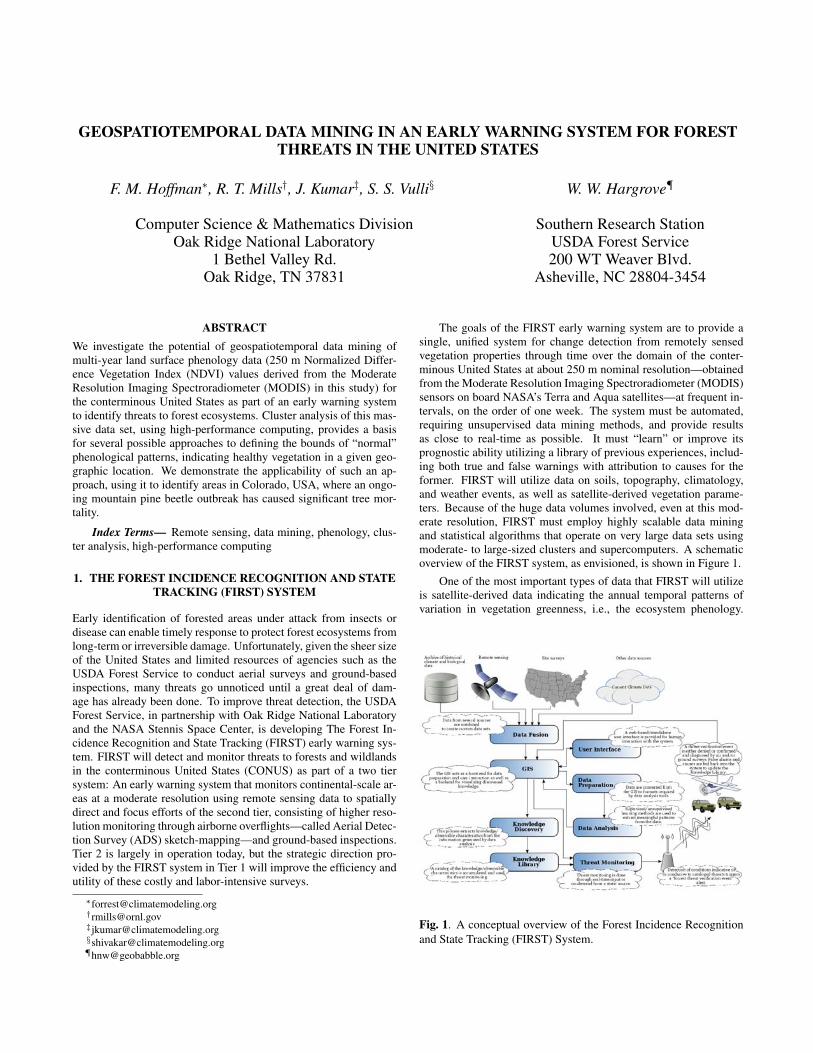
The goals of the FIRST early warning system are to provide asingle, unified system for change detection from remotely sensedvegetation properties through time over the domain of the conter-minous United States at about 250 m nominal resolution—obtainedfrom the Moderate Resolution Imaging Spectroradiometer (MODIS)sensors on board NASA’s Terra and Aqua satellites—at frequent in-tervals, on the order of one week. The system must be automated,requiring unsupervised data mining methods, and provide resultsas close to real-time as possible. It must “learn” or improve itsprognostic ability utilizing a library of previous experiences, includ-ing both true and false warnings with attribution to causes for theformer. FIRST will utilize data on soils, topography, climatology,and weather events, as well as satellite-derived vegetation parame-ters. Because of the huge data volumes involved, even at this mod-erate resolution, FIRST must employ highly scalable data miningand statistical algorithms that operate on very large data sets usingmoderate- to large-sized clusters and supercomputers. A schematicoverview of the FIRST system, as envisioned, is shown in Figure 1.
One of the most important types of data that FIRST will utilizeis satellite-derived data indicating the annual temporal patterns ofvariation in vegetation greenness, i.e., the ecosystem phenology.
Fig. 1. A conceptual overview of the Forest Incidence Recognitionand State Tracking (FIRST) System.
This paper explores the application of data mining techniques to an-alyze seasonal changes in Normalized Difference Vegetation Index(NDVI) derived from MODIS coverage of the CONUS. The utilityof these data has already been demonstrated in [1], in which theauthors used raster map arithmetic approaches, such as comparingmaximum NDVI from mid-summer against maximum NDVI overa six-year baseline, to detect potential forest disturbances. Some ofthese disturbances could represent threats to the long-term healthand functioning of forest ecosystems. A difficulty with using suchapproaches is identification of appropriate parameters (maximumNDVI, 20% “spring” NDVI, etc.) to use, since the appropriatechoice of parameters may vary by region and/or type of forest dis-turbance. Here, we experiment with approaches that do not dependon choosing particular parameters; instead, using high-performancecomputing, we apply geospatiotemporal data mining techniquesto perform unsupervised classification based on multiple years ofNDVI history for the entire CONUS. These classifications use thefull volume of available NDVI data (rather than only a small subsetof selected parameters) to construct a potential basis for determiningthe “normal” seasonal and inter-seasonal variation expected at a ge-ographic location and to detect deviations from the norm that meritadditional Tier 2 scrutiny.
2. GEOSPATIOTEMPORAL DATA MINING
Hargrove and Hoffman have developed and applied a scalable mul-tivariate statistical procedure that can be used to define a set of cat-egorical, multivariate classes or states that are useful for describ-ing and tracking the behavior of ecosystem properties through timewithin a multi-dimensional phase or state space [2, 3, 4]. Referred toas geospatiotemporal data mining, the procedure employs a standardk-means cluster analysis with enhancements that reduce the numberof required comparisons, dramatically accelerating iterative conver-gence, and dynamically optimizing centroid placement within iter-ations to avoid member-less or empty clusters. This enhanced k-means cluster analysis algorithm has been implemented and testedon large, high performance computing platforms, enabling the analy-sis of very large, high-resolution remotely sensed data. This geospa-tiotemporal data mining method was previously applied to remotelysensed hyperspectral imagery for detection of brine scars [5] andto monthly climate and NDVI data from 17 years of 8 km AdvancedVery High Resolution Radiometer (AVHRR) images for land surfacephenology [6], suggesting that this method could be a key compo-nent of an early warning system for detecting forest threats.
Cluster analysis is sensitive to the initial centroids chosen, andtraditional methods for intelligently determining initial centroids areintractable for very large data sets. For these data, initial centroidsare determined using the method described by Bradley and Fayyad[7], involving two phases of subsampling and cluster trials to pro-duce high quality, highly representative initial centroids. In Phase 1of Bradley’s procedure, the large data set is subsampled many times,Ns, and each subsample is clustered, using k randomly-selectedobservations from the subsample as initial centroids each time. InPhase 2, the Ns groups of k centroids that result from these smallerclustering trials are combined to produce a single new data set thatsubstitutes for the original data. This data set is then clustered Ns
times, using as initial centroids each of the Ns groups of k centroids.A pseudo-F statistic is computed for each of these Phase 2 trials, andthe group of centroids that result from the winning trial (i.e., the onewith the largest pseudo-F score) is chosen to be the set of initialcentroids for clustering the entire, large data set.
For identifying forest disturbances that may represent threats to
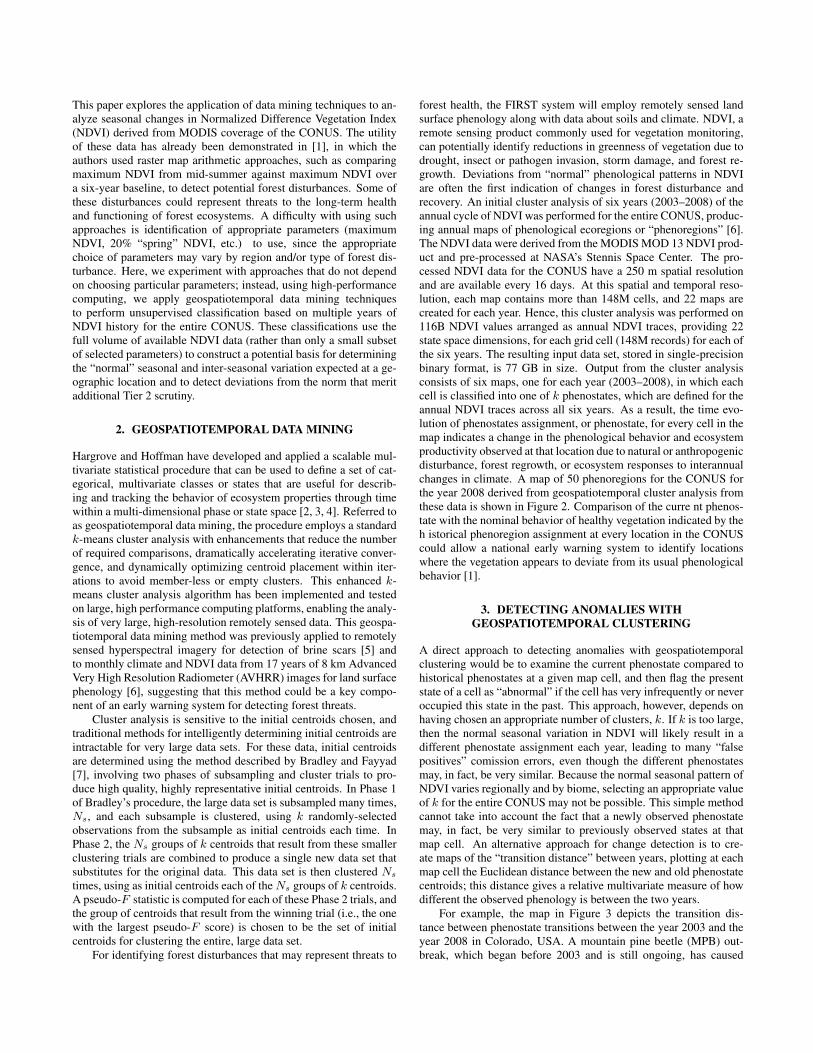
forest health, the FIRST system will employ remotely sensed landsurface phenology along with data about soils and climate. NDVI, aremote sensing product commonly used for vegetation monitoring,can potentially identify reductions in greenness of vegetation due todrought, insect or pathogen invasion, storm damage, and forest re-growth. Deviations from “normal” phenological patterns in NDVIare often the first indication of changes in forest disturbance andrecovery. An initial cluster analysis of six years (2003–2008) of theannual cycle of NDVI was performed for the entire CONUS, produc-ing annual maps of phenological ecoregions or “phenoregions” [6].The NDVI data were derived from the MODIS MOD 13 NDVI prod-uct and pre-processed at NASA’s Stennis Space Center. The pro-cessed NDVI data for the CONUS have a 250 m spatial resolutionand are available every 16 days. At this spatial and temporal reso-lution, each map contains more than 148M cells, and 22 maps arecreated for each year. Hence, this cluster analysis was performed on116B NDVI values arranged as annual NDVI traces, providing 22state space dimensions, for each grid cell (148M records) for each ofthe six years. The resulting input data set, stored in single-precisionbinary format, is 77 GB in size. Output from the cluster analysisconsists of six maps, one for each year (2003–2008), in which eachcell is classified into one of k phenostates, which are defined for theannual NDVI traces across all six years. As a result, the time evo-lution of phenostates assignment, or phenostate, for every cell in themap indicates a change in the phenological behavior and ecosystemproductivity observed at that location due to natural or anthropogenicdisturbance, forest regrowth, or ecosystem responses to interannualchanges in climate. A map of 50 phenoregions for the CONUS forthe year 2008 derived from geospatiotemporal cluster analysis fromthese data is shown in Figure 2. Comparison of the curre nt phenos-tate with the nominal behavior of healthy vegetation indicated by theh istorical phenoregion assignment at every location in the CONUScould allow a national early warning system to identify locationswhere the vegetation appears to deviate from its usual phenologicalbehavior [1].
3. DETECTING ANOMALIES WITHGEOSPATIOTEMPORAL CLUSTERING
A direct approach to detecting anomalies with geospatiotemporalclustering would be to examine the current phenostate compared tohistorical phenostates at a given map cell, and then flag the presentstate of a cell as “abnormal” if the cell has very infrequently or neveroccupied this state in the past. This approach, however, depends onhaving chosen an appropriate number of clusters, k. If k is too large,then the normal seasonal variation in NDVI will likely result in adifferent phenostate assignment each year, leading to many “falsepositives” comission errors, even though the different phenostatesmay, in fact, be very similar. Because the normal seasonal pattern ofNDVI varies regionally and by biome, selecting an appropriate valueof k for the entire CONUS may not be possible. This simple methodcannot take into account the fact that a newly observed phenostatemay, in fact, be very similar to previously observed states at thatmap cell. An alternative approach for change detection is to cre-ate maps of the “transition distance” between years, plotting at eachmap cell the Euclidean distance between the new and old phenostatecentroids; this distance gives a relative multivariate measure of howdifferent the observed phenology is between the two years.
For example, the map in Figure 3 depicts the transition dis-tance between phenostate transitions between the year 2003 and theyear 2008 in Colorado, USA. A mountain pine beetle (MPB) out-break, which began before 2003 and is still ongoing, has caused

significant mortality in Ponderosa and lodgepole pines in Coloradoand Wyoming. Areas of high transition distance in the mountains(central and western portions of the state) correspond closely to ar-eas of MPB activity noted by aerial sketch-map surveys, shown asblack-outlined polygons in the figure. Given the inexact nature ofsuch these surveys, the spatial correspondence between the largestphenostate transitions and the sketch-map polygons is high. Thetransition distance map shown in Figure 3 may provide a more com-prehensive assessment of MPB damage then the sketch-maps. This2003–2008 transition distance map depicts the cumulative damageby MPB over the entire time period while year-to-year transitionmaps for this period (not shown) allow one to chart the yearly pro-gression of the MPB outbreak.
4. CONCLUSIONS
Initial results from the geospatiotemporal cluster analysis of annualphenology patterns from MODIS NDVI confirm its utility for unsu-pervised change detection in remote sensing data and suggest that itmay be successfully implemented as a key component in the FIRSTearly warning system, which is designed to detect forest threats fromnatural and anthropogenic disturbances at a continental scale. Theenhanced k-means clustering algorithm, which can run on comput-ing platforms ranging from small cluster computers to the largestand fastest supercomputers in the world, enables the analysis of verylarge, high resolution remote sensing data such as these. While de-termining what constitutes a “normal” phenological pattern for anygiven location is challenging—due to interannual climate variabil-ity, a spatially varying climate change trend, and the relatively shortrecord of MODIS NDVI observations—significant mortality events,like the progressive damage from MPB, are already easily detectableby simply computing relative transitions between blocks of succes-sive years of phenostates. Moreover, as anomalies are detected andtracked through time, a library of phenostates transitions attributedto pests or pathogens for individual biomes can be built up, allowingthe system to hypothesize about the causes of future disturbancesdetected in functionally similar biomes.
5. ACKNOWLEDGMENTS
The authors wish to thank Joseph P. Spruce at the NASA StennisSpace Center for providing quality controlled NDVI maps generatedfrom the MODIS MOD 13 product. This research was sponsoredby the U.S. Department of Agriculture Forest Service, Eastern For-est Environmental Threat Assessment Center. This research usedresources of the National Center for Computational Science at OakRidge National Laboratory, which is managed by UT-Battelle, LLC,for the U.S. Department of Energy under Contract No. DE-AC05-00OR22725.
6. REFERENCES
[1] William W. Hargrove, Joseph P. Spruce, Gerald E. Gasser, andForrest M. Hoffman, “Toward a national early warning systemfor forest disturbances using remotely sensed phenology,” Pho-togrammetric Engineering & Remote Sensing, vol. 75, no. 10,pp. 1150–1156, Oct. 2009.
[2] Forrest M. Hoffman, William W. Hargrove, Richard T. Mills,Salil Mahajan, David J. Erickson, and Robert J. Oglesby, “Mul-tivariate Spatio-Temporal Clustering (MSTC) as a data min-ing tool for environmental applications,” in Proceedings of
the iEMSs Fourth Biennial Meeting: International Congress onEnvironmental Modelling and Software Society (iEMSs 2008),Miquel Sanchez-Marre, Javier Bejar, Joaquim Comas, An-drea E. Rizzoli, and Giorgio Guariso, Eds., Barcelona, Catalo-nia, Spain, July 2008.
[3] Forrest M. Hoffman, William W. Hargrove, David J. Erickson,and Robert J. Oglesby, “Using clustered climate regimes to ana-lyze and compare predictions from fully coupled general circu-lation models,” Earth Interact., vol. 9, no. 10, pp. 1–27, Aug.2005, doi:10.1175/EI110.1.
[4] William W. Hargrove and Forrest M. Hoffman, “Potential ofmultivariate quantitative methods for delineation and visualiza-tion of ecoregions,” Environ. Manage., vol. 34, no. 5, pp. s39–s60, 2004, doi:10.1007/s00267-003-1084-0.
[5] Forrest M. Hoffman, “Analysis of reflected spectral signaturesand detection of geophysical disturbance using hyperspectralimagery,” M.S. thesis, Department of Physics and Astronomy,University of Tennessee, Knoxville, Nov. 2004.
[6] Michael A. White, Forrest Hoffman, William W. Hargrove, andRamakrishna R. Nemani, “A global framework for monitoringphenological responses to climate change,” Geophys. Res. Lett.,vol. 32, no. 4, Feb. 2005, doi:10.1029/2004GL021961.
[7] Paul S. Bradley and Usama M. Fayyad, “Refining initial pointsfor k-means clustering,” in ICML ’98: Proceedings of theFifteenth International Conference on Machine Learning, SanFrancisco, CA, USA, 1998, pp. 91–99, Morgan Kaufmann Pub-lishers Inc.

Fig. 2. The 2008 map of 50 phenoregions defined for the CONUS derived from geospatiotemporal cluster analysis of MODIS NDVI data.
Fig. 3. The map of relative state-space transition distances for phenoregions between 2003–2008 for Colorado, USA.