geotechnical evaluation - amazon web services
TRANSCRIPT
Geotechnical Evaluation Skyline Hills Community Park
8285 Skyline Drive San Diego, California
MIG, Inc. 1111 6th Avenue, Suite 404 | San Diego, California 92101
June 29, 2017 | Project No. 108232002
Geotechnical | Environmental | Construction Inspection & Testing | Forensic Engineering & Expert Witness Geophysics | Engineering Geology | Laboratory Testing | Industrial Hygiene | Occupational Safety | Air Quality | GIS
Ninyo & Moore | 8285 Skyline Drive, San Diego, California | 108232002 R | June 29, 2017 i
CONTENTS
1 INTRODUCTION 1
2 SCOPE OF SERVICES 1
3 SITE AND PROJECT DESCRIPTION 1
4 SUBSURFACE EVALUATION AND LABORATORY TESTING 2
4.1 Geotechnical Laboratory Testing 2
4.2 Field Infiltration Testing 2
5 GEOLOGIC AND SUBSURFACE CONDITIONS 3
5.1 Regional Geologic Setting 4
5.2 Site Geology 4
5.2.1 Fill 4
5.2.2 Very Old Paralic Deposits 4
5.3 Groundwater 5
5.4 Landslides 5
5.5 Flood Hazards 5
5.6 Geologic Hazards 5
6 FAULTING AND SEISMICITY 5
6.1 Ground Motion 6
6.2 Surface Ground Rupture 6
6.3 Liquefaction and Seismically Induced Settlement 7
7 CONCLUSIONS 7
8 RECOMMENDATIONS 8
8.1 Earthwork 8
8.1.1 Pre-Construction Conference 8
8.1.2 Site Preparation 8
8.1.3 Excavation Characteristics 8
8.1.4 Fill Material 8
8.1.5 Fill Placement and Compaction 9
8.2 Seismic Design Considerations 10
8.3 Shallow Foundations 10
8.3.1 Bearing Capacity of Shallow Foundations 10

Ninyo & Moore | 8285 Skyline Drive, San Diego, California | 108232002 R | June 29, 2017 ii
8.3.2 Lateral Resistance of Shallow Foundations 11
8.3.3 Static Settlement 11
8.4 Shade Structure Foundations 11
8.5 Retaining Walls 12
8.6 Concrete Flatwork 12
8.7 Corrosivity 13
8.8 Concrete Placement 13
8.9 Drainage 13
8.10 Permanent Stormwater BMPs 14
9 PLAN REVIEW AND CONSTRUCTION OBSERVATION 14
10 LIMITATIONS 15
11 REFERENCES 16
TABLES
1 – Infiltration Test Results Summary 3
2 – 2016 California Building Code Seismic Design Criteria 10
FIGURES
1 – Site Location
2 – Boring/Infiltration Test Locations
3 – Geology
4 – Fault Locations
5 – Geologic Hazards
6 – Lateral Earth Pressures for Yielding Retaining Walls
7 – Retaining Wall Drainage Detail
APPENDICES
A – Boring Logs
B – Laboratory Testing
C – Infiltration Test Results
Ninyo & Moore | 8285 Skyline Drive, San Diego, California | 108232002 R | June 29, 2017 1
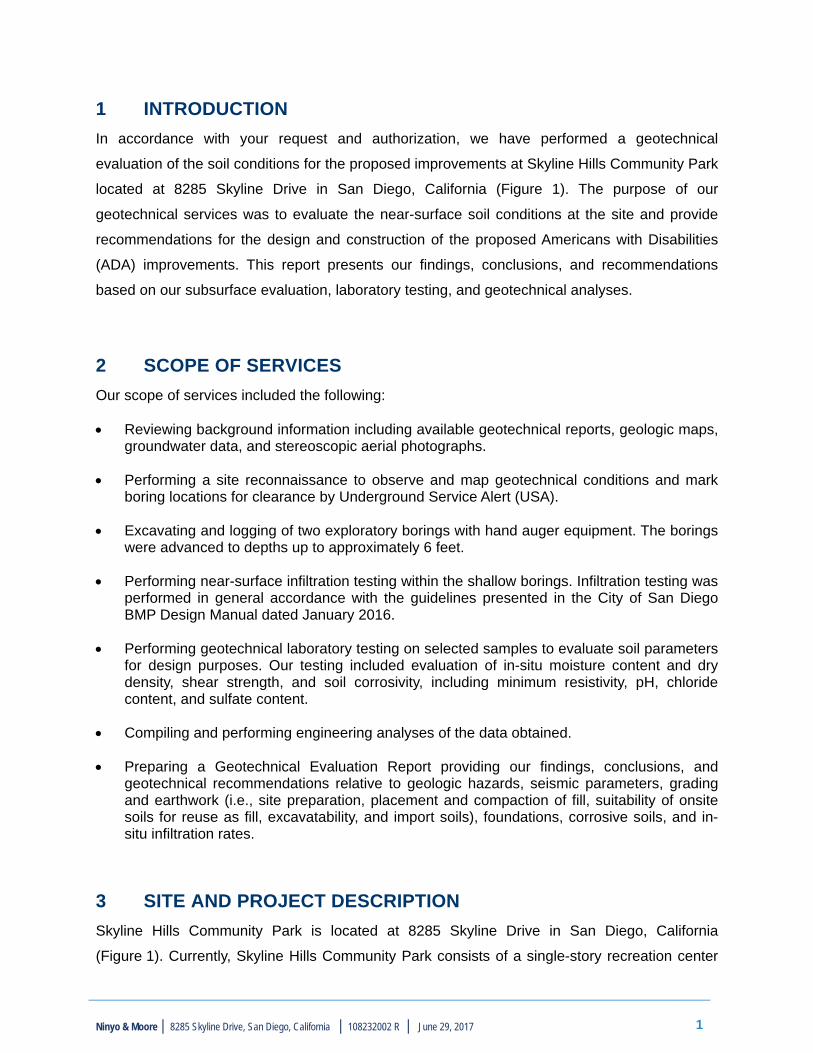
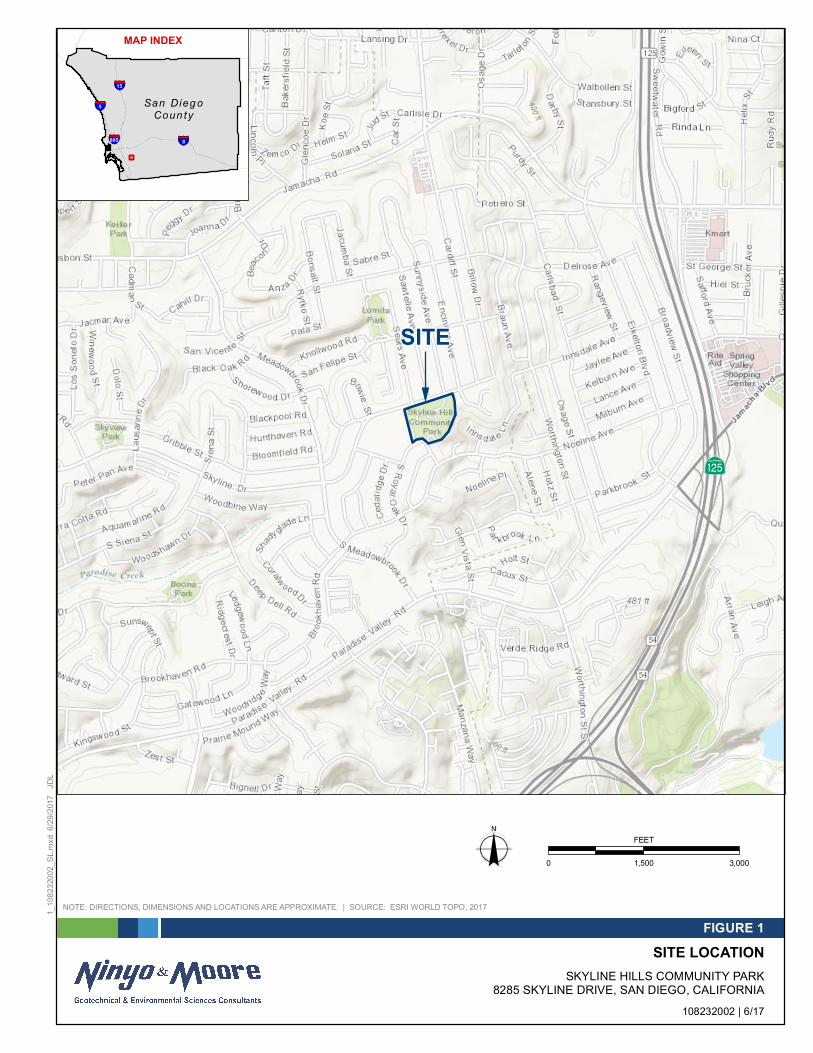
1 INTRODUCTION
In accordance with your request and authorization, we have performed a geotechnical
evaluation of the soil conditions for the proposed improvements at Skyline Hills Community Park
located at 8285 Skyline Drive in San Diego, California (Figure 1). The purpose of our
geotechnical services was to evaluate the near-surface soil conditions at the site and provide
recommendations for the design and construction of the proposed Americans with Disabilities
(ADA) improvements. This report presents our findings, conclusions, and recommendations
based on our subsurface evaluation, laboratory testing, and geotechnical analyses.
2 SCOPE OF SERVICES
Our scope of services included the following:
Reviewing background information including available geotechnical reports, geologic maps, groundwater data, and stereoscopic aerial photographs.
Performing a site reconnaissance to observe and map geotechnical conditions and mark boring locations for clearance by Underground Service Alert (USA).
Excavating and logging of two exploratory borings with hand auger equipment. The borings were advanced to depths up to approximately 6 feet.
Performing near-surface infiltration testing within the shallow borings. Infiltration testing was performed in general accordance with the guidelines presented in the City of San Diego BMP Design Manual dated January 2016.
Performing geotechnical laboratory testing on selected samples to evaluate soil parameters for design purposes. Our testing included evaluation of in-situ moisture content and dry density, shear strength, and soil corrosivity, including minimum resistivity, pH, chloride content, and sulfate content.
Compiling and performing engineering analyses of the data obtained.
Preparing a Geotechnical Evaluation Report providing our findings, conclusions, and geotechnical recommendations relative to geologic hazards, seismic parameters, grading and earthwork (i.e., site preparation, placement and compaction of fill, suitability of onsite soils for reuse as fill, excavatability, and import soils), foundations, corrosive soils, and in-situ infiltration rates.
3 SITE AND PROJECT DESCRIPTION
Skyline Hills Community Park is located at 8285 Skyline Drive in San Diego, California
(Figure 1). Currently, Skyline Hills Community Park consists of a single-story recreation center
Ninyo & Moore | 8285 Skyline Drive, San Diego, California | 108232002 R | June 29, 2017 2
building, asphalt concrete (AC) paved parking lot, grass athletic fields, hard-top
basketball/tennis courts, and a tot-lot/playground with sand and rubber mat surfacing.
Additionally, concrete hardscape and sidewalks and landscape areas extend around and
throughout the park. The park was originally constructed in the late 1960’s. Site elevations
range from approximately 440 to 460 feet above mean sea level (MSL).
The project will consist of constructing ADA improvements at the Park. Specifically, the project
will include constructing new ADA compliant sidewalks, ramps, and play areas. Additionally, a
new picnic shelter will be constructed on the east side of the tot-lot/play area. An approximately
4-foot tall retaining wall will be constructed within the landscape area between Skyline Drive and
the recreation center building to provide an ADA-compliant sidewalk/ramp. A portion of the
sidewalk/flatwork area along the south side of the existing parking lot will be designed and
constructed to support occasional maintenance vehicles.
4 SUBSURFACE EVALUATION AND LABORATORY TESTING
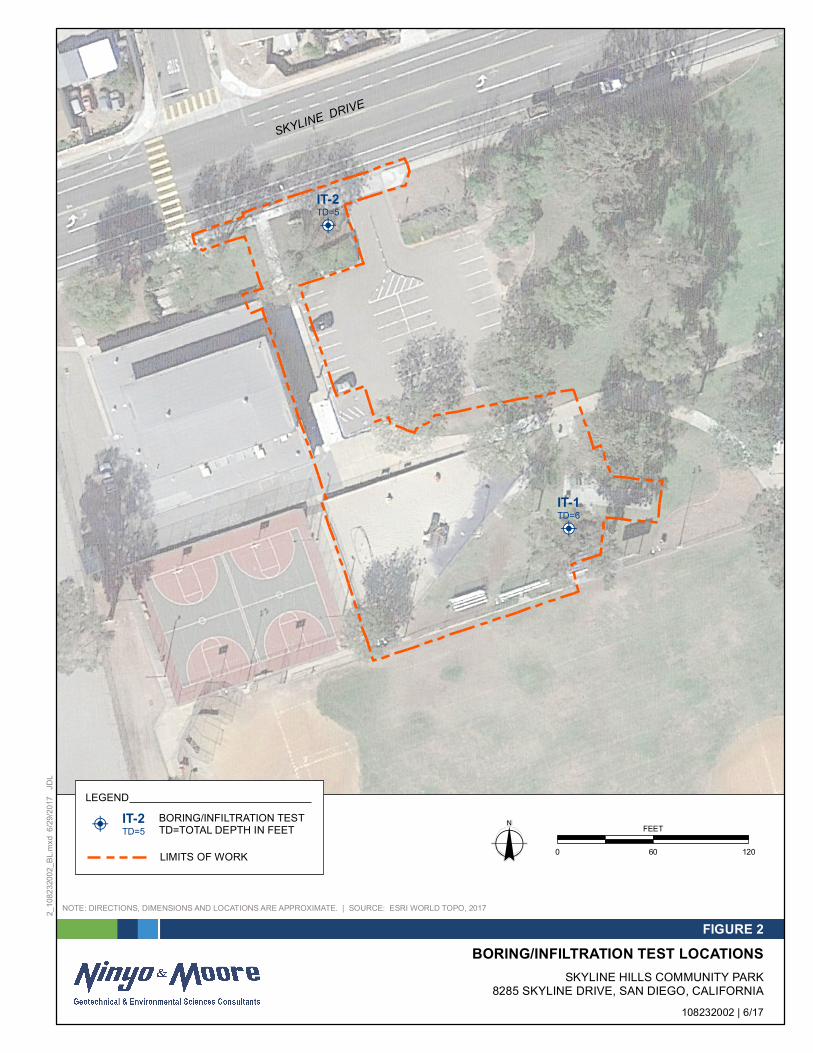
Our subsurface exploration was conducted on June 8, 2017. The subsurface exploration
consisted of excavating, logging, and sampling two small-diameter exploratory borings (IT-1 and
IT-2) to depths of up to approximately 6 feet below the existing ground surface. The two borings
were converted into infiltration tests after sampling and logging. The approximate locations of
the exploratory borings are shown on Figure 2. The purpose of the exploratory borings was to
observe the subsurface materials and to collect bulk and in-place soil samples for laboratory
testing. Representative samples were transported to our in-house geotechnical laboratory for
testing. Logs of the exploratory borings are presented in Appendix A.
4.1 Geotechnical Laboratory Testing
Geotechnical laboratory testing was performed on representative soil samples to evaluate the
in-situ moisture content, shear strength, and corrosivity. The results of the moisture content tests
are presented on the boring logs in Appendix A. The results of the other laboratory tests are
presented in Appendix B.
4.2 Field Infiltration Testing
Field infiltration testing was performed on June 8 and 9, 2017 in general accordance with the
City of San Diego BMP Design Manual (2016). As noted in Section 4, the borings were
excavated, logged, and sampled on June 8, 2017. Following excavation and sampling, the
borings were converted into infiltration tests by placing approximately 2 inches of gravel on the

Ninyo & Moore | 8285 Skyline Drive, San Diego, California | 108232002 R | June 29, 2017 3
bottom of each boring, installing a 2 inch diameter, perforated PVC pipe in the hole, and
backfilling the annulus with pea gravel. As part of the test procedure, presoaking of each hole
was performed to represent adverse conditions for infiltration. The presoak, which was
performed on June 8, 2017, consisted of maintaining approximately 1 to 2 feet of water in each
boring for approximately 4 hours. The water level was then allowed to drop overnight. On
June 9, 2017 testing proceeded by filling each infiltration test with approximately 1 to 2 feet of
water and measuring the water depth in approximately 30 minute intervals for the duration of the
test. During testing, the borings were refilled after the 30-minute readings, as needed, to
maintain the water level. Infiltration rates were then calculated using the Porchet method.
Measurements and calculations are included in Appendix C.
Table 1 – Infiltration Test Results Summary
Infiltration Test Depth of Test
(feet) Description
Adjusted Infiltration Rate (in/hr)
IT-1 6.0 Clayey SILTSTONE
(Formation) 0.02
IT-2 5.0 Sandy SILTSTONE
(Formation) 0.04
Note: in/hr = inches per hour
Based on the City of San Diego BMP Design Manual (2016), infiltration rates of less than
0.5 inches per hour may be suitable for partial infiltration and infiltration rates of 0.5 inches per
hour or greater per hour may be considered suitable for full infiltration design. The infiltration
rates presented above are based on in-situ testing (i.e., factor of safety of 1.0). The design
engineer should evaluate and apply an appropriate factor of safety when designing the
improvements. The City of San Diego BMP Design Manual (2016) provides additional
discussion and considerations for applying an infiltration factor of safety. Recommendations for
placement, design, and construction of permanent stormwater BMPs (if proposed) are
presented in Section 8.10 of this report.
5 GEOLOGIC AND SUBSURFACE CONDITIONS
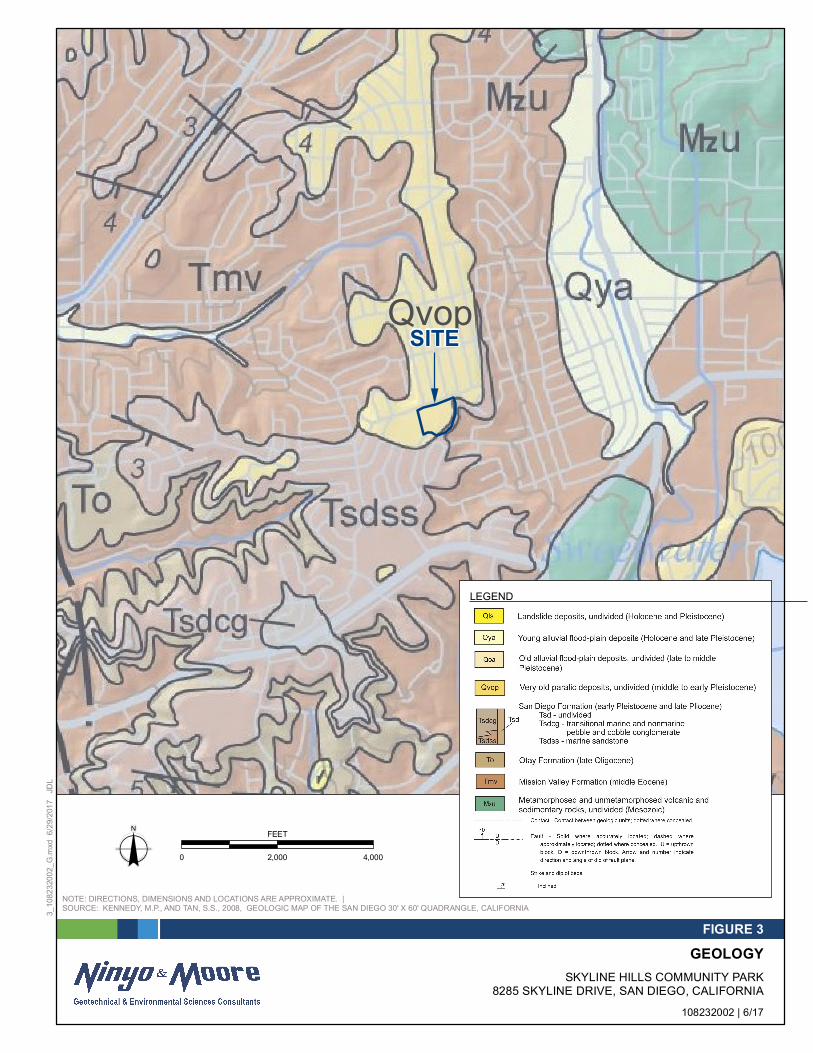
Our findings regarding regional and site geology, including groundwater conditions, flood
hazards, faulting and seismicity, and landslides at the subject site are provided in the following
sections. Figures 3 and 4 are regional geology and fault location maps, respectively.

Ninyo & Moore | 8285 Skyline Drive, San Diego, California | 108232002 R | June 29, 2017 4
5.1 Regional Geologic Setting
The project area is situated in the coastal foothill section of the Peninsular Ranges Geomorphic
Province. This geomorphic province encompasses an area that extends approximately 900
miles from the Transverse Ranges and the Los Angeles Basin south to the southern tip of Baja
California (Norris and Webb, 1990; Harden, 1998). The province varies in width from
approximately 30 to 100 miles. In general, the province consists of rugged mountains underlain
by Jurassic metavolcanic and metasedimentary rocks, and Cretaceous igneous rocks of the
southern California batholith.
The Peninsular Ranges Province is traversed by a group of sub-parallel faults and fault zones
trending roughly northwest. Several of these faults are considered to be active. The Elsinore,
San Jacinto and San Andreas faults are active fault systems located northeast of the project
area and the Rose Canyon, Coronado Bank, San Diego Trough, and San Clemente faults are
active faults located west of the project area. The location of the site relative to these regional
faults is shown on Figure 4. The Rose Canyon Fault Zone, the nearest active fault system, has
been mapped approximately 8 miles west of the project site. Segments of the La Nacion fault
have been mapped approximately 1½ miles west of the site (see Figure 5). However, the La
Nacion Fault is not considered an active fault by the State of California. Major tectonic activity
associated with these and other faults within this regional tectonic framework consists primarily
of right-lateral, strike-slip movement
5.2 Site Geology
The site is mapped as being underlain by very old paralic deposits (Kennedy and Tan, 2008;
Figure 3). Geologic units encountered during our subsurface exploration included surficial fill
underlain by very old paralic deposits. Generalized descriptions of the earth units encountered
during our subsurface exploration and mapped at the site are provided in the subsequent sections.
Additional descriptions of the subsurface units are provided on the boring logs in Appendix A.
5.2.1 Fill
Surficial fill material was encountered in our borings to depths of approximately 6 inches. As
encountered, the fill soils generally consisted of brown and dark brown, dry to moist, medium
dense, silty sand. Scattered gravel and roots were encountered within the fill materials.
5.2.2 Very Old Paralic Deposits
Very old paralic deposits were encountered in our borings beneath the fill materials to the
depths explored. As encountered, the very old paralic deposits consisted of gray to brown

Ninyo & Moore | 8285 Skyline Drive, San Diego, California | 108232002 R | June 29, 2017 5
and yellowish brown, moist, weakly to moderately cemented, fine-grained silty sandstone
and moderately indurated, sandy and clayey siltstone. Gravel and cobbles up to
approximately 6 inches in diameter were encountered within the very old paralic deposits.
5.3 Groundwater
Groundwater was not encountered in our exploratory excavations at the site. Based on review
of monitoring well data in the site vicinity using the Geotracker website (2017), groundwater is
anticipated at depths greater than 30 feet. However, perched water may be encountered at
shallower depths. Fluctuations in the level of groundwater may occur due to variations in ground
surface topography, subsurface stratification, rainfall, irrigation practices, groundwater pumping,
and other factors which may not have been evident at the time of our field evaluation.
5.4 Landslides
Based on our background review and subsurface exploration, no landslides or related features
underlie the project site. The site is in an area mapped as being marginally susceptible to
landsliding (Tan, 1995). The potential for significant large-scale slope instability at the site is not
a design consideration.
5.5 Flood Hazards
Based on our review of Federal Emergency Management Agency (FEMA) Flood Insurance Rate
Maps (FIRM), the project site is located outside of the mapped 100-year flood zone. Therefore,
flooding is not a design consideration for the project.
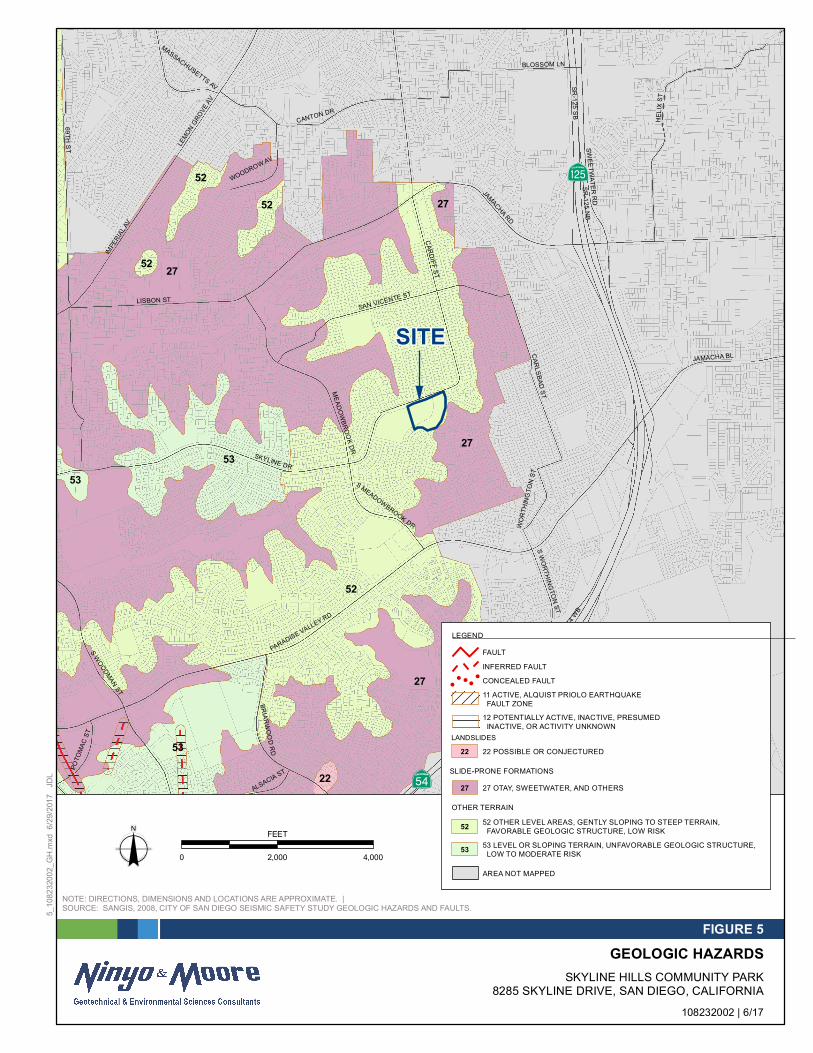
5.6 Geologic Hazards
According to the City of San Diego Seismic Safety Study (2008), the project site lies within
Hazard Category 52 (Figure 5). Hazard Category 52 is defined as “other level areas, gently
sloping to steep terrain, favorable geologic structure, low risk.” Segments of the La Nacion fault
have been mapped approximately 1½ miles west of the site (see Figure 5). However, the La
Nacion Fault is not considered an active fault by the State of California.
6 FAULTING AND SEISMICITY
Based on our review of the referenced geologic maps and stereoscopic aerial photographs, as
well as on our geologic field mapping, the subject site is not underlain by known active or
potentially active faults (i.e., faults that exhibit evidence of ground displacement in the last
Ninyo & Moore | 8285 Skyline Drive, San Diego, California | 108232002 R | June 29, 2017 6
11,000 years and 2,000,000 years, respectively). However, like the majority of southern
California, the site is located in a seismically active area and the potential for strong ground
motion is considered significant during the design life of the proposed structures. As noted, the
nearest known fault is the La Nacion fault, segments of which have been mapped approximately
1½ miles west of the site. The nearest known active fault, the Rose Canyon fault is located
approximately 8 miles west of the site.
In general, hazards associated with faulting and seismic activity include strong ground motion, ground
surface rupture, and liquefaction. These considerations are discussed in the following sections.
6.1 Ground Motion
The 2016 California Building Code (CBC) specifies that the Risk-Targeted, Maximum
Considered Earthquake (MCER) ground motion response accelerations be used to evaluate
seismic loads for design of buildings and other structures. The MCER ground motion response
accelerations are based on the spectral response accelerations for 5 percent damping in the
direction of maximum horizontal response and incorporate a target risk for structural collapse
equivalent to 1 percent in 50 years with deterministic limits for near-source effects. The horizontal
peak ground acceleration (PGA) that corresponds to the MCER for the site was calculated 0.41g
using the United States Geological Survey (USGS, 2017) seismic design tool (web-based).
The 2016 CBC specifies that the potential for liquefaction and soil strength loss be evaluated,
where applicable, for the Maximum Considered Earthquake Geometric Mean (MCEG) peak
ground acceleration with adjustment for site class effects in accordance with the American Society
of Civil Engineers (ASCE) 7-10 Standard. The MCEG peak ground acceleration is based on the
geometric mean peak ground acceleration with a 2 percent probability of exceedance in 50 years.
The MCEG peak ground acceleration with adjustment for site class effects (PGAM) was calculated
as 0.40g using the USGS (2017) seismic design tool that yielded a mapped MCEG peak ground
acceleration of 0.35g for the site and a site coefficient (FPGA) of 1.151 for Site Class D.
6.2 Surface Ground Rupture
As noted, the nearest known fault is the La Nacion Fault, which has been mapped approximately 1½
miles west of the site. The nearest known active fault, the Rose Canyon fault is located
approximately 8 miles west of the site. Since the La Nacion Fault is not considered active, the
potential for ground rupture due to faulting at the site is considered low.

Ninyo & Moore | 8285 Skyline Drive, San Diego, California | 108232002 R | June 29, 2017 7
6.3 Liquefaction and Seismically Induced Settlement
Liquefaction of cohesionless soils can be caused by strong vibratory motion due to earthquakes.
Research and historical data indicate that loose granular soils and non-plastic silts that are
saturated by a relatively shallow ground water table are susceptible to liquefaction. Based on
the relatively dense nature of the very old paralic deposits and the absence of a shallow
groundwater table, liquefaction and seismically induced settlement are not design
considerations.
7 CONCLUSIONS
Based on our background review, subsurface and geotechnical laboratory evaluation, it is our
opinion that construction of the proposed improvements is feasible from a geotechnical stand-
point provided that the recommendations presented in this report are incorporated into the
design and construction. In general, the following conclusions were made:
The site is underlain by surficial fill soils in turn underlain by very old paralic deposits. The very old paralic deposits contained gravel and cobbles up to approximately 6 inches in diameter. The on-site materials are generally considered suitable for reuse provided that they are processed in accordance with the recommendations herein. Processing of the on-site materials may include removal of oversize materials and moisture conditioning.
Excavations are generally considered feasible with heavy-duty earthmoving equipment in good working order. However, very difficult drilling and/or excavating should be anticipated within the very old paralic deposits due to the scattered cobbles and potential for strongly cemented zones. The contractor should be prepared for these conditions.
Groundwater was not encountered during our subsurface exploration. However, seepage and/or perched conditions should be anticipated. Additionally, the depth to groundwater varies due to seasonal precipitation, subsurface conditions, irrigation, groundwater pumping, and other factors.
The site is not located within a State of California Earthquake Fault Zone (formerly Alquist-Priolo Special Studies Zone). Based on our review of published geologic maps and aerial photographs, no known active or potentially active faults underlie the site. The potential for surface fault rupture at the site is considered to be low.
Field infiltration testing indicated infiltration rates of 0.02 and 0.04 inches per hour based on a factor of safety of 1.0. However, an appropriate factor of safety should be applied to the measured infiltration rates during design. The design infiltration rates, which include an appropriate factor of safety, are anticipated to be near 0.01 inches per hour or less. Accordingly, infiltration at the site is not considered feasible. Recommendations for placement, design, and construction of permanent stormwater BMPs (if proposed) are presented herein.
Based on laboratory corrosion testing, the on-site soils are classified as corrosive in accordance with Caltrans (2015) guidelines and ACI 318. A corrosion engineer should be consulted during design to provide appropriate recommendations.

Ninyo & Moore | 8285 Skyline Drive, San Diego, California | 108232002 R | June 29, 2017 8
8 RECOMMENDATIONS
The geotechnical recommendations relative to the design and construction of the proposed
improvements are presented in the following paragraphs.
8.1 Earthwork
Earthwork at the site is anticipated to consist of minor grading. Earthwork should be performed
in accordance with the requirements of applicable governing agencies, and the
recommendations presented in the following sections.
8.1.1 Pre-Construction Conference
We recommend that a pre-construction conference be held. The owner and/or their
representative, the governing agencies’ representatives, the civil engineer, Ninyo & Moore,
and the contractor should be in attendance to discuss the work plan and project schedule
and earthwork requirements.
8.1.2 Site Preparation
Prior to performing site excavations, the surface areas should be cleared of existing
improvements, vegetation, surface obstructions, and other deleterious materials.
Construction materials, vegetation, and debris from the clearing operations should be
disposed of off-site. Obstructions that extend below the finished grade, if any, should be
removed and the resulting holes filled with compacted fill.
8.1.3 Excavation Characteristics
Based on our borings, the on-site earth materials should be generally excavatable with
heavy-duty earthmoving equipment in good working condition. However, the presence of
cobbles and/or potential cemented zones will result in the need for additional effort during
excavation.
8.1.4 Fill Material
In general, the existing on-site materials are considered suitable for reuse as fill, provided
that the oversize materials (i.e., materials with dimensions in excess of those outlined
herein) are removed from the soil mass prior to reuse. Fill material should be free of trash,
debris or other deleterious materials. Material for use as fill should not contain rocks or
lumps greater than approximately 4 inches in size.

Ninyo & Moore | 8285 Skyline Drive, San Diego, California | 108232002 R | June 29, 2017 9
Utility trench backfill material should not contain rocks or lumps over approximately 3 inches
in general. Soils classified as silts or clays should not be used for backfill in the pipe zone.
Larger chunks, if generated during excavation, may be broken into acceptably sized pieces
or disposed of offsite.
Imported fill material, if used, should generally be granular soils with a very low expansion
potential (i.e., an expansion index [EI] of 20 or less evaluated in accordance ASTM D 4829.
Import material should also be non-corrosive in accordance with the Caltrans (2015) corrosion
guidelines. Ninyo & Moore should evaluate materials for use as fill prior to filling or importing.
8.1.5 Fill Placement and Compaction
Prior to placement of compacted fill the contractor should request an evaluation of the
exposed ground surface by Ninyo & Moore. Unless otherwise recommended, the exposed
ground surface should then be scarified to a depth of approximately 8 inches and watered
or dried, as needed, to achieve generally consistent moisture contents above the laboratory
optimum. The scarified materials should then be compacted to 90 percent relative
compaction in accordance with ASTM D 1557. The evaluation of compaction by the
geotechnical consultant should not be considered to preclude any requirements for
observation or approval by governing agencies. It is the contractor's responsibility to notify
the geotechnical consultant and the appropriate governing agency when project areas are
ready for observation, and to provide reasonable time for that review.
Fill materials conforming to our recommendations for Materials for Fill, should be moisture
conditioned to generally above the laboratory optimum moisture content prior to placement.
The optimum moisture content will vary with material type and other factors. Moisture
conditioning of fill soils should be generally consistent within the soil mass.
Prior to placement of additional compacted fill material following a delay in the grading
operations, the exposed surface of previously compacted fill should be prepared to receive
fill. Preparation may include scarification, moisture conditioning, and recompaction.
Compacted fill should be placed in horizontal lifts of approximately 8 inches in loose
thickness. Prior to compaction, each lift should be watered or dried as needed to achieve
generally above optimum moisture content, mixed, and then compacted by mechanical
methods to a relative compaction of 90 percent as evaluated by ASTM D 1557. The upper 12
inches of subgrade for flatwork/sidewalks that will be subject to vehicle loading should be

Ninyo & Moore | 8285 Skyline Drive, San Diego, California | 108232002 R | June 29, 2017 10
compacted by mechanical methods to 95 percent as evaluated by ASTM D 1557. Successive
lifts should be treated in a like manner until the desired finished grades are achieved.
8.2 Seismic Design Considerations
Design of the proposed improvements should be performed in accordance with the
requirements of governing jurisdictions and applicable building codes. Table 2 presents the
seismic design parameters for the site in accordance with the CBC (2016) guidelines and
adjusted MCER spectral response acceleration parameters (USGS, 2017).
Table 2 – 2016 California Building Code Seismic Design Criteria
Seismic Design Factors Value
Site Class D
Site Coefficient, Fa 1.146
Site Coefficient, Fv 1.720
Mapped Spectral Acceleration at 0.2-second Period, Ss 0.885g
Mapped Spectral Acceleration at 1.0-second Period, S1 0.340g
Spectral Acceleration at 0.2-second Period Adjusted for Site Class, SMS 1.014g
Spectral Acceleration at 1.0-second Period Adjusted for Site Class, SM1 0.585g
Design Spectral Response Acceleration at 0.2-second Period, SDS 0.676g
Design Spectral Response Acceleration at 1.0-second Period, SD1 0.390g
8.3 Shallow Foundations
Based on our understanding of the project, the proposed retaining wall and other ancillary
structures will be supported on shallow continuous and/or spread foundations. The following
sections provide parameters for the design of shallow foundations bearing on formational
materials.
8.3.1 Bearing Capacity of Shallow Foundations
Shallow, spread or continuous footings bearing on formational material (very old paralic
deposits) may be designed using a net allowable bearing capacity of 2,500 pounds per
square foot (psf). This allowable bearing capacity may be increased by one-third when
considering loads of short duration such as wind or seismic forces. Shallow, spread or
continuous footings should be founded 15 inches or more below the lowest adjacent grade
and should have a width of 18 inches or more. The shallow, spread or continuous footings
should be reinforced in accordance with the recommendations of the project structural
engineer.

Ninyo & Moore | 8285 Skyline Drive, San Diego, California | 108232002 R | June 29, 2017 11
8.3.2 Lateral Resistance of Shallow Foundations
For resistance of footings to lateral loads, we recommend a passive pressure of 300 psf
per foot of depth be used with a value of up to 3,000 psf. This value assumes that the
ground is horizontal for a distance of 10 feet, or three times the height generating the
passive pressure, whichever is greater. We recommend that the upper 1 foot of soil not
protected by pavement or a concrete slab be neglected when calculating passive
resistance.
For frictional resistance to lateral loads, we recommend a coefficient of friction of 0.35 be
used between soil and concrete. The allowable lateral resistance can be taken as the
sum of the frictional resistance and passive resistance provided the passive resistance
does not exceed one-half of the total allowable resistance.
8.3.3 Static Settlement
We estimate that the proposed structures, designed and constructed with shallow
foundations bearing on formational materials as recommended herein, will undergo total
settlement on the order of 1 inch. Differential settlement on the order of ½ inch over a
horizontal span of 40 feet should be expected.
8.4 Shade Structure Foundations
Shade structure foundations should be supported on cast-in-drilled-hole piles. Shade structure
foundations typically impose relatively light axial loads on foundations. Although we anticipate
that pile dimensions will be generally controlled by the lateral load demand, we recommend that
drilled shade structure foundations have a diameter of 18 inches or more and be embedded 4
feet or more into the very old paralic deposits. The pile dimensions (i.e., diameter and
embedment) should be evaluated by the project structural engineer.
For axial, compressional loading, we recommend that the shade structure foundations be de-
signed for an allowable soil bearing value of 2,500 psf. This value can be increased by one-third
for loads of short duration, including wind and seismic loading. For resistance to uplift loads
(related to short-term transient loading such as wind and seismic forces), an allowable side
frictional resistance value of 100 psf can be assumed along the perimeter of piles that are
installed 4 feet or more into the very old paralic deposits.
For resistance of shade structure foundations to lateral loads that are founded in very old paralic
deposits, we recommend an allowable passive pressure of 300 psf per foot of depth be used
with a value of up to 3,000 psf. This value assumes that the ground is horizontal for a distance
Ninyo & Moore | 8285 Skyline Drive, San Diego, California | 108232002 R | June 29, 2017 12
of 10 feet, or three times the height generating the passive pressure, whichever is greater. We
recommend that the upper 1 foot of soil not protected by pavement or a concrete slab be
neglected when calculating passive resistance.
For frictional resistance to lateral loads, we recommend a coefficient of friction of 0.35 be used
between soil and concrete. The allowable lateral resistance can be taken as the sum of the
frictional resistance and passive resistance provided the passive resistance does not exceed
one half of the total allowable resistance.
The drilled pile construction should be observed by Ninyo & Moore during construction to
evaluate if the piles have been extended to the design depths. The drilled holes should be
cleaned of loose soil and gravel. It is the contractor's responsibility to (a) take appropriate
measures for maintaining the integrity of the drilled holes, (b) see that the holes are cleaned and
straight, and (c) see that sloughed loose soil is removed from the bottom of the hole prior to the
placement of concrete. Drilled piles should be checked for alignment and plumbness during
installation. The amount of acceptable misalignment of a pile is approximately 3 inches from the
plan location. It is usually acceptable for a pile to be out of plumb by 1 percent of the depth of
the pile. The center-to-center spacing of piles should be no less than three times the nominal
diameter of the pile.
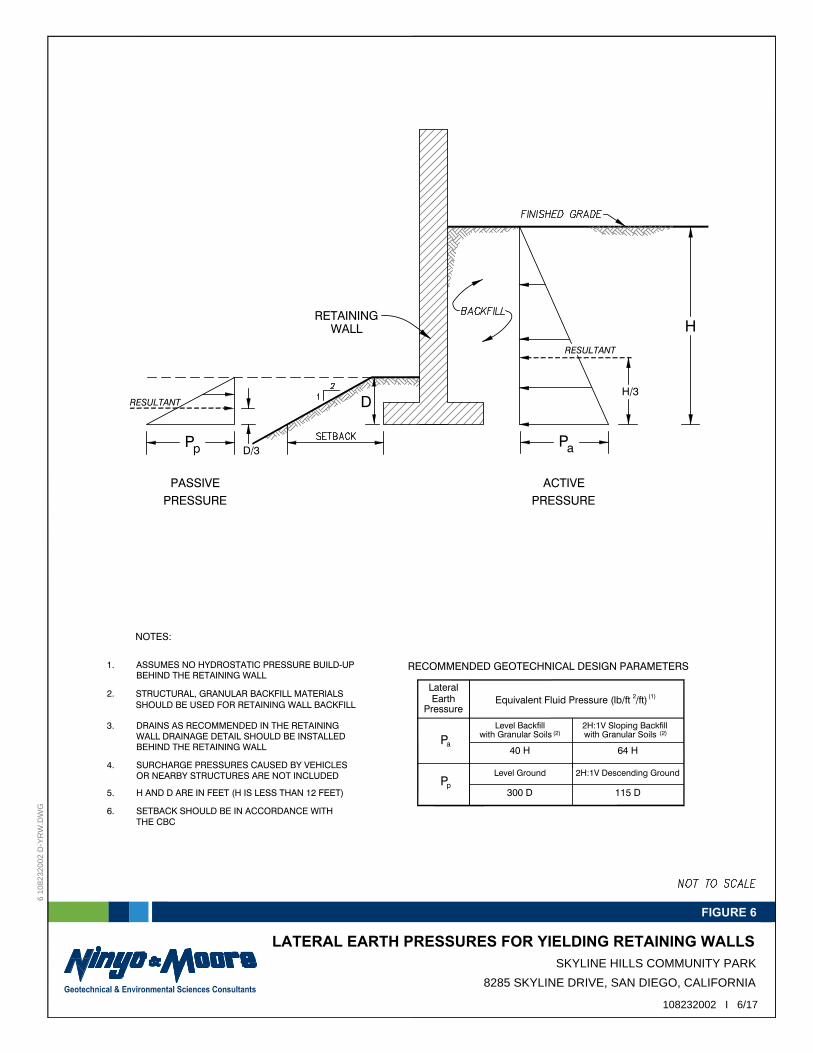
8.5 Retaining Walls
The proposed retaining wall may be supported on a continuous footing bearing on very old
paralic deposits in accordance with Section 8.3 of this report. For the design of a site yielding
retaining wall that is not restrained against movement by rigid corners or structural connections,
lateral pressures are presented on Figure 6. These pressures assume select backfill materials
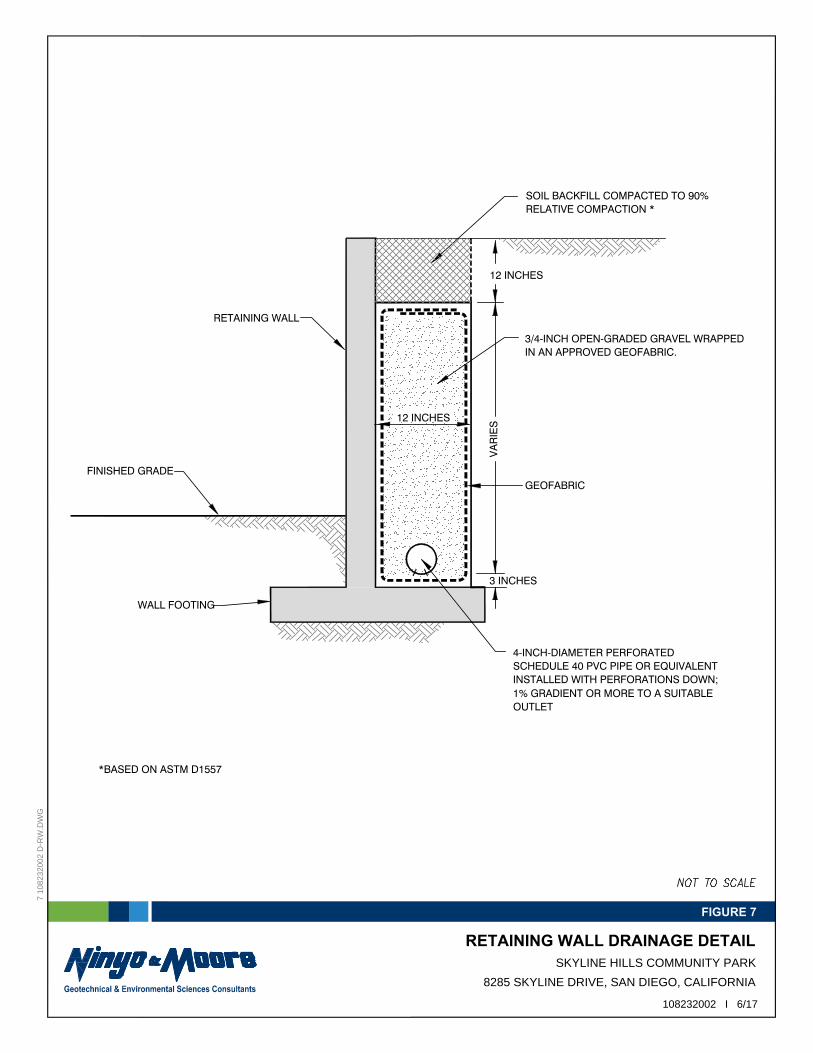
are used and free draining conditions. Measures should be taken to reduce the potential for
build-up of moisture behind the retaining walls. A drain should be provided behind the retaining
wall as shown on Figure 7. The drain should be connected to an appropriate outlet.
8.6 Concrete Flatwork
Conventional concrete flatwork should be 4 inches in thickness and should be reinforced with
No. 3 reinforcing bars placed at 18 inches on-center both ways. To reduce the potential
manifestation of distress to exterior concrete flatwork due to minor soil movement and concrete
shrinkage, we recommend that such flatwork be installed with crack-control joints at appropriate
spacing as designed by the structural engineer.

Ninyo & Moore | 8285 Skyline Drive, San Diego, California | 108232002 R | June 29, 2017 13
Concrete flatwork that will be subjected to vehicular loads should be 5½ inches in thickness and
should be reinforced with No. 4 reinforcing bars placed at 18 inches on-center both ways. To
reduce the potential manifestation of distress to exterior concrete flatwork due to minor soil
movement and concrete shrinkage, we recommend that such flatwork be installed with crack-
control joints at appropriate spacing as designed by the structural engineer.
8.7 Corrosivity
Laboratory testing was performed on a representative sample of the on-site earth materials to
evaluate pH and electrical resistivity, as well as chloride and sulfate contents. The pH and
electrical resistivity tests were performed in accordance with California Test (CT) 643 and the
sulfate and chloride content tests were performed in accordance with CT 417 and CT 422,
respectively. These laboratory test results are presented in Appendix B.
The results of the corrosivity testing indicated an electrical resistivity of 660 ohm-cm, a soil pH of
6.8, a chloride content of 315 parts per million (ppm) and a sulfate content of 0.246 percent (i.e.,
2,460 ppm). Based on the Caltrans corrosion (2015) criteria and ACI 318, the on-site soils would
be classified as corrosive. Corrosive soils are defined as the soils with electrical resistivities less
than 1,000 ohm-cm, more than 500 ppm chlorides, more than 0.2 percent sulfates, or a pH less
than 5.5. A corrosion engineer should be consulted with during design and construction to
provide recommendations.
8.8 Concrete Placement
Concrete in contact with soil or water that contains high concentrations of water-soluble sulfates
can be subject to premature chemical and/or physical deterioration. As stated above, the soil
sample tested in this evaluation indicated a water-soluble sulfate content of 0.246 percent by
weight (i.e., about 2,460 ppm). According to the American Concrete Institute (ACI) 318, the
potential for sulfate attack is severe for water-soluble sulfate contents ranging between 0.20 and
2.0 percent weight (i.e., between 2,000 and 20,000 ppm) in soils. Accordingly, we recommend that
Type V cement be used for concrete in contact with soil, that the water to cement ratio not exceed
0.45, and that the minimum 28-day compressive strength be 4,500 pounds per square inch (psi).
8.9 Drainage
Proper surface drainage is imperative for satisfactory site performance. Positive drainage
should be provided and maintained to direct surface water away from the new sidewalk and
retaining wall improvements. Positive drainage is defined as a slope of 2 percent or more over a
distance of 5 feet away from the foundations and tops of slopes. Runoff should then be directed

Ninyo & Moore | 8285 Skyline Drive, San Diego, California | 108232002 R | June 29, 2017 14
by the use of swales or pipes into a collective drainage system. Surface waters should not be
allowed to pond adjacent to footings or pavements.
8.10 Permanent Stormwater BMPs
As described earlier, results of in-situ testing of the underlying materials indicate infiltration rates
of 0.02 and 0.04 inches per hour. These rates are based on a factor of safety of 1.0. An
appropriate factor of safety should be applied for design purposes. Design infiltration rates,
which include an appropriate factor of safety, are anticipated to be on the order of 0.01 inches
per hour or less. Due to the anticipated low design infiltration rates measured at the site and the
relatively dense nature of the very old paralic deposits, infiltration will result in lateral migration
of subsurface water and potential stormwater ponding. Accordingly, infiltration is not considered
feasible at the site. We recommend permanent stormwater BMPs, if proposed, be designed and
constructed to mitigate the potential ponding of stormwater. Considerations may include
providing positive drainage and/or connecting to an existing outlet. Additional recommendations
and/or considerations should be provided by the project civil engineer.
9 PLAN REVIEW AND CONSTRUCTION OBSERVATION
The conclusions and recommendations presented in this report are based on analysis of
observed conditions in widely spaced exploratory excavations. If conditions are found to vary
from those described in this report, Ninyo & Moore should be notified, and additional
recommendations will be provided upon request. Ninyo & Moore should review the final project
drawings and specifications prior to the commencement of construction. Ninyo & Moore should
perform the needed observation and testing services during construction operations.
The recommendations provided in this report are based on the assumption that Ninyo & Moore
will provide geotechnical observation and testing services during construction. In the event that
it is decided not to utilize the services of Ninyo & Moore during construction, we request that the
selected consultant provide the client with a letter (with a copy to Ninyo & Moore) indicating that
they fully understand Ninyo & Moore’s recommendations, and that they are in full agreement
with the design parameters and recommendations contained in this report. Construction of
proposed improvements should be performed by qualified subcontractors utilizing appropriate
techniques and construction materials

Ninyo & Moore | 8285 Skyline Drive, San Diego, California | 108232002 R | June 29, 2017 15
10 LIMITATIONS
The field evaluation, laboratory testing, and geotechnical analyses presented in this
geotechnical report have been conducted in general accordance with current practice and the
standard of care exercised by geotechnical consultants performing similar tasks in the project
area. No warranty, expressed or implied, is made regarding the conclusions, recommendations,
and opinions presented in this report. There is no evaluation detailed enough to reveal every
subsurface condition. Variations may exist and conditions not observed or described in this
report may be encountered during construction. Uncertainties relative to subsurface conditions
can be reduced through additional subsurface exploration. Additional subsurface evaluation will
be performed upon request.
This document is intended to be used only in its entirety. No portion of the document, by itself, is
designed to completely represent any aspect of the project described herein. Ninyo & Moore
should be contacted if the reader requires additional information or has questions regarding the
content, interpretations presented, or completeness of this document.
This report is intended for design purposes only. It does not provide sufficient data to prepare an
accurate bid by contractors. It is suggested that the bidders and their geotechnical consultant
perform an independent evaluation of the subsurface conditions in the project areas. The
independent evaluations may include, but not be limited to, review of other geotechnical reports
prepared for the adjacent areas, site reconnaissance, and additional exploration and laboratory
testing.
Our conclusions, recommendations, and opinions are based on an analysis of the observed site
conditions. If geotechnical conditions different from those described in this report are
encountered, our office should be notified, and additional recommendations, if warranted, will be
provided upon request. It should be understood that the conditions of a site could change with
time as a result of natural processes or the activities of man at the subject site or nearby sites.
In addition, changes to the applicable laws, regulations, codes, and standards of practice may
occur due to government action or the broadening of knowledge. The findings of this report may,
therefore, be invalidated over time, in part or in whole, by changes over which Ninyo & Moore
has no control.
This report is intended exclusively for use by the client. Any use or reuse of the findings,
conclusions, and/or recommendations of this report by parties other than the client is
undertaken at said parties’ sole risk.
Ninyo & Moore | 8285 Skyline Drive, San Diego, California | 108232002 R | June 29, 2017 16
11 REFERENCES
American Concrete Institute (ACI), 2014, ACI 318 Building Code Requirements for Structural Concrete and Commentary.
Building News, 2015, “Greenbook,” Standard Specifications for Public Works Construction: BNI Publications.
California Building Standards Commission, 2016, California Building Code, Title 24, Part 2, Volumes 1 and 2: dated July 1.
California Department of Transportation (Caltrans), 2015, Corrosion Guidelines (Version 2.1), Division of Engineering Services, Materials Engineering and Testing Services, Corrosion and Structural Concrete Field Investigation Branch: dated January.
California Geological Survey (CGS), 1998, Maps of Known Active Fault Near-Source Zones in California and Adjacent Portions of Nevada: dated February.
City of San Diego, 1958, Metropolitan Topographic Survey (Orthotopo), Sheet 194-1761, Scale 1:2,400, revised 1970.
City of San Diego, 1986, Topographic Survey (Orthotopo), Sheet 194-1761, Scale 1:2,400.
City of San Diego, 2008, Seismic Safety Study, Geologic Hazards and Faults, Grid 19, Scale 1: 9,600.
City of San Diego, 2015, The “Whitebook”, Standard Specifications for Public Works Construction.
City of San Diego, Public Works Department, 2016, Standard Drawings for Public Works Construction.
City of San Diego BMP Design Manual, 2016, Storm Water Requirements for Development Applications: dated: January.
Geotracker, 2017, State Water Resources Control Board, https://geotracker.waterboards.ca.gov/: accessed June.
Google Earth, 2017, http://earth.google.com: accessed June.
Harden, D.R., 2004, California Geology – 2nd ed.: Prentice Hall, Inc.
Hart, E.W., and Bryant, W.A., 1997, Fault Rupture Hazard Zones in California, Alquist-Priolo Earthquake Fault Zoning Act with Index to Earthquake Fault Zone Maps: California Geological Survey, Special Publication 42, with Supplements 1 and 2 added in 1999.
Historic Aerials, 2017, Aerial Photographs, www.hisotricaerials.com: accessed in June.
Jennings, C.W., 2010, Fault Activity Map of California: California Geological Survey, California Geologic Data Map Series, Map No. 6, Scale 1: 750,000.
Kennedy, M.P., and Tan, S.S., 2008, Geologic Map of the San Diego 30’ x 60’ Quadrangle, California, California Geologic Survey, Regional Geologic Map No. 3, Scale 1:100,000.
Ninyo & Moore, In-House Proprietary Information.
Norris, R. M. and Webb, R. W., 1990, Geology of California, Second Edition: John Wiley & Sons, Inc.
Tan, S.S., 1995, Landslide Hazards in the Southern Part of the San Diego Metropolitan Area, San Diego County, California, Landslide Hazard Identification Map No. 33, DMG Open-File Report 95-03.
Treiman, J.A., 1993, The Rose Canyon Fault Zone, Southern California: California Geological Survey, Open File Report 93-02.
Ninyo & Moore | 8285 Skyline Drive, San Diego, California | 108232002 R | June 29, 2017 17
United States Department of the Interior, Bureau of Reclamation, 1989, Engineering Geology Field Manual.
United States Federal Emergency Management Agency (FEMA), 2012, Flood Insurance Rate Map (FIRM), Map Number 06073C1910G: effective date May 16.
United States Geological Survey (USGS), 2015, National City, California Quadrangle Map, 7.5 Minute Series: Scale 1:24,000.
United States Geological Survey (USGS), 2008, 2008 National Seismic Hazard Maps – Fault Parameters Database, World Wide Web, https://earthquake.usgs.gov/cfusion/ hazfaults_2008_search/query_main.cfm.
United States Geological Survey (USGS), 2017, U.S. Seismic Design Maps World Wide Web, http://earthquake.usgs.gov/designmaps/us/application.php: accessed June.
USDA, Aerial Photograph, Date 4-14-53, Flight AXN-10M, Number 114 and 115, Scale 1:20,000.
Ninyo & Moore | 8285 Skyline Drive, San Diego, California | 108232002 R | June 29, 2017
Appendix A
Photographic Documentation
FIGURES
Aä
SITE"
1_10
8232
002_
SL.m
xd 6
/29/20
17 J
DL
NOTE: DIRECTIONS, DIMENSIONS AND LOCATIONS ARE APPROXIMATE. | SOURCE: ESRI WORLD TOPO, 2017
SITE LOCATIONSKYLINE HILLS COMMUNITY PARK
8285 SKYLINE DRIVE, SAN DIEGO, CALIFORNIA108232002 | 6/17
FIGURE 1
!o 0 1,500 3,000
FEET
§̈¦15
§̈¦5
§̈¦8§̈¦805
MAP INDEX
San Dieg oCoun ty
@?&
@?&
IT-1TD=6
IT-2TD=5
SKYLINE DRIVE
!o
2_10
8232
002_
BL.m
xd 6
/29/20
17 J
DL
NOTE: DIRECTIONS, DIMENSIONS AND LOCATIONS ARE APPROXIMATE. | SOURCE: ESRI WORLD TOPO, 2017
BORING/INFILTRATION TEST LOCATIONSSKYLINE HILLS COMMUNITY PARK
8285 SKYLINE DRIVE, SAN DIEGO, CALIFORNIA108232002 | 6/17
FIGURE 2
0 60 120
FEET
BORING/INFILTRATION TESTTD=TOTAL DEPTH IN FEET@?&
IT-2TD=5
LEGEND
LIMITS OF WORK
LEGEND
Qvop
!o
3_10
8232
002_
G.mx
d 6/2
9/201
7 JD
L
NOTE: DIRECTIONS, DIMENSIONS AND LOCATIONS ARE APPROXIMATE. |SOURCE: KENNEDY, M.P., AND TAN, S.S., 2008, GEOLOGIC MAP OF THE SAN DIEGO 30' X 60' QUADRANGLE, CALIFORNIA
FIGURE 3
0 2,000 4,000
FEET
GEOLOGYSKYLINE HILLS COMMUNITY PARK
8285 SKYLINE DRIVE, SAN DIEGO, CALIFORNIA108232002 | 6/17
SITE"

M E X I C OU S A
P a c i f i c O c e a n
NEVADACALIFORN IA
!
SAN
J A C IN T O
E L S I N O R E
IMPE R I AL
W H I T T I E R
N EWPO RT - I NG L E WO OD
CORONADOBANK
SAN DIEGOTROUGH
SAN CLEMENTE
SANTA CRUZ-SANTA CATALINA RIDGEPALOS VERDES
OFFSHORE ZONE
OF DEFORMATION
GARLOCK
CLEARWATERSAN
GABRIEL
SIERRA MADRE
B A N N I N G
M I S S I O N C R E E KBLACKWATERHARPER
LOCKHART
LENWOOD
CAMP ROCKCALICO
LUDLOW
PISGAH
BULLION MOUNTAIN
JOHNSON VALLEY
EMERSON
PINTO MOUNTAIN
MANIX
MIRAGE VALLEY
NORTH
HELENDALE
FRONTAL
CHINO
SAN JOSECUCAMONGA
MALIBU COAST SANTA MONICA
SANCAYETANO
SANTASUSANASANTA
ROSA
NORTHRIDGE
CHARNOCK
SAWPITCANYON
SUPERSTITION HILLS
RO SECANY ON
PINE MOUNTAIN
WHITE WOLF
SAN ANDREAS FAULT ZONE
PLEITOWHEELER
POSO CREEK
BLUE CUT
SALTON CREEK
SAN ANDREAS FAULT ZONECOYOTE CREEK
CLARK
G L E NI V Y
E A RT H Q U A K EVA LL E Y
ELMO
RERA
NCH
LA GUNASA LADA
BRAWLEY SEISMIC
ZONE
San Bernardino County
Kern County
Riverside County
San Diego County
Imperial County
Los Angeles County
Inyo County
Tulare County
Ventura County
Orange County
CAL I F ORN IA
LEGEND
HOLOCENE ACTIVE
CALIFORNIA FAULT ACTIVITY HISTORICALLY ACTIVE
LATE QUATERNARY (POTENTIALLY ACTIVE)
STATE/COUNTY BOUNDARY
QUATERNARY (POTENTIALLY ACTIVE)
SITE
"
!o
4_10
8232
002_
FL.m
xd 6
/15/20
17 J
DL
NOTE: DIRECTIONS, DIMENSIONS AND LOCATIONS ARE APPROXIMATE. |SOURCE: U.S. GEOLOGICAL SURVEY AND CALIFORNIA GEOLOGICAL SURVEY, 2013, QUATERNARY FAULT AND FOLD DATABASE FOR THE UNITED STATES.
FIGURE 4FAULT LOCATIONS
SKYLINE HILLS COMMUNITY PARK8285 SKYLINE DRIVE, SAN DIEGO, CALIFORNIA
108232002 | 6/17
0 30 60
MILES
JAMACHA RD
IMPERIAL
AV
WOODROW AV
S WORTHINGTON ST
MASSACHUSETTS AV
HELIX
ST
BLOSSOM LN
S MEADOWBROOK DR
SWEETWATER RD
CANTON DR
SKYLINE DR
LISBON ST
69TH ST
MEADOWBROOK DR
CARLSBAD ST
JAMACHA BL
BRIARWOOD RD
ALSACIA ST
SAN VICENTE ST
WORT
HING
TON
ST
S WOODMAN ST
SR-54
WB
LEMON GROVE
AV
PARADISE VALLEY RD
CARDIFF ST
SR-54 EB
SR-125 SBSR-125 NB
POTO
MAC
ST
27
53
52
52 27
52
2753
27
22
52
53
LEGEND
12 POTENTIALLY ACTIVE, INACTIVE, PRESUMED INACTIVE, OR ACTIVITY UNKNOWN
!
! !
!
!
FAULTINFERRED FAULTCONCEALED FAULT11 ACTIVE, ALQUIST PRIOLO EARTHQUAKE FAULT ZONE
52 OTHER LEVEL AREAS, GENTLY SLOPING TO STEEP TERRAIN, FAVORABLE GEOLOGIC STRUCTURE, LOW RISK53 LEVEL OR SLOPING TERRAIN, UNFAVORABLE GEOLOGIC STRUCTURE, LOW TO MODERATE RISK
OTHER TERRAIN
52
53
SLIDE-PRONE FORMATIONS27 OTAY, SWEETWATER, AND OTHERS27
AREA NOT MAPPED
Aä
SITE"
!o
5_10
8232
002_
GH.m
xd 6
/29/20
17 J
DL
NOTE: DIRECTIONS, DIMENSIONS AND LOCATIONS ARE APPROXIMATE. |SOURCE: SANGIS, 2008, CITY OF SAN DIEGO SEISMIC SAFETY STUDY GEOLOGIC HAZARDS AND FAULTS.
GEOLOGIC HAZARDSSKYLINE HILLS COMMUNITY PARK
8285 SKYLINE DRIVE, SAN DIEGO, CALIFORNIA108232002 | 6/17
FIGURE 5
0 2,000 4,000
FEET
?pE
22 POSSIBLE OR CONJECTURED22LANDSLIDES
aPpP
D
PASSIVEPRESSURE
ACTIVEPRESSURE
H/3RESULTANT
D/3
NOTES:
ASSUMES NO HYDROSTATIC PRESSURE BUILD-UP BEHIND THE RETAINING WALL
1.
2.
BEHIND THE RETAINING WALLWALL DRAINAGE DETAIL SHOULD BE INSTALLEDDRAINS AS RECOMMENDED IN THE RETAINING3.
5.
RECOMMENDED GEOTECHNICAL DESIGN PARAMETERS
Equivalent Fluid Pressure (lb/ft /ft)LateralEarth
Pressure
Level Backfillwith Granular Soils
2 (1)
(2) with Granular Soils2H:1V Sloping Backfill
(2)
aP
pP300 D 115 D
40 H 64 H
Level Ground 2H:1V Descending Ground
H AND D ARE IN FEET (H IS LESS THAN 12 FEET)
6. SETBACK SHOULD BE IN ACCORDANCE WITHTHE CBC
HRESULTANT
RETAININGWALL
4. SURCHARGE PRESSURES CAUSED BY VEHICLESOR NEARBY STRUCTURES ARE NOT INCLUDED
SKYLINE HILLS COMMUNITY PARK
8285 SKYLINE DRIVE, SAN DIEGO, CALIFORNIA
LATERAL EARTH PRESSURES FOR YIELDING RETAINING WALLS
108232002 I 6/17
FIGURE 6
6 10
82
32
00
2 D
-Y
RW
.D
WG
STRUCTURAL, GRANULAR BACKFILL MATERIALSSHOULD BE USED FOR RETAINING WALL BACKFILL
SOIL BACKFILL COMPACTED TO 90%RELATIVE COMPACTION *
OUTLET
4-INCH-DIAMETER PERFORATED SCHEDULE 40 PVC PIPE OR EQUIVALENT INSTALLED WITH PERFORATIONS DOWN;1% GRADIENT OR MORE TO A SUITABLE
3/4-INCH OPEN-GRADED GRAVEL WRAPPEDIN AN APPROVED GEOFABRIC.
3 INCHES
WALL FOOTING
FINISHED GRADE
RETAINING WALL
12 INCHES
12 INCHES
VA
RIE
SGEOFABRIC
*BASED ON ASTM D1557
RETAINING WALL DRAINAGE DETAIL
FIGURE 7
7 10
82
32
00
2 D
-R
W.D
WG
SKYLINE HILLS COMMUNITY PARK
8285 SKYLINE DRIVE, SAN DIEGO, CALIFORNIA
108232002 I 6/17

Ninyo & Moore | 8285 Skyline Drive, San Diego, California | 108232002 R | June 29, 2017
APPENDIX A
Boring Logs

Ninyo & Moore | 8285 Skyline Drive, San Diego, California | 108232002 R | June 29, 2017
APPENDIX A
BORING LOGS
Field Procedure for the Collection of Disturbed Samples Disturbed soil samples were obtained in the field using the following method.
Bulk Samples Bulk samples of representative earth materials were obtained from the exploratory borings. The samples were bagged and transported to the laboratory for testing.
Field Procedure for the Collection of Relatively Undisturbed Samples Relatively undisturbed soil samples were obtained in the field using the following method.
The Split Barrel Knocker Bar Sampler The sampler, with an external diameter of 3.0 inches, was lined with 1 inch long, thin brass rings with inside diameters of approximately 2.4 inches. The sampler was manually driven into the ground with a hammer weighing approximately 35 pounds. The samples were removed from the sample barrel in the brass rings, sealed, and transported to the laboratory for testing.

Soil Classification Chart Per ASTM D 2488
Primary DivisionsSecondary Divisions
Group Symbol Group Name
COARSE- GRAINED
SOILS more than
50% retained on No. 200
sieve
GRAVEL more than
50% of coarse fraction
retained on No. 4 sieve
CLEAN GRAVELless than 5% fines
GW well-graded GRAVEL
GP poorly graded GRAVEL
GRAVEL with DUAL
CLASSIFICATIONS 5% to 12% fines
GW-GM well-graded GRAVEL with silt
GP-GM poorly graded GRAVEL with silt
GW-GC well-graded GRAVEL with clay
GP-GC poorly graded GRAVEL with
GRAVEL with FINES
more than 12% fines
GM silty GRAVEL
GC clayey GRAVEL
GC-GM silty, clayey GRAVEL
SAND 50% or more
of coarse fraction passes
No. 4 sieve
CLEAN SAND less than 5% fines
SW well-graded SAND
SP poorly graded SAND
SAND with DUAL
CLASSIFICATIONS 5% to 12% fines
SW-SM well-graded SAND with silt
SP-SM poorly graded SAND with silt
SW-SC well-graded SAND with clay
SP-SC poorly graded SAND with clay
SAND with FINES more than 12% fines
SM silty SAND
SC clayey SAND
SC-SM silty, clayey SAND
FINE- GRAINED
SOILS 50% or
more passes No. 200 sieve
SILT and CLAY
liquid limit less than 50%
INORGANIC
CL lean CLAY
ML SILT
CL-ML silty CLAY
ORGANICOL (PI > 4) organic CLAY
OL (PI < 4) organic SILT
SILT and CLAY
liquid limit 50% or more
INORGANICCH fat CLAY
MH elastic SILT
ORGANICOH (plots on or above “A”-line) organic CLAY
OH (plots below “A”-line) organic SILT
Highly Organic Soils PT Peat
USCS METHOD OF SOIL CLASSIFICATION
Apparent Density - Coarse-Grained Soil
Apparent Density
Spooling Cable or Cathead Automatic Trip Hammer
SPT (blows/foot)
Modified Split Barrel (blows/foot)
SPT (blows/foot)
Modified Split Barrel (blows/foot)
Very Loose < 4 < 8 < 3 < 5
Loose 5 - 10 9 - 21 4 - 7 6 - 14
Medium Dense 11 - 30 22 - 63 8 - 20 15 - 42
Dense 31 - 50 64 - 105 21 - 33 43 - 70
Very Dense > 50 > 105 > 33 > 70
Consistency - Fine-Grained Soil
Consis-tency
Spooling Cable or Cathead Automatic Trip Hammer
SPT (blows/foot)
Modified Split Barrel (blows/foot)
SPT (blows/foot)
Modified Split Barrel (blows/foot)
Very Soft < 2 < 3 < 1 < 2
Soft 2 - 4 3 - 5 1 - 3 2 - 3
Firm 5 - 8 6 - 10 4 - 5 4 - 6
Stiff 9 - 15 11 - 20 6 - 10 7 - 13
Very Stiff 16 - 30 21 - 39 11 - 20 14 - 26
Hard > 30 > 39 > 20 > 26
LIQUID LIMIT (LL), %
PLA
STI
CIT
Y IN
DE
X (
PI)
, %
0 10
1074
20
30
40
50
60
70
020 30 40 50 60 70 80 90 100
MH or OH
ML or OLCL - ML
Plasticity Chart
Grain Size
Description Sieve Size Grain Size Approximate
Size
Boulders > 12” > 12” Larger than basketball-sized
Cobbles 3 - 12” 3 - 12” Fist-sized to basketball-sized
Gravel
Coarse 3/4 - 3” 3/4 - 3” Thumb-sized to fist-sized
Fine #4 - 3/4” 0.19 - 0.75” Pea-sized to thumb-sized
Sand
Coarse #10 - #4 0.079 - 0.19” Rock-salt-sized to pea-sized
Medium #40 - #10 0.017 - 0.079” Sugar-sized to rock-salt-sized
Fine #200 - #40 0.0029 - 0.017”
Flour-sized to sugar-sized
Fines Passing #200 < 0.0029” Flour-sized and
smaller
CH or OH
CL or OL
0
5
10
15
20
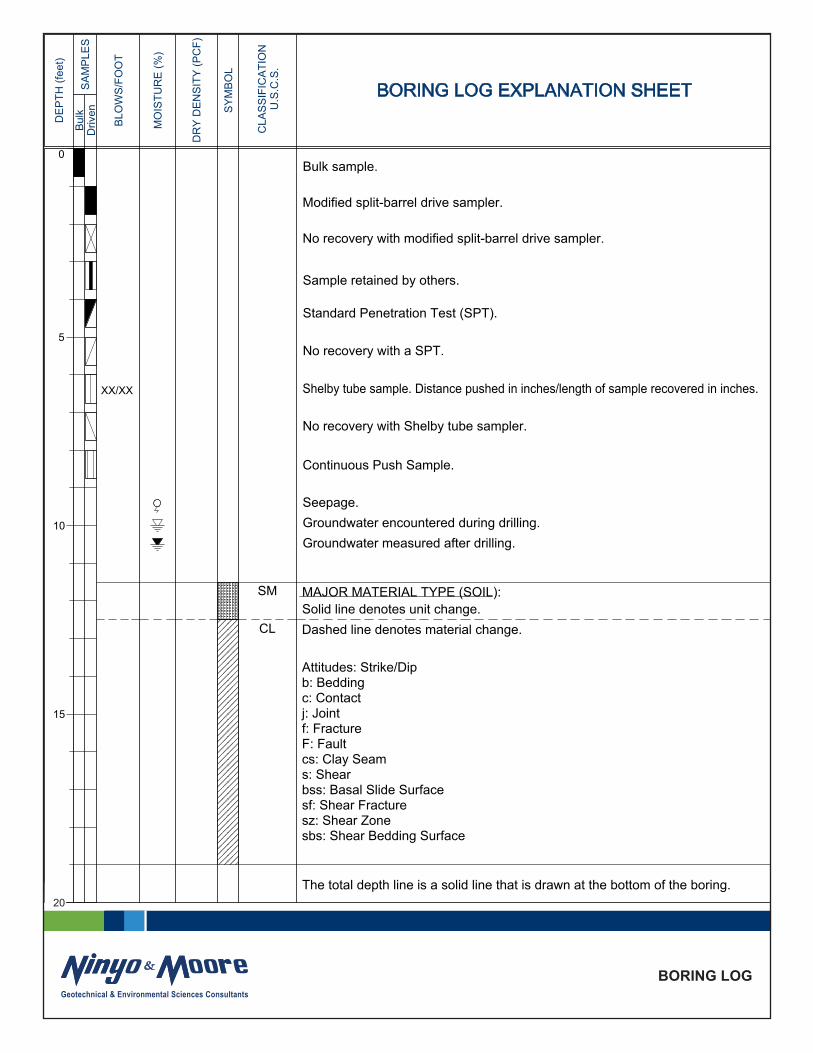
XX/XX
SM
CL
Bulk sample.
Modified split-barrel drive sampler.
No recovery with modified split-barrel drive sampler.
Sample retained by others.
Standard Penetration Test (SPT).
No recovery with a SPT.
Shelby tube sample. Distance pushed in inches/length of sample recovered in inches.
No recovery with Shelby tube sampler.
Continuous Push Sample.
Seepage.Groundwater encountered during drilling. Groundwater measured after drilling.
MAJOR MATERIAL TYPE (SOIL):Solid line denotes unit change.Dashed line denotes material change.
Attitudes: Strike/Dipb: Beddingc: Contactj: Jointf: FractureF: Faultcs: Clay Seams: Shearbss: Basal Slide Surfacesf: Shear Fracturesz: Shear Zonesbs: Shear Bedding Surface
The total depth line is a solid line that is drawn at the bottom of the boring.
BORING LOG
Explanation of Boring Log Symbols
PROJECT NO. DATE FIGURE
DE
PT
H (
feet)
Bu
lkS
AM
PLE
SD
rive
n
BLO
WS
/FO
OT
MO
IST
UR
E (
%)
DR
Y D
EN
SIT
Y (
PC
F)
SY
MB
OL
CLA
SS
IFIC
AT
ION
U.S
.C.S
.
BORING LOG EXPLANATION SHEET
Updated Nov. 2011BORING LOG
20

0
5
10
15
20
SM
SM
ML
FILL:Brown, dry, medium dense, silty SAND with trace gravel and roots.VERY OLD PARALIC DEPOSITS:Gray to brown, moist, weakly to moderately cemented, fine- to medium-grainedsilty SANDSTONE with trace gravel and cobbles.
Yellowish brown, moist, moderately indurated, sandy SILTSTONE; iron-oxidestaining present.
Total Depth = 5 feet.Groundwater not encountered during excavation.Backfilled shortly after excavation on 6/09/17.
Note: Groundwater, though not encountered at the time of excavation, may rise toa higher level due to seasonal variations in precipitation and several other factorsas discussed in the report.
The ground elevation shown above is an estimation only. It is based on ourinterpretations of published maps and other documents reviewed for the purposesof this evaluation. It is not sufficiently accurate for preparing construction bids anddesign documents.
FIGURE A- 2
SKYLINE HILLS COMMUNITY PARK8285 SKYLINE DRIVE, SAN DIEGO, CALIFORNIA
108232002 | 6/17
DE
PT
H (
fee
t)
Bu
lkS
AM
PL
ES
Dri
ven
BL
OW
S/F
OO
T
MO
IST
UR
E (
%)
DR
Y D
EN
SIT
Y (
PC
F)
SY
MB
OL
CL
AS
SIF
ICA
TIO
NU
.S.C
.S.
DESCRIPTION/INTERPRETATION
DATE DRILLED 6/08/17 BORING NO. IT-2 (North)
GROUND ELEVATION 444'± MSL SHEET 1 OF
METHOD OF DRILLING Manual
DRIVE WEIGHT N/A DROP N/A
SAMPLED BY GSW LOGGED BY GSW REVIEWED BY CAT
1
0
5
10
15
20
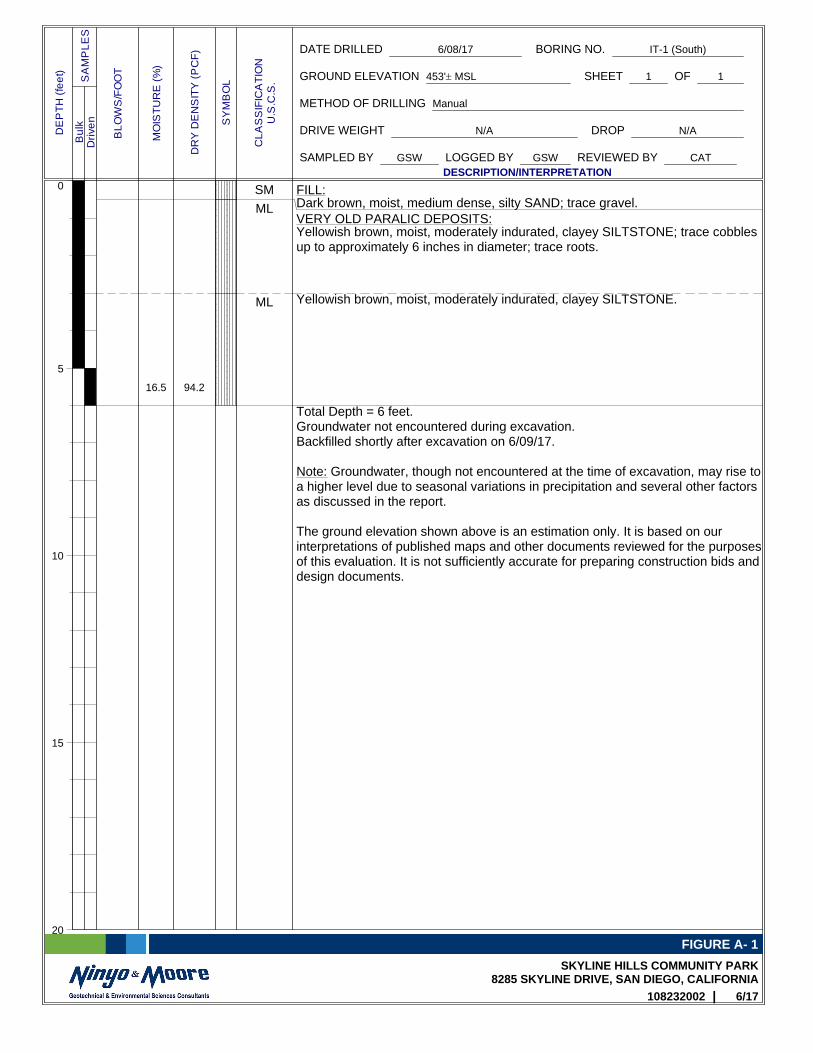
16.5 94.2
SM
ML
ML
FILL:Dark brown, moist, medium dense, silty SAND; trace gravel.VERY OLD PARALIC DEPOSITS:Yellowish brown, moist, moderately indurated, clayey SILTSTONE; trace cobblesup to approximately 6 inches in diameter; trace roots.
Yellowish brown, moist, moderately indurated, clayey SILTSTONE.
Total Depth = 6 feet.Groundwater not encountered during excavation.Backfilled shortly after excavation on 6/09/17.
Note: Groundwater, though not encountered at the time of excavation, may rise toa higher level due to seasonal variations in precipitation and several other factorsas discussed in the report.
The ground elevation shown above is an estimation only. It is based on ourinterpretations of published maps and other documents reviewed for the purposesof this evaluation. It is not sufficiently accurate for preparing construction bids anddesign documents.
FIGURE A- 1
SKYLINE HILLS COMMUNITY PARK8285 SKYLINE DRIVE, SAN DIEGO, CALIFORNIA
108232002 | 6/17
DE
PT
H (
fee
t)
Bu
lkS
AM
PL
ES
Dri
ven
BL
OW
S/F
OO
T
MO
IST
UR
E (
%)
DR
Y D
EN
SIT
Y (
PC
F)
SY
MB
OL
CL
AS
SIF
ICA
TIO
NU
.S.C
.S.
DESCRIPTION/INTERPRETATION
DATE DRILLED 6/08/17 BORING NO. IT-1 (South)
GROUND ELEVATION 453'± MSL SHEET 1 OF
METHOD OF DRILLING Manual
DRIVE WEIGHT N/A DROP N/A
SAMPLED BY GSW LOGGED BY GSW REVIEWED BY CAT
1
Ninyo & Moore | 8285 Skyline Drive, San Diego, California | 108232002 R | June 29, 2017
APPENDIX B
Laboratory Testing

Ninyo & Moore | 8285 Skyline Drive, San Diego, California | 108232002 R | June 29, 2017
APPENDIX B
LABORATORY TESTING
Classification Soils were visually and texturally classified in accordance with the Unified Soil Classification System (USCS) in general accordance with ASTM D 2488-00. Soil classifications are indicated on the logs of the exploratory borings in Appendix B.
In-Place Moisture and Density Tests The moisture content and dry density of relatively undisturbed samples obtained from the exploratory borings were evaluated in general accordance with ASTM D 2937-04. The test results are presented on the logs of the exploratory borings in Appendix B.
Direct Shear Tests Direct shear tests were performed on relatively undisturbed and remolded samples in general accordance with ASTM D 3080 to evaluate the shear strength characteristics of selected materials. The samples were inundated during shearing to represent adverse field conditions. The results are shown on Figure B-2.
Soil Corrosivity Tests Soil pH, and minimum resistivity tests were performed on representative samples in general accordance with CT 643. The sulfate and chloride contents of the selected samples were evaluated in general accordance with CT 417 and 422, respectively.
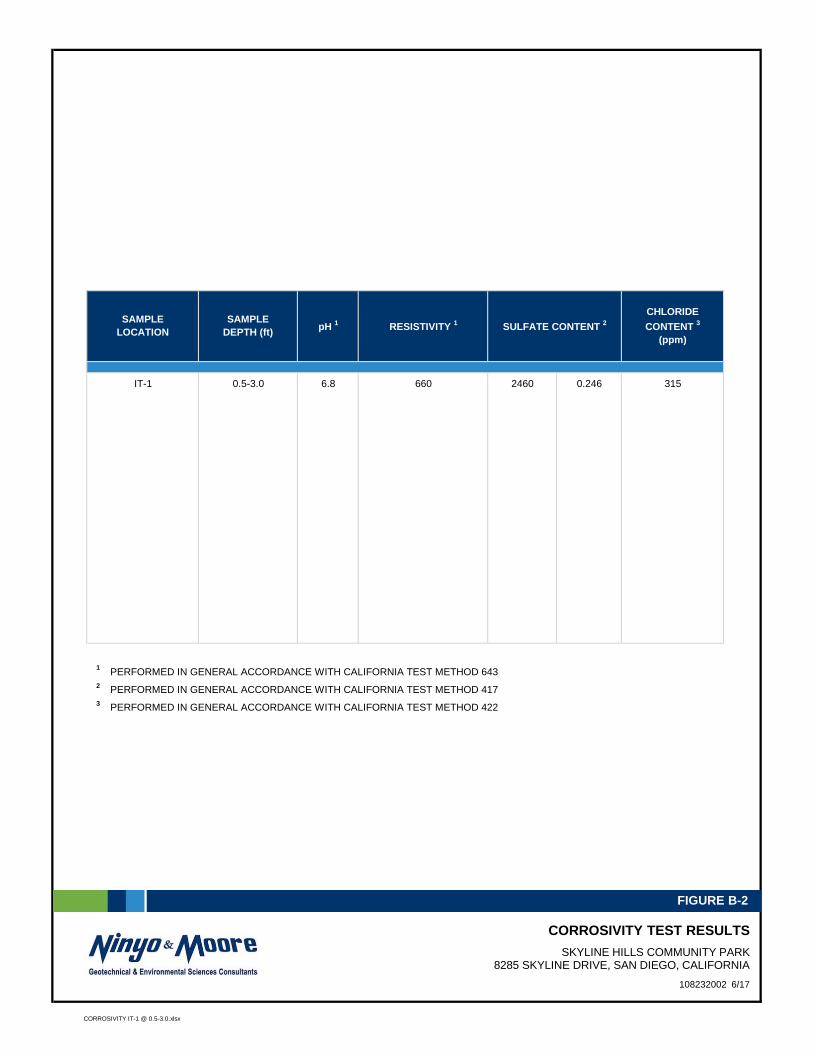
1 PERFORMED IN GENERAL ACCORDANCE WITH CALIFORNIA TEST METHOD 6432 PERFORMED IN GENERAL ACCORDANCE WITH CALIFORNIA TEST METHOD 4173 PERFORMED IN GENERAL ACCORDANCE WITH CALIFORNIA TEST METHOD 422
CHLORIDE
CONTENT 3
(ppm)pH 1
SAMPLEDEPTH (ft)
SAMPLE LOCATION RESISTIVITY 1 SULFATE CONTENT 2
6.8 315660 2460 0.246IT-1 0.5-3.0
CORROSIVITY TEST RESULTS
SKYLINE HILLS COMMUNITY PARK8285 SKYLINE DRIVE, SAN DIEGO, CALIFORNIA
108232002 6/17
FIGURE B-2
CORROSIVITY IT-1 @ 0.5-3.0.xlsx

PERFORMED IN GENERAL ACCORDANCE WITH ASTM D 3080
Silty SAND X Ultimate5.0-6.0IT-1
Cohesion(psf)
Friction Angle(degrees)
Soil Type
Formation29
29
130
Formation
Description SymbolSample Location
250
Depth(ft)
Shear Strength
5.0-6.0Silty SAND IT-1 Peak
0
1000
2000
3000
0 1000 2000 3000
SH
EA
R S
TR
ES
S (
PS
F)
NORMAL STRESS (PSF)
FIGURE B-1
DIRECT SHEAR TEST RESULTS
SKYLINE HILLS COMMUNITY PARK8285 SKYLINE DRIVE, SAN DIEGO, CALIFORNIA
108232002 6/17
DIRECT SHEAR IT-1 @ 5.0-6.0.xlsx

Ninyo & Moore | 8285 Skyline Drive, San Diego, California | 108232002 R | June 29, 2017
APPENDIX C
Infiltration Test Results

Test Date: Infiltration Test No.: IT-1 (South)
Test Hole Diameter, D (inches): 6.0 Excavation Depth (feet): 6.0
Test performed and recorded by: GSW Pipe Length (feet): 6.00
(min/in) (in/hr)
6:50 4.20 7:15 4.22 25 0.02 104 1.79 0.04
7:15 4.20 7:40 4.21 25 0.01 208 1.80 0.02
7:40 4.20 8:10 4.21 30 0.01 250 1.80 0.02
8:10 4.20 8:40 4.21 30 0.01 250 1.80 0.02
8:40 4.20 9:10 4.21 30 0.01 250 1.80 0.02
9:10 4.20 9:40 4.21 30 0.01 250 1.80 0.02
9:40 4.20 10:10 4.21 30 0.01 250 1.80 0.02
10:10 4.20 10:40 4.21 30 0.01 250 1.80 0.02
10:40 4.20 11:10 4.21 30 0.01 250 1.80 0.02
11:10 4.20 11:40 4.21 30 0.01 250 1.80 0.02
11:40 4.20 12:10 4.21 30 0.01 250 1.80 0.02
12:10 4.20 12:40 4.21 30 0.01 250 1.80 0.02
Test Date: Infiltration Test No.: IT-2 (North)
Test Hole Diameter, D (inches): 6.0 Excavation Depth (feet): 5.0
Test performed and recorded by: GSW Pipe Length (feet): 5.00
(min/in) (in/hr)6:55 3.65 7:20 3.68 25 0.03 69 1.34 0.077:20 3.65 7:45 3.67 25 0.02 104 1.34 0.057:45 3.65 8:15 3.69 30 0.04 62 1.33 0.08
8:15 3.65 8:45 3.68 30 0.03 83 1.34 0.06
8:45 3.65 9:15 3.67 30 0.02 125 1.34 0.04
9:15 3.65 9:45 3.67 30 0.02 125 1.34 0.04
9:45 3.65 10:15 3.67 30 0.02 125 1.34 0.04
10:15 3.65 10:45 3.68 30 0.03 83 1.34 0.06
10:45 3.65 11:15 3.67 30 0.02 125 1.34 0.04
11:15 3.65 11:45 3.67 30 0.02 125 1.34 0.04
11:45 3.65 12:15 3.67 30 0.02 125 1.34 0.04
12:15 3.65 12:45 3.67 30 0.02 125 1.34 0.04
Notes:
t1 = initial time when filling or refilling is completed
d1 = initial depth to water in hole at t1
t2 = final time when incremental water level reading is taken
d2 = final depth to water in hole at t2
∆t = change in time between initial and final water level readings
∆H = change in depth to water or change in height of water column (i.e., d2 - d1) It = tested infiltration rate, inches/hour
H0 = Initial height of water column ∆H = change in head over the time interval, inches
in/hr = inches per hour ∆t = time interval, minutes
r = effective radius of test hole
Havg = average head over the time interval, inches
Havg
(feet)
Infiltration Rate
6/9/2017
∆H(feet)
Percolation Rate
Havg
(feet)
Percolation Rate to Infiltration Rate Conversion 1
1 Based on the "Porchet Method" as presented in: Riverside County Flood Control, 2011, Design Handbook for Low Impact Development Best Management Practices: dated September.
t1d1
(feet)t2
d2
(feet)∆t
(min)Infiltration Rate∆H
(feet)
Percolation Rate
6/9/2017
t1d1
(feet)t2
d2
(feet)∆t
(min)
∆ 60
∆ 2
Ninyo & Moore | 8285 Skyline Drive, San Diego, California | 108232002 Appendix C | June 29, 2017 1 of 1

Ninyo & Moore | 8285 Skyline Drive, San Diego, California | 108232002 R | June 29, 2017
5710 Ruffin Road | San Diego, California 92618 | p. 858.576.1000
SAN DIEGO | IRVINE | LOS ANGELES | FONTANA | OAKLAND | SAN FRANCISCO | SACRAMENTO
SAN JOSE | PHOENIX | TUCSON | PRESCOTT | LAS VEGAS | DENVER | BROOMFIELD | HOUSTON
www.ninyoandmoore.com