geothermal innovations: breaking the mold csp – geo/solar integration implementation 1 of 2...
TRANSCRIPT

Geothermal Innovations:Geothermal Innovations:Breaking the MoldBreaking the Mold
CA Geothermal ForumCA Geothermal ForumOctober October 2020, , 20162016SacramentoSacramento
Don A. Campbell Complex, Nevada, U.S.
Green energy you can rely on
Copyright © 2016 Ormat Technologies, Inc.

Disclaimer
Information provided during this presentation may contain statements relating to current expectations, estimates, forecasts and projections about futureevents that are forward-looking statements as defined in the Private Securities Litigation Reform Act of 1995.These forward-looking statements generally relate to the company’s plans, objectives and expectations for future operations, and are based on
t’ t ti t d j ti f f t lt t d A t l f t lt diff t i ll f th j t d ltmanagement’s current estimates and projections of future results or trends. Actual future results may differ materially from those projected as a resultof certain risks and uncertainties.
For a discussion of such risks and uncertainties, please see risk factors as described in the Annual Report on Form 10-K filed with the securities andexchange commission on February 26, 2016.
In addition, during this presentation, statements may be made that include a financial measure defined as non-GAAP financial measures by theSecurities and Exchange Commission, such as EBITDA and adjusted EBITDA. These measures may be different from non-GAAP financial measuresused by other companies. The presentation of this financial information is not intended to be considered in isolation or as a substitute for the financialinformation prepared and presented in accordance with GAAP.
Management of Ormat Technologies believes that EBITDA and adjusted EBITDA may provide meaningful supplemental information regarding liquiditymeasurement that both management and investors benefit from referring to this non-GAAP financial measures in assessing Ormat Technologies’liquidity, and when planning and forecasting future periods. This non-GAAP financial measures may also facilitate management’s internal comparisonto the company’s historical liquidity.
EBITDA and Adjusted EBITDA are not a measurement of financial performance or liquidity under accounting principles generally accepted in the UnitedStates of America and should not be considered as an alternative to cash flow from operating activities or as a measure of liquidity or an alternative tonet earnings as indicators of our operating performance or any other measures of performance derived in accordance with accounting principlesgenerally accepted in the United States of America. EBITDA and Adjusted EBITDA are presented because we believe they are frequently used bysecurities analysts, investors and other interested parties in the evaluation of a company’s ability to service and/or incur debt. However, othercompanies in our industry may calculate EBITDA and Adjusted EBITDA differently than we do.
Copyright © 2016 Ormat Technologies, Inc. All Rights Reserved. This document contains information proprietary to Ormat Technologies, Inc.
Copyright © 2016 Ormat Technologies, Inc.
Reproduction in any form without prior written permission is strictly prohibited
2

The Market is Changing…
Copyright © 2016 Ormat Technologies, Inc.
3
Source: CAISO
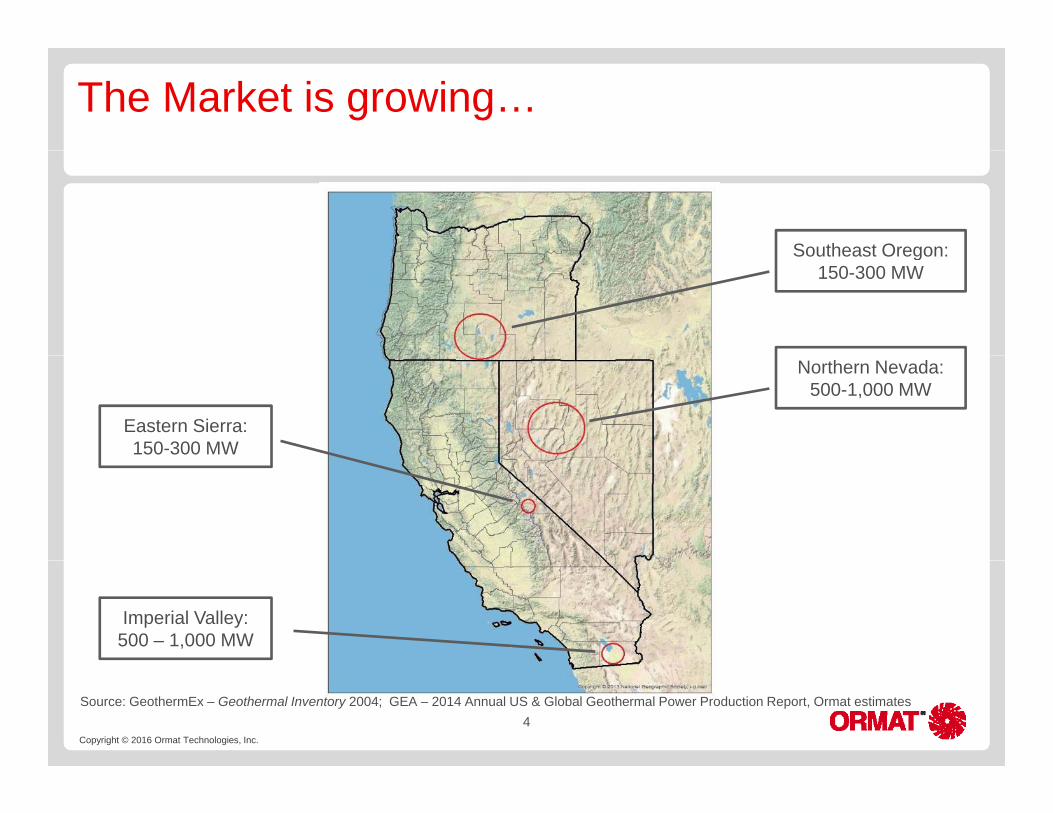
The Market is growing…
Southeast Oregon:Southeast Oregon:150-300 MW
Eastern Sierra:150-300 MW
Northern Nevada:500-1,000 MW
Imperial Valley: 500 – 1,000 MW
Copyright © 2016 Ormat Technologies, Inc.
4Source: GeothermEx – Geothermal Inventory 2004; GEA – 2014 Annual US & Global Geothermal Power Production Report, Ormat estimates

Don A. Campbell Complex, Nevada, U.S.
Green energy you can rely on
Copyright © 2016 Ormat Technologies, Inc.

The Solution?
• Adapting to customer’s needsp g
Copyright © 2016 Ormat Technologies, Inc.
6

Dispatchable Geothermal Case Study:38 MW Puna Geothermal Venture38 MW Puna Geothermal Venture
• Big Island, Hawaii6 energy• 6 energy
• Automatic Generator Control (AGC) remotely and automatically controlled by HELCO System Operator
• Dispatch: 22 ~ 38 MWp• Ramp rate up or down: 2 MW
/ minuteS i i t ll ti• Spinning reserve at all times: 3 MW
Copyright © 2016 Ormat Technologies, Inc.
7
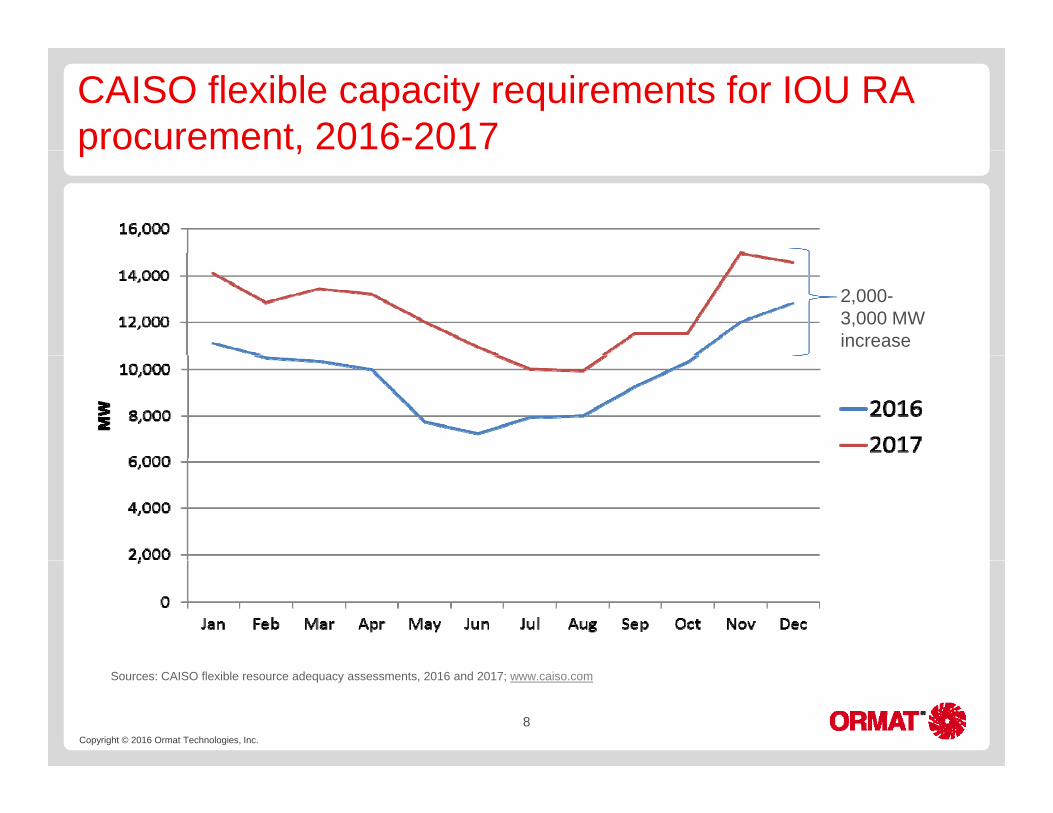
CAISO flexible capacity requirements for IOU RA procurement, 2016-2017p ,
2,000-3,000 MW increase
Copyright © 2016 Ormat Technologies, Inc.
8
Sources: CAISO flexible resource adequacy assessments, 2016 and 2017; www.caiso.com
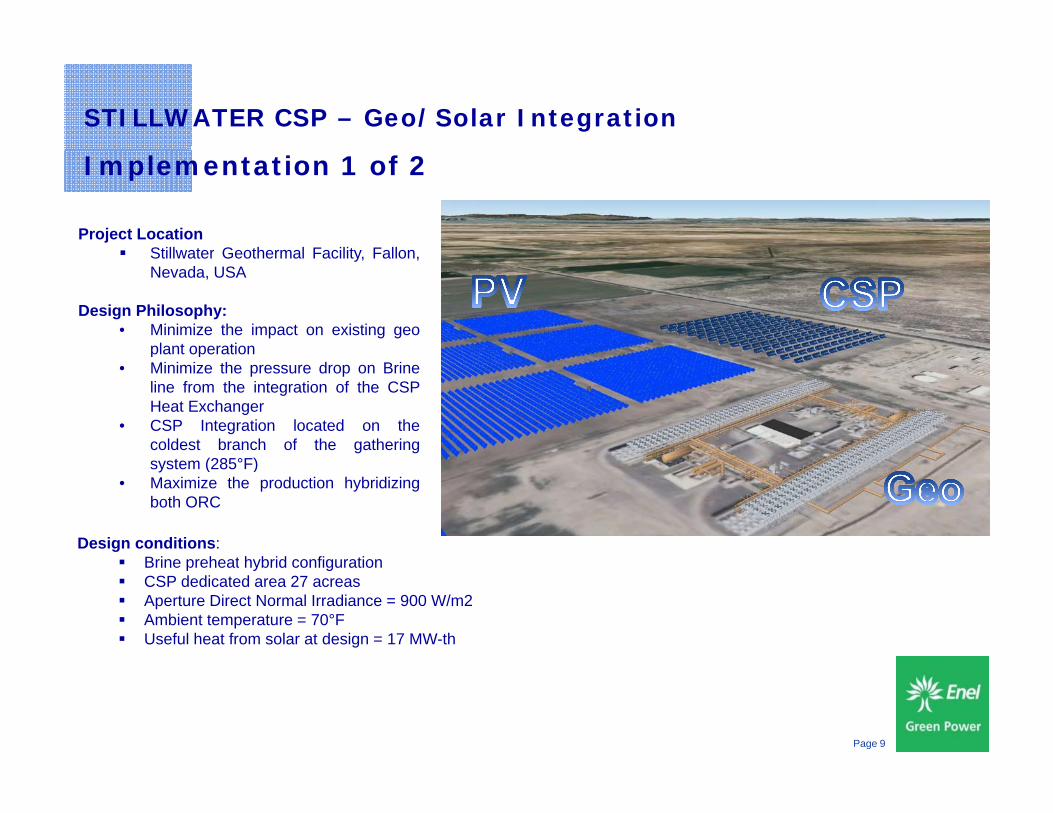
STILLWATER CSP – Geo/Solar Integration
Implementation 1 of 2
Project Location Stillwater Geothermal Facility Fallon Stillwater Geothermal Facility, Fallon,
Nevada, USA
Design Philosophy:• Minimize the impact on existing geo
plant operationp p• Minimize the pressure drop on Brine
line from the integration of the CSPHeat Exchanger
• CSP Integration located on thecoldest branch of the gathering
t (285°F)system (285°F)• Maximize the production hybridizing
both ORC
Design conditions: Brine preheat hybrid configuration Brine preheat hybrid configuration CSP dedicated area 27 acreas Aperture Direct Normal Irradiance = 900 W/m2 Ambient temperature = 70°F Useful heat from solar at design = 17 MW-th
Page 9

STILLWATER CSP – Geo/Solar Integration
Implementation 2 of 2
Design Results: Solar field aperture area = 25,256 m2 (308 SkyTrough modules) Brine temperature increase = 11 °F (2 units @ 5200 kph) Incremental net electrical power output 2 MWe Solar to thermal efficiency (at design) 75 % Thermal to electric efficiency (at design) 12 % Overall efficiency (at design) 9 % Overall efficiency (at design) 9 %
Annual Results: Annual solar input = 54,603 MWh (DNI 5.92 kWh/m2d) Annual net thermal output 30,000 MWh-th Annual net electric additional output 3,000 MWh-ep , Net Capacity Factor 17% Solar to thermal efficiency (annual) 55% Thermal to electric efficiency (annual) 10% Overall efficiency (annual) 5.5%
Page 10

Energy Prices: Historical and Future Simulated Energy Prices in SCE Footprint – CPUC/CAISO 2014 LTPP Model for 2024
Copyright © 2016 Ormat Technologies, Inc.
11
Source: LTPP 2014 study data base; adapted for NREL study of storage benefits in California, December 2015

Geothermal is Cost Effective For All Resources
&&
Geothermal Combined Cycle
Steam
Binary (ORC)
Geothermal Resource Temperature (ºC)
200100 150 250 300Liquid Steam
d i d
350
Copyright © 2016 Ormat Technologies, Inc. 12
dominated dominated

Geothermal Growth by Technology
Accelerated Growthof Binary Installations
GEA 2016 Annual US Global Geothermal Power Production http://geo
Copyright © 2016 Ormat Technologies, Inc. 13
GEA 2016 Annual US Global Geothermal Power Production - http://geo-energy.org/reports/2016/2016%20Annual%20US%20Global%20Geothermal%20Power%20Production.pdf

Integrated Combined Cycle – Big Impact
Integrated Combined Cycle:• Uses both geothermal steam &• Uses both geothermal steam &
brine;• Reinjects 100% of the
geothermal fluid• Uses air-cooling instead of water• Multiple modular units
Was there supposed to be
something on this half of the slide?
Copyright © 2016 Ormat Technologies, Inc.
14

Combined Cycle Geothermal Power Plants
Puna, Hawaii, USA, 1992, 2004, 2012, 38 MWMokai, New Zealand, 2000, 2004, 2007, 130 MW
Upper Mahiao, Philippines, 1996, 132 MWRotokawa, New Zealand, 1997, 2002, 35 MW
Copyright © 2016 Ormat Technologies, Inc.
Upper Mahiao, Philippines, 1996, 132 MW Rotokawa, New Zealand, 1997, 2002, 35 MW
15

The largest single geothermal project in the world
Under Construction - Sarulla SIL, NIL1&2 Backpressure turbines
g g g p j3x110MW combined flash – binary power trains, each consists of 60 MW flash system and 50MW binary system SIL turbine
TOSHIBA scope: 3x60MW backpressure turbines & generators
Main steam pressure 18bara (SIL)p Exhaust pressure 1.2bara Rated Speed: 3,000 rpm
Steam Turbine Generator
Gross 60 MW
OEC Modules
Generic NIL / SIL GCCU cycle Key DataGeneric NIL / SIL GCCU cycle Key Data
Steam supply
NCG ~ 7%Turbine
Steam ~ 20% total mass flow
Gross 15.5 MW
OEC ModulesGross 15.5 MW
Condensate & Brine return
© 2013Toshiba Corporation 16
Brine supply
OEC ModulesGross 31 MW

IGCCU (Integrated Geothermal Combined Cycle Unit)
Sarulla SIL – 110 MW (1 of 3)
Copyright © 2016 Ormat Technologies, Inc.
17

Cost of Geothermal Power is Going Down
• Cost of new Ormat geothermal projects is $4,000-$4 500/kW$4,500/kW
• Levelized PPA prices dropped from >$100/MWh to <$80/MWh
• Trend is continuing• Cost reduction: exploration, development, power plant CAPEX, O&M
Copyright © 2016 Ormat Technologies, Inc.
18

Value of Geothermal Technology is Going Up
• Provides resource diversityA ill b fit• Ancillary benefits:• Real-time economic dispatch and flexible ramping
reserves• Regulation up and down within a wide range• Spinning reserve and frequency response reserve
V lt l ti• Voltage regulation • Highest economic benefits
• Typical 30 MW geothermal project:Typical 30 MW geothermal project:• 29 full time O&M jobs• $5 million / year to local economy
Copyright © 2016 Ormat Technologies, Inc.
19

Value of Geothermal is Going Up: Energy
Geothermal energy value minus solar PV energy value
Copyright © 2016 Ormat Technologies, Inc.
20
Source: Ormat, based on SCE market data and CAISO simulations and CPUC LTPP model

Don A. Campbell Complex, Nevada, U.S.
Green energy you can rely on
Copyright © 2016 Ormat Technologies, Inc.

Valuation Summary: Geo vs. Solar in CA 2024
Attribute Added Value Notes / Ref.Energy $15 - $20/MWh (1)Energy $15 $20/MWh (1)Capacity $10 - $19/MWh (2)Integration $5 – $20/MWh (3)C t il t $4 $9/MWh (4)Curtailment $4 - $9/MWh (4)Transmission utilization >$2/MWh (5)
Flexibility ?GHG emissions ?
Total $36 ~ $70+/MWh
(1) Based on CAISO simulations and CPUC LTPP model(2) Based on CAISO annual revenue requirement of a new 100 MW CT in its 2015 State of the Market report.(3) Based on CPUC studies and LADWP IRP. (4) Assumes 10% - 20% curtailment of solar at $40/MWh(5) Assumes yearly transmission cost of $6/MW (taken from LADWP 2014 Power Service Cost of Service Study for the
Copyright © 2016 Ormat Technologies, Inc.
22
Barren Ridge project) and factors in 80-90% capacity factor for geothermal vs. 25-30% capacity factor for solar PV

Thank You!
Copyright © 2016 Ormat Technologies, Inc.
23

How it Works
Copyright © 2016 Ormat Technologies, Inc.
24