getting the most out of star reading enterprise and star ...reading enterprise and star math...
TRANSCRIPT

Ctrl-click here to change Chapter Heading
C1
Getting the Most out of STAR Reading Enterprise and STAR Math EnterpriseUSING DATA TO INFORM INSTRUCTION AND INTERVENTION
Perfect For
RTI


Getting the Most out of STAR Reading Enterprise and STAR Math Enterprise
The Accelerated products design, STAR Reading, STAR Reading Enterprise, STAR Math, STAR Math Enterprise, STAR Early Literacy, STAR Early Literacy Enterprise, STAR Enterprise, Core Progress, Accelerated Reader, Accelerated Reader Enterprise, Successful Reader, Accelerated Math, Accelerated Math Enterprise,
Accelerated Math for Intervention, Advanced Technology for Data-Driven Schools, Renaissance Home Connect, Renaissance Learning, the Renaissance Learning logo, and Renaissance Place are trademarks of Renaissance Learning, Inc., and its subsidiaries, registered, common law, or pending registration in the
United States and other countries.
ISBN 978-1-59455-550-3© 2012 by Renaissance Learning, Inc.
All rights reserved. Printed in the United States of America
This publication is protected by U.S. and international copyright laws. It is unlawful to duplicate or reproduce any copyrighted material without authorization from the copyright holder. If this publication contains pages
marked “Reproducible Form,” only these pages may be photocopied and used by teachers within their own schools. They are not to be reproduced for private consulting or commercial use. For more information,
contact:
Renaissance Learning, Inc.P.O. Box
Wisconsin Rapids, WI 54495-8036(800) 338-4204
www.renlearn.com2/12
iii
Contents
Introduction . . . . . . . . . . . . . . . . . . . . . . . . . . . . . . . . . . . . . . . . . . . . . 1
q STAR Enterprise Basics . . . . . . . . . . . . . . . . . . . . . . . . . . . . . . . . . 3For Whom Are STAR Reading Enterprise and STAR Math Enterprise Designed? . . . 3
Test Frequency . . . . . . . . . . . . . . . . . . . . . . . . . . . . . . . . . . . . . . . . . . . . . . . . . . . . . . 3
How STAR Enterprise Works. . . . . . . . . . . . . . . . . . . . . . . . . . . . . . . . . . . . . . . . . . . . 4
How We Know STAR Enterprise Assessments Are Reliable and Valid. . . . . . . . . . . 10
Fidelity of Administration. . . . . . . . . . . . . . . . . . . . . . . . . . . . . . . . . . . . . . . . . . . . . . 11
w Planning for Assessment. . . . . . . . . . . . . . . . . . . . . . . . . . . . . . . 13Identify Purposes for Assessment . . . . . . . . . . . . . . . . . . . . . . . . . . . . . . . . . . . . . . 13
Establish Grade-Level Data Teams . . . . . . . . . . . . . . . . . . . . . . . . . . . . . . . . . . . . . 13
Develop a Schedule . . . . . . . . . . . . . . . . . . . . . . . . . . . . . . . . . . . . . . . . . . . . . . . . . 14
Enter Student Information . . . . . . . . . . . . . . . . . . . . . . . . . . . . . . . . . . . . . . . . . . . . . 17
Define Benchmarks and Proficiency Levels . . . . . . . . . . . . . . . . . . . . . . . . . . . . . . . 17
Share the Assessment Plan . . . . . . . . . . . . . . . . . . . . . . . . . . . . . . . . . . . . . . . . . . . 20
e Universal Screening. . . . . . . . . . . . . . . . . . . . . . . . . . . . . . . . . . . 22Before Fall Screening . . . . . . . . . . . . . . . . . . . . . . . . . . . . . . . . . . . . . . . . . . . . . . . . 22
During Testing. . . . . . . . . . . . . . . . . . . . . . . . . . . . . . . . . . . . . . . . . . . . . . . . . . . . . . 22
Understanding Fall Screening Data . . . . . . . . . . . . . . . . . . . . . . . . . . . . . . . . . . . . . 23
Acting on Fall Screening Data . . . . . . . . . . . . . . . . . . . . . . . . . . . . . . . . . . . . . . . . . 26
Communicating with Parents . . . . . . . . . . . . . . . . . . . . . . . . . . . . . . . . . . . . . . . . . . 30
Purposes for Winter Universal Screening . . . . . . . . . . . . . . . . . . . . . . . . . . . . . . . . . 31
Assessing the Overall Situation Mid-Year. . . . . . . . . . . . . . . . . . . . . . . . . . . . . . . . . 31
Assessing Grade-Level Needs. . . . . . . . . . . . . . . . . . . . . . . . . . . . . . . . . . . . . . . . . 33
Assessing Individual Needs . . . . . . . . . . . . . . . . . . . . . . . . . . . . . . . . . . . . . . . . . . . 33
Making Concrete Plans After Winter Screening . . . . . . . . . . . . . . . . . . . . . . . . . . . . 34
Mid-Year Screening at the Class or Group Level . . . . . . . . . . . . . . . . . . . . . . . . . . . 34
Mid-Year Screening by Characteristic . . . . . . . . . . . . . . . . . . . . . . . . . . . . . . . . . . . 34
Purposes for Spring Universal Screening. . . . . . . . . . . . . . . . . . . . . . . . . . . . . . . . . 34
Using the Spring Screening Report to Evaluate Your Instructional Program . . . . . . 35
Using the Screening Report to Evaluate Your Intervention Strategies . . . . . . . . . . . 36
Planning for the Next School Year . . . . . . . . . . . . . . . . . . . . . . . . . . . . . . . . . . . . . . 37
Using STAR Enterprise for Universal Screening in an RTI Program . . . . . . . . . . . . . 37
iv
r Starting an Intervention, Setting Intervention Goals, and Progress Monitoring . . . . . . . . . . . . . . . . . . . . . . . . . . . . . . . . . . . . . 39
Setting Up an Intervention and Goal . . . . . . . . . . . . . . . . . . . . . . . . . . . . . . . . . . . . 39
Goals for ELLs and Students with Special Needs . . . . . . . . . . . . . . . . . . . . . . . . . . 42
Progress Monitoring . . . . . . . . . . . . . . . . . . . . . . . . . . . . . . . . . . . . . . . . . . . . . . . . . 42
Responding to the Data . . . . . . . . . . . . . . . . . . . . . . . . . . . . . . . . . . . . . . . . . . . . . . 45
Editing an Intervention and Goal . . . . . . . . . . . . . . . . . . . . . . . . . . . . . . . . . . . . . . . 47
Ongoing Progress Monitoring. . . . . . . . . . . . . . . . . . . . . . . . . . . . . . . . . . . . . . . . . . 47
Planning Interventions in an RTI Framework . . . . . . . . . . . . . . . . . . . . . . . . . . . . . . 47
t Instructional Planning for Differentiation . . . . . . . . . . . . . . . . . . . . 50How STAR Assessments Report Skill Knowledge . . . . . . . . . . . . . . . . . . . . . . . . . . 50
Instructional Planning for Individual Students . . . . . . . . . . . . . . . . . . . . . . . . . . . . . 50
Instructional Planning for Groups . . . . . . . . . . . . . . . . . . . . . . . . . . . . . . . . . . . . . . . 53
Using the Core Progress Learning Progressions for Reading and Math . . . . . . . . . 54
y Forecasting Proficiency on State Tests . . . . . . . . . . . . . . . . . . . . . . 63How Does Statistical Linking Work? . . . . . . . . . . . . . . . . . . . . . . . . . . . . . . . . . . . . . 63
How Can We Forecast Performance on a Future Event? . . . . . . . . . . . . . . . . . . . . . 63
What the Reports Show . . . . . . . . . . . . . . . . . . . . . . . . . . . . . . . . . . . . . . . . . . . . . . 64
Interpreting Data When a State Test Changes . . . . . . . . . . . . . . . . . . . . . . . . . . . . . 68
u Estimating Mastery of State Standards and Common Core State Standards . . . . . . . . . . . . . . . . . . . . . . . . . . . . 70
Standards vs. Proficiency . . . . . . . . . . . . . . . . . . . . . . . . . . . . . . . . . . . . . . . . . . . . . 70
How STAR Enterprise Estimates Mastery . . . . . . . . . . . . . . . . . . . . . . . . . . . . . . . . . 70
State Standards Report—Student . . . . . . . . . . . . . . . . . . . . . . . . . . . . . . . . . . . . . . 71
State Standards Report—Class . . . . . . . . . . . . . . . . . . . . . . . . . . . . . . . . . . . . . . . . 73
State Standards Report—District . . . . . . . . . . . . . . . . . . . . . . . . . . . . . . . . . . . . . . . 74
How to Use the Standards Reports . . . . . . . . . . . . . . . . . . . . . . . . . . . . . . . . . . . . . 75
i Measuring Growth . . . . . . . . . . . . . . . . . . . . . . . . . . . . . . . . . . . . . . . 77Looking at Growth in a School Year with the Growth Report . . . . . . . . . . . . . . . . . . 77
Comparing School-Year Progress to National Norms. . . . . . . . . . . . . . . . . . . . . . . . 81
Evaluating Growth from Year to Year . . . . . . . . . . . . . . . . . . . . . . . . . . . . . . . . . . . . 83
o Common Questions . . . . . . . . . . . . . . . . . . . . . . . . . . . . . . . . . . . . . . 87
Appendix . . . . . . . . . . . . . . . . . . . . . . . . . . . . . . . . . . . . . . . . . . . . . . . . .A1Instructions for Common Software Tasks . . . . . . . . . . . . . . . . . . . . . . . . . . . . . . . . . A2
Sample Letter to Parents for an RTI Program . . . . . . . . . . . . . . . . . . . . . . . . . . . . . A11
List of All STAR Reports . . . . . . . . . . . . . . . . . . . . . . . . . . . . . . . . . . . . . . . . . . . . . A13
Examples of STAR Reading Enterprise Reports. . . . . . . . . . . . . . . . . . . . . . . . . . . A15
Examples of STAR Math Enterprise Reports . . . . . . . . . . . . . . . . . . . . . . . . . . . . . A43
Index. . . . . . . . . . . . . . . . . . . . . . . . . . . . . . . . . . . . . . . . . . . . . . . . . . . . . . . . . . . . A68

1
IntroductionSTAR assessments are computer-adaptive tests designed to give you accurate, reliable, and valid data quickly so that you can make good decisions about instruction and intervention. STAR Reading Enterprise and STAR Math Enterprise are enhanced versions that include new skills-based test items, learning progressions for instructional planning, and in-depth reports. Operating on the Renaissance Place Real Time platform, STAR Reading Enterprise and STAR Math Enterprise are part of a breakthrough comprehensive assessment system for data-driven schools that also includes STAR Early Literacy.
The purpose of this book is to help educators get the most out of STAR Enterprise assessments. Because the tests can be used for multiple purposes, you may find some chapters are more pertinent to your aims than others. In Chapter 1, we describe how the tests work and the kind of data they generate; it is essential reading for all educators. Chapter 2 provides guidance on developing an assessment plan and may be most relevant to administrators and others who are responsible for district- or school-level test administration. In later chapters, we explain how to best use the tests for various purposes: universal screening, progress monitoring, instructional planning, forecasting proficiency on state tests, estimating mastery of state standards and Common Core State Standards, and measuring growth. You may wish to focus on the chapters that relate directly to your assessment aims, or you may want to read them all to gain an understanding of all that STAR Enterprise can do. Final chapters provide answers to frequently asked questions and instructions for common software tasks, and are a resource for all readers. To make the book useful to a wide audience of educators, we minimize technical terms while explaining the concepts that are important to know. Renaissance Place software contains technical manuals for anyone who wants to examine the psychometric data more closely.
We believe STAR Enterprise assessments are the perfect tools for data-driven schools. They are practical and sound, and provide a wealth of information about your students’ reading and math skills. We hope the information you find in this guide will help and inspire you. It is, however, only an introduction. To learn about more professional-development opportunities, including consultation on your own student data, visit our website’s Training Center at www.renlearn.com.


3
qSTAR Enterprise Basics
The only way to know whether learning is taking place is to measure it. Once you do that you can do a host of other things. You can provide students with appropriate materials. You can identify students who need help. You can analyze problems occurring within grades or schools; set learning goals; and make plans for meeting those goals. And you can determine whether the instruction and intervention you provide are effective.
STAR Reading Enterprise and STAR Math Enterprise are uniquely capable of facilitating all of these tasks. Thanks to computer-adaptive technology, students complete the tests quickly, and teachers and administrators receive the results immediately. Moreover, STAR tests are accurate, reliable, and valid. In fact, they received the highest rating of all screening and progress-monitoring assessments from the National Center on Response to Intervention.
In this chapter, we tell you for whom STAR Enterprise assessments are designed, how they work, the type of data they generate, and how we know they are good assessments. We also provide guidelines for administering the test so that results accurately reflect students’ abilities. We recommend that all educators who will be administering STAR Enterprise tests or analyzing their data read this chapter carefully.
For Whom Are STAR Enterprise Assessments Designed?
STAR Reading Enterprise and STAR Math Enterprise are designed for students in grades 1 through 12. (STAR Enterprise can also be used with kindergarten students. However, norm-referenced scores are not reported.) The tests measure specific skills as well as overall reading and math ability. They compare students’ achievement to that of students across the nation, forecast student proficiency on state tests, estimate mastery of state standards and Common Core State Standards, and report on growth over time.
A standard administration of STAR Reading Enterprise or STAR Math Enterprise requires that a student have a sight vocabulary of at least 100 words. This means the student is able to read early-reader books, can work through the reading or math practice questions at the beginning of the test, or, if the student has taken a STAR Early Literacy assessment, has been identified as a “Probable Reader.” You may, however, read STAR Math Enterprise items aloud to students who are not able to decode the words themselves. While this is considered a nonstandard administration, there is no evidence that this practice invalidates scores. See page 87 for more information.
Test Frequency
Most schools administer STAR Enterprise assessments in fall, winter, and spring for screening purposes. If a school wants to see a trend line appear that forecasts proficiency on state tests or mastery of standards, they administer an additional test in late fall. Teachers who monitor student progress more closely or use STAR Enterprise data for instructional planning do more frequent testing. See the chart on page 15 in Chapter 2 for an example of a testing pattern.
Getting the Most out of STAR Reading Enterprise and STAR Math Enterprise
4
How STAR Enterprise Works
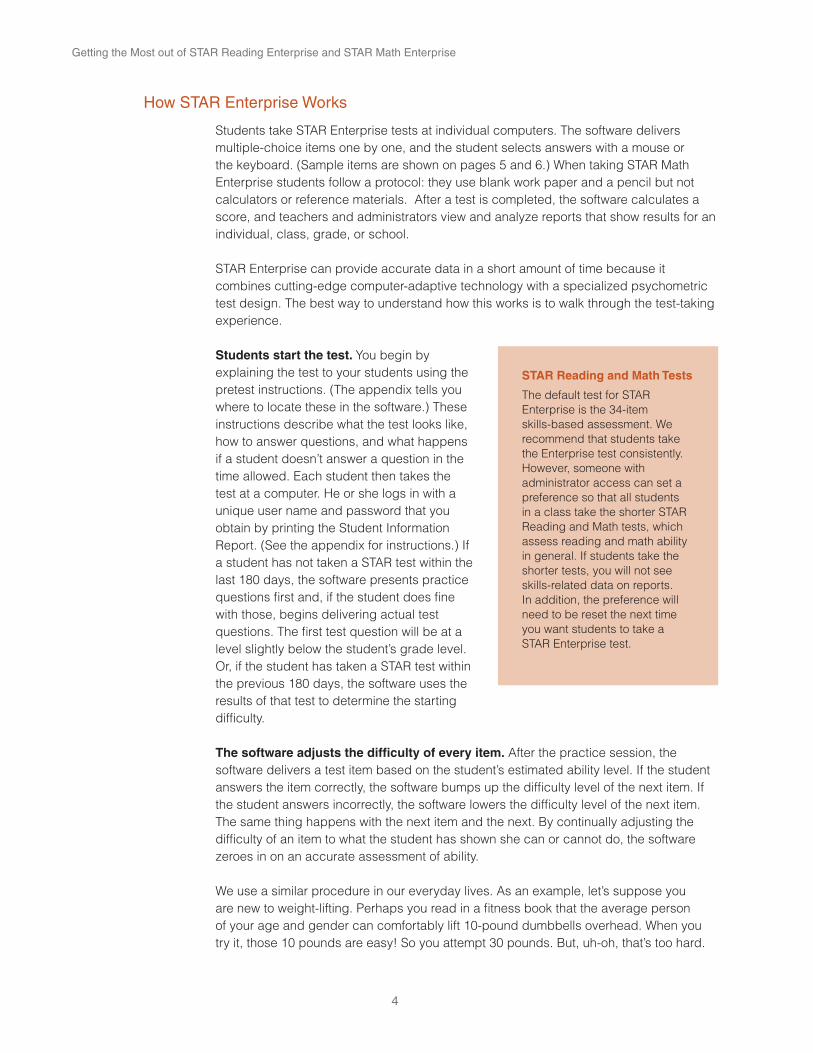
Students take STAR Enterprise tests at individual computers. The software delivers multiple-choice items one by one, and the student selects answers with a mouse or the keyboard. (Sample items are shown on pages 5 and 6.) When taking STAR Math Enterprise students follow a protocol: they use blank work paper and a pencil but not calculators or reference materials. After a test is completed, the software calculates a score, and teachers and administrators view and analyze reports that show results for an individual, class, grade, or school.
STAR Enterprise can provide accurate data in a short amount of time because it combines cutting-edge computer-adaptive technology with a specialized psychometric test design. The best way to understand how this works is to walk through the test-taking experience.
Students start the test. You begin by explaining the test to your students using the pretest instructions. (The appendix tells you where to locate these in the software.) These instructions describe what the test looks like, how to answer questions, and what happens if a student doesn’t answer a question in the time allowed. Each student then takes the test at a computer. He or she logs in with a unique user name and password that you obtain by printing the Student Information Report. (See the appendix for instructions.) If a student has not taken a STAR test within the last 180 days, the software presents practice questions first and, if the student does fine with those, begins delivering actual test questions. The first test question will be at a level slightly below the student’s grade level. Or, if the student has taken a STAR test within the previous 180 days, the software uses the results of that test to determine the starting difficulty.
The software adjusts the difficulty of every item. After the practice session, the software delivers a test item based on the student’s estimated ability level. If the student answers the item correctly, the software bumps up the difficulty level of the next item. If the student answers incorrectly, the software lowers the difficulty level of the next item. The same thing happens with the next item and the next. By continually adjusting the difficulty of an item to what the student has shown she can or cannot do, the software zeroes in on an accurate assessment of ability.
We use a similar procedure in our everyday lives. As an example, let’s suppose you are new to weight-lifting. Perhaps you read in a fitness book that the average person of your age and gender can comfortably lift 10-pound dumbbells overhead. When you try it, those 10 pounds are easy! So you attempt 30 pounds. But, uh-oh, that’s too hard.
STAR Reading and Math Tests
The default test for STAR Enterprise is the 34-item skills-based assessment. We recommend that students take the Enterprise test consistently. However, someone with administrator access can set a preference so that all students in a class take the shorter STAR Reading and Math tests, which assess reading and math ability in general. If students take the shorter tests, you will not see skills-related data on reports. In addition, the preference will need to be reset the next time you want students to take a STAR Enterprise test.
5
STAR Enterprise Basics
Next you lift 20 pounds—still too hard. After a little more trial and error, you conclude that 15 pounds is just right. Thus, your current ability for lifting dumbbells overhead is 15 pounds. STAR assessments use the same kind of procedure. The software stores a huge number of items and “adapts” the test to each individual.
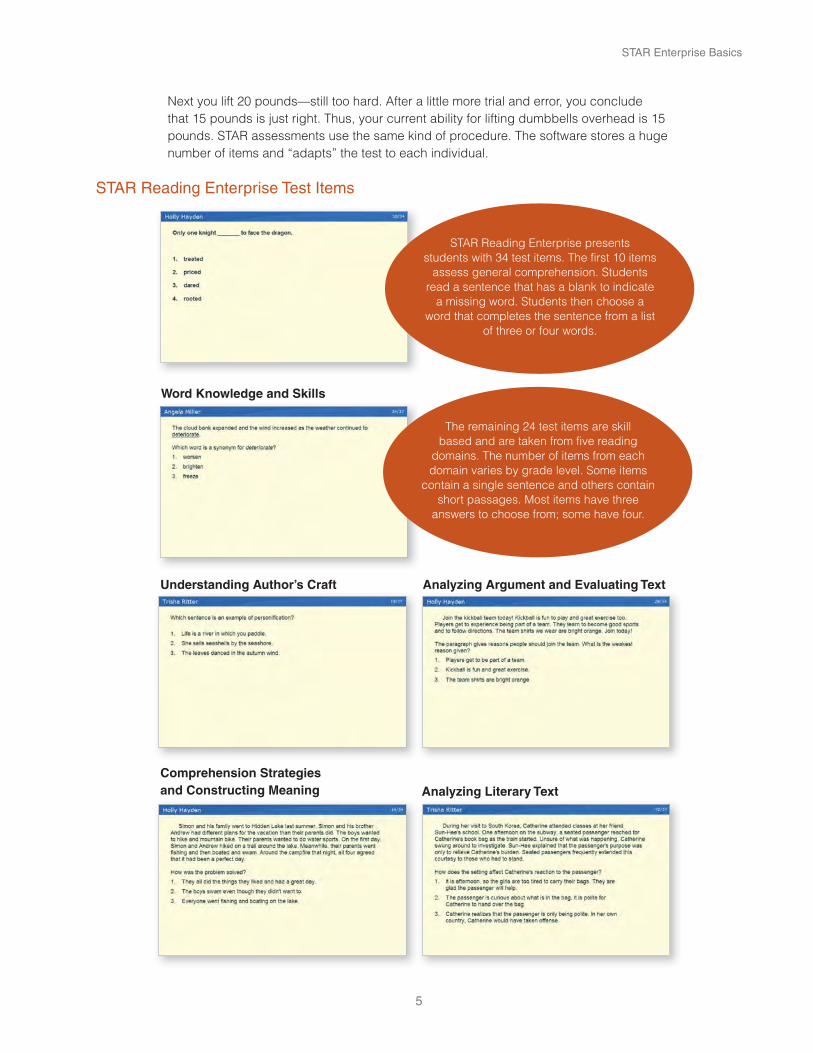
STAR Reading Enterprise Test Items
Word Knowledge and Skills
Understanding Author’s Craft Analyzing Argument and Evaluating Text
Comprehension Strategies and Constructing Meaning Analyzing Literary Text
The remaining 24 test items are skill based and are taken from five reading
domains. The number of items from each domain varies by grade level. Some items
contain a single sentence and others contain short passages. Most items have three
answers to choose from; some have four.
STAR Reading Enterprise presents students with 34 test items. The first 10 items
assess general comprehension. Students read a sentence that has a blank to indicate
a missing word. Students then choose a word that completes the sentence from a list
of three or four words.
Getting the Most out of STAR Reading Enterprise and STAR Math Enterprise
6
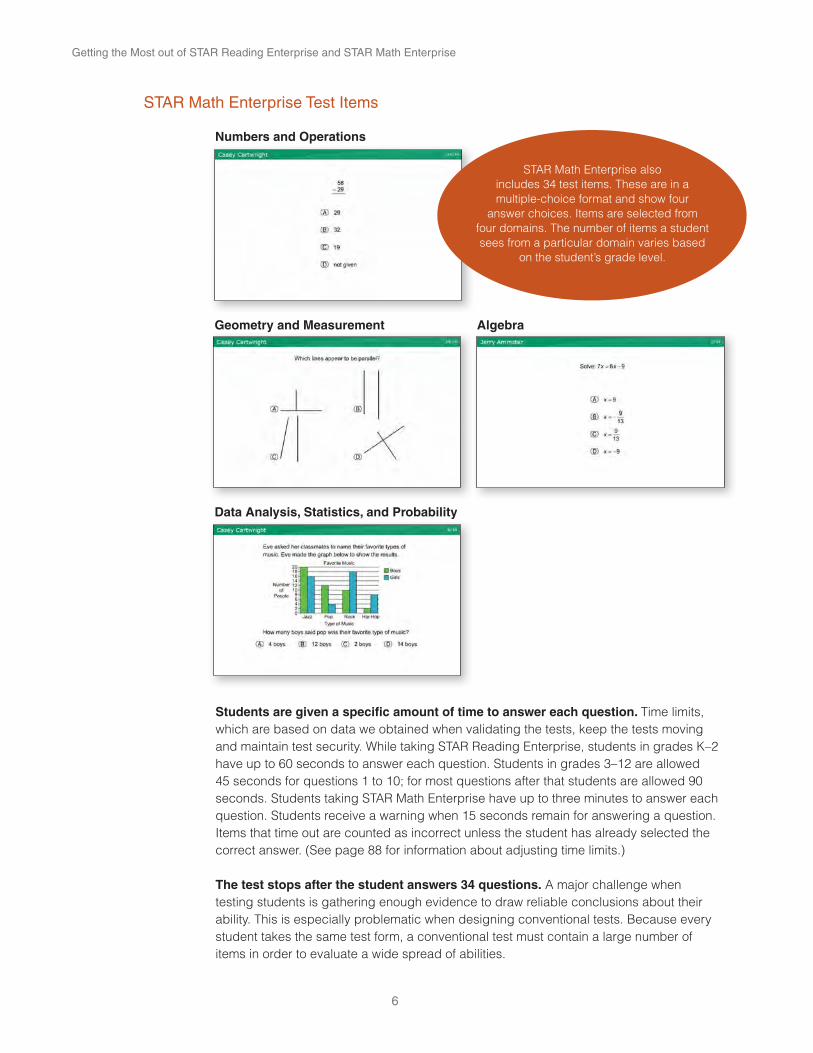
STAR Math Enterprise Test Items
Students are given a specific amount of time to answer each question. Time limits, which are based on data we obtained when validating the tests, keep the tests moving and maintain test security. While taking STAR Reading Enterprise, students in grades K–2 have up to 60 seconds to answer each question. Students in grades 3–12 are allowed 45 seconds for questions 1 to 10; for most questions after that students are allowed 90 seconds. Students taking STAR Math Enterprise have up to three minutes to answer each question. Students receive a warning when 15 seconds remain for answering a question. Items that time out are counted as incorrect unless the student has already selected the correct answer. (See page 88 for information about adjusting time limits.)
The test stops after the student answers 34 questions. A major challenge when testing students is gathering enough evidence to draw reliable conclusions about their ability. This is especially problematic when designing conventional tests. Because every student takes the same test form, a conventional test must contain a large number of items in order to evaluate a wide spread of abilities.
Numbers and Operations
Geometry and Measurement Algebra
Data Analysis, Statistics, and Probability
STAR Math Enterprise also includes 34 test items. These are in a multiple-choice format and show four
answer choices. Items are selected from four domains. The number of items a student sees from a particular domain varies based
on the student’s grade level.
7
STAR Enterprise Basics
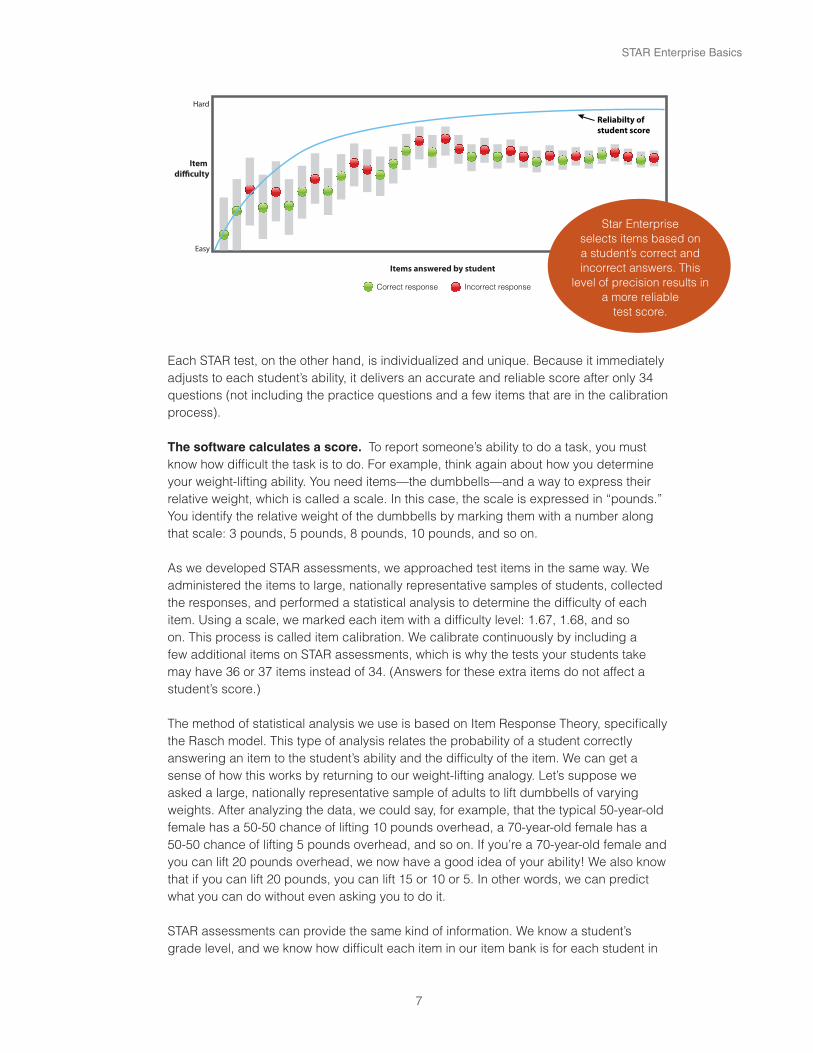
Each STAR test, on the other hand, is individualized and unique. Because it immediately adjusts to each student’s ability, it delivers an accurate and reliable score after only 34 questions (not including the practice questions and a few items that are in the calibration process).
The software calculates a score. To report someone’s ability to do a task, you must know how difficult the task is to do. For example, think again about how you determine your weight-lifting ability. You need items—the dumbbells—and a way to express their relative weight, which is called a scale. In this case, the scale is expressed in “pounds.” You identify the relative weight of the dumbbells by marking them with a number along that scale: 3 pounds, 5 pounds, 8 pounds, 10 pounds, and so on.
As we developed STAR assessments, we approached test items in the same way. We administered the items to large, nationally representative samples of students, collected the responses, and performed a statistical analysis to determine the difficulty of each item. Using a scale, we marked each item with a difficulty level: 1.67, 1.68, and so on. This process is called item calibration. We calibrate continuously by including a few additional items on STAR assessments, which is why the tests your students take may have 36 or 37 items instead of 34. (Answers for these extra items do not affect a student’s score.)
The method of statistical analysis we use is based on Item Response Theory, specifically the Rasch model. This type of analysis relates the probability of a student correctly answering an item to the student’s ability and the difficulty of the item. We can get a sense of how this works by returning to our weight-lifting analogy. Let’s suppose we asked a large, nationally representative sample of adults to lift dumbbells of varying weights. After analyzing the data, we could say, for example, that the typical 50-year-old female has a 50-50 chance of lifting 10 pounds overhead, a 70-year-old female has a 50-50 chance of lifting 5 pounds overhead, and so on. If you’re a 70-year-old female and you can lift 20 pounds overhead, we now have a good idea of your ability! We also know that if you can lift 20 pounds, you can lift 15 or 10 or 5. In other words, we can predict what you can do without even asking you to do it.
STAR assessments can provide the same kind of information. We know a student’s grade level, and we know how difficult each item in our item bank is for each student in
Star Enterprise selects items based on a student’s correct and incorrect answers. This
level of precision results in a more reliable
test score.
Getting the Most out of STAR Reading Enterprise and STAR Math Enterprise
8
that grade level. Therefore we can look at a student’s pattern of right and wrong answers on a STAR test and provide a statistically sound estimate of the student’s ability. We also know the probability of a student answering any item correctly without presenting that item to the student.
During the development of STAR Enterprise assessments, we also created learning progressions for reading and math. First, we identified the order in which specific skills are learned based on an extensive literature review, analysis of curricula and standards, and expert guidance. Then as part of our ongoing item calibration process, we administered items that assessed those skills to millions of students. By analyzing that data, we were able to determine the difficulty of each skill item and the difficulty of skill items in relation to each other. In this way, we were able to sequence specific skills pedagogically and empirically. We talk more about the Core Progress learning progressions for reading and math in Chapter 5.
The software reports various types of scores. The scaled score is the most important score. It is a raw score based on the difficulty of the questions that were presented to the student and whether or not the student answered them correctly. This score is similar to pounds in our weight-lifting example. Just as we can say your weight-lifting ability is 20 pounds, we can say your scaled score on STAR Reading Enterprise is 236. The scaled score is a good score for reporting growth. Just as your weight-lifting ability might increase from 20 pounds to 25 pounds, a student’s reading ability might grow from 236 to 319.
The scaled score is also important because we use it to establish statistical relationships that tell us more about a student’s learning. Through our calibration process, we identify where a particular scaled score in STAR Reading Enterprise falls on the learning progression for reading and where a scaled score in STAR Math Enterprise falls on the learning progression for math. Thus we are able to report the skills a student likely already knows and the skills that a student is likely ready to learn. We also link scaled scores to performance on specific state tests, which enables us to predict how a student with a particular scaled score will do. In addition, we use scaled score when we estimate mastery of state standards and Common Core State Standards. We talk more about this in later chapters.
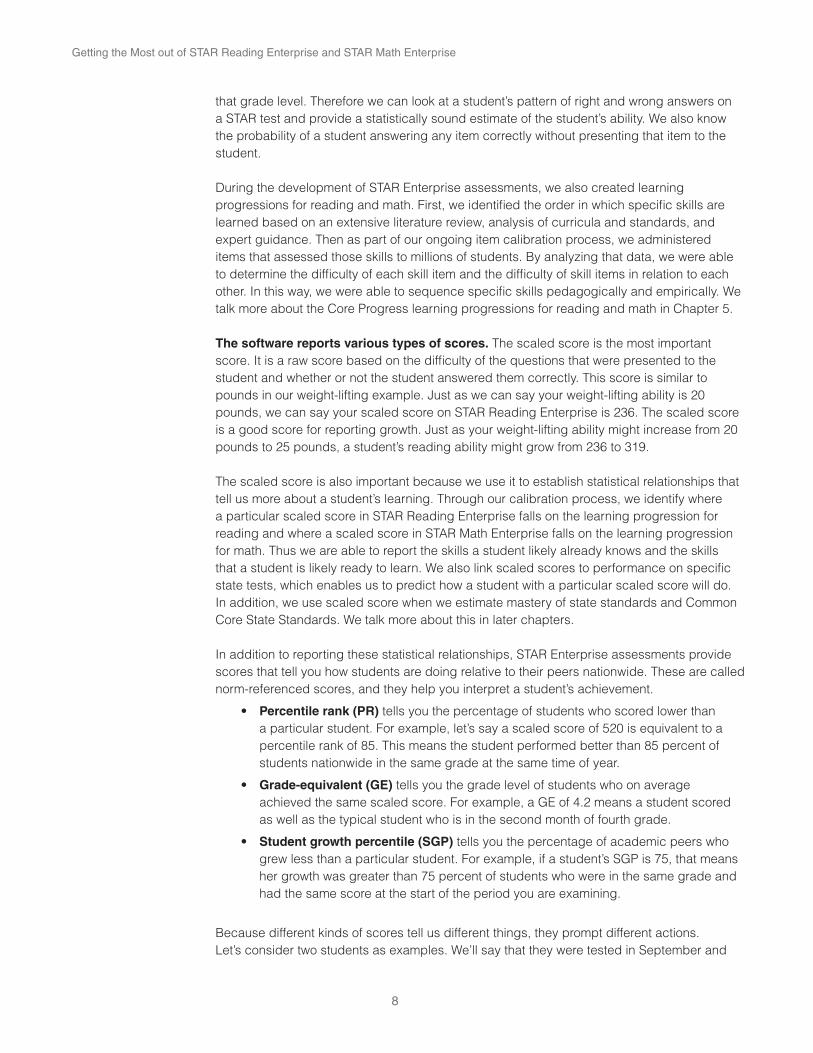
In addition to reporting these statistical relationships, STAR Enterprise assessments provide scores that tell you how students are doing relative to their peers nationwide. These are called norm-referenced scores, and they help you interpret a student’s achievement.
Percentile rank (PR) tells you the percentage of students who scored lower than a particular student. For example, let’s say a scaled score of 520 is equivalent to a percentile rank of 85. This means the student performed better than 85 percent of students nationwide in the same grade at the same time of year.
Grade-equivalent (GE) tells you the grade level of students who on average achieved the same scaled score. For example, a GE of 4.2 means a student scored as well as the typical student who is in the second month of fourth grade.
Student growth percentile (SGP) tells you the percentage of academic peers who grew less than a particular student. For example, if a student’s SGP is 75, that means her growth was greater than 75 percent of students who were in the same grade and had the same score at the start of the period you are examining.
Because different kinds of scores tell us different things, they prompt different actions. Let’s consider two students as examples. We’ll say that they were tested in September and
9
STAR Enterprise Basics
December. The first student, Jennifer Brown, had a scaled score in September of 782. By December, it increased to 946—she definitely made gains. This is called absolute growth. When we look at her percentile rank, we see that it has also increased—from the 57th percentile to the 64th percentile. This tells us she has made gains relative to students in her grade nationwide, which is called relative growth. Her growth is further substantiated by her student growth percentile of 82. This score means she grew more than 82 percent of students who had a scaled score of 782 in September.
Now let’s look at a second student, John Smith. His scaled score has also increased—from 573 to 601—showing absolute growth. But his PR is the same in December as it was in September: the 23rd percentile. There’s been no relative growth—while John is learning, he’s barely maintaining his standing. We also see that his student growth percentile is 35. That means he grew more than only 35 percent of students who had a scaled score of 573 in September. His growth needs to accelerate, perhaps through an intervention program, if he is to make more significant gains.
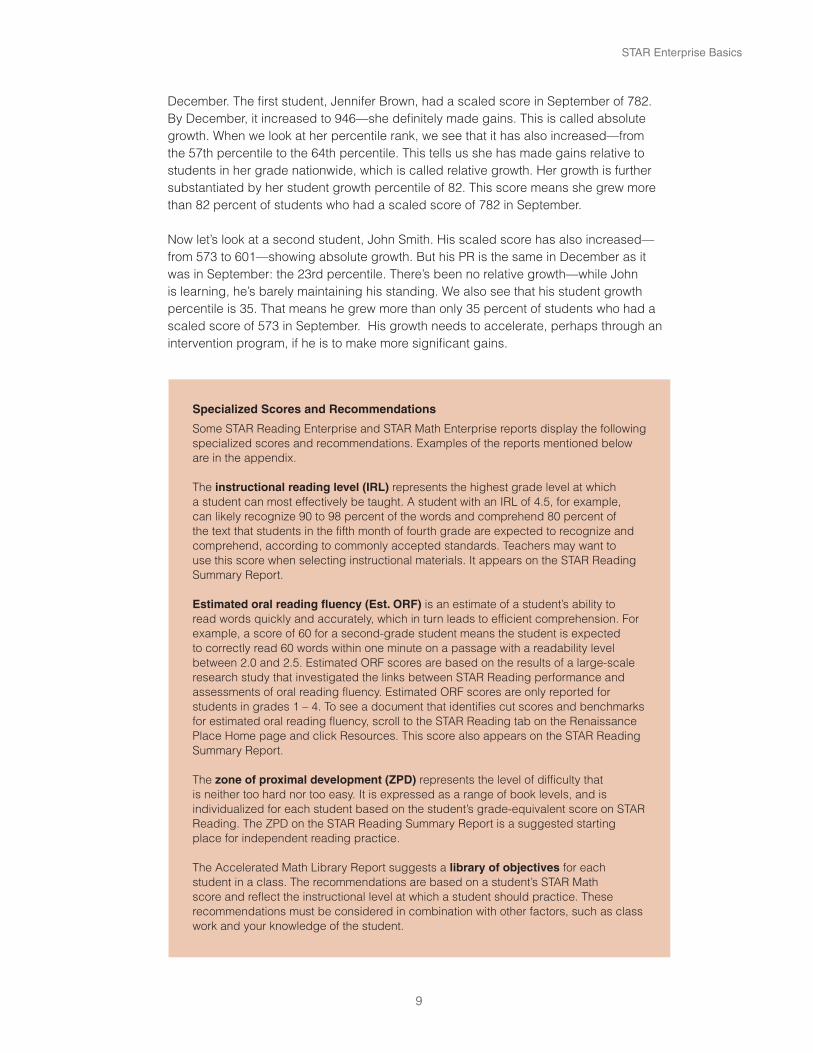
Specialized Scores and Recommendations
Some STAR Reading Enterprise and STAR Math Enterprise reports display the following specialized scores and recommendations. Examples of the reports mentioned below are in the appendix.
The instructional reading level (IRL) represents the highest grade level at which a student can most effectively be taught. A student with an IRL of 4.5, for example, can likely recognize 90 to 98 percent of the words and comprehend 80 percent of the text that students in the fifth month of fourth grade are expected to recognize and comprehend, according to commonly accepted standards. Teachers may want to use this score when selecting instructional materials. It appears on the STAR Reading Summary Report.
Estimated oral reading fluency (Est. ORF) is an estimate of a student’s ability to read words quickly and accurately, which in turn leads to efficient comprehension. For example, a score of 60 for a second-grade student means the student is expected to correctly read 60 words within one minute on a passage with a readability level between 2.0 and 2.5. Estimated ORF scores are based on the results of a large-scale research study that investigated the links between STAR Reading performance and assessments of oral reading fluency. Estimated ORF scores are only reported for students in grades 1 – 4. To see a document that identifies cut scores and benchmarks for estimated oral reading fluency, scroll to the STAR Reading tab on the Renaissance Place Home page and click Resources. This score also appears on the STAR Reading Summary Report.
The zone of proximal development (ZPD) represents the level of difficulty that is neither too hard nor too easy. It is expressed as a range of book levels, and is individualized for each student based on the student’s grade-equivalent score on STAR Reading. The ZPD on the STAR Reading Summary Report is a suggested starting place for independent reading practice.
The Accelerated Math Library Report suggests a library of objectives for each student in a class. The recommendations are based on a student’s STAR Math score and reflect the instructional level at which a student should practice. These recommendations must be considered in combination with other factors, such as class work and your knowledge of the student.

Getting the Most out of STAR Reading Enterprise and STAR Math Enterprise
10
STAR Enterprise provides many reports that use these and other scores to help you analyze student needs, make good decisions, and monitor progress. We give details and examples throughout the rest of this book of the ones that are most commonly used. A list of all the reports available and what they include is in the appendix.
How We Know STAR Enterprise Assessments Are Reliable and Valid
For a test to be good it must be reliable. A reliable test is like a reliable car. Just as a reliable car starts up every time you turn the key, a reliable test gives consistent results from one administration to another.
In the assessment field, the key to reliability is length. As we noted earlier, conventional tests must be long in order to provide enough items to adequately test students with a wide range of abilities. Because STAR Enterprise assessments individualize each test through computer-adaptive technology,they show high levels of reliability with far fewer items.
Psychometricians evaluate reliability in a number of ways. One way is to administer the test to the same students within about a week’s time and see if the scores are consistent. This is referred to as test-retest reliability. According to the National Center on Response to Intervention (NCRTI), a reliability level of .60 and higher is good; .80 is very good. We have collected and analyzed four types of reliability data, including test-retest reliability. In all types of analysis, the reliability level of STAR Reading and STAR Math exceeds .90.
Besides being reliable, a test must be valid. Validity means that the test actually tests what it is meant to test. As with reliability, there are many ways to measure this. One way is to evaluate “content validity,” that is, the relevance of the skills and objectives to reading and math curricula as well as state standards and Common Core State Standards. This was achieved through our extensive effort to develop reading and math learning progressions to which we have correlated test items. Another way to evaluate validity is to examine the degree to which one assessment correlates with other commonly accepted assessments. To check this, we asked schools to submit students’ STAR assessment results along with their scores on other assessments, such as the California Achievement Test, DIBELS, FCAT, Iowa Test of Basic Skills, Comprehensive Test of Basic Skills, Metropolitan Achievement Test, and Stanford Achievement Test. Our analysis showed high correlations with these tests. In fact, the correlations exceeded the guideline provided by the NCRTI. The technical manuals provide details. In addition, STAR assessments have met the highest review standards of the NCRTI and other agencies that review RTI assessments.
NCRTI
The National Center on Response to Intervention is funded by the U.S. Department of Education’s Office of Special Education Programs (OSEP) and works in conjunction with researchers from Vanderbilt University and the University of Kansas. It provides information and technical assistance to states and districts that are implementing proven models for RTI.

11
STAR Enterprise Basics
Fidelity of Administration
STAR Enterprise provides a wealth of “actionable” data. It tells you which students are succeeding or failing, who needs intervention, how likely students are to meet standards and reach proficiency on state tests, and whether the curriculum and interventions you are implementing are making a difference. Because important decisions will be made based, in part, on STAR data, it’s critical that the data accurately reflect each student’s ability. Test administration must also replicate norming conditions for scores to be valid. Below is a checklist of best practices for ensuring proper administration.
Test Administration Best Practices Checklist
Before Testing
� Schedule the assessment for a time of day when students will be alert and engaged. Don’t schedule an assessment right before lunch or recess, or at the end of the day. Allow a full class period, or roughly 45 minutes, for students to log in, listen to the pretest instructions, take the test, and log out.
� Plan on testing all students at once. If that is not possible, test them within a narrow timeframe so you can better compare scores.
� Arrange for a quiet and secure environment for testing similar to what you would require for a traditional high-stakes test. The best setting is usually a computer lab.
� Log in to the test you are administering as a Teacher/Administrator. Print and review the pretest instructions. Print the Student Information Report to obtain students’ user names and passwords.
� Talk to students about the importance of the test. Emphasize that it must be taken seriously. You may wish to tell students how the scores will be used so they understand why it is in their best interest to show what they can do.
� Encourage students to raise their scaled score each time they test. It’s the best score for monitoring growth because even small gains are reflected. In addition, the scaled score does not carry the negative connotation that a low percentile rank or grade-equivalent score might have for struggling students.
During Testing
� Space students so they are not distracted and cannot provide each other with answers.
� Make sure students taking STAR Math have paper and pencil and know they can use them.
� If you are administering both STAR Reading and STAR Math, give the math test first. If students take STAR Reading first, they tend not to use paper and pencil with STAR Math.
� Follow the pretest instructions. This promotes consistency of administration and matches the norming conditions.
� Walk around as students are testing to make sure they stay on task. Do not explain test items or help with answers. Do not allow students to use dictionaries, calculators, or other reference materials.
After Testing
� Print and review reports that best align with your testing purposes. The remaining chapters in this book provide guidance.
� If you suspect that a student took a STAR Reading test without really attending to it, look at the student’s STAR Reading Diagnostic Report. It will tell you how much time the student spent on the test and will display a warning if it appears the student rushed through it.
� Make progress visible. Students can graph their scaled scores, or you might give them a copy of the Annual Progress Report. (See an example on page 82.) Another option is to add up the scaled scores of every student in the class, or use the average scaled score, and plot the progress of the class as a whole.

Getting the Most out of STAR Reading Enterprise and STAR Math Enterprise
12
SUMMARY
STAR ENTERPRISE BASICS
vocabulary of at least 100 words. In a nonstandard STAR Math Enterprise administration, you may read test items to students who cannot decode the words.
screening purposes. Administering an additional test in late fall facilitates forecasting. Teachers can test more frequently to plan instruction and monitor student progress.
ranks, which are used for different purposes. The scaled score is related statistically to knowledge of specific skills, performance on state tests, and mastery of state standards and Common Core State Standards.
environment so that results are accurate and reliable.

13
wPlanning for Assessment
Assessments are only worthwhile when they are put to good purposes. Because STAR Enterprise can do so much, it’s critical that a district or school define which purposes they want to emphasize. From that decision flow others: who to test, how often to test them, when data will be analyzed, and who on the faculty needs more training in order to use the data effectively. Addressing these issues is part of assessment planning, which is usually carried out by administrators or other staff specifically charged with the task. It’s to this group that we direct this chapter.
Identify Purposes for Assessment
Begin the planning process by nailing down your purposes for assessment. This is usually done at the district level or at the school level with administrative leadership. The What Works Clearinghouse, a Department of Education initiative that identifies scientific evidence for what works in education, recommends school-level data teams that consist of the following: principal or assistant principal; two or three teachers representing various subjects and grade levels; one or two classroom support professionals, such as reading coaches; and a district-level staff member who works in assessment. This team looks at the school’s overall goals for improving student achievement and clarifies how data will be used to advance those goals. For example, a school with a large population of struggling readers might set a goal to have 80 percent of its students reading at or above the fortieth percentile in five years. To help them meet this goal, the school-level data team might elect to use STAR Reading Enterprise as their universal screening tool so they can monitor the school’s progress toward that goal and better identify students who need intervention. Another school might be focusing specifically on math intervention. The school-level data team may decide to use the goal-setting features in STAR Math Enterprise to set individualized goals for students. They may also decide to run specialized reports to monitor how well students are responding to their interventions.
On page 14 we list six potential purposes for assessment and key questions related to them. STAR Enterprise data can, of course, be used for multiple purposes at the same time. For example, data obtained during screening can also be used to assess mastery of standards and forecast proficiency on your state test. But if your faculty is new to STAR, you may wish to focus on one or two purposes during the first year of implementation.
Establish Grade-Level Data Teams
Within each school, identify who will serve on grade-level data teams. These teams will be responsible for compiling and reviewing data and will make decisions about the intervention and resource needs of their specific grade. They will also assess the needs of individual students, place them in appropriate programs, and share effective teaching practices. (Some schools refer to these teams as problem-solving or intervention teams.) Members must understand students, and they must know the resources that are available in the school and have the authority to allocate them. Thus they usually include

Getting the Most out of STAR Reading Enterprise and STAR Math Enterprise
14
the principal and all the teachers for the grade. They may also include the data manager, curriculum coordinator, and/or Response to Intervention (RTI) coordinator if a school uses the RTI framework. Be sure to define the roles and responsibilities of the members of the data team. For example, who will schedule the computer lab for testing? Who will prepare or print reports? Who will facilitate data-team discussions?
Purpose Key Questions
Universal Screening Which students are reaching benchmark and which need intervention? Is our curriculum bringing students above benchmark?
Progress Monitoring Are students in intervention responding to the intervention? Are our intervention programs working?
Differentiating Instruction Which skills are students ready to learn? Which skills are appropriate for groups of students to work on?
Forecasting State Test Proficiency Is our curriculum ensuring that students are meeting proficiency requirements on the state test? Which students are at risk of not passing the state test?
Mastery of State Standards and Common Core State Standards
Are students mastering state standards and Common Core State Standards? Which standards are likely to be difficult for students to learn?
Measuring Growth Are students showing growth this year and over multiple years? Is student growth average, above average, or below average? Is our educational environment making an impact on growth?
Develop a Schedule
Once you’ve identified your purposes for assessment and established grade-level data teams, develop a schedule that is integrated with the school calendar and includes the following components.
Testing. Think about which students you will assess and how often. Most schools test all students in fall, winter, and spring for universal screening. (Instructions for setting up screening periods in the software are in the appendix.) Schools that use STAR Enterprise to forecast proficiency on state tests or mastery of standards would likely test all students a fourth time, typically in late fall. This is because reports that provide data for this kind of forecasting display a trend line after three testing events. By scheduling those three testing events by mid-January, schools ensure they have time to act on the data before a state test is administered in the spring or the school year ends.
Depending on their purposes for assessment, some teachers may wish to test students more frequently. For example, if a teacher is using STAR Enterprise data for instructional planning, she might administer the test monthly. So might a teacher who is concerned about her students’ performance on the state test. An intervention teacher, on the other hand, might test her students as often as weekly so that she can monitor their response to intervention. An important guideline is to test students only when you are prepared to

15
Planning for Assessment
act on the data the test provides. That’s why we urge you to develop a testing schedule that is aligned to your purposes and includes data reviews for problem solving and decision making.
The chart below illustrates a testing schedule for a state that tests in the spring. This testing schedule includes three test administrations for universal screening. A fourth test is given to all students so that a trend line will display after winter testing. Some students are tested weekly or biweekly to measure their response to intervention. Teachers who are using STAR Enterprise data for instructional planning also test students more frequently but usually no more than monthly.
Data Reviews. To ensure that faculty systematically review and respond to data, build data meetings into the school calendar as well. How often the data teams meet will depend on the purposes you’ve identified for assessment. For example, if you use STAR Enterprise for universal screening, teams must meet shortly after each screening period. If you are using STAR for progress monitoring, teams may meet whenever students are tested for that purpose and members are prepared to make decisions about instruction or program placement.
Professional Development. Using data effectively requires a variety of skills: administering assessments with fidelity, interpreting data, using data to modify curriculum and/or teaching practices, and, of course, clicking the right keys in the software. Because STAR Enterprise gives educators the opportunity to apply their skills to so many purposes, we recommend that you not ask staff to learn everything at once. Instead, begin with professional development that focuses on your initial purposes for assessment and build from there. Consider the right timing and earmark it on the school calendar. For example, if you wish to use STAR Enterprise for universal screening, schedule professional development before the first screening period of the year.
Universal Screening
Progress Monitoring
Instructional Planning
Forecasting Proficiency
on the State Test
Estimating Mastery of Standards
Measuring Growth
Fall I
Interim Testing
I
Late Fall I
Interim Testing
I
Winter I
Interim Testing
I
Spring I
Example of a Testing Schedule
All Students I Students in Intervention

Getting the Most out of STAR Reading Enterprise and STAR Math Enterprise
16
Below is an example of a school calendar showing screening windows, data reviews, and professional development.
Create a school calendar that
includes dates for testing and data
reviews.
School year may be extended due to inclement weather. Calendar subject to change.
KEY
First/Last Day Screening Screening Data Review Progress Monitor No School Parent Conferences
September 1 First Day of SchoolSeptember 5 Labor DayOctober 27-28 Teacher ConventionNovember 2 End of 1st QuarterNovember 21-22 Parent ConferencesNovember 24-25 ThanksgivingDec 26-Jan 6 Winter BreakJanuary 16 M.L. King Day
January 20 End of 2nd QuarterFebruary 20 Presidents DayMarch 28 End of 3rd QuarterApril 2-9 Spring BreakMay 28 Memorial DayJune 4-5 Parent Conferences June 12 End of 4th QuarterJune 12 Last Day of School
IMPORTANT DATES
17
Planning for Assessment
Enter Student Information
Before students can take their first STAR assessment, a few tasks must be completed within the software. These are generally done by technology managers with administrator access.
Enter school and district information in Renaissance Place. Someone with administrator access must enter information about each school that is using STAR assessments, including the school calendar, staff members, classes, and student information. A lead teacher for each class must also be designated.
Add student characteristics. When you add student information in Renaissance Place, we recommend that you include any student characteristics for which you will want data. For example, if you would like to be able to compare the progress of students receiving free lunch to that of the school population as a whole, you must identify those students in the software. The software includes a list of characteristics, and you may also define your own characteristics. See the Renaissance Place software manual for full instructions on entering district, school, and student information.
Define Benchmarks and Proficiency Levels
A benchmark is a standard against which you measure the achievement of a student, grade, school, or district. It is the lowest level of performance that is considered acceptable. STAR Enterprise allows administrators to decide what that benchmark is so that the achievement data it provides is meaningful. In addition, STAR Enterprise lets administrators define levels of proficiency using cut scores. That way, student data can be displayed on some reports in categories, which enables data teams to better identify students who need help. Make decisions about benchmarks and cut scores as part of your assessment planning and define them, if necessary, in the software.
STAR Enterprise has three types of benchmark settings, all of which can be modified by someone with administrator access:
State benchmark settings. We determine a state benchmark by linking the STAR scale with the scale used for the state test. This tells us which STAR scaled scores fall into which proficiency levels at the time of the state test. For example, let’s suppose a state reports five proficiency levels on its state test: Exemplary, Exceeds Standards, Meets Standards, Approaches Standards, and Academic Warning. Through a linking study, we might find that a student who has a STAR Reading scaled score at or above 512 at the time of the state test will likely fall in the Exemplary category, a student who has a scaled score between 498 and 511 will likely fall in the Exceeds Standards category, and so on. If a linking study has been done for your state, you will automatically see the state benchmark and cut scores in the software. If a linking study has not yet been done or if we don’t have enough data to create links, the state benchmark and cut scores will not appear. In some cases, you will see a partial set of cut scores. For example, if your state tests three grades, we provide cut scores for those three grades based on the linking study. If you want to run a Screening Report for every grade using your state’s benchmark structure, administrators can choose to have the software fill in cut scores for the grades that are not tested, based on our statistical analysis. These can be modified, if needed.
Getting the Most out of STAR Reading Enterprise and STAR Math Enterprise
18
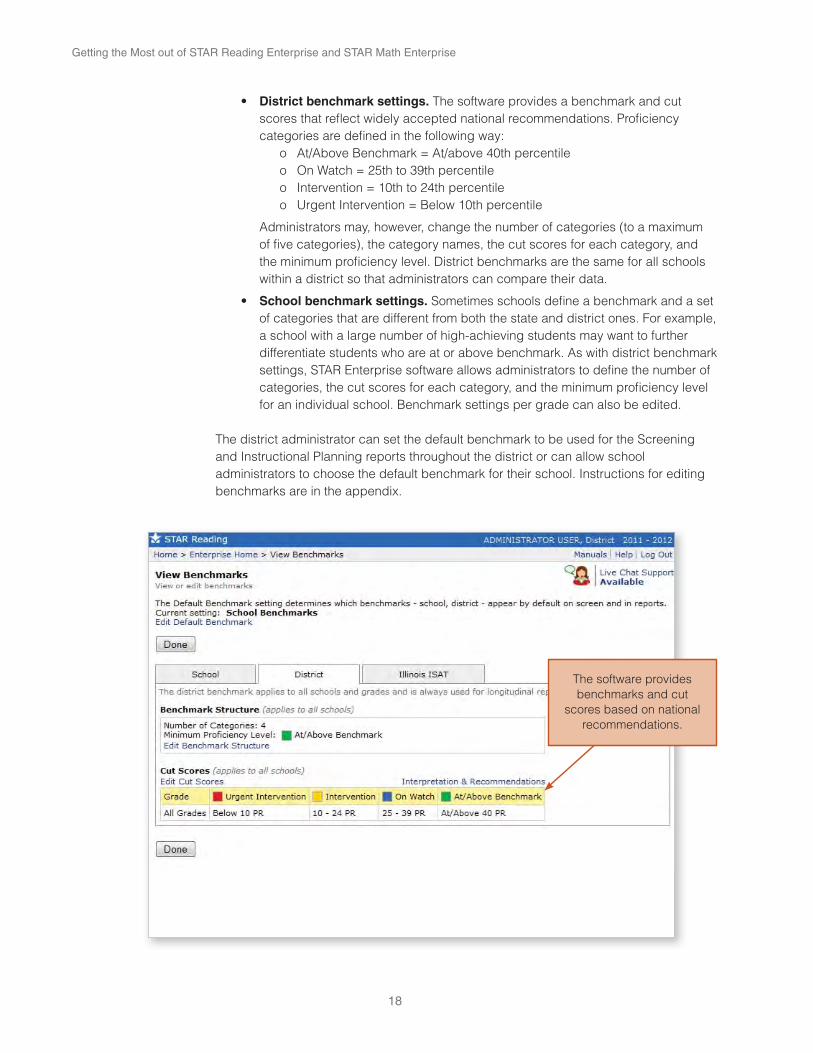
District benchmark settings. The software provides a benchmark and cut scores that reflect widely accepted national recommendations. Proficiency categories are defined in the following way:
o At/Above Benchmark = At/above 40th percentileo On Watch = 25th to 39th percentileo Intervention = 10th to 24th percentileo Urgent Intervention = Below 10th percentile
Administrators may, however, change the number of categories (to a maximum of five categories), the category names, the cut scores for each category, and the minimum proficiency level. District benchmarks are the same for all schools within a district so that administrators can compare their data.
School benchmark settings. Sometimes schools define a benchmark and a set of categories that are different from both the state and district ones. For example, a school with a large number of high-achieving students may want to further differentiate students who are at or above benchmark. As with district benchmark settings, STAR Enterprise software allows administrators to define the number of categories, the cut scores for each category, and the minimum proficiency level for an individual school. Benchmark settings per grade can also be edited.
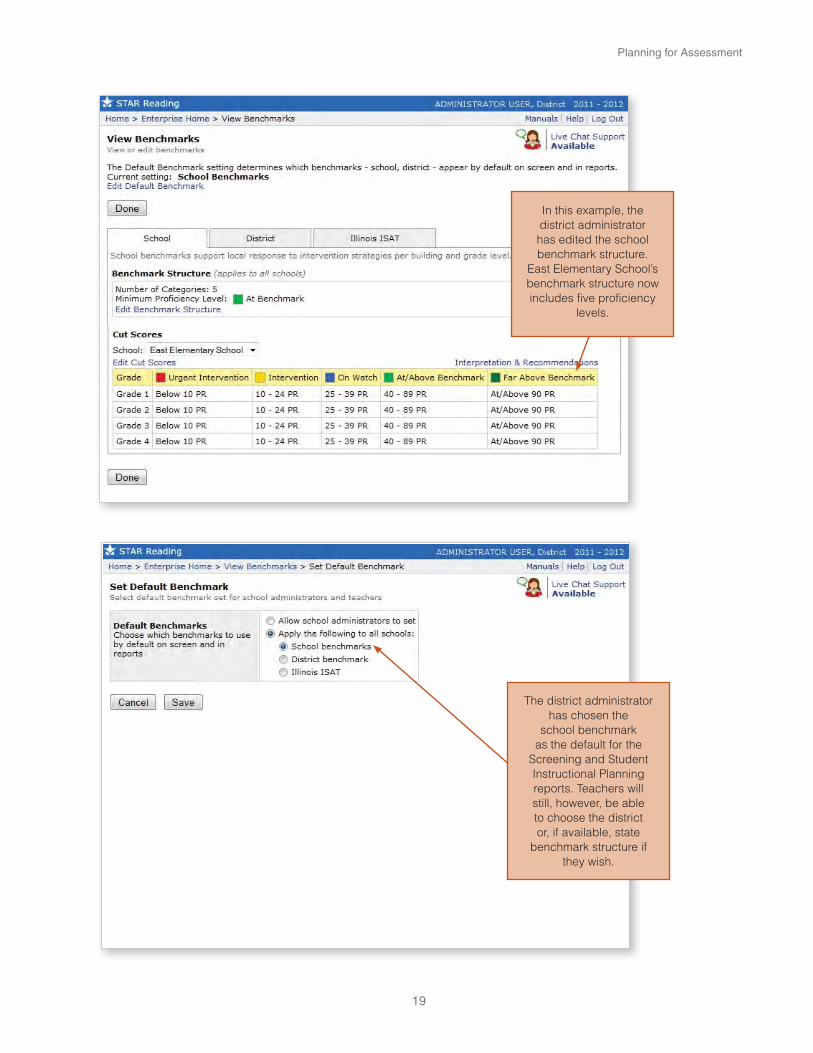
The district administrator can set the default benchmark to be used for the Screening and Instructional Planning reports throughout the district or can allow school administrators to choose the default benchmark for their school. Instructions for editing benchmarks are in the appendix.
The software provides benchmarks and cut
scores based on national recommendations.
19
Planning for Assessment
In this example, the district administrator has edited the school benchmark structure.
East Elementary School’s benchmark structure now includes five proficiency
levels.
The district administrator has chosen the
school benchmark as the default for the
Screening and Student Instructional Planning reports. Teachers will still, however, be able to choose the district or, if available, state
benchmark structure if they wish.

Getting the Most out of STAR Reading Enterprise and STAR Math Enterprise
20
Share the Assessment Plan
Capture in writing the district and school’s purposes for assessment—why students are being tested and how the test data will be used based on broader school and district improvement goals. Include in the assessment plan the comprehensive school calendar, like the one shown on page 16, which indicates when students will be tested and data will be reviewed. Distribute the plan and discuss it in faculty meetings. Make sure parents also know when their children will be tested and why. School newsletters and websites are good formats for communication.
Creating a Data Culture
When a school has a strong data culture, teachers, administrators, support staff, and students all believe that data is an integral part of teaching and learning. Data is gathered and analyzed routinely, and acting upon data is seamlessly integrated with instruction. A data culture is not created overnight, however. Some administrators say it can take five years or more to develop. Here are steps to get you started.
Share leadership. Have staff members identify school problems or weaknesses collectively. Ask staff to divide into teams, with each team charged with collecting data related to a weakness and proposing an action plan to address it.
Establish a universal understanding of terminology, assessment procedures, and uses of data. Create and distribute an assessment plan as described in this chapter. Include a glossary of commonly used terms. Devote staff meetings to explaining the plan and fielding questions.
Provide ongoing professional development. Don’t stop training after the first year of a STAR Enterprise implementation. The most effective professional development often takes place after teachers have their own student data in hand. Build knowledge of how to use STAR Enterprise for various purposes, and provide training on instructional strategies that will help you meet your improvement goals.
Reflect and refine together. Once a month, have staff bring data related to school improvement goals to faculty meetings. Discuss progress with the assumption that identifying and utilizing successful techniques is everyone’s concern and everyone’s responsibility. Refine action plans together when needed.
Involve students. Teach students how to use data to monitor their own performance. Share their assessment data with them in a positive way. Encourage them to boost their scaled scores, and emphasize the school’s commitment to helping them do so.
Make success visible. Post progress toward data-based goals in a public area of the school. (Don’t identify data at the classroom level, however.) Regularly send updates to parents as well. Document the history of your journey together, and always celebrate success.
21
Planning for Assessment
SUMMARY
PLANNING FOR ASSESSMENT
achievement.
meaningful.
22
eUniversal Screening
In the medical world, health screening tests are a critical part of preventive care. They help ensure that serious conditions are detected and treated. Typically, screening tests find that most people are fine, some have symptoms that bear watching, and a few must be treated immediately. By uncovering these needs, doctors can better allocate aid.
Students have a variety of needs, too. In order to deliver the best, most appropriate instruction, schools also need a screening process for assessing the condition of their students and allocating aid. This process, during which all students are tested, is generally referred to as universal screening. STAR Enterprise assessments inform universal screening by generating reliable data on every student. The software then presents the data on reports that make it easy to set priorities for instruction and intervention.
Typically, universal screening is done three times a year: fall, winter, and spring. In this chapter, we describe the purposes for each of these screening assessments and how to interpret data on STAR Enterprise screening reports. Since screening involves administrative and instructional decisions, both administrators and teachers will find this information useful.
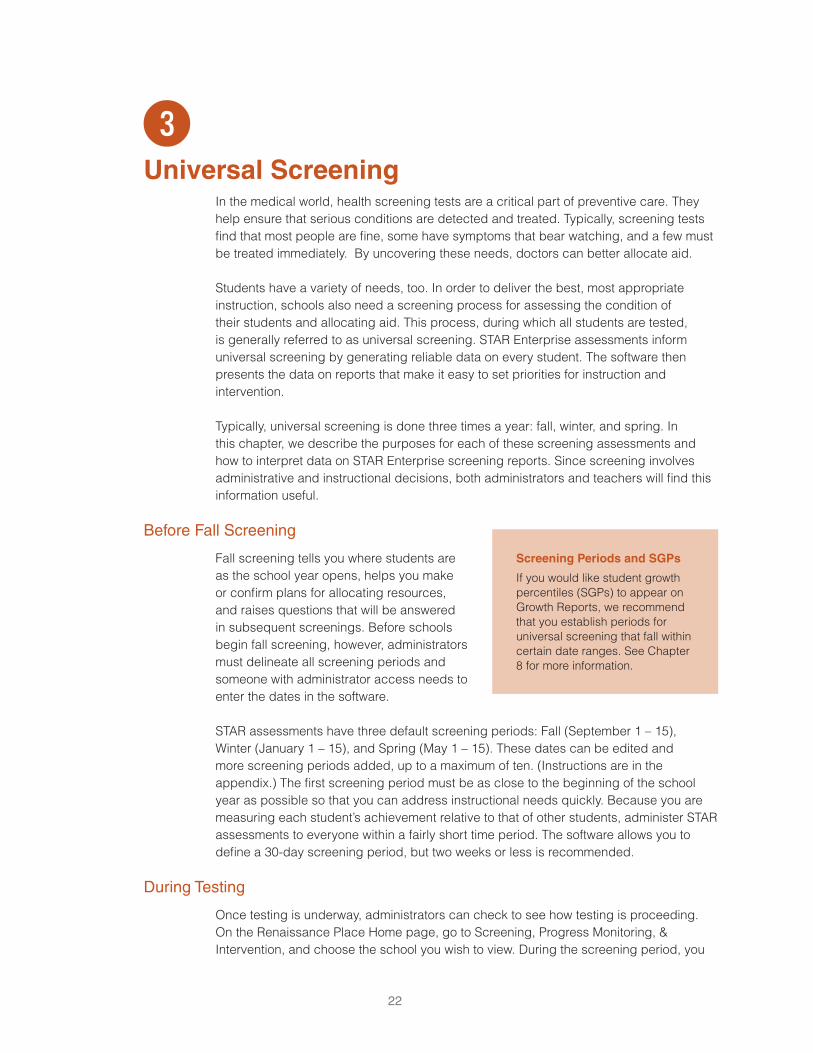
Before Fall Screening
Fall screening tells you where students are as the school year opens, helps you make or confirm plans for allocating resources, and raises questions that will be answered in subsequent screenings. Before schools begin fall screening, however, administrators must delineate all screening periods and someone with administrator access needs to enter the dates in the software.
STAR assessments have three default screening periods: Fall (September 1 – 15), Winter (January 1 – 15), and Spring (May 1 – 15). These dates can be edited and more screening periods added, up to a maximum of ten. (Instructions are in the appendix.) The first screening period must be as close to the beginning of the school year as possible so that you can address instructional needs quickly. Because you are measuring each student’s achievement relative to that of other students, administer STAR assessments to everyone within a fairly short time period. The software allows you to define a 30-day screening period, but two weeks or less is recommended.
During Testing
Once testing is underway, administrators can check to see how testing is proceeding. On the Renaissance Place Home page, go to Screening, Progress Monitoring, & Intervention, and choose the school you wish to view. During the screening period, you
Screening Periods and SGPs
If you would like student growth percentiles (SGPs) to appear on Growth Reports, we recommend that you establish periods for universal screening that fall within certain date ranges. See Chapter 8 for more information.

23
Universal Screening
will see a bar graph under Screening Status that shows the percentage of students who have been tested in each grade. Click Preview to see a summary of the results so far.
Understanding Fall Screening Data
Once the screening period has ended, the STAR Reading and STAR Math Screening Reports display the test data. Take a look at the example below as we explain what the data means.
Notice first that the default setting is for the report to display results for a single grade, in this case, grade 5. This is so you can compare students who are at the same point in school and do grade-level planning.
The fall Screening Report helps you make or confirm
plans for allocating resources.The default
benchmark is the 40th percentile.
If administrators edit the benchmarks and cut
scores, those numbers will be reflected on Screening Reports. See Chapter 2 for
more information.
Examples of Screening Reports with STAR Math data are in the appendix.

Getting the Most out of STAR Reading Enterprise and STAR Math Enterprise
24
Next notice the line that extends horizontally across the graph. This is the benchmark—the lowest level of performance that is considered acceptable. As explained in Chapter 2, you have two or three options for a benchmark: school, district, and, if we have done a linking study, state. In this example, the benchmark is the 40th percentile, which is what we provide as a district benchmark. Ideally, 80 percent of students will be at or above the benchmark.Now look at the colored bars on the graph. These categorize students in relation to the benchmark. Basically, they show you visually what proportion of students in a grade are doing okay—that is, are at or above the benchmark—and what proportion are not doing okay. The “not okay’s” are further categorized by urgency of need. In this case, the categories are titled “On Watch,” “Intervention,” and “Urgent Intervention.”
Students are placed in these categories using what are called cut scores. Cut scores are simply a set a numbers intended to help you identify students you may need to be concerned about. Other professions have similar sets of numbers. For example, it’s commonly accepted that an oral temperature of 98.6 is “normal” and a temperature over 101 in an adult is cause for concern. These cut scores are guidelines that help doctors make health decisions. For example, if you have a fever, your doctor will likely decide to gather more information about your condition. Similarly, our cut scores help you make educational decisions.
The cut scores on the Screening Report are scaled scores that correspond to percentiles. In this example, the district is using the settings provided by the software, which reflect widely accepted national recommendations. (If your Screening Report shows different category names, colors, and/or cut scores, it is because an administrator has edited them. See Chapter 2 for more information.) The settings provided by the software define proficiency categories in the following way:
The table below the graph on the Screening Report shows the number and percentage of students who fall into each of these categories. In the example on page 23, only 59 percent of students are at or above benchmark, far fewer than the 80 percent that is considered ideal. When a substantial number of students are performing below grade level, it usually indicates there is a problem with general classroom instruction. We’ll talk about how to respond to data like this in the next section.
Another way to analyze the data on the Screening Report is to look at where students are in relation to the benchmark. For example, let’s suppose 75 percent of the students in a grade are at or above benchmark but the block of green that represents them is close to the benchmark and fairly flat. (See the example on the next page.) This tells you that
Viewing Scores on Tests Taken Outside of Screening Periods
The STAR Reading and STAR Math Summary Reports are good sources of data outside a screening period. They list a scaled score, percentile rank, and other specialized scores for each student in a class for the most recent test taken within a specified period.

25
Universal Screening
students are barely making it over the benchmark line and you need to pay attention to your core instructional program, and possibly strengthen it, to accelerate growth for these students. Similarly, if the block of blue representing on-watch students is close to the benchmark and also fairly flat, you know you have many students with the potential to reach benchmark.
The report’s additional pages list the students who fall into each category. Students needing urgent intervention—with the lowest scaled scores—are listed first.If you have entered student characteristics in the software, such as free lunch, Title I, Limited English Proficiency, or Gifted/Talented, you can run a Screening Report for just those students within a grade. You can then analyze the distribution of scores for students sharing that characteristic and compare their data to that of the grade as a whole.
Many students are barely over the benchmark, which indicates
weakness in core instruction.
The report’s additional pages list the students who
fall into each category.
Getting the Most out of STAR Reading Enterprise and STAR Math Enterprise
26
Acting on Fall Screening Data
Suppose you go to the doctor with an aching foot. He orders x-rays, which reveal a stress fracture. The doctor looks over the results and then … does nothing. What would you do? Switch doctors! Tests are supposed to precede action.
The same principle holds true in education. Being a data-driven school doesn’t mean collecting data, it means acting on data. Here are some guidelines for acting on fall screening data.
Assess the overall situation schoolwide. If you are an administrator, review the Screening Report for each grade in your school and consider the following questions.
lowest category?
Are most of those students barely meeting the benchmark or is there a good distribution of scores?
curriculum?
If you screened students the previous spring, you probably already raised these questions. In this case, compare the spring scores to the new fall ones. Did students lose ground over the summer? Does that affect any plans you made for allocating resources or training teachers?
Solve staffing and scheduling issues. If you screened students the previous spring, you likely made plans for staffing and scheduling as well. But even if fall is your first opportunity to screen with STAR assessments, you can still do these tasks. Review the Screening Report for each grade and consider the intervention programs you already have in place or have planned to implement. Will they be sufficient to meet student needs? This is a good time to review the school schedule as well. Must you alter it to make room for additional intervention programs? (See page 29 for scheduling suggestions.)
Assess achievement within the grade. The STAR assessment scores you see at the beginning of the year provide a look into the future—if you do nothing, the students at or above benchmark will likely meet proficiency standards by spring and the students below benchmark will not. Your goal, therefore, is to do something to move more students to proficiency. However, the data on the Screening Report does not tell you exactly what to do. For that you need a team of people who will analyze, prioritize, plan, and make decisions. As we mentioned in Chapter 2, we recommend that schools establish data teams at each grade level to do this work.
It’s best if grade-level data teams meet within a week after testing. Examine the general level of achievement for the grade and the distribution of scores. How many students

27
Universal Screening
are beginning the year “at grade level”—at or above the benchmark level? Are many students hovering just below the benchmark? Will you need to make adjustments within the core instructional program to ensure that those students reach proficiency by the end of the year? Do staff members need more training in order to implement the core instructional program more effectively?
Set measurable grade-level goals and make plans for meeting them. Decide where you would like your grade to be by the next screening date. Make those goals measurable. For example, you might aim to have the percentage of students at or above benchmark increase from 59 percent to 65 percent by the winter screening date in January. Decide which strategies you will use for general classroom instruction to meet that goal. Also consider how you will make sure those strategies are implemented well. You might, for example, plan to do peer modeling and coaching, ask advice of a literacy coach, and/or set up periodic meetings to talk about how the strategies are working and troubleshoot as needed.
Also determine how many students in the lowest categories you can serve and how. What resources are available—reading specialists, paraprofessionals, intervention materials—and how will you use them? In the next chapter, we explain how to set individual progress goals for these students.
Plan interventions for students performing below the benchmark. Make sure you have the information you need to make good decisions. This means taking into account more than a single test score. Assemble additional assessment data, anecdotal records, and examples of daily work. Begin with the students in the lowest category, which in our example is “Urgent Intervention.” These students are represented by the red bars on the first page of the Screening Report and are listed by name on the following pages. They will likely continue to struggle and drop farther and farther below benchmark if they don’t receive help. Decide which of these students will be best served by an intervention within the regular classroom and which need more intense intervention through a separate program. If you are working within an RTI framework, remember that when a student scores in the lowest category, it does not automatically mean the student should be in a Tier 3 intervention setting. Rather, it indicates that the student needs immediate attention.
Next, consider students in the next highest category—in this example, those needing “intervention,” who are represented by yellow. What kind of support is best for them? They, too, are unlikely to reach benchmark unless action is taken.
As you plan interventions for these students, consider the following questions:
Working Without a Team
If your school does not have grade-level data teams, you can still use the Screening Report—and all STAR assessment reports—effectively. Follow the same steps outlined here: analyze student performance within a grade, identify needs, plan how to meet those needs, allocate resources across and within grades, and select students for intervention.

Getting the Most out of STAR Reading Enterprise and STAR Math Enterprise
28
the way it was intended and for a sufficient amount of time?
the best next step for this student?
A good principle to keep in mind is that as a student’s need intensifies and becomes more urgent, he or she will require attention from someone with greater expertise. Just as patients with problems that are difficult to solve are referred to health specialists so must students with persistent or severe problems receive instruction from expert educators.
Finally, consider the students just below benchmark. In our example, they are represented by blue and designated “on watch.” Which of these are you worried about? Can they be supported through the core curriculum? Is further differentiation required? Some students may be fine without supplemental instruction and others will not be. Of those, some may need just a small tweak in their instruction to reach benchmark. Decide how you will monitor those students so that you can intervene if you later discover they are not making progress.
As you make these decisions, bear in mind that intervention can take many forms, including:
Accelerated Math.
instructional reading and math programs include specialized materials, strategies, and assessments for both low-achieving and high-achieving students. The STAR Enterprise Instructional Planning Report indicates which skills groups of students are ready to learn next. (See Chapter 5 for more information.)
instruction delivered within the regular classroom. Renaissance Learning’s Successful Reader and Accelerated Math for Intervention are examples of specially designed intervention programs.
Also be aware that the intent of the Screening Report is not to earmark students for specific programs such as special education. Rather, the report is designed to alert you to students who need attention. When the data on an individual student suggests a complex or unusual problem, many schools schedule a separate meeting that takes a more comprehensive look at the student’s learning history and capabilities.
STAR Assessments and English Language Learners
If you administer STAR assessments to ELLs, be aware that their test performance is influenced by their English language proficiency. When they answer an item incorrectly on STAR Reading, for example, it may be because of a lack of knowledge of English vocabulary rather than a deficiency in reading ability. And even though STAR Math contains minimal text, some words, like “longest,” may be unfamiliar to ELLs at lower proficiency levels. For these reasons, scaled scores on STAR assessments can be misleading. If you do use STAR assessments to identify ELLs needing intervention, be sure to consider whether their primary need is for more intense instruction in reading or math, or in English language development.
29
Universal Screening
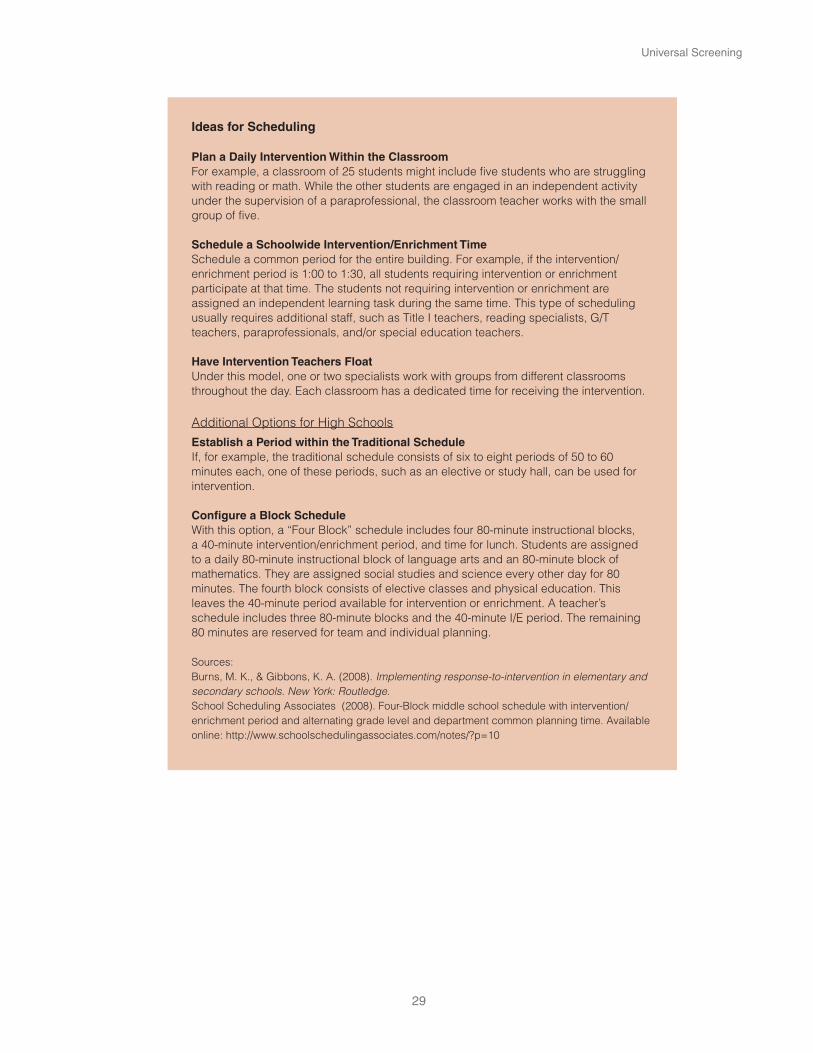
Ideas for Scheduling
Plan a Daily Intervention Within the ClassroomFor example, a classroom of 25 students might include five students who are struggling with reading or math. While the other students are engaged in an independent activity under the supervision of a paraprofessional, the classroom teacher works with the small group of five.
Schedule a Schoolwide Intervention/Enrichment TimeSchedule a common period for the entire building. For example, if the intervention/enrichment period is 1:00 to 1:30, all students requiring intervention or enrichment participate at that time. The students not requiring intervention or enrichment are assigned an independent learning task during the same time. This type of scheduling usually requires additional staff, such as Title I teachers, reading specialists, G/T teachers, paraprofessionals, and/or special education teachers.
Have Intervention Teachers FloatUnder this model, one or two specialists work with groups from different classrooms throughout the day. Each classroom has a dedicated time for receiving the intervention.
Additional Options for High Schools
Establish a Period within the Traditional ScheduleIf, for example, the traditional schedule consists of six to eight periods of 50 to 60 minutes each, one of these periods, such as an elective or study hall, can be used for intervention.
Configure a Block ScheduleWith this option, a “Four Block” schedule includes four 80-minute instructional blocks, a 40-minute intervention/enrichment period, and time for lunch. Students are assigned to a daily 80-minute instructional block of language arts and an 80-minute block of mathematics. They are assigned social studies and science every other day for 80 minutes. The fourth block consists of elective classes and physical education. This leaves the 40-minute period available for intervention or enrichment. A teacher’s schedule includes three 80-minute blocks and the 40-minute I/E period. The remaining 80 minutes are reserved for team and individual planning.
Sources:Burns, M. K., & Gibbons, K. A. (2008). Implementing response-to-intervention in elementary and secondary schools. New York: Routledge.School Scheduling Associates (2008). Four-Block middle school schedule with intervention/enrichment period and alternating grade level and department common planning time. Available online: http://www.schoolschedulingassociates.com/notes/?p=10

Getting the Most out of STAR Reading Enterprise and STAR Math Enterprise
30
Communicating with Parents
No matter how you use fall data, remember that parents must be involved in decisions concerning their children. Important communication points are (1) after each screening period and (2) when instruction is significantly differentiated, either within the regular classroom or through an intervention program. As an intervention proceeds, inform parents of their child’s progress.
To help you communicate with parents, STAR Enterprise includes Parent Reports that summarize a student’s test results, explain what the scores mean, and describe what a student needs for optimal reading or math growth. (Instructions for printing a Parent Report are in the appendix.) An example of a letter than can be sent home to inform parents of instructional modifications within an RTI program is also in the appendix. If you are using Accelerated Reader, Accelerated Math, or Math Facts in a Flash, and parents have Internet access, set up Renaissance Home Connect so that parents have access to progress-monitoring data. Encourage them to log in regularly to view how their child is doing with independent reading and math practice.
Parents with Internet access can
view reading and math practice data.
The Parent Report can be
printed in English or Spanish
31
Universal Screening
Purposes for Winter Universal Screening
Once the school year is underway, it’s essential that you keep an eye on all students, not just those in intervention. A good time for pulling back and taking this larger view is after students have taken a mid-year STAR Enterprise assessment. Are the students who are performing at or above benchmark continuing to succeed? Are the students below benchmark moving upwards? This is the time to evaluate your core instructional program and intervention strategies, move students in or out of intervention, and make programmatic changes that will accelerate academic growth for all students.
Assessing the Overall Situation Mid-Year
After all students have been tested, print a Screening Report for each grade. As in the fall, we recommend that the data be reviewed on a couple of levels. Administrators need to look at the data for every grade to monitor growth. Mid-year is a better predictor of student outcomes than fall, yet early enough to affect them. Mid-year is also the time to reassess resource allocation. Do some grades need more resources—staff and materials—than others?
In addition, grade-level data teams must get together, analyze the data for their grade, review progress toward grade-level goals, and make instructional decisions about individual students. As in the fall, meeting as a team promotes a shared sense of responsibility and also facilitates the movement of students in and out of intervention.
Review the categories. Compare the winter Screening Report to the Screening Report you printed in the fall. Scan the distribution of students by looking at the blocks of color, and then review the totals below the graph. Have the lowest categories grown smaller? Have students just below benchmark moved closer to it? Has the category showing students at or above benchmark expanded? How close are you to having at least 80 percent of students in this category?
Take a look, for example, at the Screening Reports on the next page. If you compare the fall report to the winter report on the left, you’ll see that the On Watch, Intervention, and Urgent Intervention categories (shown in blue, yellow, and red) have all shrunk, while the At/Above Benchmark category (shown in green) has expanded. This indicates that over the last few months learning has accelerated for students in this grade.
Now imagine a different scenario, such as that shown in the winter Screening Report on the right. This data does not look so positive. Fewer students are at or above benchmark. As the numbers below the graph tell us, the percentage has decreased from 59 percent to 55 percent. At the same time, the percentage of students in the On Watch category has swelled—from 17 percent to 20 percent, and the percentage of students in the Intervention category has increased from 20 percent to 21 percent. The percentage of students in the Urgent Intervention category has remained the same. These numbers indicate that the needs of students hovering near the benchmark are not being met and the lowest performing students are continuing to struggle.
Ask the hard questions. If the number of students at or above benchmark has dropped between fall and winter, you need to ask why. Something is happening—or not happening—that is causing student growth to slow down. This signals a problem in the core instructional program. Are classroom teachers working with research-
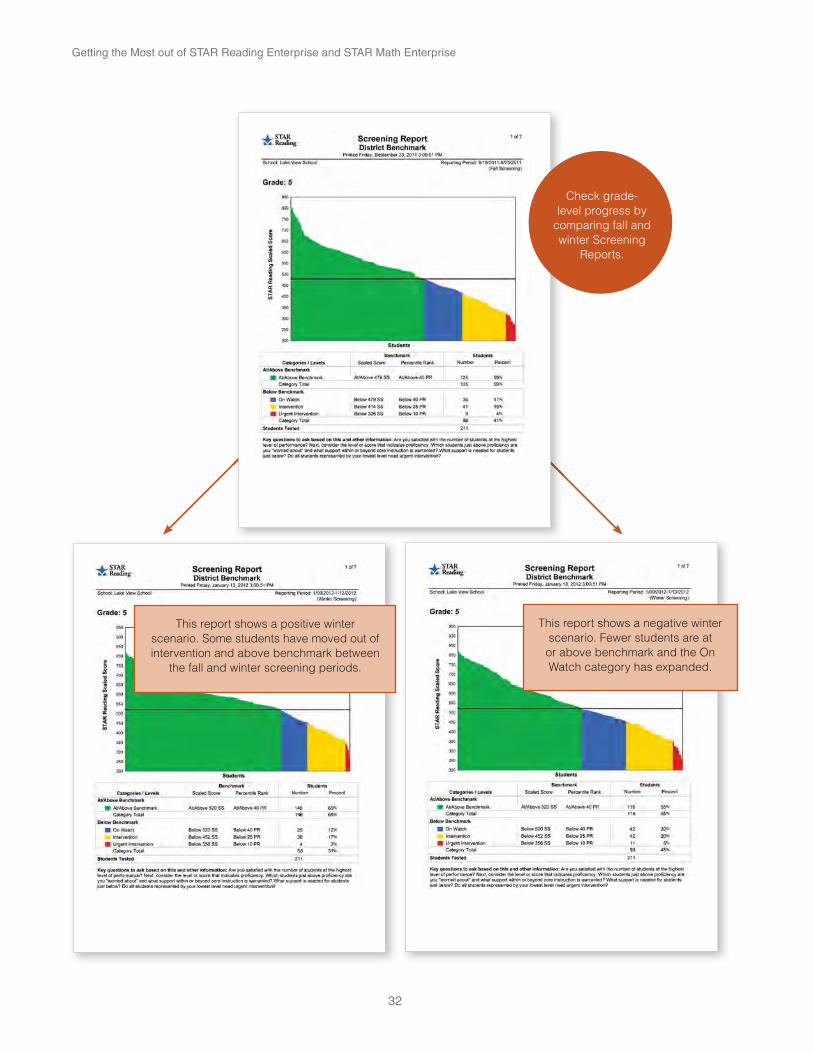
Getting the Most out of STAR Reading Enterprise and STAR Math Enterprise
32
This report shows a negative winter scenario. Fewer students are at or above benchmark and the On Watch category has expanded.
This report shows a positive winter scenario. Some students have moved out of intervention and above benchmark between
the fall and winter screening periods.
Check grade-level progress by
comparing fall and winter Screening
Reports.

33
Universal Screening
based materials? Are they employing sound instructional practices? Is classroom instruction sufficiently differentiated to meet all students’ needs? Do teachers need guidance and support in the form of professional development to implement the core program effectively? Since students just below benchmark usually remain in the regular classroom, the same questions must be asked when they move downwards. If students aren’t moving out of the lowest categories, and certainly if their numbers are growing, take a thorough look at your intervention programs. Why aren’t students responding?
Conversely, if you are seeing movement upwards—out of the lowest categories to benchmark and above—it’s worthwhile identifying what you are doing right. Take the time to consider whether teachers have what they need to maintain these gains.
Assessing Grade-Level Needs
If you are an administrator or someone else who has the authority to allocate resources within your school, compare the needs of different grades. Are some grades now in more need than others? Should you shift resources from one grade to another? Suppose, for example, three new students needing reading intervention enrolled in the seventh grade. In addition, a few other seventh-grade students moved from just below benchmark to a lower category. At the same time, a number of eighth-grade students who were getting one-on-one help from a reading specialist have shown progress and may now be supported within the regular classroom. In this case, it might make sense to reassign the reading specialist to the seventh grade.
Assessing Individual Needs
In addition to evaluating the progress of a grade as a whole, grade-level data teams must take a close look at individuals. At mid-year it’s especially important to see what has happened to students who were at or near the cut points in the fall. Because of the standard error of measurement, it’s easy for these students to “jump” from one category to another. What does the test data look like now for students who were at or near the benchmark cut point in the fall? Are they solidly above the benchmark or have they fallen below it? What does the data look like for those who were at or near the cut point for intervention? Are they now above the cut point or have they fallen below it?
Before making decisions about students, gather multiple sources of information, such as diagnostic test data, anecdotal records, and examples of daily work. Who is ready to move out of intervention? Who needs to stay in intervention to make further gains? Whom did you miss during fall screening? Can the needs of students not making sufficient progress be met by differentiating instruction within the regular classroom? If that strategy has already been tried and proved unsuccessful, is it appropriate to place the students in a supplementary intervention program? If students already in intervention are not making progress, decide if they need more intensive intervention and how that will be delivered. See Chapter 4 for guidelines on how to make these decisions and how to use the Progress Monitoring Report to review a student’s intervention history.
High-Achievers
Keep your eye on high-achieving students as well as struggling students. Check to see if their skills are advancing and evaluate whether any special programming or differentiation provided for them has been successful.
Getting the Most out of STAR Reading Enterprise and STAR Math Enterprise
34
Making Concrete Plans After Winter Screening
Once you have identified problems, decide how you will correct them. How can you provide more effective core instruction? What changes can you make now to accelerate growth throughout the rest of the school year? What goals can you set for improvement?For instance, in the scenario we described on page 31, in which students lost ground, the fifth-grade team decided to take a close look at what they were doing within the regular classroom. In this case, they were using Accelerated Reader to support their reading practice program for all students. Because they had recently attended a series of training sessions, they had a new understanding of AR best practices. By looking at the data on AR reports, they could see their students did not comprehend books well enough to make significant gains. They also were not getting a sufficient amount of practice. As a team, they made a list of best practices they needed to implement and agreed to review AR data regularly. Finally, they brainstormed ideas for maintaining quiet, efficient classroom environments so that students would be able to spend more time reading without distractions.After establishing this plan, the fifth-grade team set a goal to reclaim the ground lost in the first half of the year and go even farther—to have 65 percent of students at or above benchmark by the end of the school year and to reduce the percentage of students in the Intervention and Urgent Intervention categories to below 20 percent.
Mid-Year Screening at the Class or Group Level
The STAR Screening Report can be printed for a class or a group as well as for an entire grade within a school. Doing so shows you the distribution of students within the class or group across all categories. If you are an administrator, for example, you might run Screening Reports for specific classes that you are concerned about. If you are a classroom teacher or an intervention teacher, you might view the report for your own class or group. You can then quickly identify students who are struggling, and by comparing the winter Screening Report to the fall Screening Report, you can see if students are moving above benchmark.
Mid-Year Screening by Characteristic
The default setting for reports is to show all demographics. However, if you have identified students by ethnicity, language, Title I, gifted/talented, or another characteristic, you can run a Screening Report that includes just the students who share a characteristic within a grade. For example, you could view a Screening Report for each grade and see how free-lunch students are distributed across the categories. By comparing fall and winter reports, you can also see if they are progressing to benchmark. Take this opportunity to also look at the relative achievement of different groups of students. For example, is one gender succeeding more than the other? Are students with limited English proficiency significantly behind native speakers? How does this reflect on your core curriculum, and what adjustments must you make to ensure success for all?
Purposes for Spring Universal Screening
The purpose of universal screening in spring is two-fold: it serves as a “post-mortem” for the school year and it helps you pre-plan. As you review three sets of data (fall,
35
Universal Screening
winter, spring), you see how students have performed over the course of the year. With this information, you can determine the effectiveness of your instructional programs and intervention strategies, see if the decisions you made earlier in the year have led to gains, and begin to make data-based plans for the next school year.
Using the Spring Screening Report to Evaluate Your Instructional Program
There are a couple of ways to determine whether the core instructional program in a grade or school is working. The first is to look at how many students are performing at or above benchmark. As mentioned earlier, 80 percent is generally considered ideal, and if you have a high-performing school, it makes sense to expect your student population to hit that number.
For some schools, however—schools that have historically been low performing or that have a transient population and/or large numbers of struggling students—this may not be a reasonable indicator. In these cases, some experts say that having 80 percent of students in the above-benchmark category and the one just below it is a sensible goal. Also look at growth over multiple years. If you are moving more students to benchmark from year to year, that’s a sign that core instruction is not only working but improving.
Additional indicators of a healthy core instructional program are:
students at or above benchmark is increasing or, at minimum, holding steady.
All grades and almost all classes show achievement gains from fall to winter to spring.
ethnicity, language, socio-economic status—are achieving.
Let’s take a look at our fifth-grade example. As we noted earlier in this chapter, the winter Screening Report showed that the percentage of students at or above benchmark had dropped from 59 percent to 55 percent between September and January. Teachers then set a goal to have 65 percent of their students at or above benchmark by the end of the year. The spring Screening Report on the next page shows that they met this goal. This indicates that they did indeed strengthen their core instructional program.
Viewing Fall/Winter/Spring Reports
Save copies of reports that you print for each screening period or reprint the reports from the software. See the appendix for reprinting instructions.
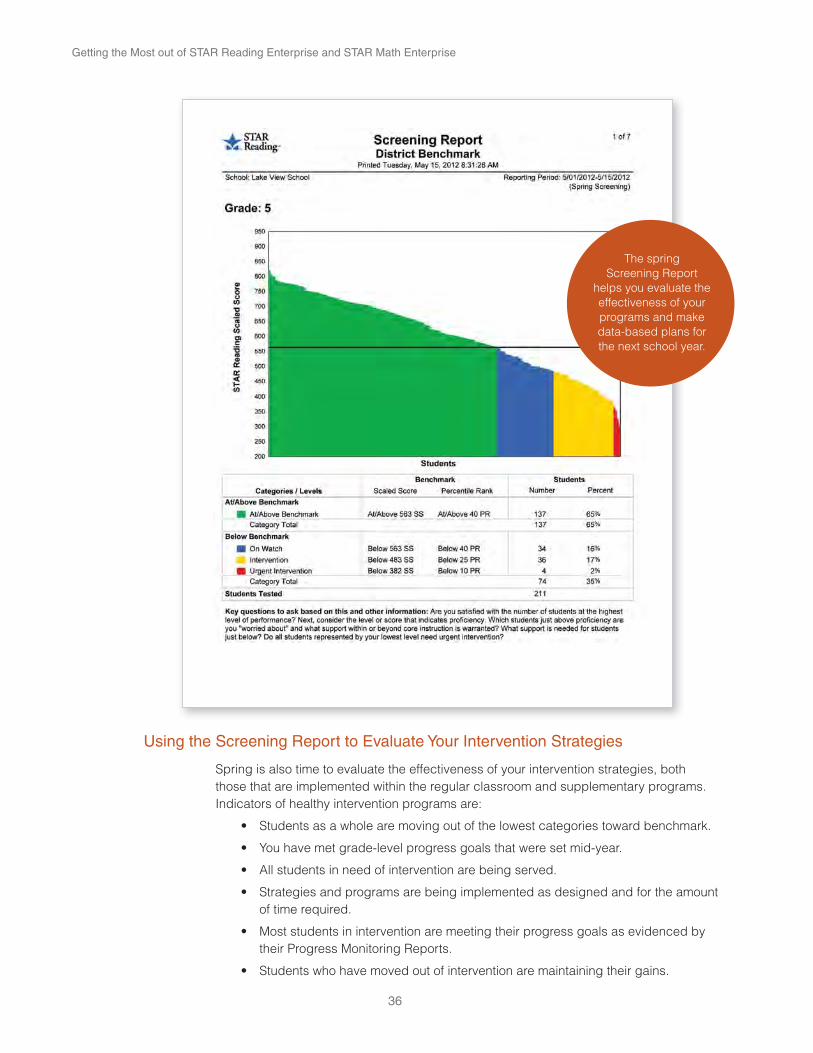
Getting the Most out of STAR Reading Enterprise and STAR Math Enterprise
36
Using the Screening Report to Evaluate Your Intervention Strategies
Spring is also time to evaluate the effectiveness of your intervention strategies, both those that are implemented within the regular classroom and supplementary programs. Indicators of healthy intervention programs are:
of time required.
their Progress Monitoring Reports.
The spring Screening Report
helps you evaluate the effectiveness of your programs and make data-based plans for the next school year.

37
Universal Screening
Taking another look at our fifth-grade example on the opposite page, we see that this team of teachers also met their mid-year goal for struggling students by reducing the number of students in the Intervention and Urgent Intervention categories from 25 percent to 19 percent. They were happy to have reversed the downward trend they saw at mid-year and see this as evidence that the intervention strategies and programs they had implemented worked well.
Planning for the Next School Year
If the Screening Report shows good results, identify which strategies have worked, both within general classrooms and intervention programs. Figure out how you can continue those strategies and build upon them. Will new teachers be coming into the school? Decide how they can be trained and coached so they, too, can implement the strategies effectively.
Also identify strategies that were not effective. Was the problem with the strategies themselves or were they not implemented well? Decide if you need to improve the implementation of a strategy or abandon it for another.
Spring screening is a good time to hold cross-grade meetings as well. Teachers can then prepare for students who will be entering their classrooms the next fall.
If you are an administrator or someone involved with staffing and purchasing, consider whether you will have sufficient resources in the fall to meet student needs. Will any grades need more staff? Can staff be hired or must you move staff from one grade to another? What materials will you need?
In our example, the fifth-grade teachers, after evaluating how they did during the past year, turned to the students who will be entering their classrooms the following fall. They noticed that this group of students has a fairly high percentage in the On Watch category. Because their improvement plan—implementation of AR best practices— was so effective, they agreed to adhere to it next year. Since they anticipate a new teacher coming in, they decided to pair her with their most skilled AR user so that she can quickly learn and apply these practices, too.
Using STAR Enterprise for Universal Screening in an RTI Program
Many states and districts have adopted an educational approach called Response to Intervention or RTI. The aim of RTI is to give all students high-quality classroom instruction first and to provide increasingly intense, individualized intervention to low-achieving students. Each student’s response to intervention is monitored frequently and adjustments are made based on the response data.
RTI implementations look different in different schools but a tiered model is central. If your school has embraced RTI, it may be represented in general terms by this pyramid.
Inte
nsity
of i
nter
vent
ion
Students move between tiers based on response
Tier 3
Tier 2
Tier 1
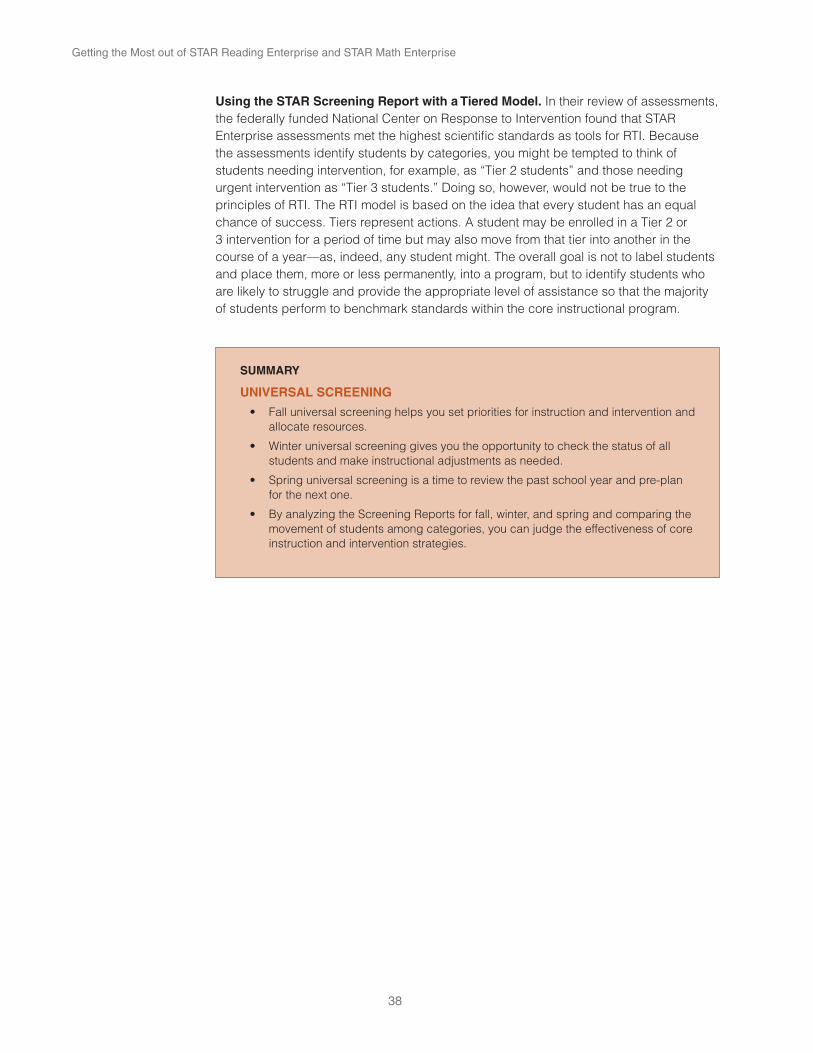
Getting the Most out of STAR Reading Enterprise and STAR Math Enterprise
38
Using the STAR Screening Report with a Tiered Model. In their review of assessments, the federally funded National Center on Response to Intervention found that STAR Enterprise assessments met the highest scientific standards as tools for RTI. Because the assessments identify students by categories, you might be tempted to think of students needing intervention, for example, as “Tier 2 students” and those needing urgent intervention as “Tier 3 students.” Doing so, however, would not be true to the principles of RTI. The RTI model is based on the idea that every student has an equal chance of success. Tiers represent actions. A student may be enrolled in a Tier 2 or 3 intervention for a period of time but may also move from that tier into another in the course of a year—as, indeed, any student might. The overall goal is not to label students and place them, more or less permanently, into a program, but to identify students who are likely to struggle and provide the appropriate level of assistance so that the majority of students perform to benchmark standards within the core instructional program.
SUMMARY
UNIVERSAL SCREENING
allocate resources.
students and make instructional adjustments as needed.
for the next one.
movement of students among categories, you can judge the effectiveness of core instruction and intervention strategies.

39
rStarting an Intervention, Setting Intervention Goals, and Progress Monitoring
After you have screened students, identified those in need, and placed them in an appropriate intervention, the next task is to set a data-based goal. Of course, the ultimate goal is to reach or exceed benchmark. This, however, can take time. Therefore STAR Enterprise software enables teachers to set intermediate goals for students for a specified intervention period. For example, if a student is currently performing in the 15th percentile, the goal might be to move the student to the 20th percentile by the end of a semester. The advantage of setting intermediate goals is that you can more quickly see if a student is making progress toward the long-term goal.
If you are an intervention teacher, you are most likely responsible for setting goals. To help with this task, we provide a goal-setting tool within the software that is referred to as a “wizard.” It records the important information about an intervention and helps you calculate goals for individual students based on their current reading status. The software then plots a student’s progress and projects whether or not he or she will meet the goal. Thus you can judge the effectiveness of an intervention.
Setting Up an Intervention and Goal
STAR assessments have powerful capabilities, but to take advantage of them you must supply the software with the right information at the right time. Think of it the way you would a scientific experiment. Let’s suppose, for example, your doctor discovers you have high cholesterol. The first intervention in a situation like this is a heart-healthy diet and regular exercise. In order to measure the effects of this intervention, your doctor must have baseline data—that is, a measure of your cholesterol level at the start of the intervention. He then sets expectations for a certain period of time. For example, he might say your cholesterol level needs to drop a specific amount by the end of six months. You go back to his office after that six-month period, and he tests you again. He compares the data on your baseline test to your most recent test and evaluates whether the intervention regimen of diet and exercise has been effective. Then he decides what to do next.
To truly measure the effectiveness of a reading or math intervention, you must follow a similar procedure. Take a look at the illustration of the software wizard on the next page. The numbers correspond to the steps we describe below.
Creating Intervention Groups
If a number of students are receiving the same intervention, it’s useful to create a special “group” within the software and assign the intervention teacher to it. This gives the intervention teacher access to the students’ test data. For example, let’s suppose Joe Brown is in Mrs. Smith’s seventh-grade homeroom, but for the first semester he will also be receiving supplementary math instruction in a small group with the math specialist. Joe’s “official” placement is in Mrs. Smith’s “class,” and that is how the district’s technology manager enrolled him in the software. But since the math specialist also needs access to Joe’s test data, she creates a “group” in STAR Math Enterprise that includes Joe and the other students with whom she will be working. The appendix has instructions for creating and managing groups.

Getting the Most out of STAR Reading Enterprise and STAR Math Enterprise
40
Step 1: Name the intervention and enter an end date. Just as a doctor describes an intervention in your medical record so must you describe a student’s intervention in the software. In the illustration above, next to Intervention Name is a spot where you enter the intervention name as you’d like it to appear on reports. This could be the name of a specific program such as “Successful Reader” or “Accelerated Math for Intervention,” or it could be a description like “After-school tutoring 30-min. daily.”
The end date can be the end of a marking period, semester, or school year, or any other period of time. Just be sure to allow enough time for the intervention to work. Experts recommend no fewer than eight weeks. (Some states and districts specify ten or twelve weeks.) If you are uncertain about how much time a student needs to meet a goal, make your best guess. You can change the goal end date at any point.
Step 2: Select a starting test. If the student has taken more than one STAR assessment before you set up an intervention in the software, you can select an anchor test. It’s important that you administer a test close to the actual start of the intervention so you can choose this as the anchor test. Doing so has these advantages:
That means once the intervention is underway you will be able to measure the student’s response to it more accurately.
what kind of growth you can expect the student to achieve. We talk more about this in Step 4.
Examples of the STAR Reading goal-setting wizard and Progress Monitoring Report are in the appendix.
q
w
e
r
t
The numbers refer to the steps described in this
chapter for setting an intervention.
Click to view this document, which will help you understand
and navigate this screen.
41
Starting an Intervention, Setting Intervention Goals, and Progress Monitoring
Step 3: Review the reference points. If you select a starting date that is different from the initial one shown, the software refreshes reference data designed to help you set a goal for the student. In this example, Mark Boyle tested on 9/14/11 and achieved a scaled score of 574, which placed him in the 15th percentile. The first reference point tells you how fast the student’s ability needs to grow for him to hold his ground in relation to his peers. The second tells you the growth rate needed to reach benchmark by the end of the school year. In this case, if Mark sustains a growth rate of 1.2 scaled scores per week he will remain in the 15th percentile at the end of the school year. To reach benchmark—in this case, the 40th percentile—he needs a growth rate of 3.1 scaled scores per week. In most cases, the goal you set will be between these two points.
Step 4: Select the goal type. When your doctor sets a goal for lowering your cholesterol, he doesn’t draw a number out of a hat. He bases the goal on what research studies say can be expected. We provide similar information based on data we have collected on the growth rates of millions of students across the country.
Underneath “Select a goal type” in our example on the opposite page, you’ll see two choices: Moderate and Ambitious. If you select “Moderate” and click Calculate Goal at the bottom of the screen, the software displays the growth rate achieved by 50 percent of students with a similar percentile rank as the student for whom you are setting goals. If you select “Ambitious,” the software displays the growth rate achieved by 25 percent of students with a similar percentile rank. Also displayed are the scaled scores and percentiles that would result from these growth rates.
In this example, a moderate goal for Mark is a growth rate of 2.5 scaled scores per week. An ambitious growth rate is 4.0 scaled scores per week. If Mark meets the moderate goal, his scaled score will be 620 and he will be in the 22th percentile by the end of the intervention period. If he meets the ambitious goal, his scaled score will rise to 647 and he will be in the 31st percentile.
If neither of these goals seems right, you can define a custom goal by entering a growth rate in scaled scores per week or by entering the scaled score or percentile rank you want the student to achieve by the end of the intervention period. You could set a goal between the moderate and ambitious options, for example, if you thought that was more appropriate. Or if a student is within reach of the benchmark, you might want to set the goal at the benchmark level.
How do you know which goal is best? Consider what you know about the student and the intervention. Your doctor, for example, when setting your cholesterol goal would keep in mind how compliant you are. Are you motivated to change your eating and exercise habits? Will the changes be fairly easy for you to incorporate? Do you have a supportive family? If yes, he might set an ambitious goal. If, on the other hand, he were prescribing an experimental drug for which the effects were less well known, he might set a moderate goal. Similarly, think about the following factors when setting reading or math goals:
What do you know about the student? What does his or her educational history indicate about motivation and desire to learn? What was the student’s learning rate up to this point? If a student has been unmotivated and frequently absent from school, or if the student has switched schools often, you

Getting the Most out of STAR Reading Enterprise and STAR Math Enterprise
42
might conclude that a moderate goal is most realistic. Conversely, you might decide that since the student’s needs are urgent, an ambitious goal is essential.
How intensive is the intervention you are choosing for this student? For how much time per day will the student receive additional instruction? Is the student part of a small group or large group or will the student get individual help? Generally speaking, the more individualized attention a student receives the greater the potential for large gains.
Have you implemented this intervention with other students? How did those students respond? Is it a research-based intervention with proven effectiveness? Will you be able to implement it the way it was intended? If you are using materials, strategies, or approaches that you know well and that have worked in the past, you may feel more confident about setting ambitious goals.
Step 5: Save the information. Finally, don’t forget to click Save when you are satisfied with your choices.
In our example, Mark’s school only recently acquired STAR Math. After reviewing the Screening Report in September, the fifth-grade team realized that they did not have enough resources to meet the needs of all the students below benchmark. They decided to take interim steps while they developed intervention strategies, acquired materials, and arranged schedules. Ms. Ruhland, Mark’s math teacher, decided to give extra attention to a small group of low-performing students, including Mark, during her regular math class. She will meet with the group for 20 minutes a day, five times a week, to reteach objectives causing them difficulty. During this time her teaching aide will work with the rest of the class. Because Mark is so far behind and because Ms. Ruhland thinks she has a strong approach for helping her low-performing students, she sets an ambitious goal for Mark in the software. We show you the results of this plan a little later in this chapter.
Goals for ELLs and Students with Special Needs
The reference data and goal types in the goal-setting wizard were calculated based on a heterogeneous sample of students. They may not be applicable to English language learners and students with learning or other disabilities. Make your best estimate when setting goals for these students. After a few years of experience, you will be better able to define moderate and ambitious goals for them.
Progress Monitoring
STAR Reading and STAR Math allow you to measure achievement as often as weekly. The Student Progress Monitoring Report then displays the data in an easy-to-read fashion. The purpose of this report is to help you determine if a student is responding to an intervention. If the student is responding, decide if he or she is ready to move out or should continue. If the student is not responding, schedule a problem-solving meeting to figure out why and decide what to do next. Generally speaking, many experts advise giving an intervention at least eight weeks to work. If you change the intervention, you can then edit the software so it can keep track of the student’s progress in the new intervention.
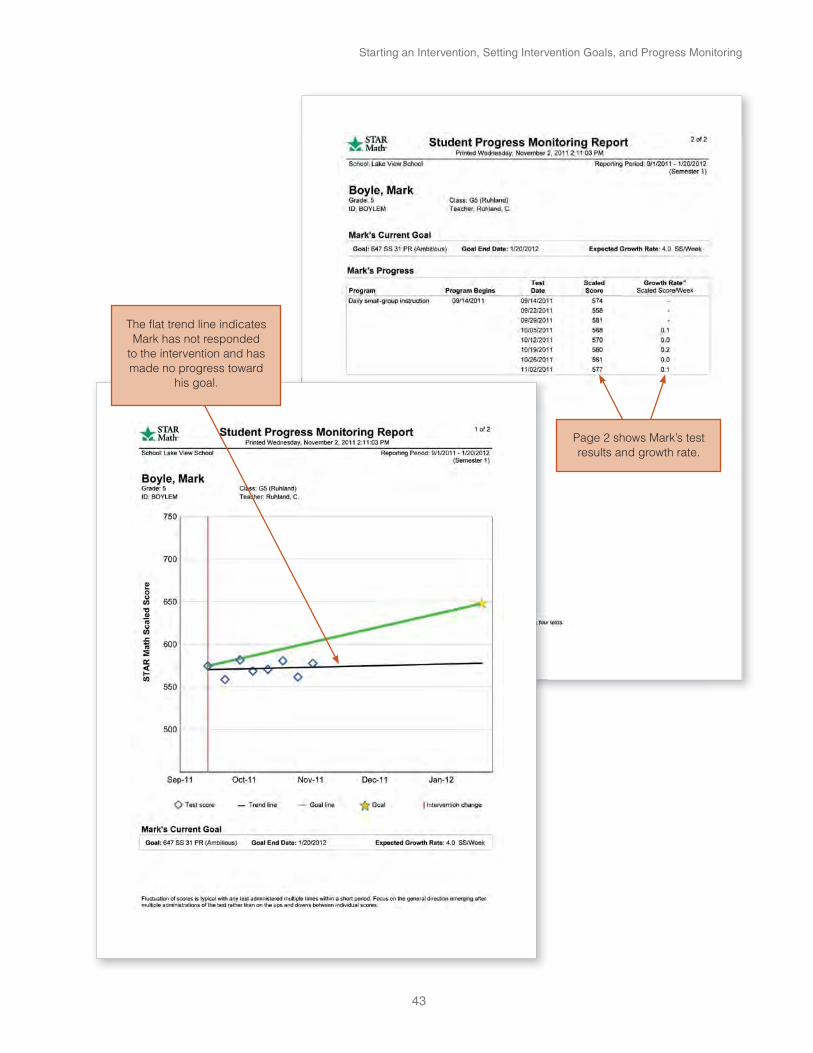
43
Starting an Intervention, Setting Intervention Goals, and Progress Monitoring
The flat trend line indicates Mark has not responded
to the intervention and has made no progress toward
his goal.
Page 2 shows Mark’s test results and growth rate.
Getting the Most out of STAR Reading Enterprise and STAR Math Enterprise
44
Interpreting the Student Progress Monitoring ReportThe first page of the Student Progress Monitoring Report displays progress data graphically for an individual student. If you look at the example on page 43, you’ll see blue diamonds scattered across the graph. These represent each test the student has taken. (Months of the year are indicated along the horizontal axis.) Results are given in scaled scores. Remember, scaled scores are like inches or pounds and are the best way to show absolute growth over time. For example, if a child’s height changes from 51 inches to 53 inches, you know he has grown. If a student’s scaled score on a STAR assessment changes from 350 to 375, you know his ability has grown.
Now take a look at the vertical red line on the report. This marks the starting test for the intervention. You’ll see in this example that Mark’s STAR Math score at the start of the intervention was 574. Now notice the gold star on the right side of the graph. This represents the goal that Mark’s teacher, Ms. Ruhland, entered in the software. In this case, the goal was for Mark to grow 4.0 scaled scores per week. The green line on the report connects Mark’s STAR Math score at the beginning of the intervention to his goal. We call this green line the goal line, and it represents the achievement path Ms. Ruhland wants to see Mark take during the intervention.
Next notice the black line. This is called the trend line. The software looks at a student’s test results and projects the student’s growth into the future. It displays this line to show how the student’s progress is trending. By comparing the goal line to the trend line, you can see at a glance if a student is on track to reach his or her goal. A trend line appears after four tests, beginning with the start of an intervention. Statistically, this is the minimum number of tests needed to report a trend with confidence. In this case, Mark’s STAR scores have gone up and down (see sidebar) but his trend line is below his goal line, which indicates he is not making sufficient progress to meet the goal Ms. Ruhland set for him. In fact, his trend line is flat, which suggests he has not made any progress.
The second page of the report shows the student’s current goal and actual test data. A growth rate is reported after four tests. In this example, Mark’s growth rate is a scant 0.1 scaled scores per week.
Once displayed, the trend line typically changes with every subsequent test. If you’ve ever been on a savings plan, you may have experienced this phenomenon. Suppose, for example, you start saving in September and set a goal to put aside a thousand dollars by June at a rate of $25 a week. You stick to your plan just fine for the first few months. The exact amount actually varies a bit from week to week, but since you are consistently adding to your
Why STAR Scores Go Up and Down
When a test is administered frequently, an individual’s score often fluctuates. This may be due to the test’s standard error of measurement; student anxiety, illness, motivation, or level of attention; or a statistical phenomenon called regression to the mean. Regression to the mean is the tendency of those with the highest scores on an initial test to score closer to average on a second test and those with the lowest scores to score closer to average—and therefore higher—on the second test. These factors do not make a test unreliable or invalid. But because some fluctuation is likely, a trend line is a better indicator of growth and projected growth than scores from individual tests.

45
Starting an Intervention, Setting Intervention Goals, and Progress Monitoring
savings account the general trend is upward and your average “savings growth rate” is $25.39 per week. Then the holidays come along, and for a number of weeks, you put less than $25 into your piggy bank. Consequently, your growth rate changes—now it only averages $17.62 per week. Your trend line adjusts to reflect that change. It even looks like you won’t meet your savings goal. But after New Year’s Day you get back on track. Your growth rate and trend line adjust once more. A student’s reading or math growth rate and trend line will show similar fluctuations. After each test, the software recalculates these measurements so that you get the best, most current information.
Responding to the Data
STAR data can tell you if a student is responding to intervention, but you must respond to the data in order for it to have value. Schools review data in different ways. In some cases, intervention teachers test students weekly and request problem-solving meetings for individual students whenever there is cause for concern or a reason to change a student’s placement. Other schools hold grade-level meetings every four to eight weeks to examine progress-monitoring data for all students below benchmark. Regardless of your protocol, certain scenarios are likely to emerge.
A student is on track to meet the goal. This, of course, is the best scenario. However, it still raises questions. The first one: Is the student ready to move out of intervention? There is no standard answer to this. You must consider both the student and the student’s problem. Some reading and math problems—specific phonics deficits, for example, or failure to recall certain math facts—might be remedied quickly with focused instruction. Other problems, like comprehension deficits or a conceptual misunderstanding of multiplication, can take a considerable amount of time to truly be overcome. The trend line only indicates if a student is on track to meet a goal. This means the intervention has been successful so far. What the trend line can’t tell you is whether or not the student needs to stay in the intervention in order to actually meet the goal. That’s a matter of professional judgment.
A student is not on track to meet the goal. This situation also calls for analysis. Sometimes when students in intervention do not improve we conclude they must need more intensive intervention or special education. This can be true, but other factors must be considered.
designed and for the recommended amount of time? For example, suppose an intervention program calls for 60 minutes of daily supplementary instruction but your school only schedules it for three times a week. If a student doesn’t make progress in that situation, it may not be because of something going on with the student but because of what isn’t going on in the intervention program. One way to determine if a weak implementation is at fault is to look for patterns in the data. If a number of students in an intervention are not making progress, that’s a red flag that the intervention needs to be evaluated. The troubleshooting checklist on the next page can help you figure out why.
needs to be tweaked in relatively minor ways to meet the needs of an individual. Perhaps the materials are too hard or unmotivating, or perhaps the student needs more positive reinforcement.

Getting the Most out of STAR Reading Enterprise and STAR Math Enterprise
46
apparent? Many experts believe that a reading or math intervention must be at least eight weeks long. Some students, perhaps because of the nature or severity of their problem, may require longer periods.
to an intervention at the beginning of a school year, you may have incomplete information. This is common, especially in schools that have many students below benchmark and cannot hold meetings for all individuals before placing them in an intervention. For this reason, when a student does not show progress, you may need to gather more diagnostic information. Perhaps, for example, what appears to be a comprehension problem is really a decoding or second-language problem.
If a student does not meet a goal, you have a number of choices. If the intervention was not implemented with fidelity, you can keep the same intervention with the same type of goal while improving the implementation. If the student simply needs more time to show gains, you can extend the goal end date. If the intervention does not match the needs of the student, you can change the intervention (along with its goal and end date) based on what you now know about the student.
In our example, Ms. Ruhland is very concerned about Mark’s lack of progress. She also realizes that she has not been able to stick to the intervention plan. Because of other demands on her time, she has only been able to meet with her small group of struggling students two or three times a week. In the meantime, Lake View School has reconfigured its schedule and added an intervention period during which students below benchmark receive supplementary instruction. The fifth-grade team decides to place Mark in a math intervention class taught by Mr. Dawson, a certified math specialist. Mr. Dawson will use Accelerated Math for Intervention to fully differentiate instruction and practice. For low-performing students such as Mark, practice objectives will often be at a level below their current grade. Mr. Dawson will also incorporate math facts practice in his students’ daily routine.
Troubleshooting an InterventionUse this checklist to see why an intervention program might not be effective.
Yes No
Is the intervention research based?
Has the intervention been implemented for the intended amount of time?
Can students perform the academic work assigned to them?
Is the teacher committed to conducting the intervention?
Are materials readily and continuously available?
Has the teacher been shown how to implement the intervention by a knowledgeable coach?
Has the coach observed the intervention at least once to ensure that the teacher is using the intervention correctly and has all the needed materials?
Has the teacher been provided with follow-up support after the initial training?
Does the teacher have a systematic plan for managing routines and procedures so that academic engaged time is maximized?
Adapted from Witt, Joe, Amanda M. VanDerHeyden, and Donna Gilbertson. “Troubleshooting Behavioral Interventions: A Systematic Process for Finding and Eliminating Problems.” School Psychology Review 33, no. 3 (2004): 382-383. Copyright 2004 by the National Association of School Psychologists, Bethesda, MD. Reprinted with permission of the publisher. www.nasponline.org.

47
Starting an Intervention, Setting Intervention Goals, and Progress Monitoring
Editing an Intervention and Goal
If you move a student to a different type of intervention or change the duration or goal of an intervention, enter that information in the software. That way, the Progress Monitoring Report can display data on the student’s progress during each intervention separately. This enables you to identify, over time, the intervention that is most successful. To edit an intervention and goal, go to the STAR Reading or STAR Math tab, select Screening, Progress Monitoring, and Intervention, click the name of the student, and click Edit an Intervention and Goal. You’ll see the student’s latest test score, goal, and current growth rate at the top of the page.
If you are switching a student to a different intervention—for example, from small-group instruction within the classroom to a supplementary intervention class—select Set Up New Intervention and Goal. Then follow the same process used for setting up the original intervention and goal, which we described earlier in this chapter. This tells the software that one intervention has ended and another has begun. In our example, Mark’s intervention program has changed but his goal, which is ambitious, remains the same. The instructions in the appendix walk you through these steps.
Ongoing Progress Monitoring
As the school year goes on, continue to periodically test your intervention students so that you can see if the interventions are working, fix problems that arise, and move students out of intervention if that seems appropriate. Some schools administer STAR assessments weekly or biweekly to students in intervention. Whatever your testing schedule, remember that a student must take four tests before the report can display a trend line, which is your best indicator of the student’s rate of growth. Make test results available to key people, including homeroom teachers, intervention teachers, and—especially if your school is using an RTI framework—grade-level teams.
On the next page, we show what a Student Progress Monitoring Report looks like when a student has been in two or more interventions in a school year. In this example, the data related to Mark’s first intervention is on the left. As we noted earlier, his trend line is flat, indicating his math ability did not grow during that period. The second vertical red line indicates the start of the second intervention. Mark’s goal line—the green line—connects his score at the start of the second intervention to his goal. The trend line—the black line—shows how Mark’s achievement is trending. It’s going up. This tells us he is responding well to the second intervention. Indeed, his trend line is slightly above the goal line, which shows he is on track to meet his goal by the target date.
The second page of the report provides exact data. In the eight weeks since the second intervention began, Mark’s growth rate has accelerated to 5.7 scaled scores per week. This exceeds his goal of 4.0 scaled scores per week and is evidence that he is responding well to the intervention.
Planning Interventions in an RTI Framework: Problem Solving vs. Standard Protocol
Schools working within an RTI framework may have different ways of placing students in intervention. Some schools use a problem-solving method. When a struggling reading
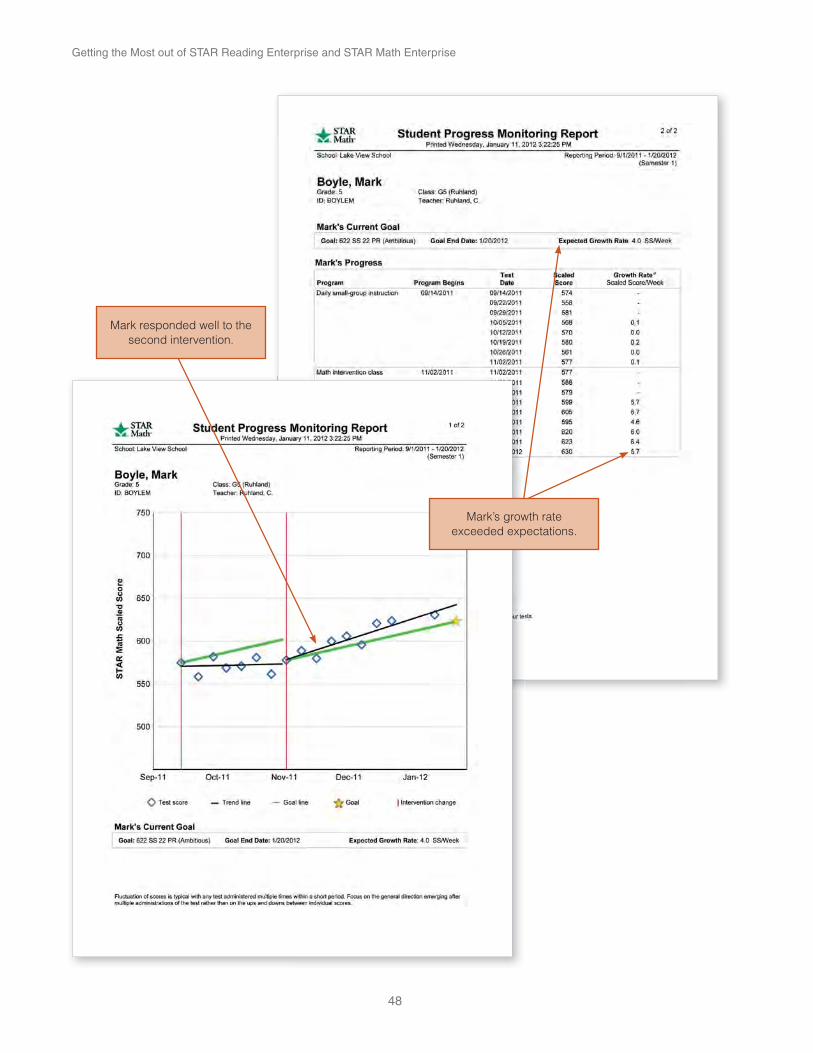
Getting the Most out of STAR Reading Enterprise and STAR Math Enterprise
48
Mark responded well to the second intervention.
Mark’s growth rate exceeded expectations.

49
or math student is identified with a STAR assessment, for example, teachers and specialists may do additional diagnostic testing and hold a multi-staff meeting to analyze the student’s deficits and plan individualized intervention strategies. Other schools, especially those that have many low-performing students, use what are termed standard protocols. These schools simply may not have the resources to provide individualized interventions to large numbers of students. Instead, they initially provide a standard protocol, especially at Tier 2. Students with similar skill needs are grouped together and participate in a research-proven intervention program. Staff choose the intervention from a limited number of defined programs. The advantages of a standard protocol are that decisions about placement can be made within a few meetings and fewer resources are required to meet student needs.
SUMMARY
STARTING AN INTERVENTION, SETTING INTERVENTION GOALS, AND PROGRESS MONITORING
have accurate baseline data.
appears after four tests.
student’s trend line to the goal line, you can see if the student is on track to meet the goal for the intervention.
to a more intensive intervention, make sure the current intervention has been implemented with fidelity and matches the student’s needs, and that the student has been engaged long enough for it to have an effect.
software can provide data for each intervention separately.
Starting an Intervention, Setting Intervention Goals, and Progress Monitoring

50
tInstructional Planning for Differentiation
It would be hard to find a teacher who did not believe that the most effective instruction is differentiated for each student. But finding the time and resources to fully provide that kind of instruction to 25, 35, or—in the upper grades—150 individuals is a huge challenge. One of the biggest barriers to differentiation is knowing what a student needs to learn. Face-to-face probes are time consuming, and state tests typically come too late in the year to truly inform instruction. That’s why one of the most significant features of STAR Enterprise is that it provides data on students’ knowledge of specific skills. Thanks to computer-adaptive technology and the psychometrics upon which STAR Enterprise assessments are based, it does this rapidly and accurately. This means teachers have more and better information with which to differentiate instruction for their class, small groups, and individual students.
How STAR Assessments Report Skill Knowledge
As we mentioned in Chapter 1, during the development of STAR Enterprise assessments, we created learning progressions for reading and math, which we call Core Progress for reading and Core Progress for math. For each subject, we identified an order of increasingly difficult skills by first calling upon reading and math theory, examining widely accepted frameworks such as state standards and Common Core State Standards, and consulting nationally recognized reading and math experts. Then we translated reading and math skills into STAR Enterprise test items and calibrated their level of difficulty. Using this data, we were able to place items on a scale, from easy to hard, which represented progressions with which reading and math skills are learned. When students take a STAR assessment and get a scaled score, the software looks at where in the learning progression their scores fall. It then reports which skills students likely have mastered, which skills they are likely ready to learn, and which skills they need to learn after that. See the illustration above for a visual representation.
As we mentioned in Chapter 1, STAR Reading Enterprise assesses skills in five domains: Word Knowledge and Skills, Comprehension Strategies and Constructing Meaning, Analyzing Literary Text, Understanding Author’s Craft, and Analyzing Argument and Evaluating Text. STAR Math Enterprise assesses four domains: Numbers and Operations; Algebra; Geometry and Measurements; and Data Analysis, Statistics, and Probability.
Instructional Planning for Individual Students
The STAR Reading Enterprise Instructional Planning Report lists the reading skills that a student is ready to learn next based on the current scaled score. The STAR Math Enterprise Instructional Planning Report does the same for math. These reports are intended to be informational, not prescriptive. In other words, don’t consider them to be THE directives
STAR Scale1400
Scaled Score = 500
LearningProgression
0
Difficult
Easy
Skills Remaining to Learn
Skills Ready to Learn
High Probability of Mastery
Skills Mastered

51
Instructional Planning for Differentiation
STAR Scores and State Tests
We are able to show how a student’s scaled score on STAR relates to the student’s potential performance on a state test because we have done numerous linking studies. These tell us which scaled scores are associated with which proficiency levels. If you choose to view the Instructional Planning Report in the context of state benchmarks and don’t see a band of colors representing proficiency levels, it is because your grade is either not tested on the state test or we do not yet have enough data to do a linking study. In this case, go back to the report options screen and choose district or school benchmarks.
when planning instruction for a student. Use them in conjunction with other sources of information, such as classroom work, other assessments, and direct observation.
If you look at the STAR Reading Enterprise Instructional Planning Report for Juan Santos, which is on the next page, you’ll see a list of five skills to learn in the Word Knowledge and Skills domain and five skills to learn in the Comprehension Strategies and Constructing Meaning Domain. (Skills to learn for the other domains are listed on additional pages not shown here.) We see a similar list of skills on the STAR Math Enterprise Instructional Planning Report for Lisa Stone. The target symbol in front of a skill name indicates that it is a focus or core skill, that is, one of the most critical skills to learn at that level.
When you print the Instructional Planning Report, you can choose the number of skills you’d like to see for each domain, from 0 to 20. This can be helpful if you want to focus instruction on a specific domain.
The top portion of the report shows the student’s current achievement level as well as a projected scaled score. The default for the projected score is the end of the school year, but you can customize that to any date, for example, to the end of a quarter or the date of the state test. The projected score is based on our growth data and represents the scaled score achieved by 50 percent of students who started the school year with a scaled score similar to the score of the student for whom you are running the report.
Both the current and projected score fall within a band of colored bars. These correspond to the proficiency levels for the benchmark that you choose to display. In the Instructional Planning Report for Juan Santos, we see that his current scaled score of 318 places him in the Intervention category of his school benchmark settings. His score is projected to be 430 at the time of the state test. With that score he would move into the On Watch category.
Keep in mind that the projection shown on this report is not an absolute. While about 50 percent of students would grow to this point, 50 percent would not. Other factors also need to be considered. For example, if you are providing extra help to a student projected to fall below benchmark, your intention is that the student will do better than projected.
Teachers of students who need intervention find the Instructional Planning Report especially helpful. It suggests appropriate skills for differentiated instruction and identifies the most critical ones. Accelerated Math teachers also find the report useful for identifying skills suitable for diagnostic testing.

Getting the Most out of STAR Reading Enterprise and STAR Math Enterprise
52
The Instructional Planning Report shows a student’s current and projected performance, and suggests skills to
work on.
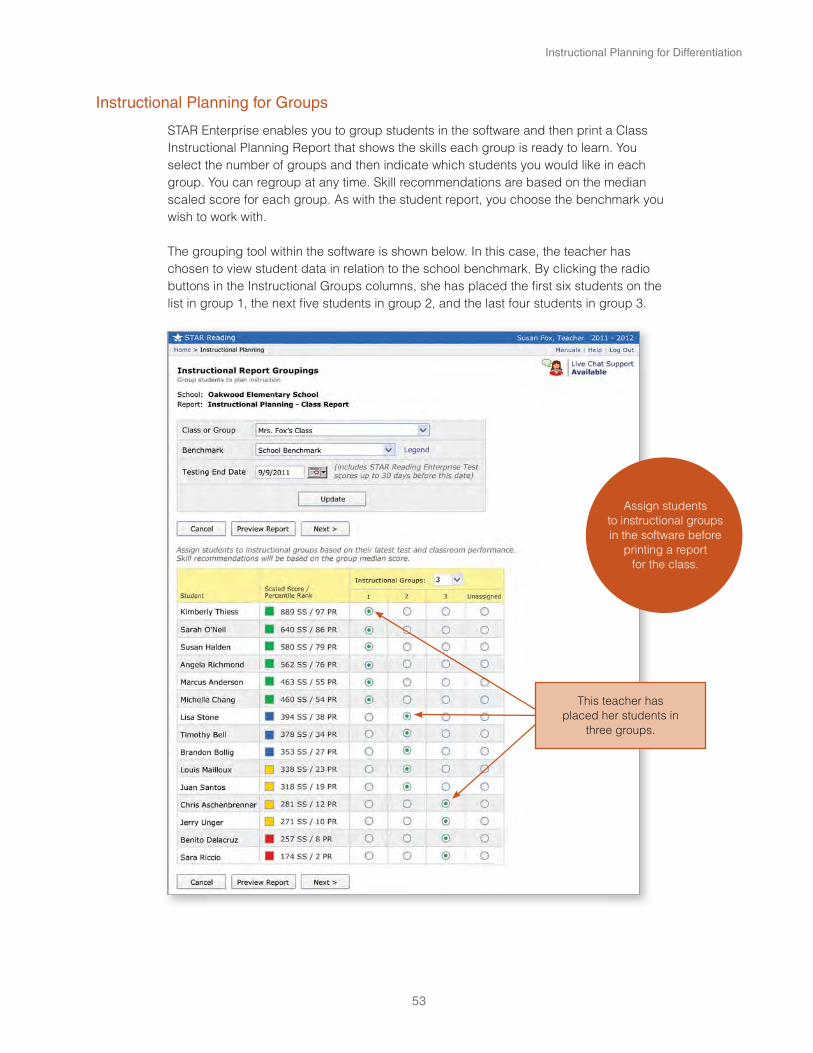
53
Instructional Planning for Differentiation
Instructional Planning for Groups
STAR Enterprise enables you to group students in the software and then print a Class Instructional Planning Report that shows the skills each group is ready to learn. You select the number of groups and then indicate which students you would like in each group. You can regroup at any time. Skill recommendations are based on the median scaled score for each group. As with the student report, you choose the benchmark you wish to work with.
The grouping tool within the software is shown below. In this case, the teacher has chosen to view student data in relation to the school benchmark. By clicking the radio buttons in the Instructional Groups columns, she has placed the first six students on the list in group 1, the next five students in group 2, and the last four students in group 3.
Assign students to instructional groups in the software before
printing a report for the class.
This teacher has placed her students in
three groups.
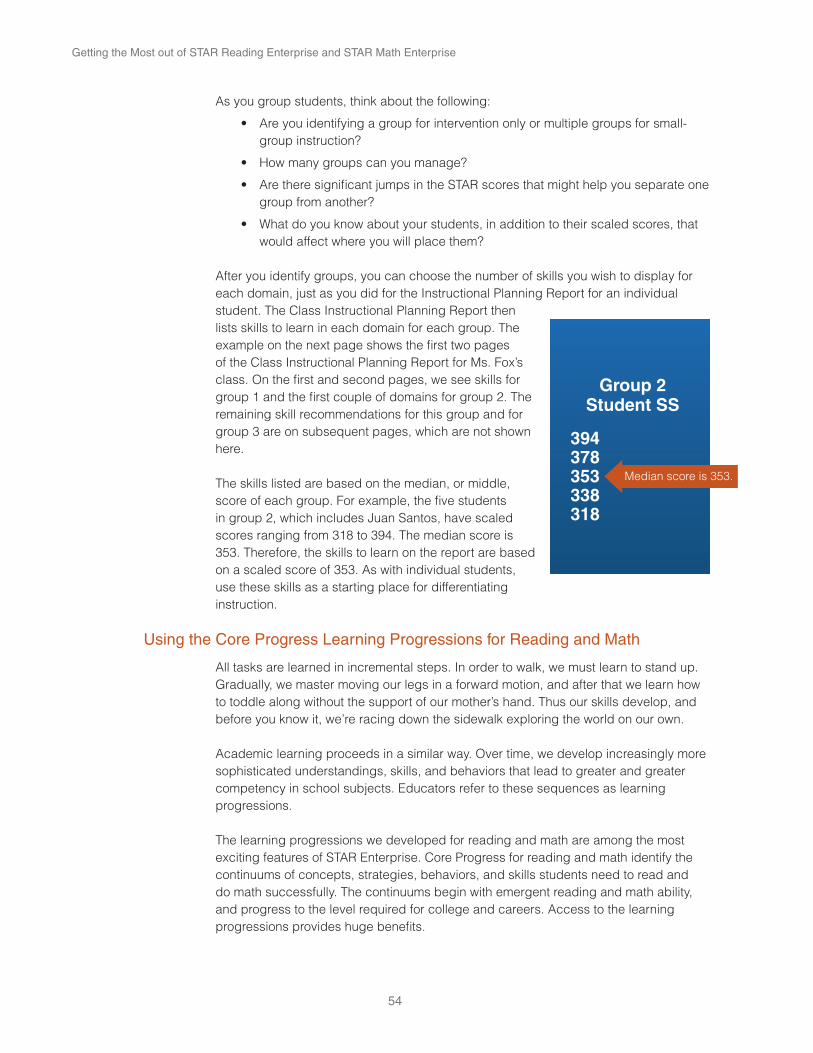
Getting the Most out of STAR Reading Enterprise and STAR Math Enterprise
54
As you group students, think about the following:
group instruction?
group from another?
would affect where you will place them?
After you identify groups, you can choose the number of skills you wish to display for each domain, just as you did for the Instructional Planning Report for an individual student. The Class Instructional Planning Report then lists skills to learn in each domain for each group. The example on the next page shows the first two pages of the Class Instructional Planning Report for Ms. Fox’s class. On the first and second pages, we see skills for group 1 and the first couple of domains for group 2. The remaining skill recommendations for this group and for group 3 are on subsequent pages, which are not shown here.
The skills listed are based on the median, or middle, score of each group. For example, the five students in group 2, which includes Juan Santos, have scaled scores ranging from 318 to 394. The median score is 353. Therefore, the skills to learn on the report are based on a scaled score of 353. As with individual students, use these skills as a starting place for differentiating instruction.
Using the Core Progress Learning Progressions for Reading and Math
All tasks are learned in incremental steps. In order to walk, we must learn to stand up. Gradually, we master moving our legs in a forward motion, and after that we learn how to toddle along without the support of our mother’s hand. Thus our skills develop, and before you know it, we’re racing down the sidewalk exploring the world on our own.
Academic learning proceeds in a similar way. Over time, we develop increasingly more sophisticated understandings, skills, and behaviors that lead to greater and greater competency in school subjects. Educators refer to these sequences as learning progressions.
The learning progressions we developed for reading and math are among the most exciting features of STAR Enterprise. Core Progress for reading and math identify the continuums of concepts, strategies, behaviors, and skills students need to read and do math successfully. The continuums begin with emergent reading and math ability, and progress to the level required for college and careers. Access to the learning progressions provides huge benefits.
Group 2Student SS
394378353338318
Median score is 353.
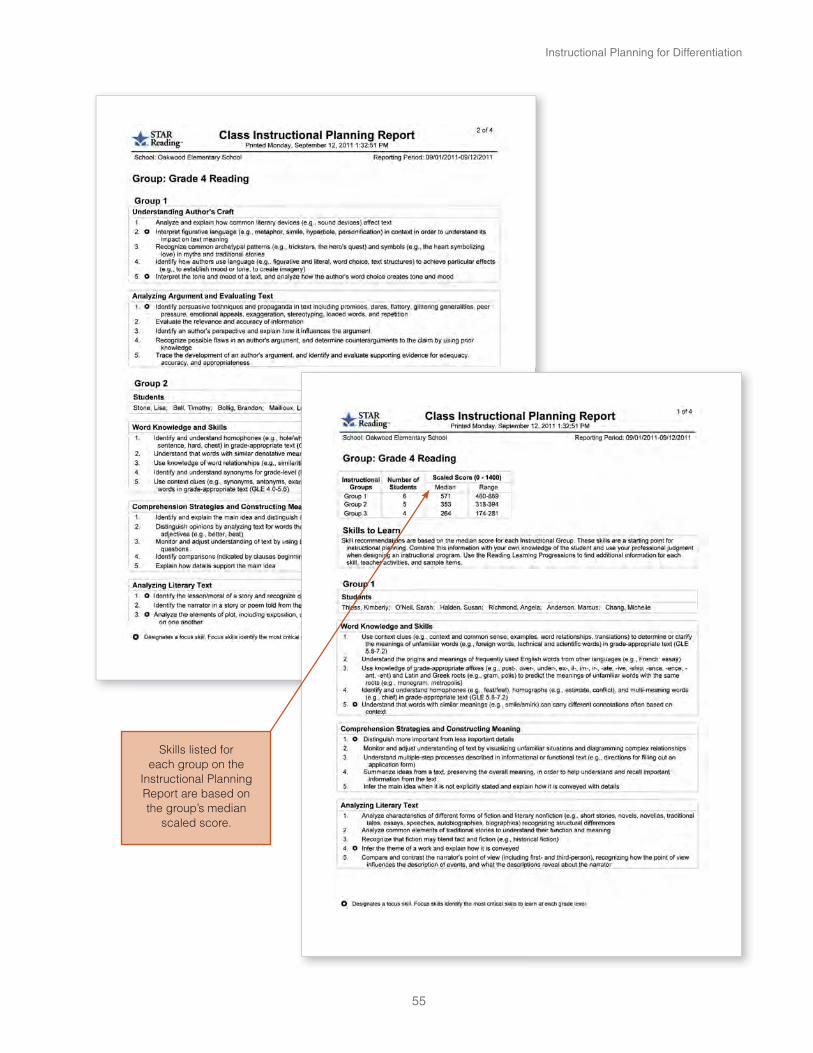
55
Instructional Planning for Differentiation
Skills listed for each group on the
Instructional Planning Report are based on the group’s median
scaled score.
Getting the Most out of STAR Reading Enterprise and STAR Math Enterprise
56
Learning progressions help you plan instruction that is systematic and logical. You see what students need to learn, and you see how they can get there. In this way, learning progressions are like a road map. Imagine, for example, you want to drive from New York to San Francisco. Unless you have lots of time on your hands, you don’t start out unaided, hoping that by wandering around you’ll eventually reach your destination. Instead, you consult a map, which guides you to the big landmarks along your route—Cleveland, Chicago, Denver, and Salt Lake City—and steers you through the smaller stretches along the way. Learning progressions work similarly. They provide a logical and efficient pathway for teaching essential skills.
Learning progressions help you diagnose problems. Let’s suppose one of your fifth-grade students can’t do long division. Your first question, of course, is “Why not?” A search in the math learning progression yields a list of prerequisite skills for grades 2, 3, 4, and 5. This list delineates the pathway to learning long division and gives you a starting place for discovering which of these skills your student has not mastered. The worked examples provide sample solutions to support your instruction and student practice.
Learning progressions help make assessment data actionable. When you’re on your cross-country road trip, you periodically check to see where you are. (“Hey, the sign says ‘Welcome to Illinois’!”) If you’re where you want to be, you know where to drive next. If you’re off the route, you take another look at the map so you can get back on track. The same is true academically. STAR Enterprise assessments show you where your students are located on their journey toward success with reading and math. The learning progressions help you take appropriate action by providing guidance on how you can go forward with your instruction or how to backtrack to more fundamental skills.
As an example, let’s look again at the Instructional Planning Report for Juan Santos on page 52. He is a fourth grader with a scaled score of 318. As a result of our data analysis, we know this score maps to skills that are at about the third-grade level on the reading learning progression. Juan’s learning gap consists of the skills on the learning progression that fall between what he currently knows and what he needs to know to perform at the fourth-grade level. These are the skills that appear on the Instructional Planning Report and the ones his teacher will likely want to target for instruction. Teachers of high-ability students get similar guidance. By showing the next level of skills for these students, the learning progressions help teachers plan instruction that ensures continuous learning.
Core Progress and the CCSS
The Common Core State Standards provide clear statements of what students are expected to learn to be college and career ready. They do not, however, describe a fully formed pathway along which students must travel to reach this level of expertise. The Core Progress learning progressions, on the other hand, do just that. They delineate the concepts, skills, and strategies students need to master in order to reach the Common Core State Standards for each grade. Thus they provide concrete, actionable, and pedagogically sound information that teachers can use to plan instruction aimed at helping students achieve the CCSS.

57
Instructional Planning for Differentiation
You can access the STAR Enterprise learning progressions by clicking Enterprise under the STAR Reading or STAR Math tab on the Renaissance Place Home page. Follow the link to Learning Progressions. Then search by grade and/or domain (in reading), by library or learning progression (in math), or by keyword. You can also access a learning progression from the Instructional Planning Report by clicking the link in the area above the report. If you wish to view a specific skill listed on the Instructional Planning Report, go to the Keyword tab and type the exact wording of the skill in the Search box. The learning progressions include a wealth of information for instructional planning. You’ll find a description of grade-level expectations for each domain. Click a skill description in blue to expand it. You’ll then see the vocabulary, conceptual knowledge, and, in the case of reading, linguistic competencies needed to understand the skill, along with suggestions for supporting ELL students. Prerequisite and related skills are listed as well, and links are provided to sample STAR test items. For many reading skills we provide a representative sample activity for instruction, and for math, worked examples. To see how skills are sequenced, view a number of grades at one time. For example, if you are a seventh-grade teacher interested in the domain of Comprehension Strategies and Constructing Meaning, select grades 6, 7, and 8 on the Search page. You will then see the focus skills for that domain for those grades.
0
K 1 2 3 4 5 6 7 8 9 10 11 12
1400
Juan’s Learning Gap
318
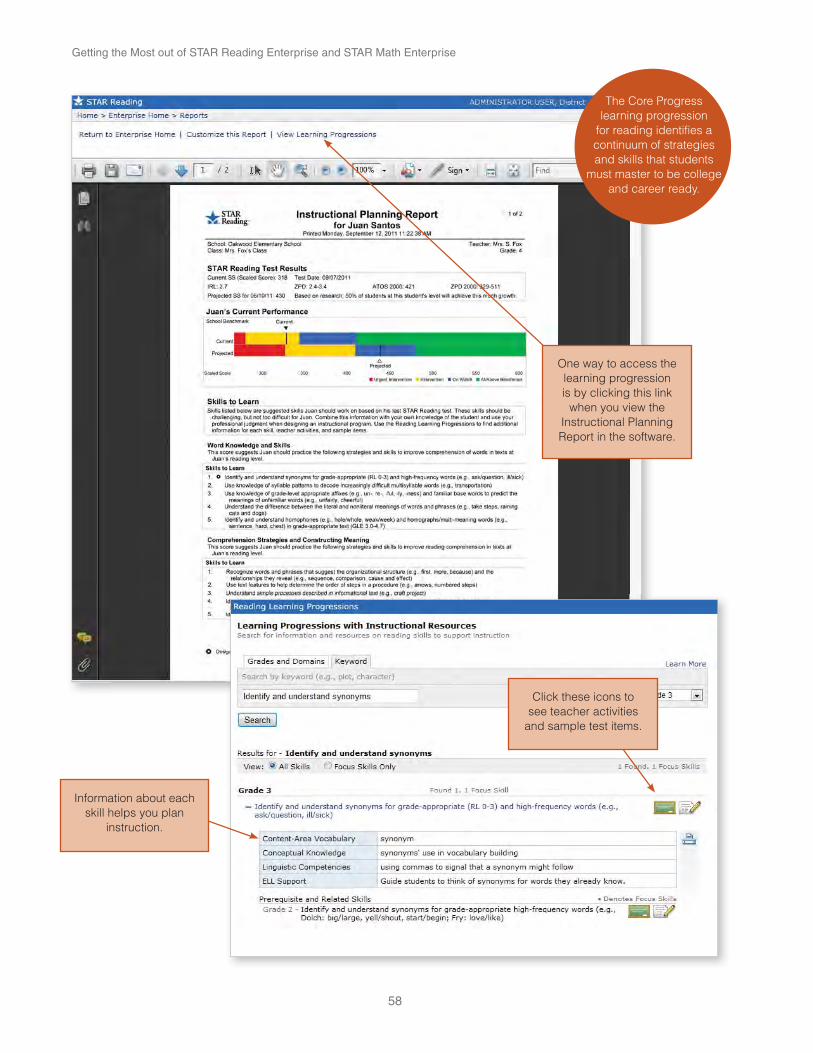
Getting the Most out of STAR Reading Enterprise and STAR Math Enterprise
58
The Core Progress learning progression
for reading identifies a continuum of strategies and skills that students
must master to be college and career ready.
One way to access the learning progression is by clicking this link
when you view the Instructional Planning Report in the software.
Information about each skill helps you plan
instruction.
Click these icons to see teacher activities
and sample test items.

59
Teacher activities suggest one way to
teach a skill.
Sample test items illustrate how a skill is
assessed.
Instructional Planning for Differentiation
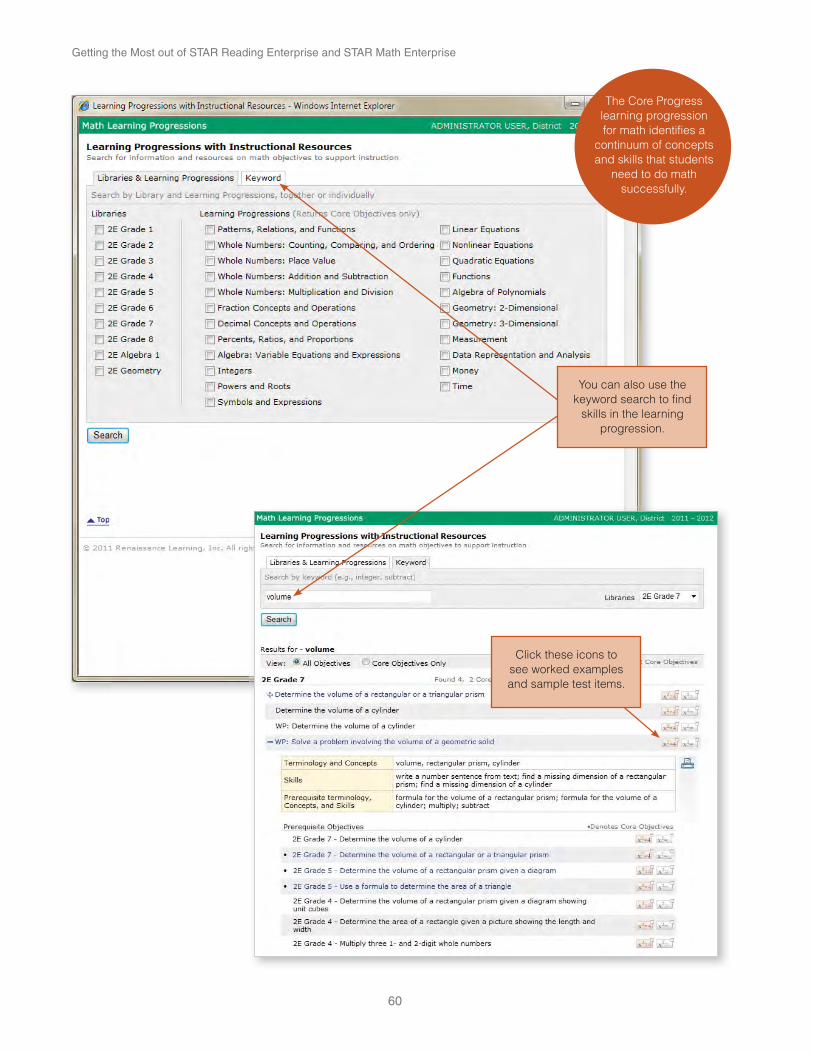
Getting the Most out of STAR Reading Enterprise and STAR Math Enterprise
60
The Core Progress learning progression for math identifies a
continuum of concepts and skills that students
need to do math successfully.
You can also use the keyword search to find
skills in the learning progression.
Click these icons to see worked examples and sample test items.

61
Worked examples show how to solve a problem for an
objective.
Sample test items illustrate how an
objective is assessed.
Instructional Planning for Differentiation

Getting the Most out of STAR Reading Enterprise and STAR Math Enterprise
62
SUMMARY
INSTRUCTIONAL PLANNING FOR DIFFERENTIATION
based on the student’s current scaled score.
score falls relative to the state, district, or school benchmark.
students’ scaled scores. The Class Instructional Planning Report then shows the skills each group is likely ready to learn.
and prerequisite skills students need to know to learn a specific skill. The reading learning progression also provides examples of teacher activities and sample items. The math learning progression provides sample problems and worked examples.
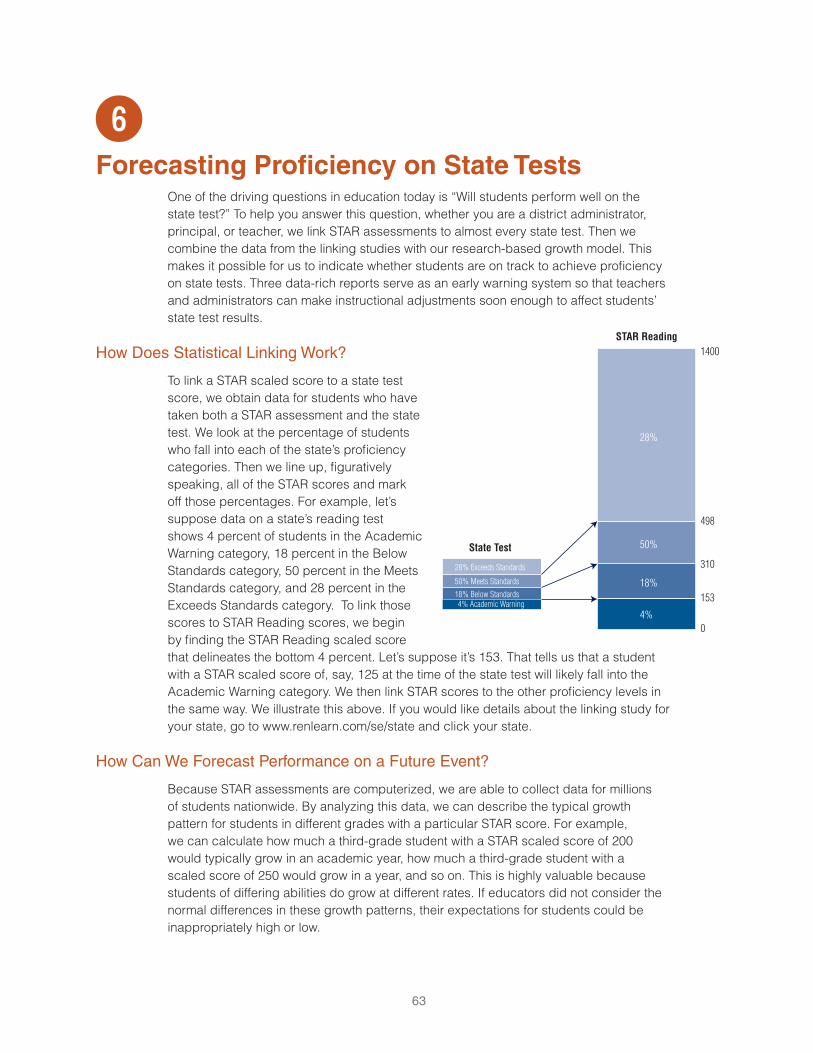
63
yForecasting Proficiency on State Tests
One of the driving questions in education today is “Will students perform well on the state test?” To help you answer this question, whether you are a district administrator, principal, or teacher, we link STAR assessments to almost every state test. Then we combine the data from the linking studies with our research-based growth model. This makes it possible for us to indicate whether students are on track to achieve proficiency on state tests. Three data-rich reports serve as an early warning system so that teachers and administrators can make instructional adjustments soon enough to affect students’ state test results.
How Does Statistical Linking Work?
To link a STAR scaled score to a state test score, we obtain data for students who have taken both a STAR assessment and the state test. We look at the percentage of students who fall into each of the state’s proficiency categories. Then we line up, figuratively speaking, all of the STAR scores and mark off those percentages. For example, let’s suppose data on a state’s reading test shows 4 percent of students in the Academic Warning category, 18 percent in the Below Standards category, 50 percent in the Meets Standards category, and 28 percent in the Exceeds Standards category. To link those scores to STAR Reading scores, we begin by finding the STAR Reading scaled score that delineates the bottom 4 percent. Let’s suppose it’s 153. That tells us that a student with a STAR scaled score of, say, 125 at the time of the state test will likely fall into the Academic Warning category. We then link STAR scores to the other proficiency levels in the same way. We illustrate this above. If you would like details about the linking study for your state, go to www.renlearn.com/se/state and click your state.
How Can We Forecast Performance on a Future Event?
Because STAR assessments are computerized, we are able to collect data for millions of students nationwide. By analyzing this data, we can describe the typical growth pattern for students in different grades with a particular STAR score. For example, we can calculate how much a third-grade student with a STAR scaled score of 200 would typically grow in an academic year, how much a third-grade student with a scaled score of 250 would grow in a year, and so on. This is highly valuable because students of differing abilities do grow at different rates. If educators did not consider the normal differences in these growth patterns, their expectations for students could be inappropriately high or low.
STAR Reading1400
498
310
153
0
28%
50%
18%
4%
State Test
28% Exceeds Standards
50% Meets Standards
18% Below Standards4% Academic Warning
Getting the Most out of STAR Reading Enterprise and STAR Math Enterprise
64
Our growth norms enable us to provide guidelines for setting intervention goals, as we described in Chapter 4. They also make it possible for us to forecast performance on state tests. By combining the results of our linking studies with our growth model, we can tell you not only the scaled score that is linked to proficiency on the state test, but whether or not the student is likely to get there based on typical growth.
Growth norms are updated every year using data for the previous three years. This means the growth norms reflect changes in educational practices that may affect student learning, as well as an up-to-date student group.
What the Reports Show
The performance reports identify grade-level proficiency thresholds on your state test. A proficiency threshold is the STAR scaled score that represents the lowest score a student needs to achieve in order to reach proficiency. The reports also show a pathway to proficiency. This is the trajectory of typical growth for students who are just at the proficiency threshold at the time of the state test. Your goal is for students to score at a level that puts them above this pathway.
One caveat, however: we can never guarantee that a student whose scaled score falls on or above the pathway to proficiency will indeed pass the state test or that a student whose scaled score falls below the pathway won’t pass it. We can only provide estimates based on statistical models. The students in your school are individuals who may grow more or less than projected due to their motivation to learn, time spent in school, degree of comfort with standardized tests, and so on. Students whose scores put them slightly above the pathway will be at greater risk of not meeting proficiency than students far above the pathway, and may need extra attention.
State Performance Report—StudentThis report helps you see whether an individual student is on course to reach proficiency on your state test. An example is on the next page. The graph contains four elements:
just at this threshold.
scores. It appears when a student has taken three or more tests.
If a trend line displays, compare it to the green line, the pathway to proficiency. If the trend line is higher than the green line by the time it reaches the gold star, this tells you the student is likely to score above the proficiency level on the state test. How high that trend line is roughly indicates how high above the minimum level the student is likely to get. If a student has taken only one or two tests and a trend line is not displayed, compare the STAR scores to the green line and look for a trend line when more scores are available.
If You Do Not See Data
If you do not see proficiency data on a State Performance Report, it is either because the grade is not tested on your state test or we do not yet have enough information to do a linking study.
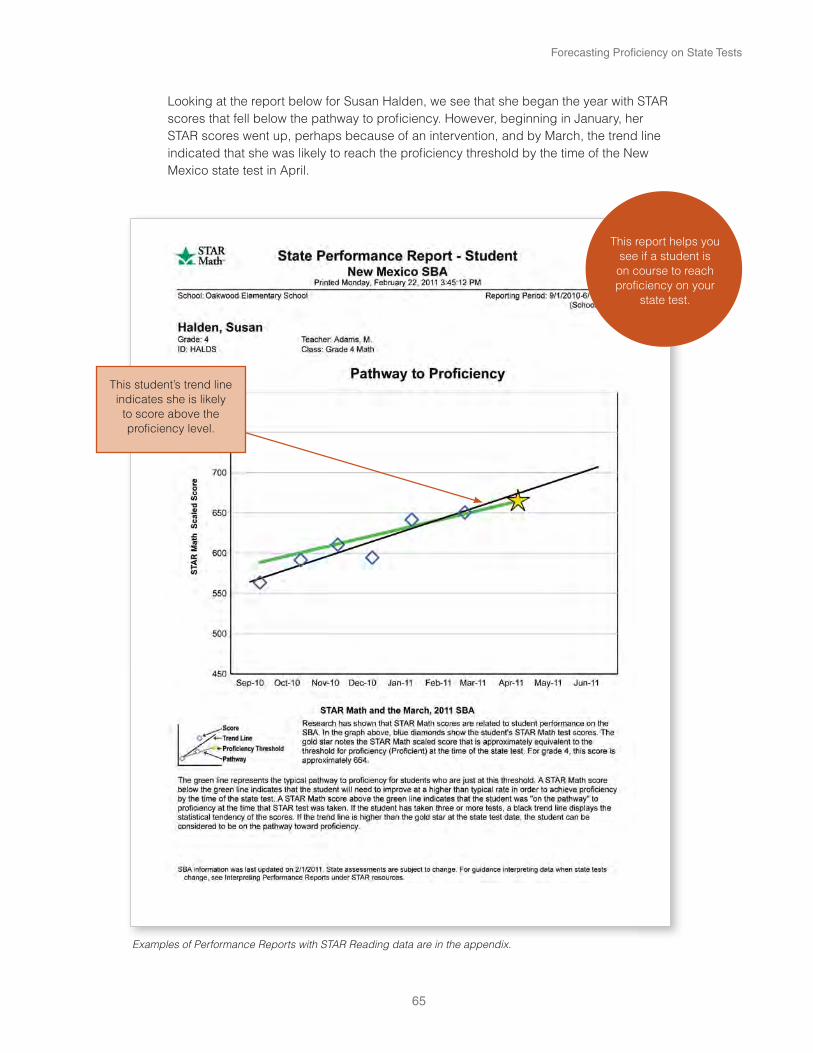
65
Forecasting Proficiency on State Tests
Looking at the report below for Susan Halden, we see that she began the year with STAR scores that fell below the pathway to proficiency. However, beginning in January, her STAR scores went up, perhaps because of an intervention, and by March, the trend line indicated that she was likely to reach the proficiency threshold by the time of the New Mexico state test in April.
This report helps you see if a student is on course to reach proficiency on your
state test.
Examples of Performance Reports with STAR Reading data are in the appendix.
This student’s trend line indicates she is likely
to score above the proficiency level.

Getting the Most out of STAR Reading Enterprise and STAR Math Enterprise
66
As you read the State Performance Report for an individual student, keep in mind how much time is left before your state test. The farther away the state test, the more time there is for change, up or down. As with all reports, use the data to adjust instruction. If a student is not on the pathway, intervention may be warranted.
State Performance Report—ClassThe State Performance Report for a class shows you graphically the percentage of students in your class who are on the pathway to proficiency and the percent who are not. (The report can also be run for groups of students, such as an intervention group.) The report displays the most current data alongside historical data so that you can see patterns. An example is below.
The top of the report presents data in the form of bar graphs. Yellow represents the percentage of students whose scores place them below the pathway, and green represents the percentage of students whose scores place them on the pathway. The table below the bar graphs lists the number of students assessed, percentages on and below the pathway, and median scaled scores. The following pages of the report list
This report shows the percentage of students in a class
who are on the pathway to proficiency
and the percentage who are not.
The percentage of students above the
pathway has increased over time.
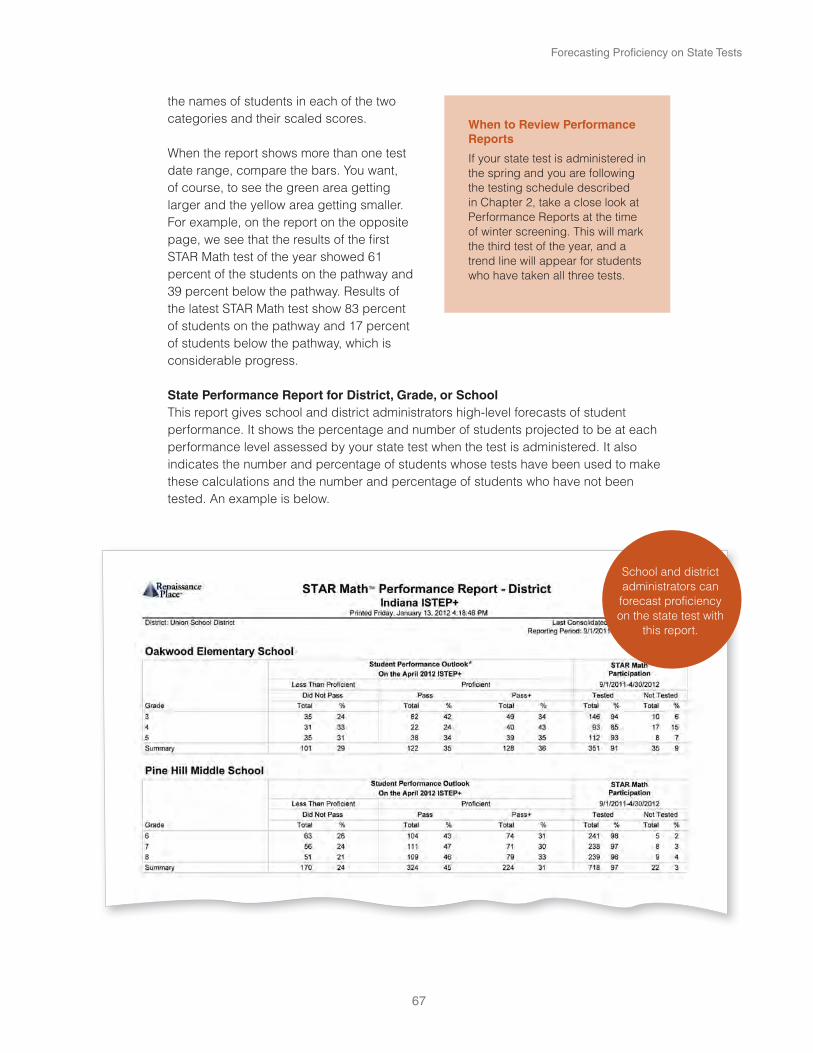
67
Forecasting Proficiency on State Tests
the names of students in each of the two categories and their scaled scores.
When the report shows more than one test date range, compare the bars. You want, of course, to see the green area getting larger and the yellow area getting smaller. For example, on the report on the opposite page, we see that the results of the first STAR Math test of the year showed 61 percent of the students on the pathway and 39 percent below the pathway. Results of the latest STAR Math test show 83 percent of students on the pathway and 17 percent of students below the pathway, which is considerable progress.
State Performance Report for District, Grade, or SchoolThis report gives school and district administrators high-level forecasts of student performance. It shows the percentage and number of students projected to be at each performance level assessed by your state test when the test is administered. It also indicates the number and percentage of students whose tests have been used to make these calculations and the number and percentage of students who have not been tested. An example is below.
School and district administrators can forecast proficiency on the state test with
this report.
When to Review Performance Reports
If your state test is administered in the spring and you are following the testing schedule described in Chapter 2, take a close look at Performance Reports at the time of winter screening. This will mark the third test of the year, and a trend line will appear for students who have taken all three tests.
Getting the Most out of STAR Reading Enterprise and STAR Math Enterprise
68
You can view the data in many different ways, for example, by district, school, or grade. Those choices can be further refined to show data by teacher, class, or student demographics, such as gender and ethnicity. (Before viewing this report for a district, data must be consolidated. Consolidation takes place automatically at 2 a.m. every day. You can, however, consolidate on demand. See the Renaissance Place Real Time software manual for instructions.)
Looking at the report on the previous page, we see two reporting levels that correspond to those on the Indiana State Assessment: Less Than Proficient and Proficient. The Proficient category is further divided into Pass and Pass+. The district administrator has chosen to see data for grades 3, 4, and 5 in Oakwood Elementary and grades 6, 7, and 8 in Pine Hill Middle School.
The forecasts on the Performance Report are based on all of the STAR assessment data available from the beginning of the school year through the date you run the report. Running the report early in the school year gives you more time to assemble additional information and plan a course of action. The later in the school year you run the report, the more data it will be based on and, therefore, the more meaningful the report will be. When you analyze the Performance Report, look for patterns:
Note strengths. Which teachers or grades are doing especially well? What are these teachers doing?
Identify weaknesses. Are students in some schools, grades, or classes forecasted to do worse than others on the state tests? Are there discrepancies among demographic groups? Why might this be and how can it be remedied?
Celebrate progress. As forecasts improve, make sure staff and students know about it and are recognized for their efforts.
Build sustainability. Identify teachers who can act as mentors for teachers who are struggling, and give them opportunities to collaborate. Identify specific strategies that foster success.
Interpreting Data When a State Test Changes
If a state test changes, we can’t immediately tell how much the new test differs from the prior edition. Students have to first take the test, the state must score the test, and the state must release the data. Therefore, when a state test does change, for an interim period the STAR performance reports will link to the prior edition. However, you can still use these reports as indicators of whether or not students are on track toward proficiency. Here are some guidelines:
You can assume that students whose scores put them well above the proficiency threshold on the STAR Performance Reports are on track to score above the threshold on the new state test.
Viewing Performance Reports After the State Test
The performance reports are based on data that is generated from the start of the school year to the mid-point of your state’s testing period. This is referred to as the “outlook reporting period.” You may run the performance reports after this period, but it will show the same data until the beginning of the next school year.

69
Forecasting Proficiency on State Tests
Students whose scores put them well below the proficiency threshold will likely remain below the threshold unless you provide a substantial intervention.
Take special care with students whose scores put them on the borderline of the pathway to proficiency. Because the new state test is likely to be more rigorous, these students and their teachers will need to take extra strides to score above the proficiency threshold.
SUMMARY
FORECASTING PROFICIENCY ON STATE TESTS
performance on state tests.
student is on course to reach proficiency on your state test.
of students in your class who are on the pathway to proficiency and the percentage who are not.
forecast for school and district administrators that shows the percentage of students projected to be at each performance level assessed by your state test when the test is administered.

70
uEstimating Mastery of State Standards and Common Core State Standards
Another special feature of STAR Enterprise is its ability to estimate the level of mastery on state standards and Common Core State Standards for a student, class, or district. Reports show current levels of mastery as well as projected levels by the end of the school year. They also graphically display the difficulty of each standard. All of this data helps teachers and administrators analyze the effectiveness of the curriculum, identify learning gaps, and make improvements.
Standards vs. Proficiency
In Chapter 6, we described how STAR Enterprise indicates whether students are on track to reach proficiency on state tests. A state test, of course, is just what the name implies—a test, usually taken near the end of the school year that is administered to all students in certain grades throughout your state. It’s important to understand, though, that “proficiency” on the state test means a student has reached only the lowest acceptable level of achievement on that test.
Standards are different. Standards express the highest level of achievement by defining the knowledge and skills expected of students in each grade. Sometimes state tests assess standards, and sometimes they do not. For these reasons, it’s a good idea to evaluate achievement against both your state’s test and your state standards. If your state has adopted the Common Core State Standards, as most states have, assessing student progress toward these standards is highly valuable as well.
How STAR Enterprise Estimates Mastery
We go through a multi-step process in order to provide meaningful data on our standards reports.
we select the standards against which we will measure student achievement. To provide data on every standard would be overwhelming. In general, we report on the highest-level standard with a specific statement of knowledge that can be represented on a test.
that align with the standards we will report on. As part of our item-development process, we continually create items that address state standards and Common Core State Standards.
nationwide and perform a statistical analysis of their difficulty. By reviewing this data for the items that align with standards, we can assign a difficulty level to the standard that is equated to a STAR scaled score. We call the band of scores just above and below this difficulty level the Estimated Mastery Range. For example, we might say that a standard has an Estimated Mastery Range of 700 to 770.
71
Estimating Mastery of State Standards and Common Core State Standards
we have assigned. This expert evaluates the difficulty level based on content knowledge and by comparing the standard to other standards at the same grade level as well as similar standards within higher and lower grades.
When a student takes a STAR test, the software looks at the student’s overall scaled score. Because the standards for your state and the Common Core State Standards have also been placed on the scale, the software can report where the student’s scaled score falls in relation to each standard. Let’s look at the example mentioned above—a standard with an Estimated Mastery Range of 700 to 770. Students with scaled scores above 770 have likely mastered this standard, while students with scaled scores below 700 likely have not. Students with scaled scores between 700 and 770 are within the mastery range but should be monitored to confirm their understanding of that standard.
We provide projected scores on standards reports using the growth norms we described in Chapter 6. For example, if a sixth-grade student has a scaled score of 650 in September, our growth norms might tell us that 50 percent of students of this ability will likely have a scaled score of about 719 or higher by the end of the year. Based on that projected scaled score, we can also project the student’s mastery of state standards.
State Standards Report—Student
This report shows a student’s estimated mastery of your state standards or the Common Core State Standards, currently and at the end of the school year. (You select which set of standards you wish to view before you print the report.) An example is on the next page. The top of the first page of the report presents the data as a bar graph with each standard identified by number. Underneath the graph is a summary of the student’s scores. The bottom of the first page and the succeeding pages list the standards, with their number and description, that fall within each category for this individual: Above Estimated Mastery Range, Within Estimated Mastery Range, and Below Estimated Mastery Range.
Looking at the example on the next page, we see that Brandon Bollig’s teacher ran this report for the Grade 4 Common Core State Standards in math. The colored bars represent each standard. The Estimated Mastery Range is shown in light green. Yellow represents below mastery and dark green above mastery. The first thing you may notice is that the bands of color are different sizes for each standard. For the first standard (CC 4.OA.C1, which corresponds to “Use the four operations with whole numbers to solve problems”), the Estimated Mastery Range runs from a scaled score of 774 to 814. Contrast that with the third standard from the left: CC 4.OA.C3 (“Generalize and analyze patterns”). Its mastery range runs from a scaled score of 413 to 443. This tells us that a student would need to achieve a much higher scaled score on STAR, specifically between 774 and 814, in order to demonstrate mastery of using the four operations with whole numbers to solve problems than to generalize and analyze patterns. In other words, solving problems with the four operations is much harder to master than generalizing and analyzing patterns.
Now look at the black horizontal line. This marks Brandon’s current scaled score of 537. Indeed, we can see that he is in the green zone, above mastery level, for the patterns standard, but in the yellow zone, below mastery level, for the problem-solving standard.
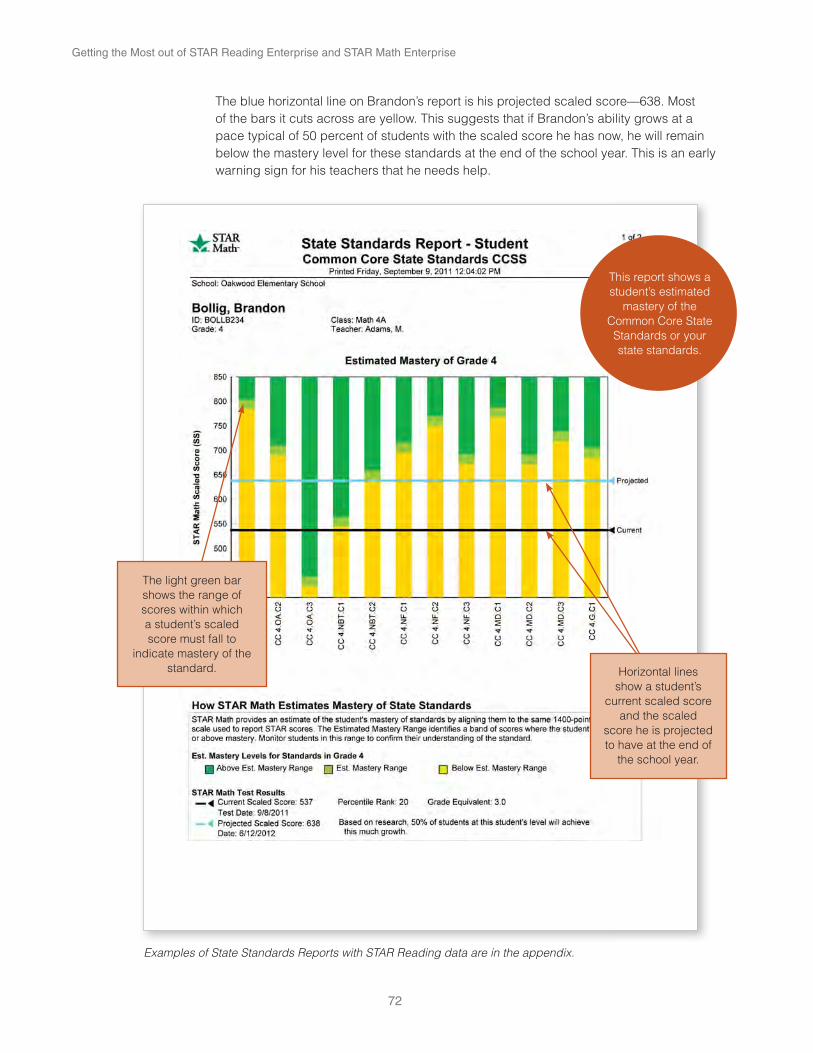
Getting the Most out of STAR Reading Enterprise and STAR Math Enterprise
72
The blue horizontal line on Brandon’s report is his projected scaled score—638. Most of the bars it cuts across are yellow. This suggests that if Brandon’s ability grows at a pace typical of 50 percent of students with the scaled score he has now, he will remain below the mastery level for these standards at the end of the school year. This is an early warning sign for his teachers that he needs help.
Examples of State Standards Reports with STAR Reading data are in the appendix.
This report shows a student’s estimated
mastery of the Common Core State Standards or your state standards.
The light green bar shows the range of scores within which a student’s scaled score must fall to
indicate mastery of the standard. Horizontal lines
show a student’s current scaled score
and the scaled score he is projected to have at the end of
the school year.

73
Estimating Mastery of State Standards and Common Core State Standards
State Standards Report—Class
This report indicates how each student in your class is doing with each standard. For the report below, for example, the teacher chose to see how students were doing with the Grade 4 Common Core State Standards for math. For the standard “Gain familiarity with factors and multiples” (CC 4.OA.C2), the report shows that 8 of 18 students are above the Estimated Mastery Range, 2 students are within it, and 8 students are below it. Five students in the latter category are flagged with a red mark. This means that if their skills grow at a rate typical of students of their ability, they will not master the standard by the end of the school year without additional help.
The percentage of students in each category is shown in the colored bar. In this case, 44 percent of students are above the mastery range, 11 percent within it, and 44 percent below it.
Teachers can use this report to see how
students are doing with the Common Core State Standards and
state standards.
Colored bars show the percent of students
who are above, within range of, and below
mastery of each standard.

Getting the Most out of STAR Reading Enterprise and STAR Math Enterprise
74
State Standards Report—District
This report, which can only be viewed by administrators, provides a high-level look at student performance throughout the district in relation to state standards and Common Core State Standards. For the sake of simplicity, instead of showing three levels of mastery, this report shows one: the percent of students in or above the Estimated Mastery Range. Current and projected percentages are shown for each standard. You select the set of standards, and choose the degree of detail you wish to see. For example, in the report below, this administrator has chosen to see data related to the Common Core State Standards for math. The data is for grade 5 and is displayed by class within each school: Math 5A and 5B in West Elementary and Math 5C and 5D in East Elementary. For the first standard (CC 5.OA.C1: “Write and interpret numerical expressions”), the dark green bars show that 79 percent of students in the West Elementary fifth grade are currently in or above the estimated mastery range and 85 percent are projected to be in or above that range by the end of the school year. The light green bars show the percentages for each of the two classes within that grade.
This report gives administrators a high-level look at student mastery of Common
Core State Standards or state standards.
View current mastery and projected mastery
levels for each standard.

75
How to Use the Standards Reports
You may be tempted to use the standards reports to plan specific instruction for individuals by, for example, singling out a standard a student has not mastered, teaching directly to it, and then testing the student again with STAR to check learning. However, these reports were not designed for that purpose. Rather, the goal is to give you a snapshot of student achievement in relation to state standards and Common Core State Standards and to help you consider the implications. Here are some questions that can guide your thinking:
Student Report
Standards Report for a student, how, in general, is the student doing? If the student is not meeting most standards, has an intervention been considered? What can you do to raise this student’s overall achievement?
standards for a grade. Which standards are harder than others? Do you need to pay particular attention to these standards when instructing all students?
standards and one showing mastery of Common Core State Standards? Is there a difference? What might this mean? Is one set of standards harder than the other? How does that affect your instruction?
Class Report
numbers of students below mastery on a number of standards? What might this indicate about your curriculum? Are the students who are flagged with a red mark receiving intervention or otherwise getting extra help?
District Report
among schools or classes within schools on the same standard? What might account for this? How might teachers of high-performing students share successful instructional techniques? If students throughout the grade are doing poorly with a particular standard, do your curriculum and instructional materials need to be evaluated?
CCSS and the Learning Progressions
The Common Core State Standards set high goals for all students so that they will be ready for the demands of college and careers. STAR assessments tell you where students are in relation to these goals. In addition, the reading and math learning progressions, which are embedded in STAR Enterprise, map the intermediate steps and prerequisite skills necessary to reach the levels of expertise expressed in the CCSS. For more information about the learning progressions and how you can use them to plan instruction, see Chapter 5.
Estimating Mastery of State Standards and Common Core State Standards
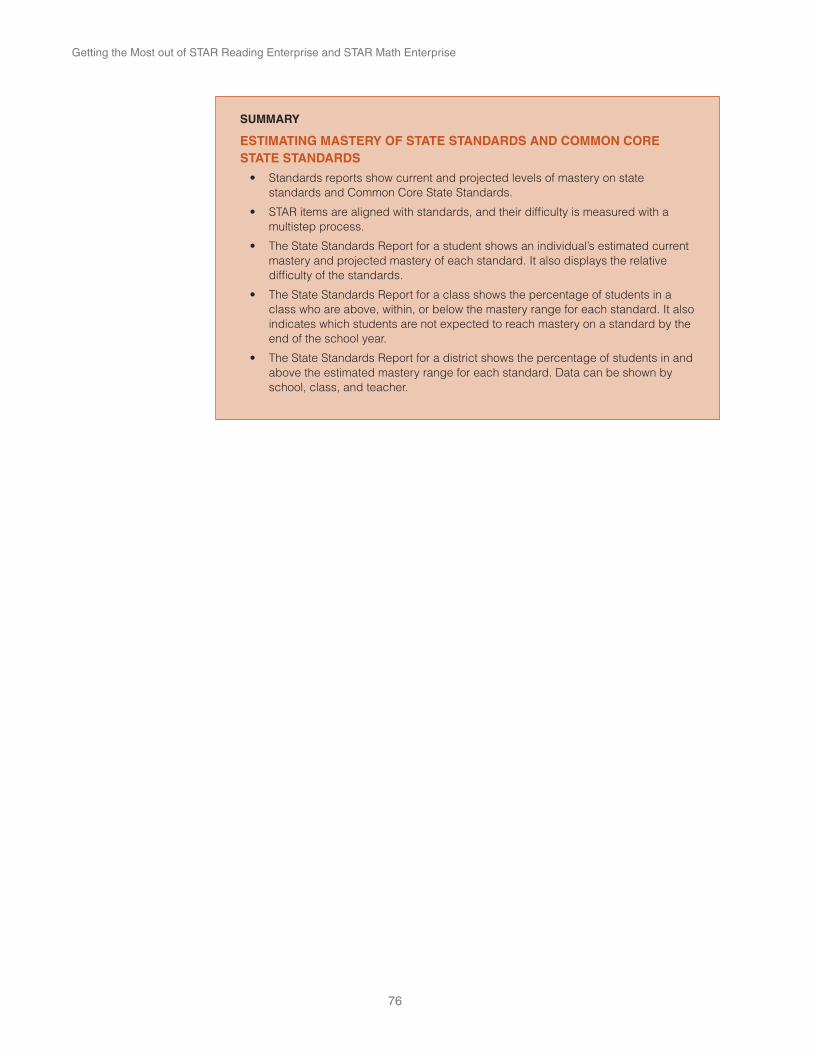
Getting the Most out of STAR Reading Enterprise and STAR Math Enterprise
76
SUMMARY
ESTIMATING MASTERY OF STATE STANDARDS AND COMMON CORE STATE STANDARDS
standards and Common Core State Standards.
multistep process.
mastery and projected mastery of each standard. It also displays the relative difficulty of the standards.
class who are above, within, or below the mastery range for each standard. It also indicates which students are not expected to reach mastery on a standard by the end of the school year.
above the estimated mastery range for each standard. Data can be shown by school, class, and teacher.

77
Measuring Growth
iMeasuring Growth
Because changes in achievement don’t happen overnight, measuring growth is essential to understanding the effects of instruction. Teachers want to know if their students have progressed from the beginning of the school year to the end. Administrators look at yearly growth but take a longer view as well: How much growth have students made in two years? Three years? Is that growth reasonable, adequate, accelerated? Are students learning as much as they need to learn while they are in our school or district? In this chapter, we describe three STAR reports that display growth in different ways so that educators can answer these important questions.
Looking at Growth in a School Year with the Growth Report
The STAR Growth Report summarizes growth between two testing periods in the same school year. Teachers can run the report for a class or a specific group of students. Administrators can run it to see growth for each class, grade, or school in a district.
Different Ways of Looking at GrowthThe Growth Report displays a number of scores. These help you look at growth in different ways. With the exception of student growth percentiles, all of the scores are reported for any two tests taken within the same school year. The default setting is for the software to show data for the first and last test taken. However, other tests may be selected. For example, you might wish to look at growth from the beginning to the end of a quarter or semester.
scaled score (SS) is a raw score that measures ability. An increase indicates that the student has experienced absolute growth.
Student growth percentile (SGP) compares a student’s growth to that of his or her academic peers nationwide. By academic peers we mean students at a similar achievement level as well as the same grade level. (SGP does not, however, take into account characteristics such as gender, ethnicity, or English language proficiency.) For example, if a student has an SGP of 90, it means his growth from one test to another was better than 90 percent of students at a similar achievement level in the same grade. We explain SGP more thoroughly below.
Percentile rank (PR) tells you the percentage of students in the same grade who scored lower at the same time of year. For example, if a student has a PR of 50 on her first test, it means 50 percent of students nationwide in the same
Specialized STAR Reading Scores
An increase in a student’s instructional reading level (IRL) indicates the student can handle more difficult instructional materials. For example, an increase of 1.3 means the difficulty level has increased by about one year and three months. An increase in estimated oral fluency (Est. ORF) indicates growth in a student’s ability to read words quickly and accurately. For example, if an Est. ORF score goes up by 20, it means the student can read 20 more words within one minute.

Getting the Most out of STAR Reading Enterprise and STAR Math Enterprise
78
grade at the same time of year scored lower than she did. If she has a PR of 60 on her second test, 60 percent of students nationwide in the same grade at the same time of year scored lower than she did. Moving from the 50th percentile to the 60th percentile represents a gain. Conversely, if the student’s percentile score goes down, she has lost ground relative to students in the same grade nationwide.
grade-equivalent score (GE) tells you the grade level of students who on average achieved the same scaled score. GE is expressed in school years and months. For example, if a student has a GE score of 7.0, that means he scored about as well as the typical seventh-grader at the start of the school year. If his score is 7.5 on the next test, that indicates he is now performing at the level of a typical seventh-grader in the fifth month of the school year.
Normal curve equivalent (NCE) scores express student ability on an equal-interval scale. These scores are most frequently used for statistical calculations in research studies and evaluations of government programs.
Student Growth PercentileOf all the scores displayed on the Growth Report, one of the most useful is student growth percentile (SGP). The advantage of the student growth percentile is that it gives a much clearer picture of whether a student’s growth is more or less than can be expected.
For example, let’s suppose a student’s scaled score increases by 100 points between September and June. Is this amount of growth good, not-so-good, or average? We can’t easily answer that question because students at different achievement levels in different grades grow at different rates. For example, a high-achieving second grader grows at a different rate than a low-achieving second grader. Similarly, a high-achieving second-grader grows at a different rate than a high-achieving eighth-grader.
Because STAR assessments are given to so many students, we have data for millions of testing events. With this data, we are able to calculate growth norms. In other words, we can approximate how much growth is typical for students at different achievement levels in different grades from one time period to another. Thus we can provide a score that is a fair representation of just how well a student is growing. We can also report growth for groups of students—for example, a class, grade, or school as a whole—by calculating the group’s median, or middle, growth percentile.
We collect data for our growth norms during three different time periods: fall, winter, and spring. Therefore, we can provide student growth percentiles only for achievement that takes place between fall and winter, winter and spring, and fall and spring. To see SGPs, students must be tested within the following date ranges:
We recommend that you do universal screening during these testing windows. For example, fall screening could be scheduled for September 1 to September 15. Winter screening could be scheduled for January 1 to January 15, and spring screening could be scheduled for May 1 to May 15. This ensures that every student will be tested during

79
Measuring Growth
a period for which the software reports student growth percentiles. (Remember to set screening dates in the software; the appendix provides instructions.)
Before you run a Growth Report, the software asks you to choose an SPG window for the pretest and an SPG window for the posttest. If a student has taken more than one test within the window for the pretest, the software will use data from the first test taken. If the student took more than one test within the window for the posttest, the software will use data from the last test taken. For example, let’s say a teacher wants to look at growth between fall and winter. Her students took three tests during the fall SGP window (August 15 to October 15) and three tests during the winter SGP window (December 15 to February 15). In this situation, the software uses the first fall test as the pretest and the last winter test as the posttest.
Take a look at the Growth Report for Mr. Westby’s seventh-grade class, which is below. He is looking at growth between fall and spring. The first student listed, Katrina Bailey, had a scaled score of 980 in September and a scaled score of 1015 in May. That gave her a student growth percentile of 49, which means she grew more than 49 percent of seventh-graders who had a similar scaled score during the fall testing window. Now look at the data for Miranda Douglas. Her scaled score was 466 in September and 589 in May. Her student growth percentile of 72 means her growth exceeded that of 72 percent of her academic peers. In other words, even though Miranda’s overall achievement is lower than Katrina’s, her growth was much greater in relation to her academic peers.
Measure student progress between
two testing sessions.
Examples of growth and longitudinal reports with STAR Math data are in the appendix.
The student growth percentile tells you
how much a student has grown in relation to
academic peers.

Getting the Most out of STAR Reading Enterprise and STAR Math Enterprise
80
Notice that a student growth percentile is not shown for Rayette Petersen. This is because the software does not have enough data. For example, if you look at the test date column, you’ll see that Rayette did not take a test during the fall testing window; perhaps she didn’t enroll until midyear. In this case, Mr. Westby could go back into the software and choose the winter testing window for the pretest and the spring window as the posttest. Using data from those two tests, the software will be able to calculate Rayette’s SPG. If a student has taken only one or no tests during the school year, no growth data can be reported.
The Growth Report below is a district-level report showing data for third-, fourth-, and fifth-grade classes in three elementary schools. In this case, the student growth percentile is a median score. For example, Vivian Olson’s class has 29 students. The SGP of 57 is the middle score; that is, 14 students had an SGP that was higher, and 14 students had an SGP that was lower. If the number of students in a class is an even number, the median is the average of the two middle scores.
Administrators can view growth data for
a class, grade, or school.
The SGP for a group is the median score.
81
Measuring Growth
Using the Growth ReportThe Growth Report can help teachers answer many important questions:
effectiveness of my curriculum and instruction?
Did my implementation strategies lead to greater growth?
Growth Report data can help administrators with similar questions:
does that say about our core curriculum, intervention strategies and programs, and/or needs for professional development?
Comparing School-Year Progress to National Norms
The Annual Progress Report shows you how a class or an individual is progressing compared to students nationally. Take a look, for example, at the report on page 82. It shows the performance of an individual student during the course of a school year. The blue diamonds represent a student’s average scaled score for each testing event. The green lines represent the progress of students in the 25th, 50th, and 75th percentile in the same grade in a national sample. After a student takes two STAR Reading or STAR Math tests, a black trend line appears. Details are presented below the graph.
In this example, Anya has made steady progress. In September, her average scaled score of 341 put her in the 24th percentile for fourth-graders. By June, with an average scaled score of 567, Anya had moved to the 52nd percentile. An Annual Progress Report for a class looks similar and displays the same type of data.
You may be thinking that this report looks like the Student Progress Monitoring Report that we described in Chapter 4. While it’s true they both show progress with a trend line, there are important differences. First of all, the Student Progress Monitoring Report is intended for monitoring individual students in an intervention. Secondly, it shows progress toward an individualized goal that you set in the software. In contrast, the Annual Progress Report can be run for either a student or a class. It’s a suitable report for measuring the progress of any student, and it shows overall growth rather than growth toward a specific individualized goal.
Questions a teacher might ask herself as she views this report include:
below average compared to students nationwide?
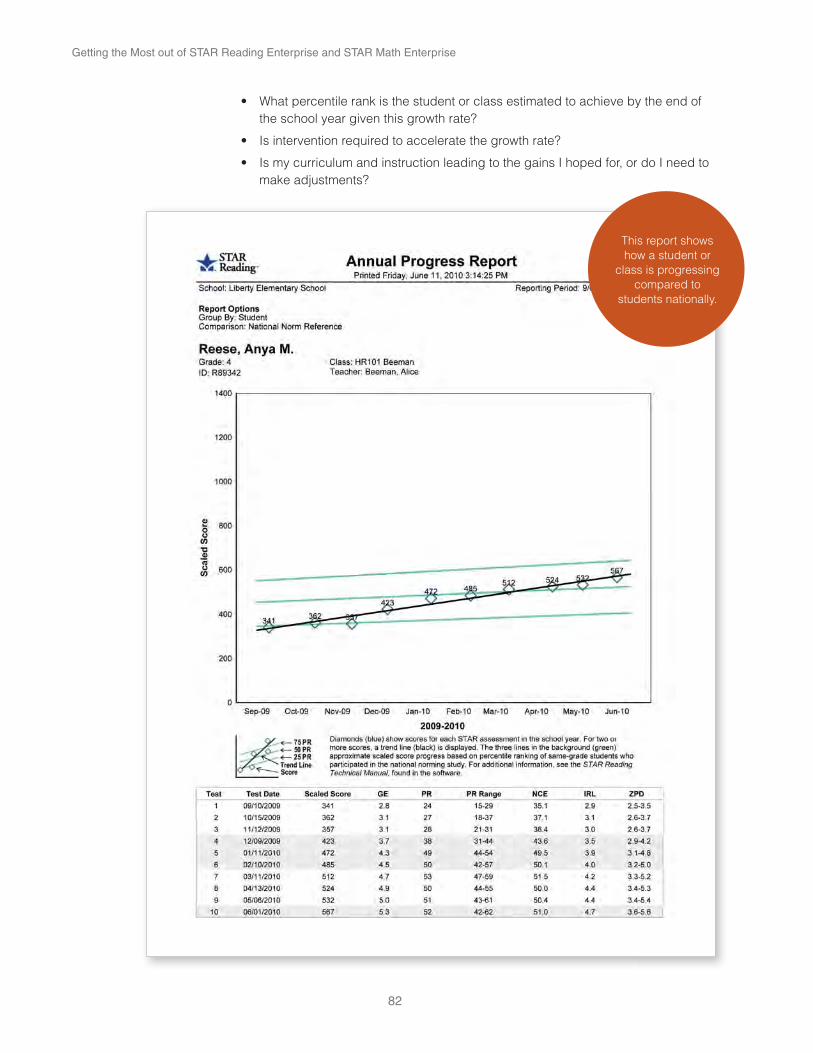
Getting the Most out of STAR Reading Enterprise and STAR Math Enterprise
82
the school year given this growth rate?
make adjustments?
This report shows how a student or
class is progressing compared to
students nationally.
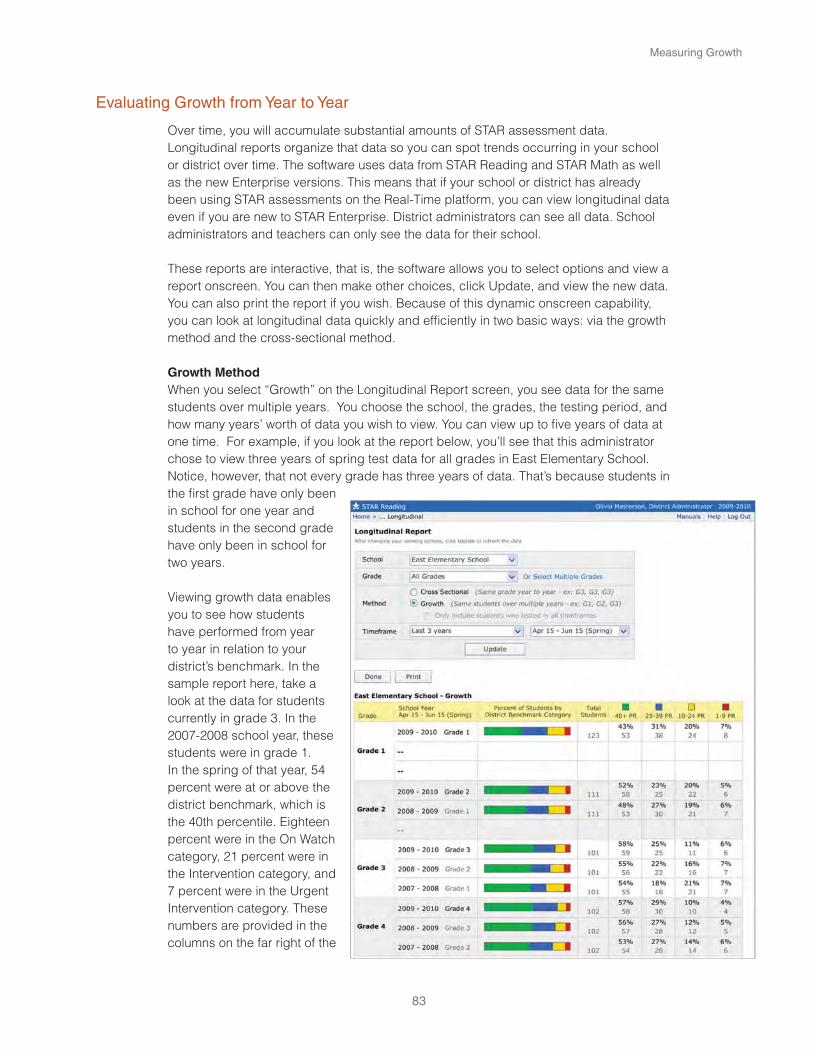
83
Measuring Growth
Evaluating Growth from Year to Year
Over time, you will accumulate substantial amounts of STAR assessment data. Longitudinal reports organize that data so you can spot trends occurring in your school or district over time. The software uses data from STAR Reading and STAR Math as well as the new Enterprise versions. This means that if your school or district has already been using STAR assessments on the Real-Time platform, you can view longitudinal data even if you are new to STAR Enterprise. District administrators can see all data. School administrators and teachers can only see the data for their school.
These reports are interactive, that is, the software allows you to select options and view a report onscreen. You can then make other choices, click Update, and view the new data. You can also print the report if you wish. Because of this dynamic onscreen capability, you can look at longitudinal data quickly and efficiently in two basic ways: via the growth method and the cross-sectional method.
Growth MethodWhen you select “Growth” on the Longitudinal Report screen, you see data for the same students over multiple years. You choose the school, the grades, the testing period, and how many years’ worth of data you wish to view. You can view up to five years of data at one time. For example, if you look at the report below, you’ll see that this administrator chose to view three years of spring test data for all grades in East Elementary School. Notice, however, that not every grade has three years of data. That’s because students in the first grade have only been in school for one year and students in the second grade have only been in school for two years.
Viewing growth data enables you to see how students have performed from year to year in relation to your district’s benchmark. In the sample report here, take a look at the data for students currently in grade 3. In the 2007-2008 school year, these students were in grade 1. In the spring of that year, 54 percent were at or above the district benchmark, which is the 40th percentile. Eighteen percent were in the On Watch category, 21 percent were in the Intervention category, and 7 percent were in the Urgent Intervention category. These numbers are provided in the columns on the far right of the

Getting the Most out of STAR Reading Enterprise and STAR Math Enterprise
84
report and are also represented by the colored bar. In the spring of second grade, in the 2008-2009 school year, the performance of these students improved: 55 percent were at or above the benchmark. In 2009-2010 when they were third-graders, their performance improved again: 58 percent were at or above benchmark.
One caution when analyzing growth data: if you have a transient population, the make-up of a class can change considerably from year to year. For example, one year you might have a large number of high-performing students in a grade and the next year a large number of low-performing students. Such variability can make it difficult to measure the effect of instruction. For this reason, we provide the option to only include on the report students who tested in all timeframes. If you take advantage of this option, keep an eye on the number of students represented so you know how large a group is being measured.
Cross-Sectional MethodWhen you select “Cross Sectional” on the Longitudinal Report screen, you see data for the same grade over multiple years. As with the growth method, you choose the school, grades, how many years’ worth of data you wish to view, and the testing period. In the example below, the administrator has chosen to see spring cross-sectional data for all grades at East Elementary. Looking at first-grade performance over the last three years, we see that in the 2007-2008 school year, 55 percent of first-graders were at or above benchmark. In 2008-2009, 60 percent of first-graders were above benchmark, and in 2009-2010, 57 percent of first-graders were above benchmark.
As with growth data, when you analyze cross-sectional data, keep in mind the make-up of a grade from year to year. In the example shown here, for instance, the first-grade class in 2007-2008 may have included a higher percentage of struggling students at the beginning of the year, which may have resulted in a lower percentage of students above benchmark at the end of the year.

85
Measuring Growth
Using Longitudinal Data to Drive ImprovementLongitudinal data is very helpful when analyzing the effectiveness of instruction. As mentioned in Chapter 2, one of the most powerful activities educators can do together at the school or district level is set concrete goals for improvement and monitor the data.
For example, suppose the faculty at East Elementary School had set a goal in the fall of 2008 to have at least 60 percent of the students in all grades at benchmark within three years. Looking at the cross-sectional data on the Longitudinal Report on the opposite page we see that some grades met that goal. What did they do right? Grade 4 didn’t meet the goal. What might they learn from the teachers in the other grades? Are their instructional materials doing the job? Is the curriculum rigorous enough? Are teachers getting what they hoped to out of their intervention strategies and programs? These are the kinds of questions longitudinal data can raise. Answering them leads to hypotheses about how to improve student learning. Instruction can be modified to test those hypotheses, and data analyzed again to see if the modifications had a positive impact.
Access to longitudinal data also helps you set goals for a particular set of students, take action, and monitor progress. For example, looking at the growth data on the Longitudinal Report on page 83, we see that only 43 percent of the 2009-2010 first-graders are at or above benchmark. Grade 2 teachers might set a goal to have at least 50 percent of those students reach benchmark by the end of second grade. Following that decision, they can plan how they will meet the goal and what data they will look at during the course of the next school year to monitor their progress.
Similar questions can be asked at the district level: Are students in certain schools growing at a faster rate than students in other schools? Why might this be? How might teachers in high-achieving schools share successful strategies? Do students in certain grades throughout the district grow more or less than students in other grades? If so, have teachers work collaboratively to identify strengths and weaknesses and plan instructional or curricular changes.
Instructional Change
When faced with the need to modify instruction to increase student learning, the What Works Clearinghouse suggests the following as examples of the kinds of changes you may choose to implement:
with which students are struggling.
up essential skills with which students are struggling.
to receive additional help with particular skills.
difficult or complex concepts, especially based on best practices identified by teaching colleagues.
expectations among classrooms or between grade levels.
among grade levels.
Using Student Achievement Data to Support Instructional Decision Making, What Works Clearinghouse, U.S. Department of Education Institute of Education Sciences, September 2009
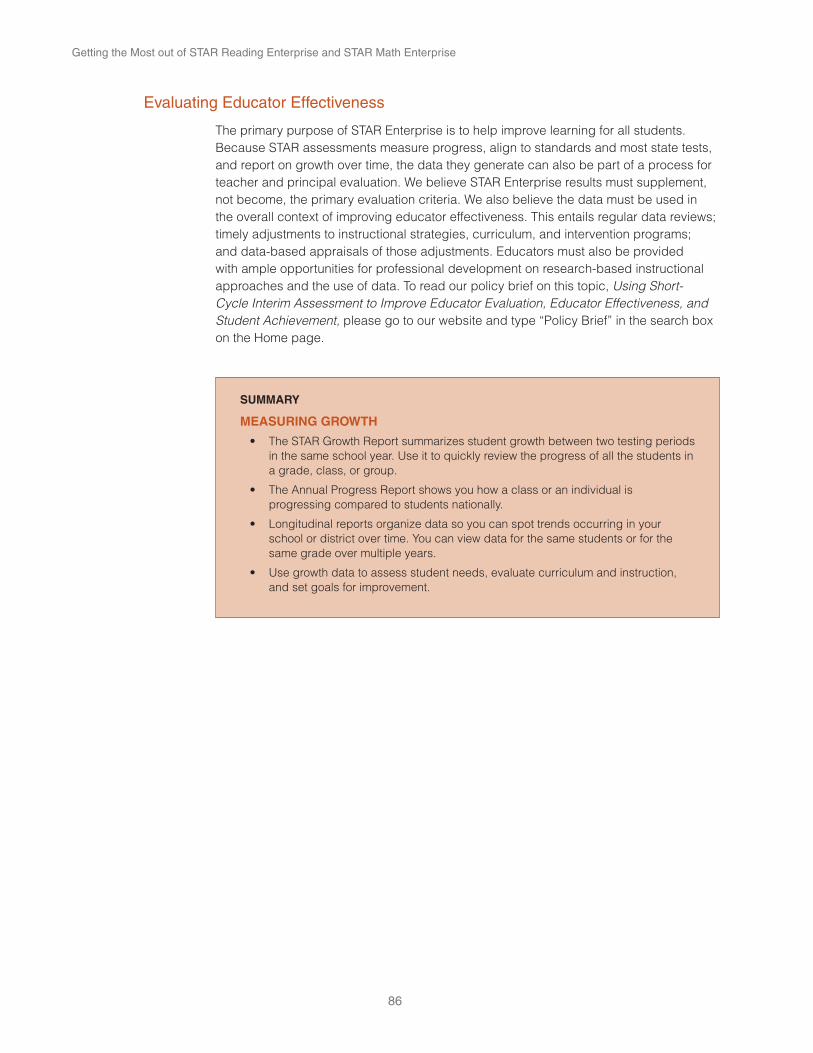
Getting the Most out of STAR Reading Enterprise and STAR Math Enterprise
86
Evaluating Educator Effectiveness
The primary purpose of STAR Enterprise is to help improve learning for all students. Because STAR assessments measure progress, align to standards and most state tests, and report on growth over time, the data they generate can also be part of a process for teacher and principal evaluation. We believe STAR Enterprise results must supplement, not become, the primary evaluation criteria. We also believe the data must be used in the overall context of improving educator effectiveness. This entails regular data reviews; timely adjustments to instructional strategies, curriculum, and intervention programs; and data-based appraisals of those adjustments. Educators must also be provided with ample opportunities for professional development on research-based instructional approaches and the use of data. To read our policy brief on this topic, Using Short-Cycle Interim Assessment to Improve Educator Evaluation, Educator Effectiveness, and Student Achievement, please go to our website and type “Policy Brief” in the search box on the Home page.
SUMMARY
MEASURING GROWTH
in the same school year. Use it to quickly review the progress of all the students in a grade, class, or group.
progressing compared to students nationally.
school or district over time. You can view data for the same students or for the same grade over multiple years.
and set goals for improvement.
87
oCommon Questions
Do my students need to be supervised while they take a STAR test?Yes! For results to be valid, STAR assessments must be administered consistently. A standard administration ensures that results can be compared to norms. A test administrator needs to make sure that the testing environment is free of distractions. Prior to each student’s first test, the test administrator must also follow the pretest instructions that are included in the software. To periodically remind students of testing procedures, it’s a good idea to use the pretest instructions during each screening period. When students take additional tests, administrators can use their judgment to decide whether or not students need to hear the instructions again. We also recommend that the test administrator walk around the room as students are testing. This keeps students on task and can shorten test time.
Can I help students with the practice questions?In general, no. One of the purposes of the practice questions is to screen out students who are not yet able to take the test independently either because they don’t have the reading or math skills or are not able to use the mouse or keyboard. If you help with practice questions, these students won’t be identified. The one exception may be reading STAR Math Enterprise items to students who are not able to decode the words, which we talk about below.
Can I read STAR Math Enterprise test items to my primary students?You may read STAR Math Enterprise test items to any students who need help decoding the words. You may not, however, define or explain words. For example, you could pronounce the word “triangle,” but must not say “It’s a shape with three sides” or point to an image of a triangle. We have no evidence that reading math test items aloud affects scores. However, since items were not read to the norming sample, we must caution you that doing so is a nonstandard administration and technically the norms may not apply. We also recommend that you note in the student’s and school’s records that items were read aloud.
In the fall, we administer STAR Early Literacy to assess the prereading skills of our kindergarten and first-grade students. What should we do mid-year once some students begin to read independently?If your purpose for testing is to plan for intervention, prioritize student need, and evaluate the effectiveness of your instruction, it makes sense to move students into STAR Reading Enterprise when they are ready. These assessments will give you the best measure of the students’ current capabilities. If you are using screening reports to track the growth of a grade as a whole, you may want to give STAR Early Literacy to all kindergarten and first-grade students throughout the year and also give STAR Reading Enterprise to those who are able to take it. STAR Early Literacy will give you a consistent set of data for comparing the number of students above and below benchmark from one screening period to the next.

Getting the Most out of STAR Reading Enterprise and STAR Math Enterprise
88
When I test kindergarten students who read independently with STAR Reading Enterprise or STAR Math Enterprise, I don’t see all the scores on reports. Why is that?Because kindergarten students were not in the norming samples, STAR assessments cannot provide norm-referenced scores such as percentile rank. However, it will provide scaled scores, grade-equivalent scores, instructional reading levels, ZPDs, level of mastery within the numeration and computation objectives, and a recommended Accelerated Math library.
Some of my students have IEPs that indicate they must be given extra time when taking tests. How do I do that with STAR Enterprise tests?You have the option of extending time limits for individual students who you believe need more time to read and answer each question—English language learners, for example, or students with special needs. When taking STAR Reading Enterprise, these students will then have three times longer to answer each question; when taking STAR Math Enterprise, they will have twice as long. Instructions for making this adjustment are in the appendix.
Why can’t my students use calculators when they take STAR Math?During the STAR Math norming study, students were allowed to use blank work paper and a pencil but not calculators or reference materials. In order for normative scores to be meaningful, your students must take the test in the same way.
How can my state test be linked to STAR Math if students are allowed to use calculators for the state test but not for STAR Math?Linking studies show the relationship between tests however they were normed. That means the norming conditions of the two tests can be different. For scores to be valid, students must replicate the conditions of whichever test they are presently taking.
I teach an evening class of high school dropouts. What grade level do I indicate for them?The purpose of entering a grade level is to make sure a student is not immediately frustrated by items that are too difficult. If you can estimate the student’s reading or math level, enter that grade. Otherwise, a good rule of thumb is to enter the last grade in which the student was enrolled.
Sometimes my students accidently close the Web browser and the test disappears. Is there a way to go back in or do they have to start the test over?If students close the Web browser or otherwise lose connection to the server, they can log in again and resume the test where they left off. However, they can resume an unfinished test only once, and it must be done within 48 hours. After students log in again, they will see a message to click the Start button to restart the test. After clicking, a dialog box opens and you will need to enter the monitor password.
What should I do if a test is interrupted by a fire drill or some other unexpected event, and we can’t reschedule it right away?You can stop a student’s test by pressing Ctrl+A (Windows) or control+A (Macintosh). Then you must enter the monitor password. If a test is purposefully stopped (rather than closed accidentally or through a lost connection), the student cannot complete it later. The student can, however, take a new test. The software will not record a score for the stopped test.

89
Common Questions
Is it okay to retest a student if I know he or she can do better?If you are considering retesting students, first evaluate whether or not you are administering the test with fidelity. Because important decisions are made using test data, such as curriculum changes and placement in intervention programs, it’s critical that students take STAR Enterprise assessments seriously and under optimal conditions. Are you providing an environment free of distractions? Have you talked to students about why they are being tested? Do you show students their scaled scores and encourage them to increase their score with each test? If you are doing all these things and still have a student who you know has rushed through a test or not taken it seriously, the student can take the test again. If the student retests before midnight on the same day, only the most recent test data will be used in score calculations and show up on reports. (The exception is the Test Record Report, which displays a history of all tests.) However, if a student retests after midnight, the second test will be treated as a separate test. If a student tests more than once during a screening period, data from the last test taken is shown on reports.
Why can’t I see which questions a student missed?With computer-adaptive tests, the student’s performance on individual items is not as meaningful as the pattern of responses to the entire test. See page 7 for an explanation of how STAR test scores are calculated.
I intervene with students one-on-one. Do I need to create a separate group for each student?No. In this case, you can create one group with a title such as “Individual tutoring” and add all the students to that group. This will make it convenient for you to view reports.
Since the STAR Reading and STAR Math tests are shorter than the Enterprise versions, can I use them for weekly progress monitoring?You do have the option of using either test type, but we recommend that you use STAR Enterprise for all testing events, if possible. The Enterprise test provides more precise data that can be used for more purposes. For example, only by administering the Enterprise test can you generate an Instructional Planning Report or estimate mastery of state standards. Using this test type also makes it easier to compare results over time. Generally speaking, we’ve found that testing time shortens as students become familiar with the Enterprise test.
Why can’t the software automatically set a goal for each student in my intervention group?For a goal to be appropriate, it must be individualized. It’s critical that you take into account each student’s academic history, experience with previous interventions, and other unique characteristics, such as English language proficiency, as well as the intensity of the planned intervention. While the software “knows” the growth rates achieved by students performing at a similar level of reading proficiency, only you know these other factors and how they may influence a student’s growth.

Getting the Most out of STAR Reading Enterprise and STAR Math Enterprise
90
I use Accelerated Reader and set individual goals for my students there. Do I need to set goals in STAR Reading, too?In Accelerated Reader software you set goals for the quantity, quality, and difficulty of a student’s independent reading practice. These are marking-period goals that ensure students get an appropriate amount of practice at the right level of difficulty, and we recommend that you set these goals with every student. STAR Reading goals are different. They are goals for overall reading proficiency and are usually set only for students in intervention.
Why don’t I set a progress goal in the software for every student?The purpose for setting a goal is to measure a student’s response to an intervention. You set a goal, you prescribe an intervention, and then you evaluate the effectiveness of the intervention by seeing whether or not the student is making progress toward the goal. Therefore, you only set goals for students in intervention.
When I run an Instructional Planning Report, I see there is an option to adjust the difficulty of the skills that will be shown. Why would I do this?When you run an Instructional Planning Report, it shows the skills a student is ready to learn next. As we explained in Chapter 5, we are able to do this by mapping the student’s scaled score to the learning progression. Our estimate of what the student is ready to learn next is based on extensive research and the test data of millions of students nationwide. However, based on your knowledge of an individual student, you may feel that the skills presented on the report are not appropriate. If so, you can ask the software to show you harder or easier skills along the progression. The numbers you see on the Options screen indicate how far up or down on the learning progression you would like to move. For example, if you select +1, the software will show skills on the Instructional Planning Report that are higher on the learning progression. If you select +2, even higher skills will be shown. Conversely if you select -1, the software will show skills that are lower on the progression, and so on.
Can I see STAR Reading scores in Lexiles?You have the option of seeing STAR Reading scores on a 2,000-point scale, which is similar to Lexiles, on the following reports: Screening, Progress Monitoring, Summary, Growth, Parent (in English and Spanish), Score Definition, Reading Range, Snapshot, Diagnostic, and Test Record. To do so, select ATOS 2000 on the Options screen.
Why aren’t a student’s IRL and GE scores on STAR Reading Enterprise the same?You’ll frequently find that a student’s instructional reading level (IRL) and grade-equivalent score are different. This is because the level at which students perform is not always the same as the level at which we want them to perform. As a reminder, the instructional reading level is a criterion-referenced score that tells you how a student is doing according to commonly accepted standards, and is the level at which a student can most effectively be taught. The grade-equivalent score is a norm-referenced score that tells you how a student is doing compared to students nationwide. So let’s suppose a third-grade student has an IRL of 3.5, indicating that she can likely recognize 90 to 98 percent of the words and comprehend 80 percent of the text that students in the fifth month of third grade are expected to recognize and comprehend. Her GE may be somewhat higher—let’s say, 4.0. This would tell us that having the ability to read text at a 3.5 level with instructional assistance is actually about average for fourth-graders at the beginning of the school year.

A1
AppendixInstructions for Common Software Tasks . . . . . . . . . . . . . . . . . . . . . . . . . . . . . . . . . A2
Sample Letter to Parents for an RTI Program . . . . . . . . . . . . . . . . . . . . . . . . . . . . . A11
List of All STAR Reports . . . . . . . . . . . . . . . . . . . . . . . . . . . . . . . . . . . . . . . . . . . . . A13
Examples of STAR Reading Enterprise Reports and Software Pages . . . . . . . . . . A15
Examples of STAR Math Enterprise Reports and Software Pages . . . . . . . . . . . . . A43
Index. . . . . . . . . . . . . . . . . . . . . . . . . . . . . . . . . . . . . . . . . . . . . . . . . . . . . . . . . . . . A68
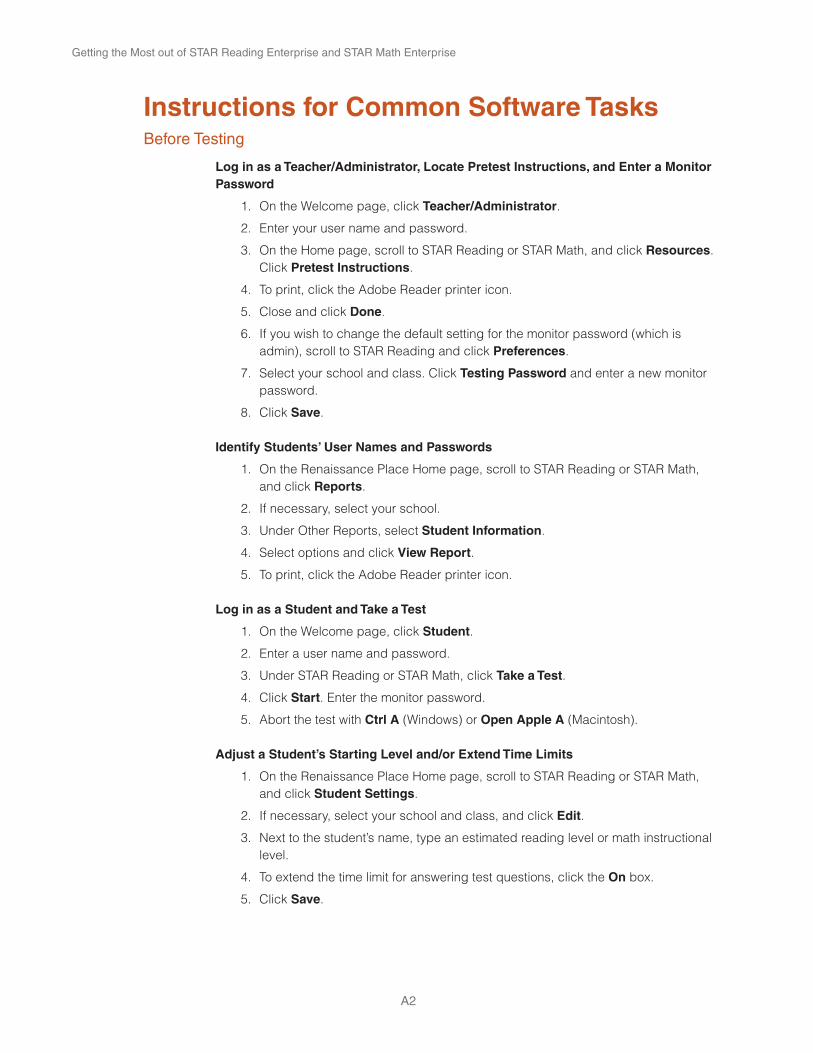
Getting the Most out of STAR Reading Enterprise and STAR Math Enterprise
A2
Instructions for Common Software TasksBefore Testing
Log in as a Teacher/Administrator, Locate Pretest Instructions, and Enter a Monitor Password
1. On the Welcome page, click Teacher/Administrator.
2. Enter your user name and password.
3. On the Home page, scroll to STAR Reading or STAR Math, and click Resources. Click Pretest Instructions.
4. To print, click the Adobe Reader printer icon.
5. Close and click Done.
6. If you wish to change the default setting for the monitor password (which is admin), scroll to STAR Reading and click Preferences.
7. Select your school and class. Click Testing Password and enter a new monitor password.
8. Click Save.
Identify Students’ User Names and Passwords
1. On the Renaissance Place Home page, scroll to STAR Reading or STAR Math, and click Reports.
2. If necessary, select your school.
3. Under Other Reports, select Student Information.
4. Select options and click View Report.
5. To print, click the Adobe Reader printer icon.
Log in as a Student and Take a Test
1. On the Welcome page, click Student.
2. Enter a user name and password.
3. Under STAR Reading or STAR Math, click Take a Test.
4. Click Start. Enter the monitor password.
5. Abort the test with Ctrl A (Windows) or Open Apple A (Macintosh).
Adjust a Student’s Starting Level and/or Extend Time Limits
1. On the Renaissance Place Home page, scroll to STAR Reading or STAR Math, and click Student Settings.
2. If necessary, select your school and class, and click Edit.
3. Next to the student’s name, type an estimated reading level or math instructional level.
4. To extend the time limit for answering test questions, click the On box.
5. Click Save.
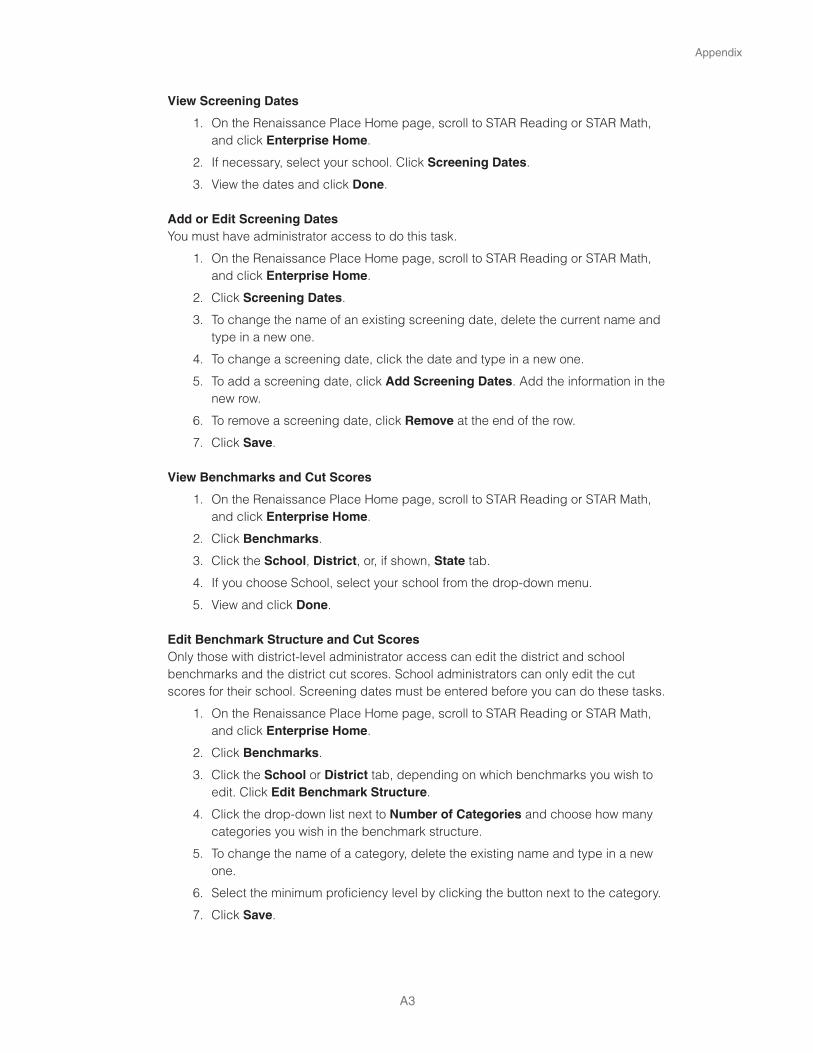
Appendix
A3
View Screening Dates
1. On the Renaissance Place Home page, scroll to STAR Reading or STAR Math, and click Enterprise Home.
2. If necessary, select your school. Click Screening Dates.
3. View the dates and click Done.
Add or Edit Screening DatesYou must have administrator access to do this task.
1. On the Renaissance Place Home page, scroll to STAR Reading or STAR Math, and click Enterprise Home.
2. Click Screening Dates.
3. To change the name of an existing screening date, delete the current name and type in a new one.
4. To change a screening date, click the date and type in a new one.
5. To add a screening date, click Add Screening Dates. Add the information in the new row.
6. To remove a screening date, click Remove at the end of the row.
7. Click Save.
View Benchmarks and Cut Scores
1. On the Renaissance Place Home page, scroll to STAR Reading or STAR Math, and click Enterprise Home.
2. Click Benchmarks.
3. Click the School, District, or, if shown, State tab.
4. If you choose School, select your school from the drop-down menu.
5. View and click Done.
Edit Benchmark Structure and Cut ScoresOnly those with district-level administrator access can edit the district and school benchmarks and the district cut scores. School administrators can only edit the cut scores for their school. Screening dates must be entered before you can do these tasks.
1. On the Renaissance Place Home page, scroll to STAR Reading or STAR Math, and click Enterprise Home.
2. Click Benchmarks.
3. Click the School or District tab, depending on which benchmarks you wish to edit. Click Edit Benchmark Structure.
4. Click the drop-down list next to Number of Categories and choose how many categories you wish in the benchmark structure.
5. To change the name of a category, delete the existing name and type in a new one.
6. Select the minimum proficiency level by clicking the button next to the category.
7. Click Save.

Getting the Most out of STAR Reading Enterprise and STAR Math Enterprise
A4
8. On the View Benchmarks page, click the School or District tab, depending on which benchmarks you wish to edit. If you click School, select a school from the drop-down list. Click Edit Cut Scores.
9. Use the drop-down lists to change the PR values for each grade. The values for some categories will be automatically calculated based on the scores you choose for the other categories.
10. Click Save.
Edit Non-Linked Grades for State BenchmarksYou must have district-administrator access and enter screening dates before you can do this task.
1. On the Renaissance Place Home page, scroll to STAR Reading or STAR Math, and click Enterprise Home.
2. Click Benchmarks.
3. Click the tab for State.
4. Click Edit Non-linked Grades.
5. Enter scaled scores in the fields with zeroes, or click Recommended Scores to have the software calculate and enter scaled scores for you. Make sure all fields have values between 2 and 1400.
6. Click Save.
Set Default BenchmarkYou must have administrator access and enter screening dates before you can do this task.
1. On the Renaissance Place Home page, scroll to STAR Reading or STAR Math and click Enterprise Home.
2. Click Benchmarks.
3. Click Edit Default Benchmark.
4. If you are a district administrator and you want to allow school administrators to choose their default benchmark, click Allow school administrators to set. If you want to choose the default benchmark yourself, click Apply the following to all schools. Select one of the benchmarks listed.
5. If you are a school administrator and have been allowed to choose a default benchmark, select one of the benchmarks listed.
6. Click Save.
Change the Test TypeYou must have administrator access to change the version of the STAR assessment that students will take.
1. On the Renaissance Place Home page, scroll to STAR Reading or STAR Math, and click Preferences.
2. If necessary, select the school and class. Click Test Type.
3. Select the Enterprise test or the original STAR test.
4. Click Save.
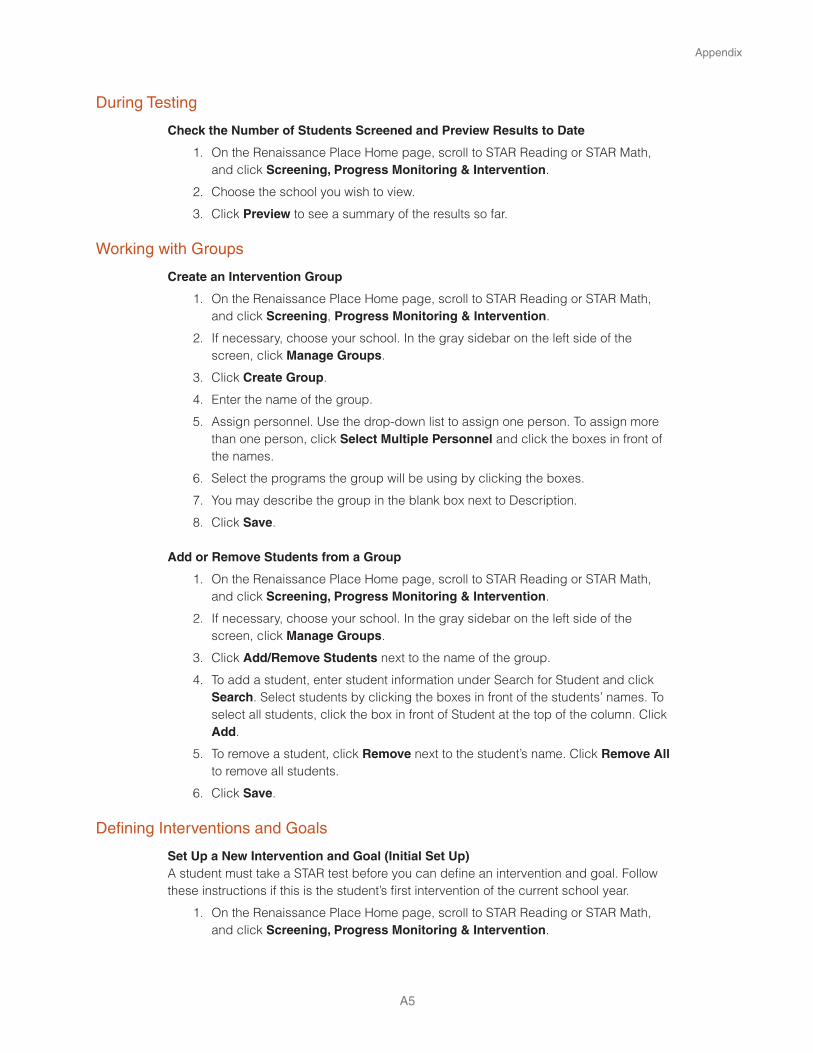
Appendix
A5
During Testing
Check the Number of Students Screened and Preview Results to Date
1. On the Renaissance Place Home page, scroll to STAR Reading or STAR Math, and click Screening, Progress Monitoring & Intervention.
2. Choose the school you wish to view.
3. Click Preview to see a summary of the results so far.
Working with Groups
Create an Intervention Group
1. On the Renaissance Place Home page, scroll to STAR Reading or STAR Math, and click Screening, Progress Monitoring & Intervention.
2. If necessary, choose your school. In the gray sidebar on the left side of the screen, click Manage Groups.
3. Click Create Group.
4. Enter the name of the group.
5. Assign personnel. Use the drop-down list to assign one person. To assign more than one person, click Select Multiple Personnel and click the boxes in front of the names.
6. Select the programs the group will be using by clicking the boxes.
7. You may describe the group in the blank box next to Description.
8. Click Save.
Add or Remove Students from a Group
1. On the Renaissance Place Home page, scroll to STAR Reading or STAR Math, and click Screening, Progress Monitoring & Intervention.
2. If necessary, choose your school. In the gray sidebar on the left side of the screen, click Manage Groups.
3. Click Add/Remove Students next to the name of the group.
4. To add a student, enter student information under Search for Student and click Search. Select students by clicking the boxes in front of the students’ names. To select all students, click the box in front of Student at the top of the column. Click Add.
5. To remove a student, click Remove next to the student’s name. Click Remove All to remove all students.
6. Click Save.
Defining Interventions and Goals
Set Up a New Intervention and Goal (Initial Set Up)A student must take a STAR test before you can define an intervention and goal. Follow these instructions if this is the student’s first intervention of the current school year.
1. On the Renaissance Place Home page, scroll to STAR Reading or STAR Math, and click Screening, Progress Monitoring & Intervention.
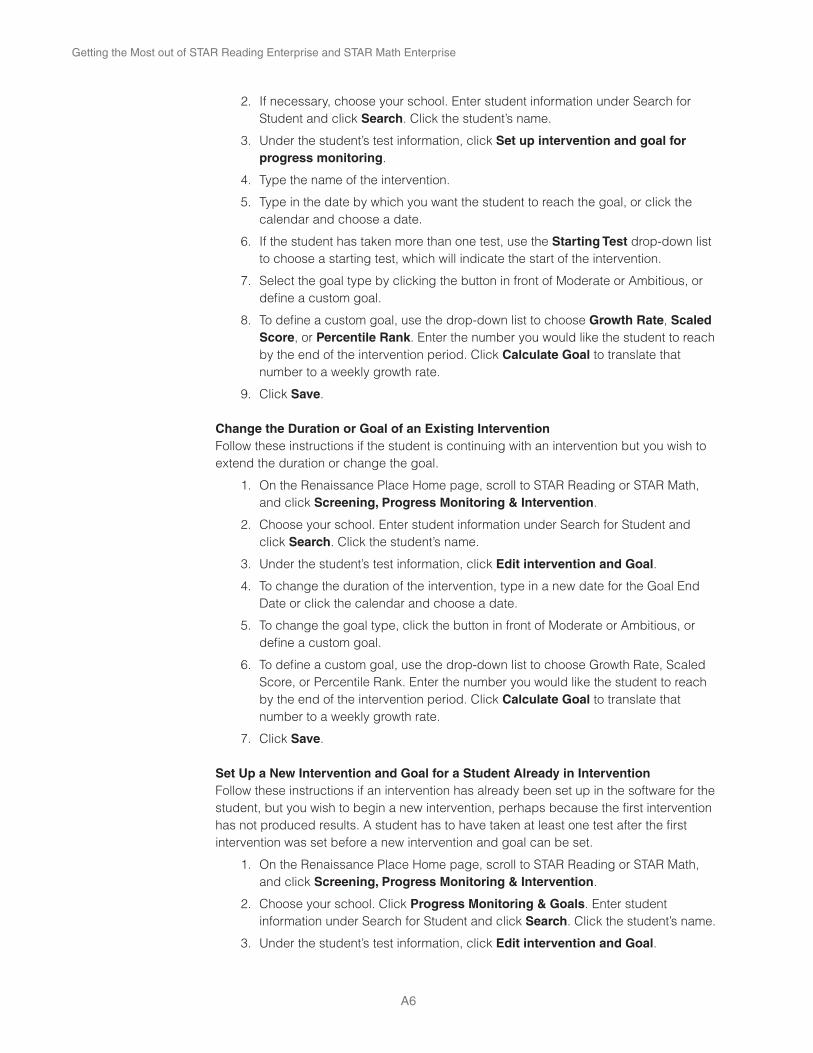
Getting the Most out of STAR Reading Enterprise and STAR Math Enterprise
A6
2. If necessary, choose your school. Enter student information under Search for Student and click Search. Click the student’s name.
3. Under the student’s test information, click Set up intervention and goal for progress monitoring.
4. Type the name of the intervention.
5. Type in the date by which you want the student to reach the goal, or click the calendar and choose a date.
6. If the student has taken more than one test, use the Starting Test drop-down list to choose a starting test, which will indicate the start of the intervention.
7. Select the goal type by clicking the button in front of Moderate or Ambitious, or define a custom goal.
8. To define a custom goal, use the drop-down list to choose Growth Rate, Scaled Score, or Percentile Rank. Enter the number you would like the student to reach by the end of the intervention period. Click Calculate Goal to translate that number to a weekly growth rate.
9. Click Save.
Change the Duration or Goal of an Existing InterventionFollow these instructions if the student is continuing with an intervention but you wish to extend the duration or change the goal.
1. On the Renaissance Place Home page, scroll to STAR Reading or STAR Math, and click Screening, Progress Monitoring & Intervention.
2. Choose your school. Enter student information under Search for Student and click Search. Click the student’s name.
3. Under the student’s test information, click Edit intervention and Goal.
4. To change the duration of the intervention, type in a new date for the Goal End Date or click the calendar and choose a date.
5. To change the goal type, click the button in front of Moderate or Ambitious, or define a custom goal.
6. To define a custom goal, use the drop-down list to choose Growth Rate, Scaled Score, or Percentile Rank. Enter the number you would like the student to reach by the end of the intervention period. Click Calculate Goal to translate that number to a weekly growth rate.
7. Click Save.
Set Up a New Intervention and Goal for a Student Already in InterventionFollow these instructions if an intervention has already been set up in the software for the student, but you wish to begin a new intervention, perhaps because the first intervention has not produced results. A student has to have taken at least one test after the first intervention was set before a new intervention and goal can be set.
1. On the Renaissance Place Home page, scroll to STAR Reading or STAR Math, and click Screening, Progress Monitoring & Intervention.
2. Choose your school. Click Progress Monitoring & Goals. Enter student information under Search for Student and click Search. Click the student’s name.
3. Under the student’s test information, click Edit intervention and Goal.
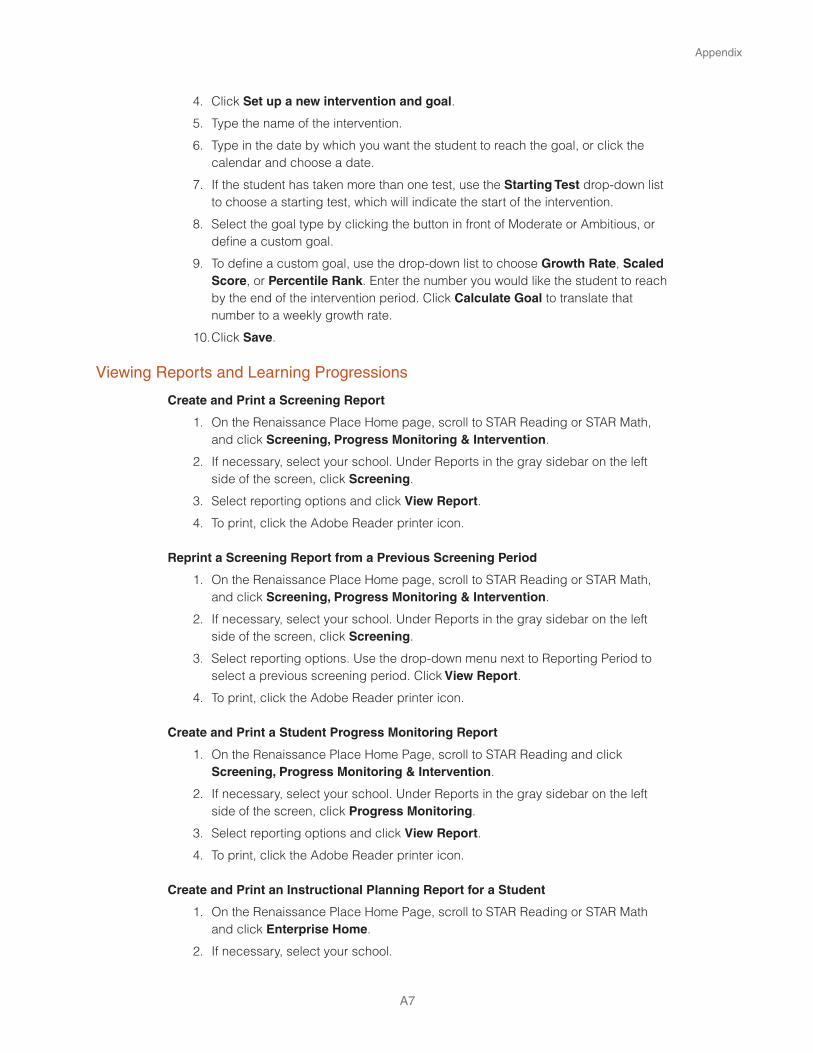
Appendix
A7
4. Click Set up a new intervention and goal.
5. Type the name of the intervention.
6. Type in the date by which you want the student to reach the goal, or click the calendar and choose a date.
7. If the student has taken more than one test, use the Starting Test drop-down list to choose a starting test, which will indicate the start of the intervention.
8. Select the goal type by clicking the button in front of Moderate or Ambitious, or define a custom goal.
9. To define a custom goal, use the drop-down list to choose Growth Rate, Scaled Score, or Percentile Rank. Enter the number you would like the student to reach by the end of the intervention period. Click Calculate Goal to translate that number to a weekly growth rate.
10. Click Save.
Viewing Reports and Learning Progressions
Create and Print a Screening Report
1. On the Renaissance Place Home page, scroll to STAR Reading or STAR Math, and click Screening, Progress Monitoring & Intervention.
2. If necessary, select your school. Under Reports in the gray sidebar on the left side of the screen, click Screening.
3. Select reporting options and click View Report.
4. To print, click the Adobe Reader printer icon.
Reprint a Screening Report from a Previous Screening Period
1. On the Renaissance Place Home page, scroll to STAR Reading or STAR Math, and click Screening, Progress Monitoring & Intervention.
2. If necessary, select your school. Under Reports in the gray sidebar on the left side of the screen, click Screening.
3. Select reporting options. Use the drop-down menu next to Reporting Period to select a previous screening period. Click View Report.
4. To print, click the Adobe Reader printer icon.
Create and Print a Student Progress Monitoring Report
1. On the Renaissance Place Home Page, scroll to STAR Reading and click Screening, Progress Monitoring & Intervention.
2. If necessary, select your school. Under Reports in the gray sidebar on the left side of the screen, click Progress Monitoring.
3. Select reporting options and click View Report.
4. To print, click the Adobe Reader printer icon.
Create and Print an Instructional Planning Report for a Student
1. On the Renaissance Place Home Page, scroll to STAR Reading or STAR Math and click Enterprise Home.
2. If necessary, select your school.
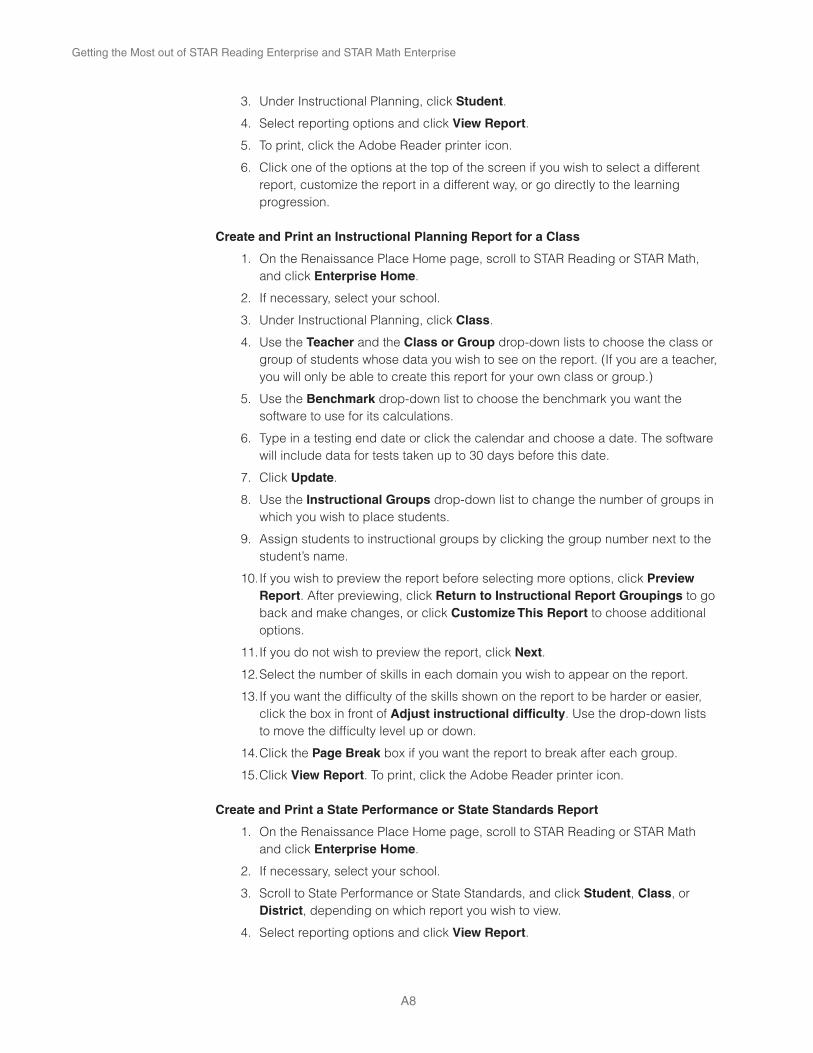
Getting the Most out of STAR Reading Enterprise and STAR Math Enterprise
A8
3. Under Instructional Planning, click Student.
4. Select reporting options and click View Report.
5. To print, click the Adobe Reader printer icon.
6. Click one of the options at the top of the screen if you wish to select a different report, customize the report in a different way, or go directly to the learning progression.
Create and Print an Instructional Planning Report for a Class
1. On the Renaissance Place Home page, scroll to STAR Reading or STAR Math, and click Enterprise Home.
2. If necessary, select your school.
3. Under Instructional Planning, click Class.
4. Use the Teacher and the Class or Group drop-down lists to choose the class or group of students whose data you wish to see on the report. (If you are a teacher, you will only be able to create this report for your own class or group.)
5. Use the Benchmark drop-down list to choose the benchmark you want the software to use for its calculations.
6. Type in a testing end date or click the calendar and choose a date. The software will include data for tests taken up to 30 days before this date.
7. Click Update.
8. Use the Instructional Groups drop-down list to change the number of groups in which you wish to place students.
9. Assign students to instructional groups by clicking the group number next to the student’s name.
10. If you wish to preview the report before selecting more options, click Preview Report. After previewing, click Return to Instructional Report Groupings to go back and make changes, or click Customize This Report to choose additional options.
11. If you do not wish to preview the report, click Next.
12. Select the number of skills in each domain you wish to appear on the report.
13. If you want the difficulty of the skills shown on the report to be harder or easier, click the box in front of Adjust instructional difficulty. Use the drop-down lists to move the difficulty level up or down.
14. Click the Page Break box if you want the report to break after each group.
15. Click View Report. To print, click the Adobe Reader printer icon.
Create and Print a State Performance or State Standards Report
1. On the Renaissance Place Home page, scroll to STAR Reading or STAR Math and click Enterprise Home.
2. If necessary, select your school.
3. Scroll to State Performance or State Standards, and click Student, Class, or District, depending on which report you wish to view.
4. Select reporting options and click View Report.

Appendix
A9
5. To print, click the Adobe Reader printer icon.
Create a Longitudinal Report
1. On the Renaissance Place Home page, scroll to STAR Reading or STAR Math and click Enterprise Home.
2. If necessary, select your school.
3. Under Longitudinal, click Growth or Cross-Sectional.
4. Use the drop-down list to select all grades or a single grade. If you wish to view more than one grade but not all grades, click Select Specific Grades and click the box in front of the grades whose data you wish to view.
5. If you are viewing growth, click the box in front of Only include students who tested in all timeframes if you want to view data for the same group of students from year to year.
6. Use the drop-down lists to choose the timeframe for which you wish to see data. Click Update.
7. If you wish to view data for a different school, grade, or timeframe, or if you wish to view a different version of the report, select those options and click Update again.
8. To print, click Print. When finished with this page, click Done.
View and Print Other Reports
1. On the Renaissance Place Home page, scroll to STAR Reading or STAR Math and click Reports.
2. If necessary, select your school.
3. Click the name of the report you wish to view or print.
4. Select reporting options. Generally, you will select either an individual student or a specific class or group. The date range is usually the entire school year or a fixed period, such as a semester. Click View Report.
5. To print, click the Adobe Reader printer icon.
View the Core Progress Learning Progressions for Reading
1. The learning progressions can be accessed in two ways:
a. On the Renaissance Place Home page, scroll to STAR Reading or STAR Math and click Enterprise Home. Click Learning Progressions.
b. When viewing an Instructional Planning Report, click View Learning Progressions at the top of the page.
2. On the Search page, click the Grades and Domains tab. Click the box(es) in front of grades and domains to indicate the skills you wish to locate. Or click Keyword and type in the name of the skill; use the drop-down list to select grades. Click Search.
3. If you search with Grades and Domains, only focus skills will be shown. If you search with Keyword, you can choose to see all skills or only focus skills.

Getting the Most out of STAR Reading Enterprise and STAR Math Enterprise
A10
4. If a skill is a focus skill, it will appear in blue on the Search Results page. Click the blue plus sign in front of its description to see additional information about the skill. Click the blue minus sign to minimize the information.
5. Click the chalkboard icon to view a teacher activity. Click the paper-and-pencil icon to view a sample item. Click the printer icon to print the skill information.
6. To search for a different skill, click Modify Search at the top of the page.
7. Click the X in the upper-right corner of the page to exit the learning progression.
View the Core Progress Learning Progressions for Math
1. The learning progressions can be accessed in two ways:
a. On the Renaissance Place Home page, scroll to STAR Reading or STAR Math and click Enterprise Home. Click Learning Progressions.
b. When viewing an Instructional Planning Report, click View Learning Progressions at the top of the page.
2. On the Search page, click the Libraries and Learning Progressions tab. Click the box(es) in front of libraries and learning progressions to indicate the skills you wish to locate. Or click Keyword and type in the name of the skill; use the drop-down list to select libraries. Click Search.
3. If you search with Libraries and Learning Progressions, only core objectives will be shown. If you search with Keyword, you can choose to see all objectives or only core objectives.
4. If a skill is a core objective, it will appear in blue on the Search Results page. Click the blue plus sign in front of its description to see additional information about the objective. Click the blue minus sign to minimize the information.
5. Click the icon with an answer in red to view a worked example. Click the icon without an answer to view a sample item. Click the printer icon to print the objective information.
6. To search for a different objective, click Modify Search at the top of the page.
7. Click the X in the upper-right corner of the page to exit the learning progression.

A11
Sample Letter to Parents for an RTI Program
Dear Parent or Guardian,
We have recently completed the benchmark testing that is required by the Response to Intervention program. This assessment is designed to identify whether your child is ready to read on grade level (Tier 1) or whether your child needs additional and/or more intensive reading instruction (Tier 2 or Tier 3). All students in the school will be placed into a skill group in Tier 1, 2, or 3 for a minimum of four cycle days a week. The results of the benchmark testing indicate that your child would benefit from placement in:
_______Tier 1: REGULAR CURRICULUM + enrichment activities
_______Tier 2: REGULAR CURRICULUM + additional instruction
_______Tier 3: REGULAR CURRICULUM + additional, more intensive support
Your child will be placed in a (name of intervention program) skill group starting on (date of start of skill groups). This group will work on the following skill(s):
_______ Early Literacy Skills: This means the skills needed to begin to learn to read. This includes knowing the names and sounds of letters, understanding rhyming, and recognition of the beginning sounds in words. These skills are important because they are necessary before children can learn to read.
_______ Decoding: This means being able to recognize and sound out words. This is important because it is the foundation of reading._______ Fluency: This means reading quickly with few mistakes. This skill is important because students need to be able to read fluently to help them understand what they read._______ Comprehension: This means understanding what was read. This skill is important because the main purpose of reading is to comprehend._______ Enrichment Activities: This means activities that enhance the regular curriculum and expand on information and skills already mastered. This is important for students who have met grade-level goals so that they continue to improve and learn.
During the school year the staff will continue to monitor the progress of your child and you will be notified of the results and recommendations.
If you have any questions about this assessment or the recommendation, kindly contact me. Thank you for your continued interest in your child’s school success.
Sincerely,
School Principal
Source: Project MP3—Monitoring Progress of Pennsylvania Pupils, supported by Grant #H326M050001, a model/demonstration project from the U.S. Department of Education to the Center for Promoting Research to Practice, Lehigh University, Bethlehem, PA, 18015.
Reproducible Form

A12
Sample Letter to Parents for an RTI Program
Dear Parent or Guardian,
We have recently completed the benchmark testing that is required by the Response to Intervention program. This assessment is designed to identify whether your child is ready for math on grade level (Tier 1) or whether your child needs additional and/or more intensive math instruction (Tier 2 or Tier 3). All students in the school will be placed into a skill group in Tier 1, 2, or 3 for a minimum of four cycle days a week. The results of the benchmark testing indicate that your child would benefit from placement in:
_______Tier 1: REGULAR CURRICULUM + enrichment activities
_______Tier 2: REGULAR CURRICULUM + additional instruction
_______Tier 3: REGULAR CURRICULUM + additional, more intensive support
Your child will be placed in a (name of intervention program) skill group starting on (date of start of skill groups). This group will work on the following:
_______ Building Fact Fluency: This includes (give examples of skills). These skills are important because (describe importance). _______ Closing Core Skill Gaps: This includes (give examples of skills). These skills are important because (describe importance). _______ Enrichment Activities: This means activities that enhance the regular curriculum and expand on information and skills already mastered. This is important for students who have met grade-level goals so that they continue to improve and learn.
During the school year the staff will continue to monitor the progress of your child and you will be notified of the results and recommendations.
If you have any questions about this assessment or the recommendation, kindly contact me. Thank you for your continued interest in your child’s school success.
Sincerely,
School Principal
Adapted from: Project MP3—Monitoring Progress of Pennsylvania Pupils, supported by Grant #H326M050001, a model/demonstration project from the U.S. Department of Education to the Center for Promoting Research to Practice, Lehigh University, Bethlehem, PA, 18015.
Reproducible Form
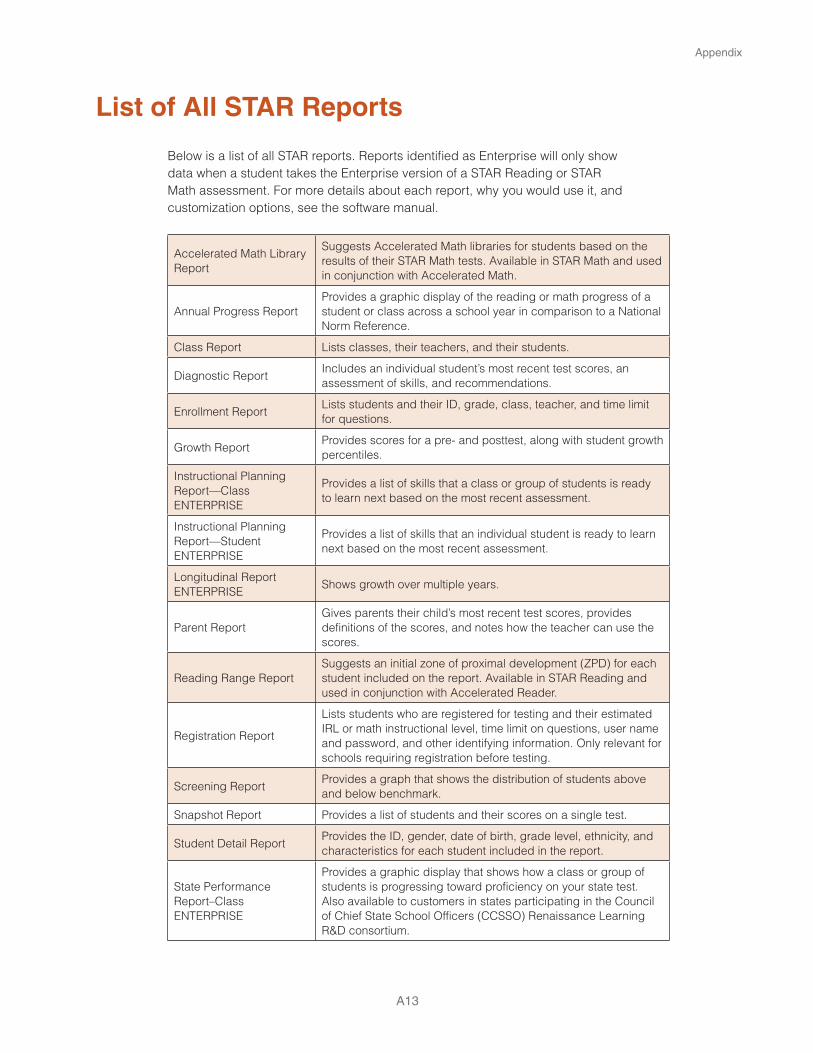
Appendix
A13
List of All STAR Reports
Below is a list of all STAR reports. Reports identified as Enterprise will only show data when a student takes the Enterprise version of a STAR Reading or STAR Math assessment. For more details about each report, why you would use it, and customization options, see the software manual.
Accelerated Math Library Report
Suggests Accelerated Math libraries for students based on the results of their STAR Math tests. Available in STAR Math and used in conjunction with Accelerated Math.
Annual Progress ReportProvides a graphic display of the reading or math progress of a student or class across a school year in comparison to a National Norm Reference.
Class Report Lists classes, their teachers, and their students.
Diagnostic ReportIncludes an individual student’s most recent test scores, an assessment of skills, and recommendations.
Enrollment ReportLists students and their ID, grade, class, teacher, and time limit for questions.
Growth ReportProvides scores for a pre- and posttest, along with student growth percentiles.
Instructional Planning Report—ClassENTERPRISE
Provides a list of skills that a class or group of students is ready to learn next based on the most recent assessment.
Instructional Planning Report—StudentENTERPRISE
Provides a list of skills that an individual student is ready to learn next based on the most recent assessment.
Longitudinal ReportENTERPRISE
Shows growth over multiple years.
Parent ReportGives parents their child’s most recent test scores, provides definitions of the scores, and notes how the teacher can use the scores.
Reading Range ReportSuggests an initial zone of proximal development (ZPD) for each student included on the report. Available in STAR Reading and used in conjunction with Accelerated Reader.
Registration Report
Lists students who are registered for testing and their estimated IRL or math instructional level, time limit on questions, user name and password, and other identifying information. Only relevant for schools requiring registration before testing.
Screening ReportProvides a graph that shows the distribution of students above and below benchmark.
Snapshot Report Provides a list of students and their scores on a single test.
Student Detail ReportProvides the ID, gender, date of birth, grade level, ethnicity, and characteristics for each student included in the report.
State Performance Report–ClassENTERPRISE
Provides a graphic display that shows how a class or group of students is progressing toward proficiency on your state test. Also available to customers in states participating in the Council of Chief State School Officers (CCSSO) Renaissance Learning R&D consortium.
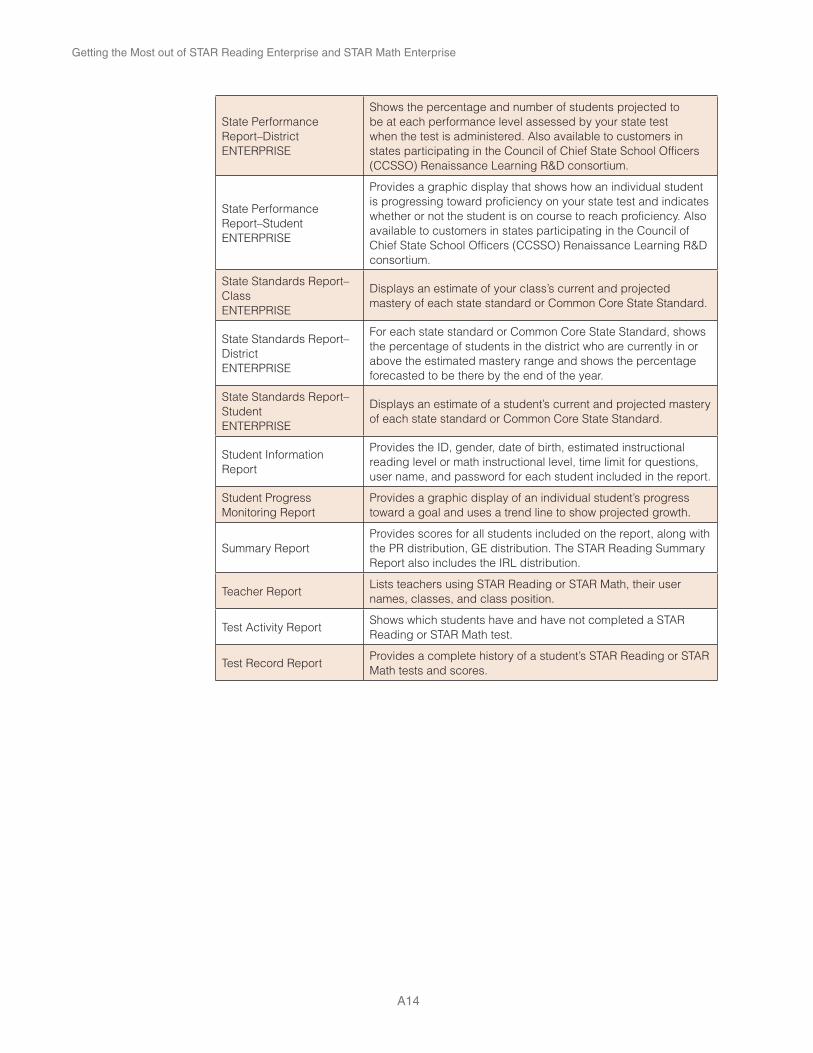
Getting the Most out of STAR Reading Enterprise and STAR Math Enterprise
A14
State Performance Report–DistrictENTERPRISE
Shows the percentage and number of students projected to be at each performance level assessed by your state test when the test is administered. Also available to customers in states participating in the Council of Chief State School Officers (CCSSO) Renaissance Learning R&D consortium.
State Performance Report–StudentENTERPRISE
Provides a graphic display that shows how an individual student is progressing toward proficiency on your state test and indicates whether or not the student is on course to reach proficiency. Also available to customers in states participating in the Council of Chief State School Officers (CCSSO) Renaissance Learning R&D consortium.
State Standards Report–ClassENTERPRISE
Displays an estimate of your class’s current and projected mastery of each state standard or Common Core State Standard.
State Standards Report–DistrictENTERPRISE
For each state standard or Common Core State Standard, shows the percentage of students in the district who are currently in or above the estimated mastery range and shows the percentage forecasted to be there by the end of the year.
State Standards Report–StudentENTERPRISE
Displays an estimate of a student’s current and projected mastery of each state standard or Common Core State Standard.
Student Information Report
Provides the ID, gender, date of birth, estimated instructional reading level or math instructional level, time limit for questions, user name, and password for each student included in the report.
Student Progress Monitoring Report
Provides a graphic display of an individual student’s progress toward a goal and uses a trend line to show projected growth.
Summary ReportProvides scores for all students included on the report, along with the PR distribution, GE distribution. The STAR Reading Summary Report also includes the IRL distribution.
Teacher ReportLists teachers using STAR Reading or STAR Math, their user names, classes, and class position.
Test Activity ReportShows which students have and have not completed a STAR Reading or STAR Math test.
Test Record ReportProvides a complete history of a student’s STAR Reading or STAR Math tests and scores.
A15
Appendix
Examples of STAR Reading Enterprise Reports and Software Pages
Summary Report. . . . . . . . . . . . . . . . . . . . . . . . . . . . . . . . . . . . . . . . . . . . . . . . . . . A16
Universal ScreeningScreening Report (Fall). . . . . . . . . . . . . . . . . . . . . . . . . . . . . . . . . . . . . . . . . . . . . . A17
Screening Report (Winter) . . . . . . . . . . . . . . . . . . . . . . . . . . . . . . . . . . . . . . . . . . . A19
Screening Report (Spring) . . . . . . . . . . . . . . . . . . . . . . . . . . . . . . . . . . . . . . . . . . . A21
Parent CommunicationParent Report (English). . . . . . . . . . . . . . . . . . . . . . . . . . . . . . . . . . . . . . . . . . . . . . A22
Parent Report (Spanish) . . . . . . . . . . . . . . . . . . . . . . . . . . . . . . . . . . . . . . . . . . . . . A23
Progress Monitoring Set Up an Intervention and Goal Page. . . . . . . . . . . . . . . . . . . . . . . . . . . . . . . . . . A24
Student Progress Monitoring Report . . . . . . . . . . . . . . . . . . . . . . . . . . . . . . . . . . . A25
Instructional Planning Instructional Planning Report–Student . . . . . . . . . . . . . . . . . . . . . . . . . . . . . . . . . . A27
Instructional Report Groupings Page . . . . . . . . . . . . . . . . . . . . . . . . . . . . . . . . . . A28
Class Instructional Planning Report . . . . . . . . . . . . . . . . . . . . . . . . . . . . . . . . . . . A29
State PerformanceState Performance Report–Student . . . . . . . . . . . . . . . . . . . . . . . . . . . . . . . . . . . . A30 State Performance Report–Class . . . . . . . . . . . . . . . . . . . . . . . . . . . . . . . . . . . . . . A31
State Performance Report–District . . . . . . . . . . . . . . . . . . . . . . . . . . . . . . . . . . . . . A33
State Standards State Standards Report–Student . . . . . . . . . . . . . . . . . . . . . . . . . . . . . . . . . . . . . . A34
State Standards Report–Class . . . . . . . . . . . . . . . . . . . . . . . . . . . . . . . . . . . . . . . . A35
State Standards Report–District . . . . . . . . . . . . . . . . . . . . . . . . . . . . . . . . . . . . . . . A36
GrowthGrowth Report (Class) . . . . . . . . . . . . . . . . . . . . . . . . . . . . . . . . . . . . . . . . . . . . . . A37
Growth Report (District) . . . . . . . . . . . . . . . . . . . . . . . . . . . . . . . . . . . . . . . . . . . . . A38
Annual Progress Report . . . . . . . . . . . . . . . . . . . . . . . . . . . . . . . . . . . . . . . . . . . . . A39
Longitudinal Report (Growth) . . . . . . . . . . . . . . . . . . . . . . . . . . . . . . . . . . . . . . . . . A40
Longitudinal Report (Cross-Sectional) . . . . . . . . . . . . . . . . . . . . . . . . . . . . . . . . . . A41

A16
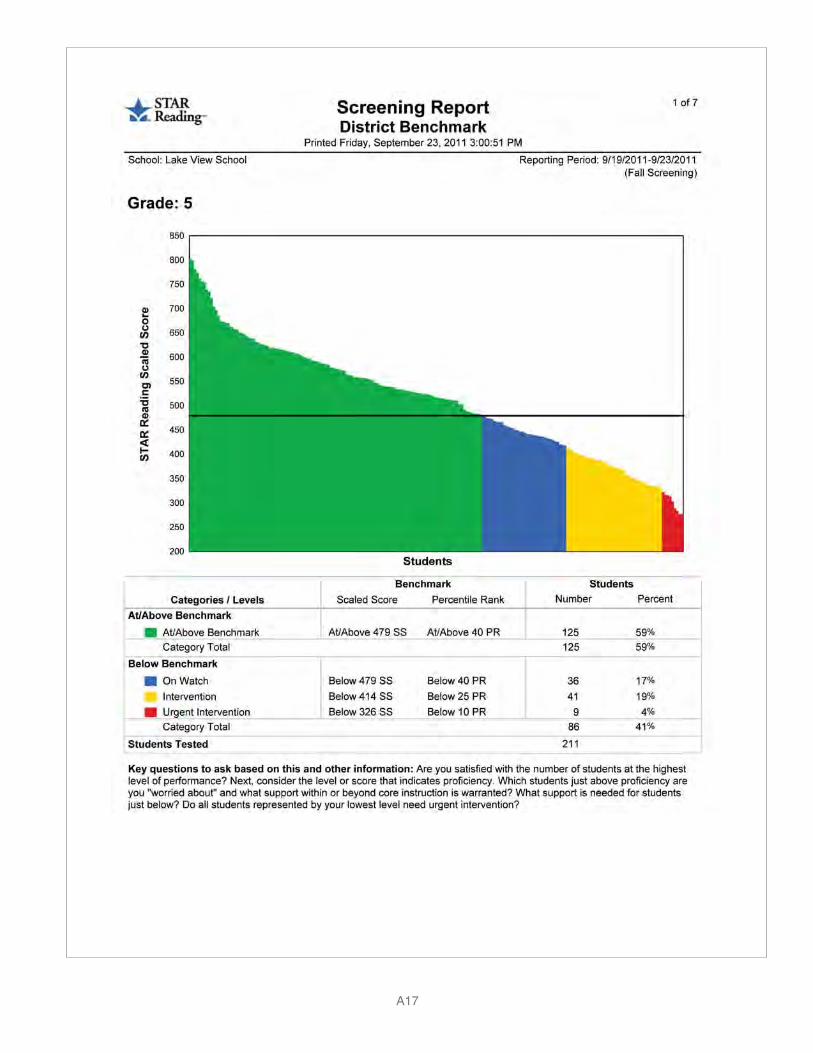
Appendix
A17
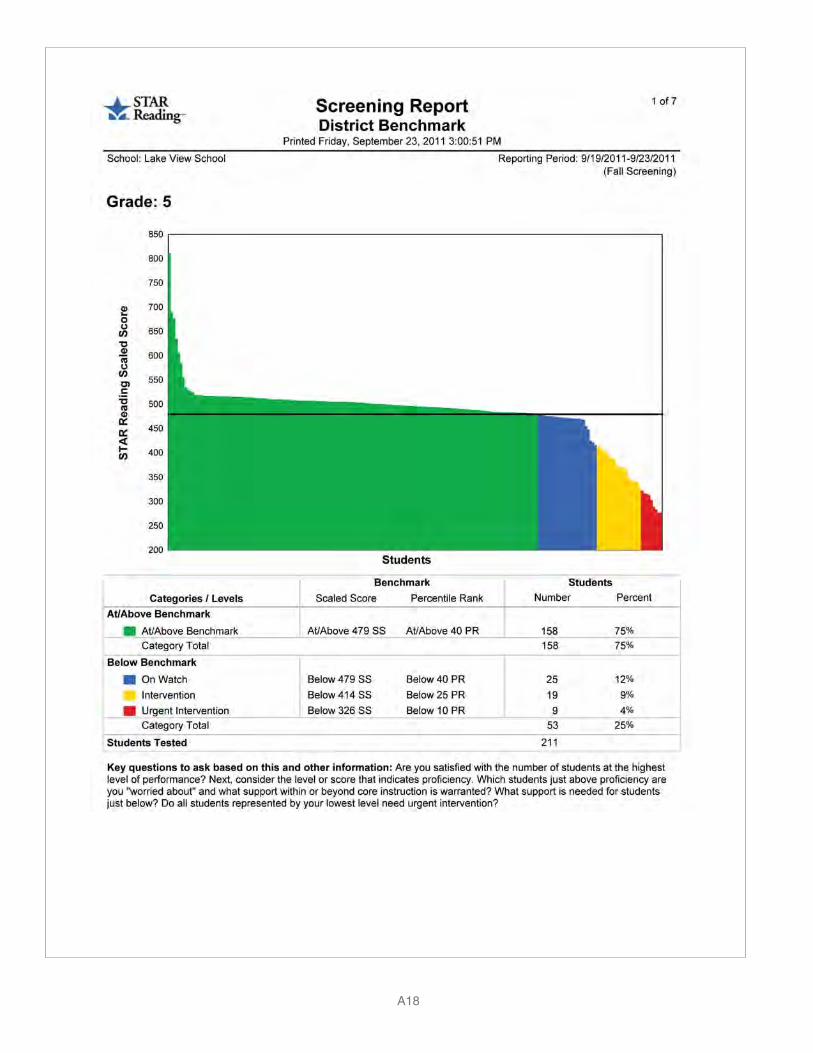
Getting the Most out of STAR Reading Enterprise and STAR Math Enterprise
A18

Appendix
A19
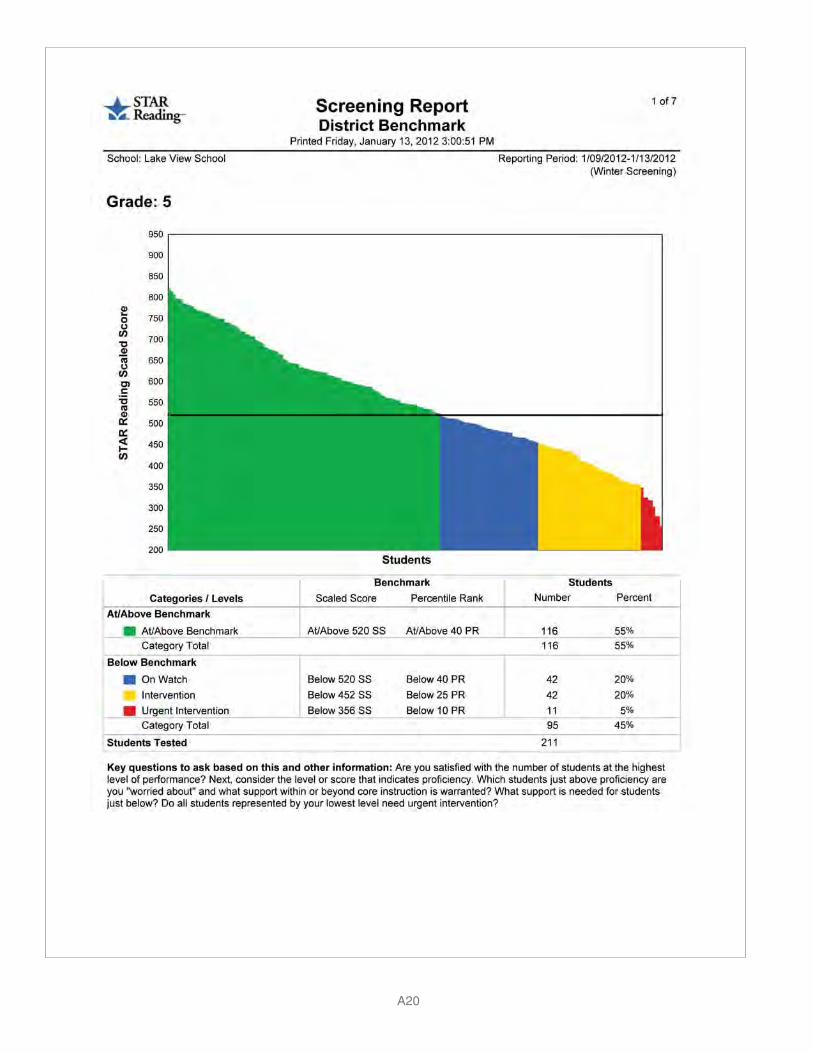
Getting the Most out of STAR Reading Enterprise and STAR Math Enterprise
A20
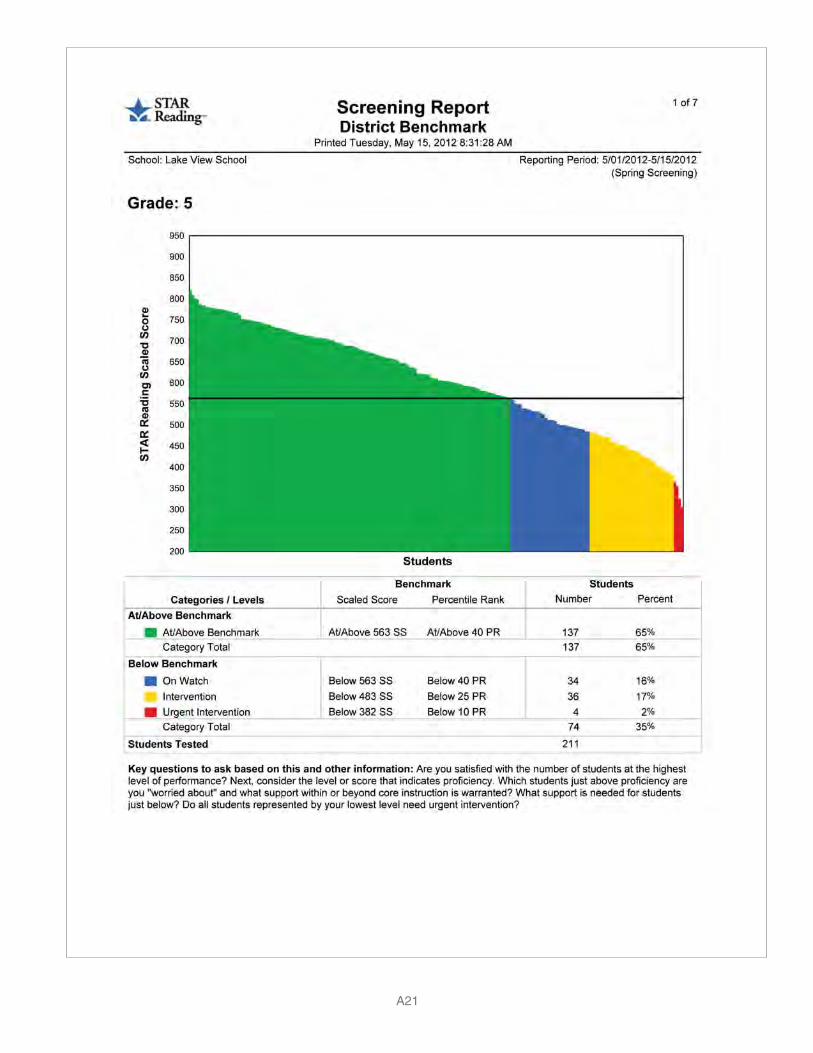
Appendix
A21

Getting the Most out of STAR Reading Enterprise and STAR Math Enterprise
A22

Appendix
A23

Getting the Most out of STAR Reading Enterprise and STAR Math Enterprise
A24
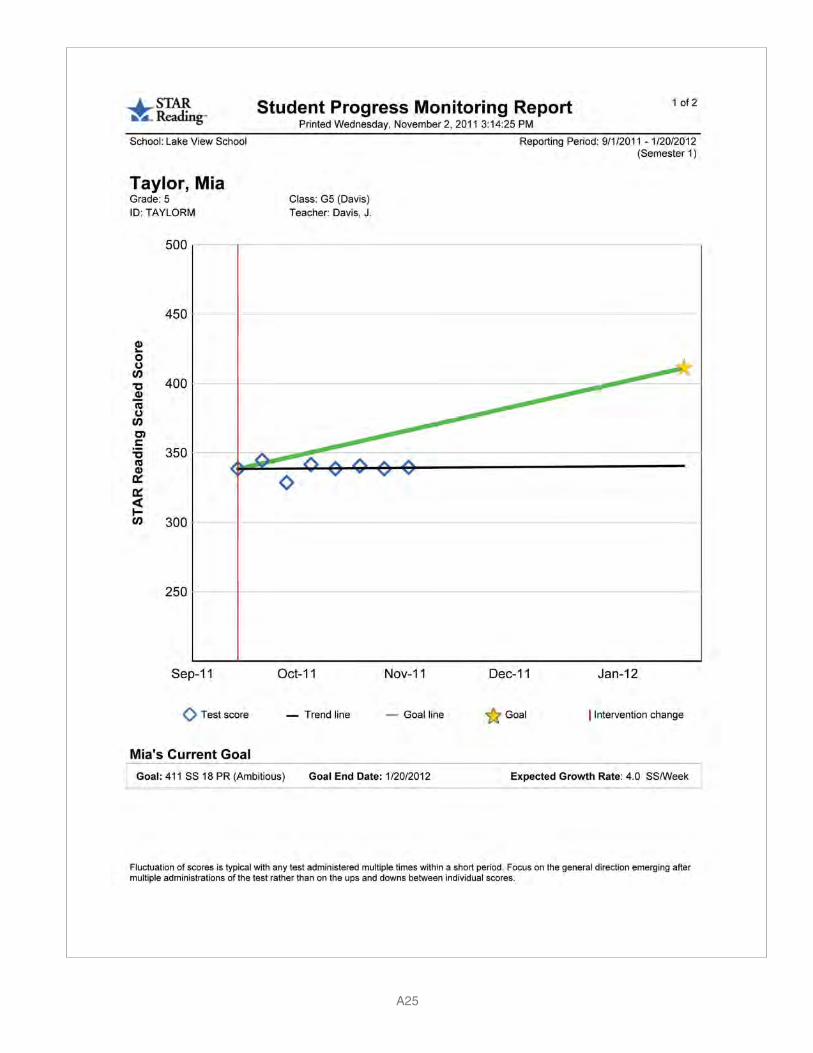
Appendix
A25

Getting the Most out of STAR Reading Enterprise and STAR Math Enterprise
A26
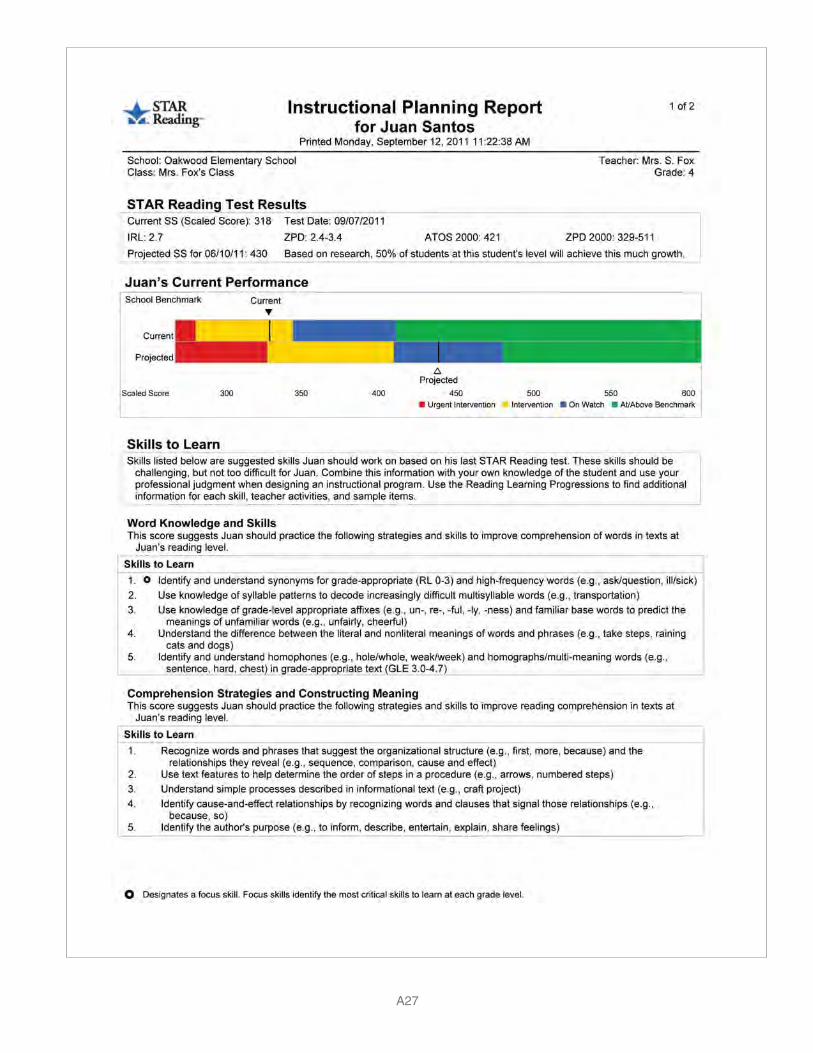
Appendix
A27
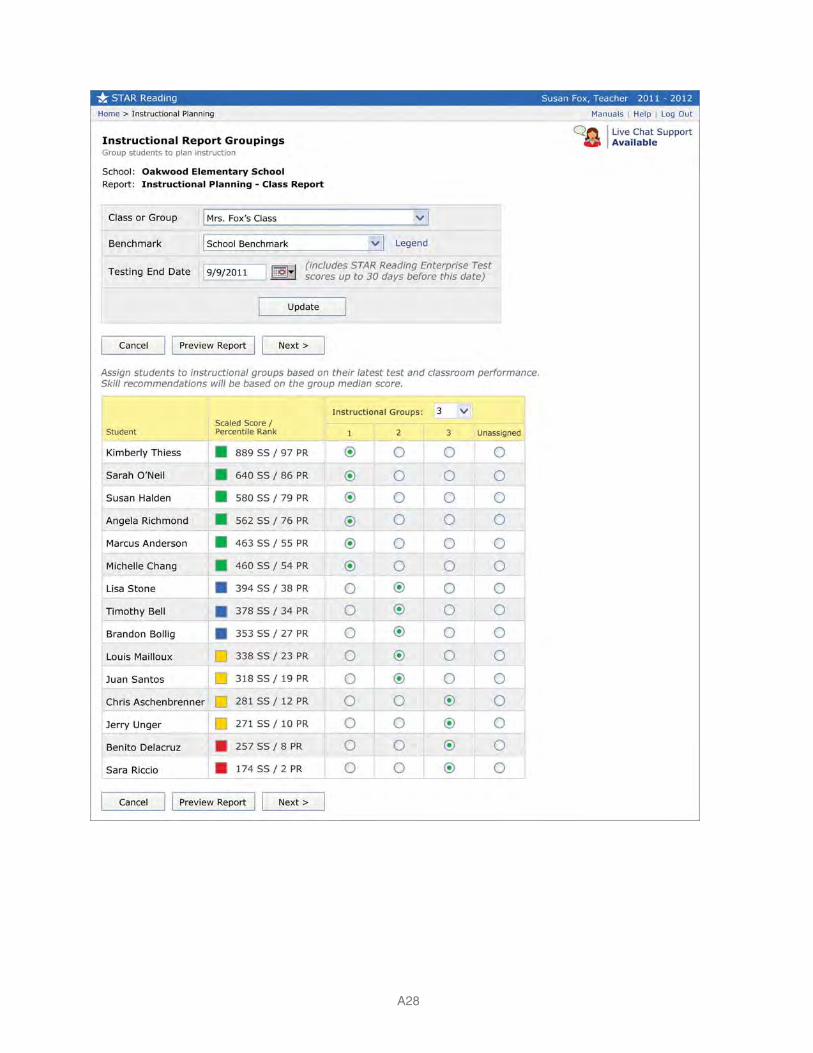
Getting the Most out of STAR Reading Enterprise and STAR Math Enterprise
A28

Appendix
A29

Getting the Most out of STAR Reading Enterprise and STAR Math Enterprise
A30
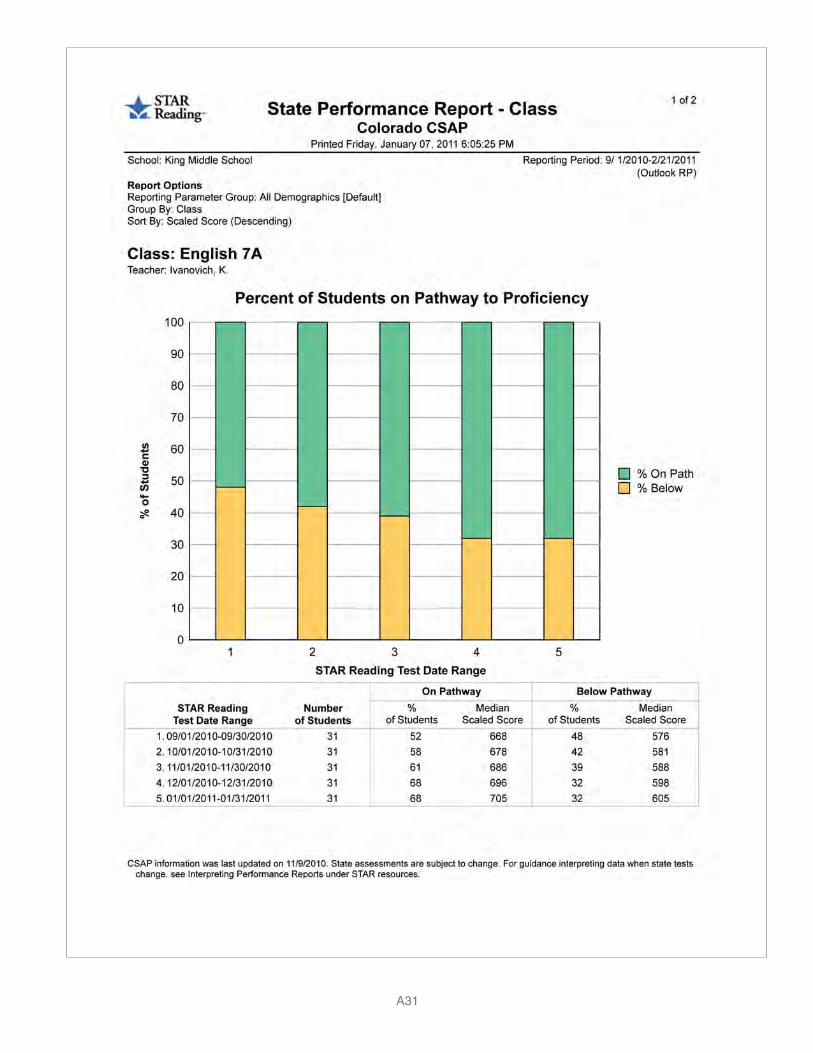
Appendix
A31

Getting the Most out of STAR Reading Enterprise and STAR Math Enterprise
A32
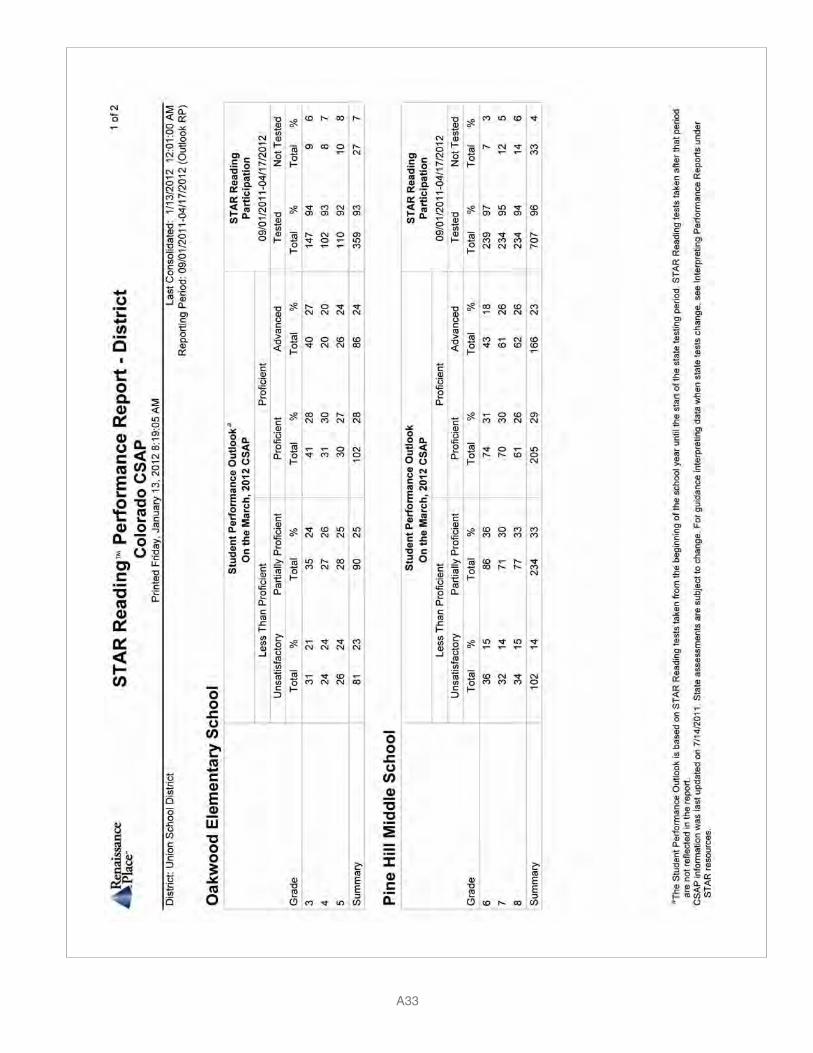
Appendix
A33

Getting the Most out of STAR Reading Enterprise and STAR Math Enterprise
A34

Appendix
A35

Getting the Most out of STAR Reading Enterprise and STAR Math Enterprise
A36
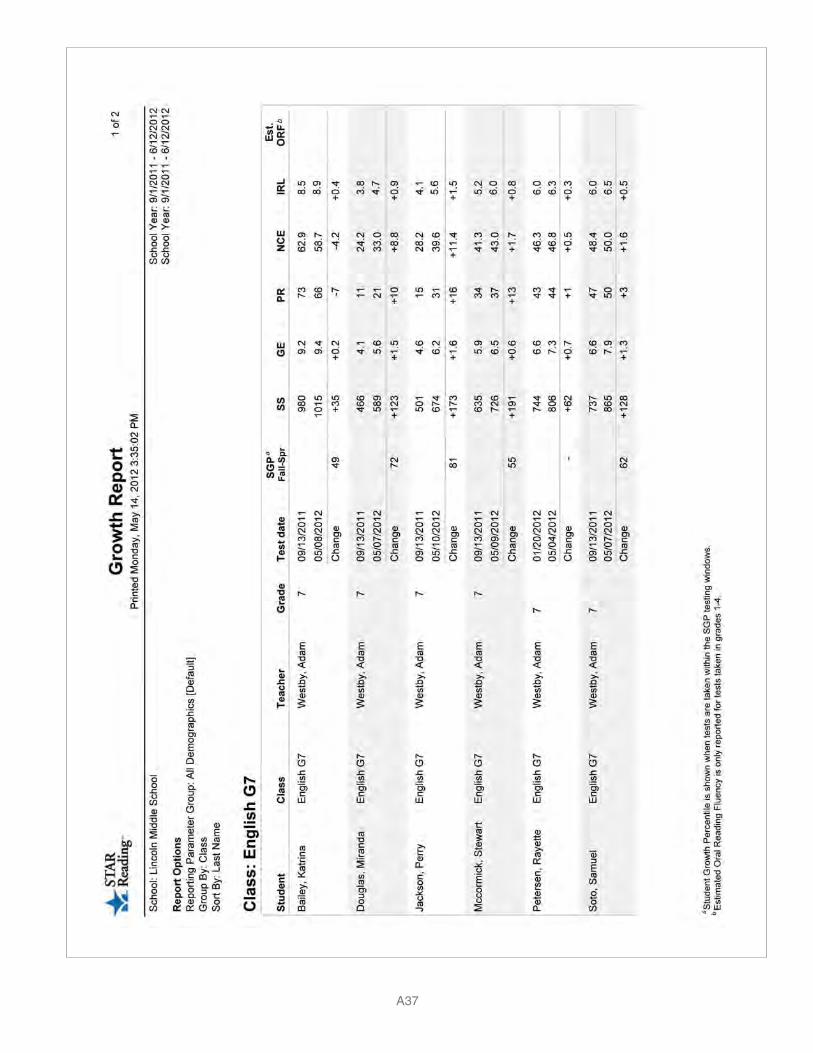
Appendix
A37

Getting the Most out of STAR Reading Enterprise and STAR Math Enterprise
A38

Appendix
A39

Getting the Most out of STAR Reading Enterprise and STAR Math Enterprise
A40
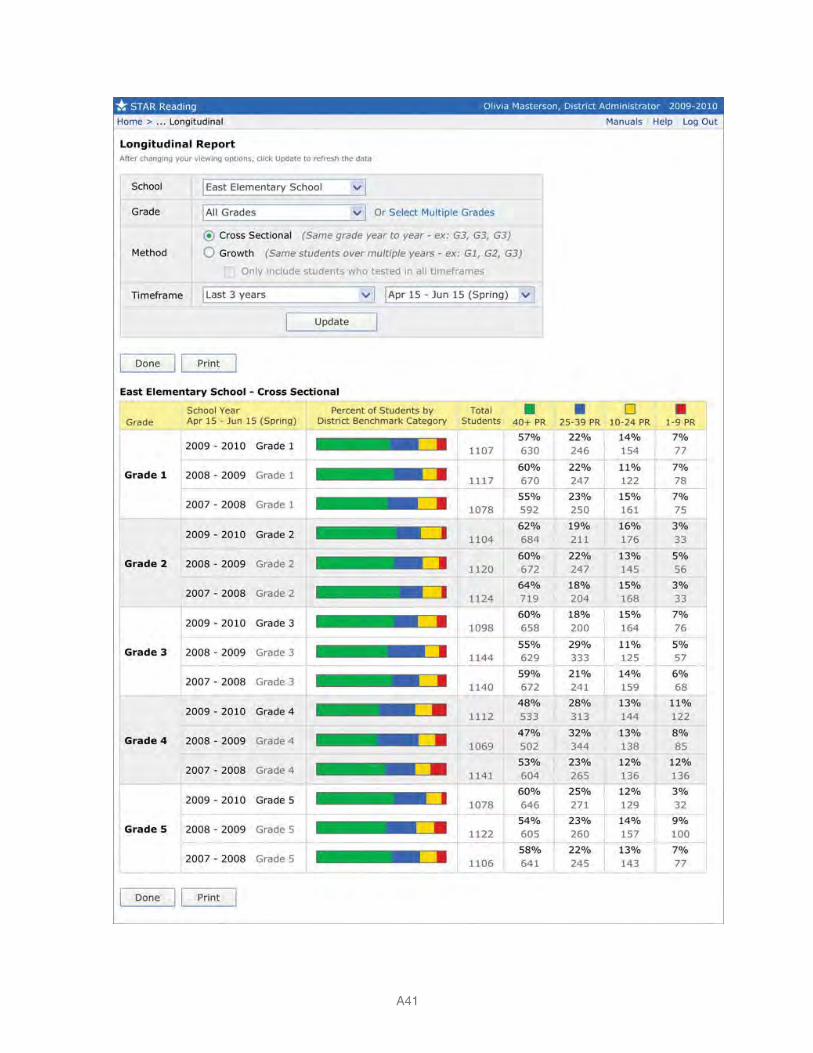
Appendix
A41


A43
Examples of STAR Math Enterprise Reports and Software Pages
Summary Report . . . . . . . . . . . . . . . . . . . . . . . . . . . . . . . . . . . . . . . . . . . . . . . . . . A44
Universal ScreeningScreening Report (Fall). . . . . . . . . . . . . . . . . . . . . . . . . . . . . . . . . . . . . . . . . . . . . . A45
Screening Report (Winter) . . . . . . . . . . . . . . . . . . . . . . . . . . . . . . . . . . . . . . . . . . . A47
Screening Report (Spring) . . . . . . . . . . . . . . . . . . . . . . . . . . . . . . . . . . . . . . . . . . . A48
Parent CommunicationParent Report (English). . . . . . . . . . . . . . . . . . . . . . . . . . . . . . . . . . . . . . . . . . . . . . A49
Parent Report (Spanish) . . . . . . . . . . . . . . . . . . . . . . . . . . . . . . . . . . . . . . . . . . . . . A50
Progress Monitoring Set Up an Intervention and Goal Page. . . . . . . . . . . . . . . . . . . . . . . . . . . . . . . . . . A51
Student Progress Monitoring Report . . . . . . . . . . . . . . . . . . . . . . . . . . . . . . . . . . . A52
Instructional Planning Instructional Planning Report–Student . . . . . . . . . . . . . . . . . . . . . . . . . . . . . . . . . . A54
Instructional Report Groupings Page . . . . . . . . . . . . . . . . . . . . . . . . . . . . . . . . . . A55
Class Instructional Planning Report . . . . . . . . . . . . . . . . . . . . . . . . . . . . . . . . . . . A56
State PerformanceState Performance Report–Student . . . . . . . . . . . . . . . . . . . . . . . . . . . . . . . . . . . . A57
State Performance Report–Class . . . . . . . . . . . . . . . . . . . . . . . . . . . . . . . . . . . . . A58
State Performance Report–District . . . . . . . . . . . . . . . . . . . . . . . . . . . . . . . . . . . . A59
State Standards State Standards Report–Student . . . . . . . . . . . . . . . . . . . . . . . . . . . . . . . . . . . . . . A60
State Standards Report–Class . . . . . . . . . . . . . . . . . . . . . . . . . . . . . . . . . . . . . . . . A61
State Standards Report–District . . . . . . . . . . . . . . . . . . . . . . . . . . . . . . . . . . . . . . A62
GrowthGrowth Report (Class) . . . . . . . . . . . . . . . . . . . . . . . . . . . . . . . . . . . . . . . . . . . . . . A63
Growth Report (District) . . . . . . . . . . . . . . . . . . . . . . . . . . . . . . . . . . . . . . . . . . . . . A64 Annual Progress Report . . . . . . . . . . . . . . . . . . . . . . . . . . . . . . . . . . . . . . . . . . . . . A65
Longitudinal Report (Growth) . . . . . . . . . . . . . . . . . . . . . . . . . . . . . . . . . . . . . . . . . A66
Longitudinal Report (Cross-Sectional) . . . . . . . . . . . . . . . . . . . . . . . . . . . . . . . . . . A67
Appendix

Getting the Most out of STAR Reading Enterprise and STAR Math Enterprise
A44

Appendix
A45

Getting the Most out of STAR Reading Enterprise and STAR Math Enterprise
A46

Appendix
A47
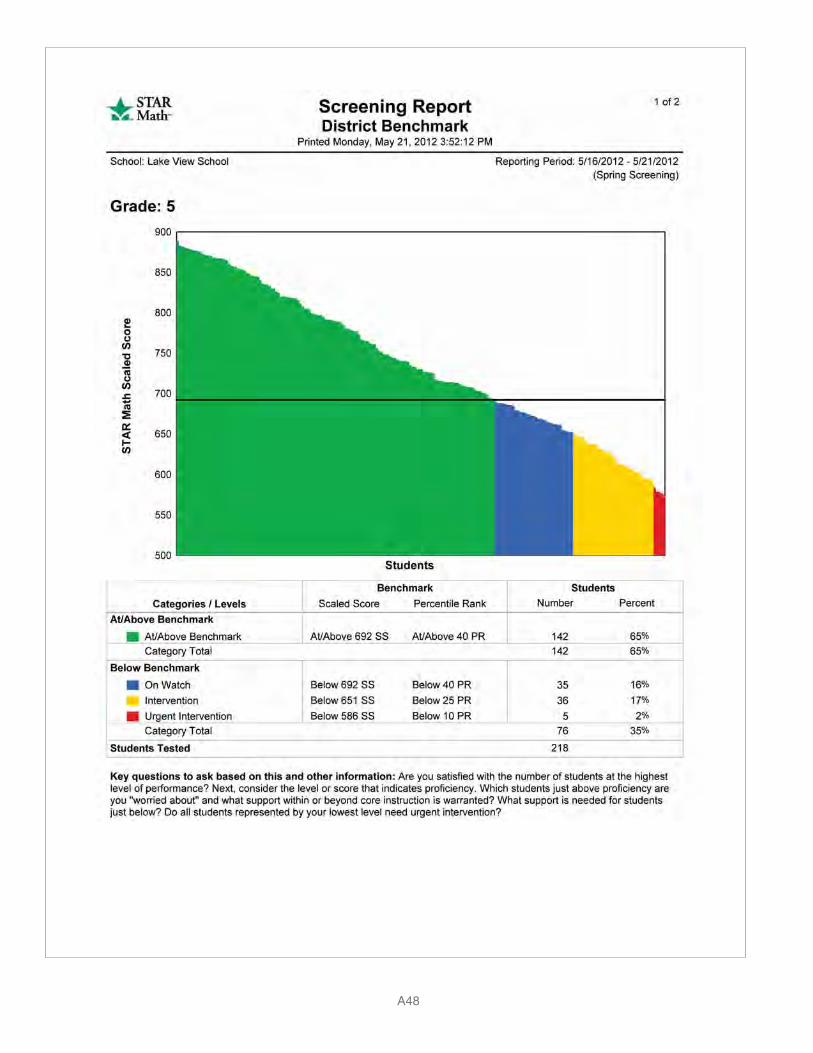
Getting the Most out of STAR Reading Enterprise and STAR Math Enterprise
A48
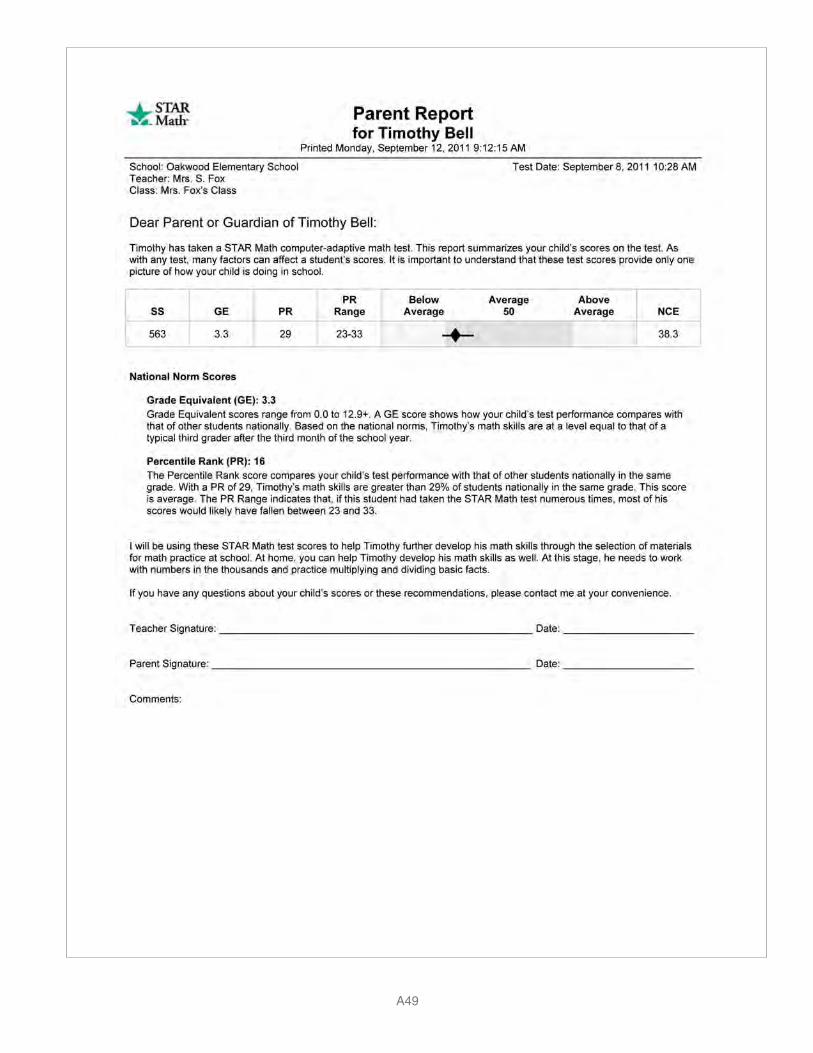
Appendix
A49
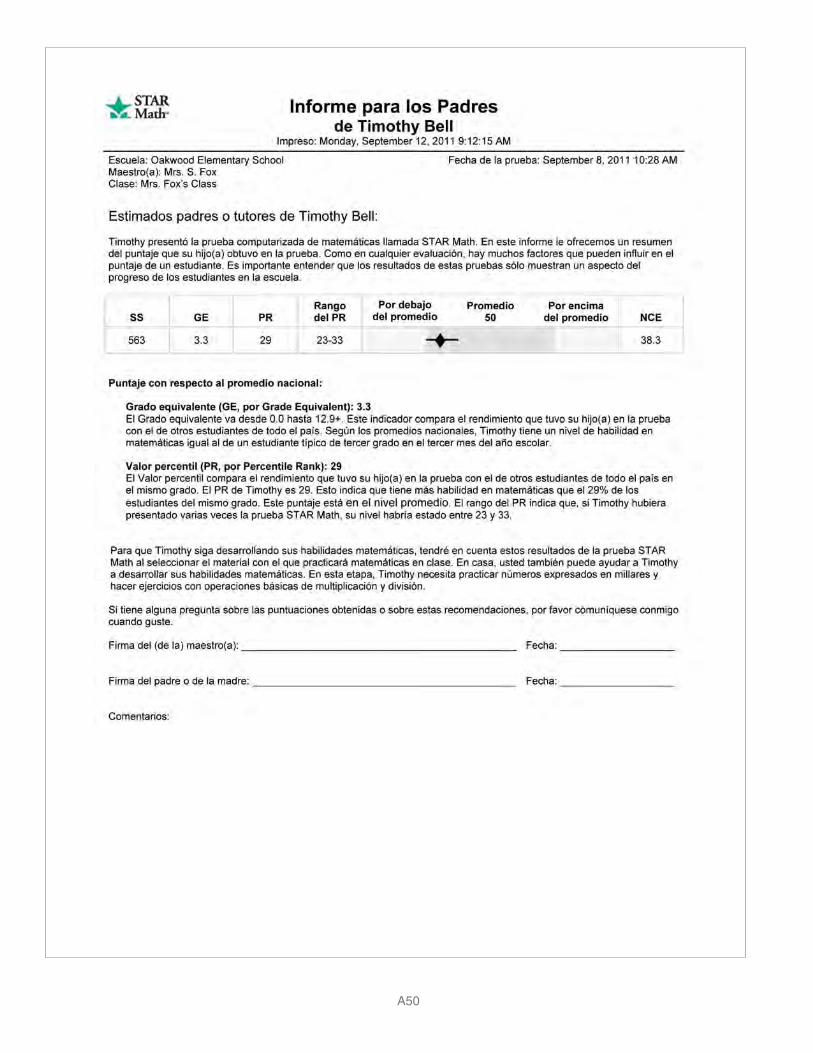
Getting the Most out of STAR Reading Enterprise and STAR Math Enterprise
A50

Appendix
A51

Getting the Most out of STAR Reading Enterprise and STAR Math Enterprise
A52
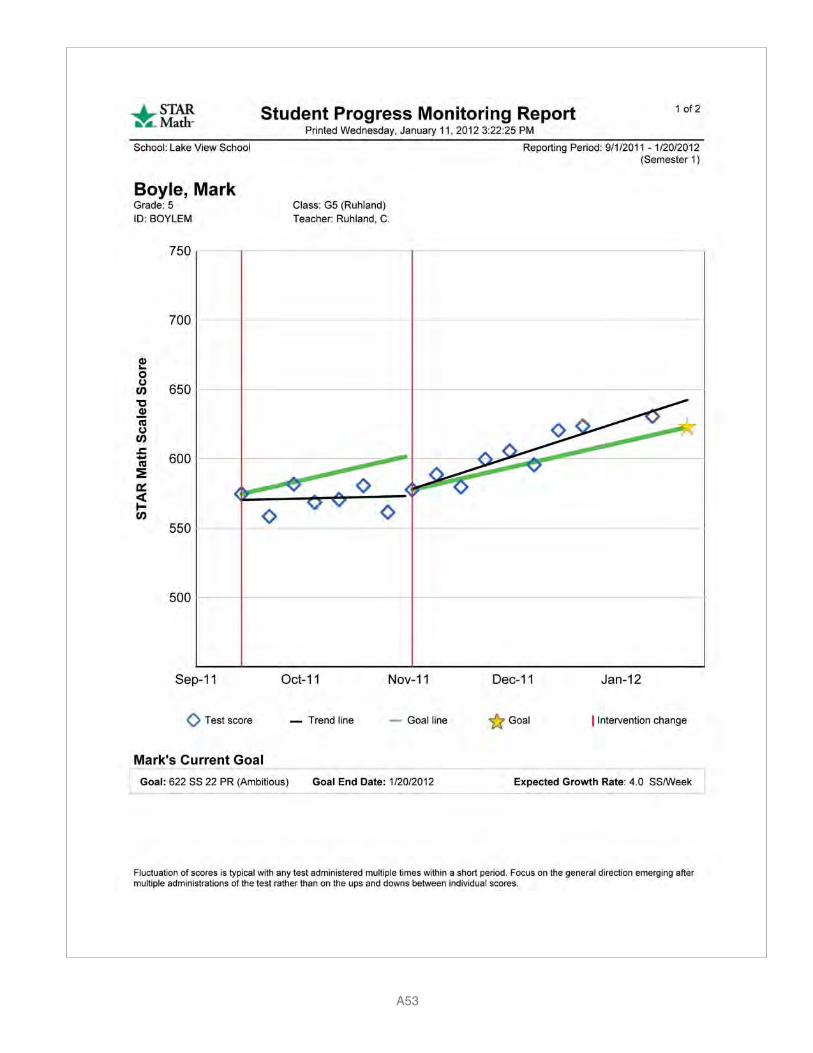
Appendix
A53

Getting the Most out of STAR Reading Enterprise and STAR Math Enterprise
A54

Appendix
A55

Getting the Most out of STAR Reading Enterprise and STAR Math Enterprise
A56
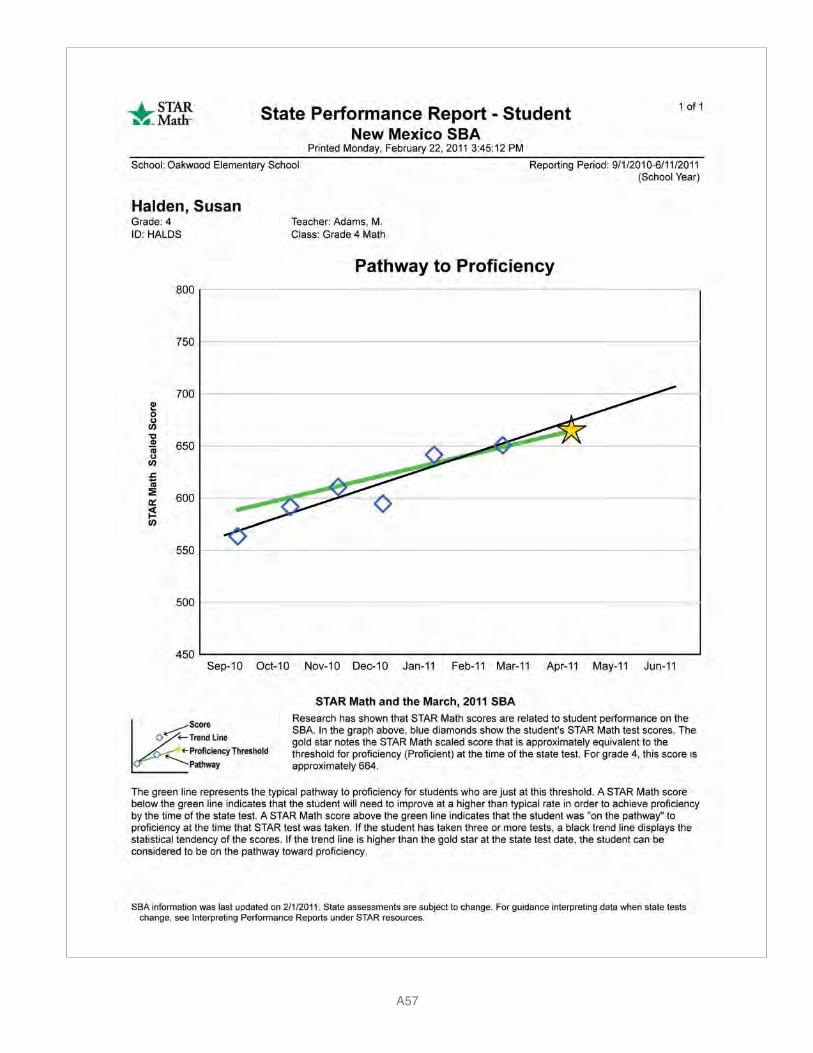
Appendix
A57

Getting the Most out of STAR Reading Enterprise and STAR Math Enterprise
A58

Appendix
A59
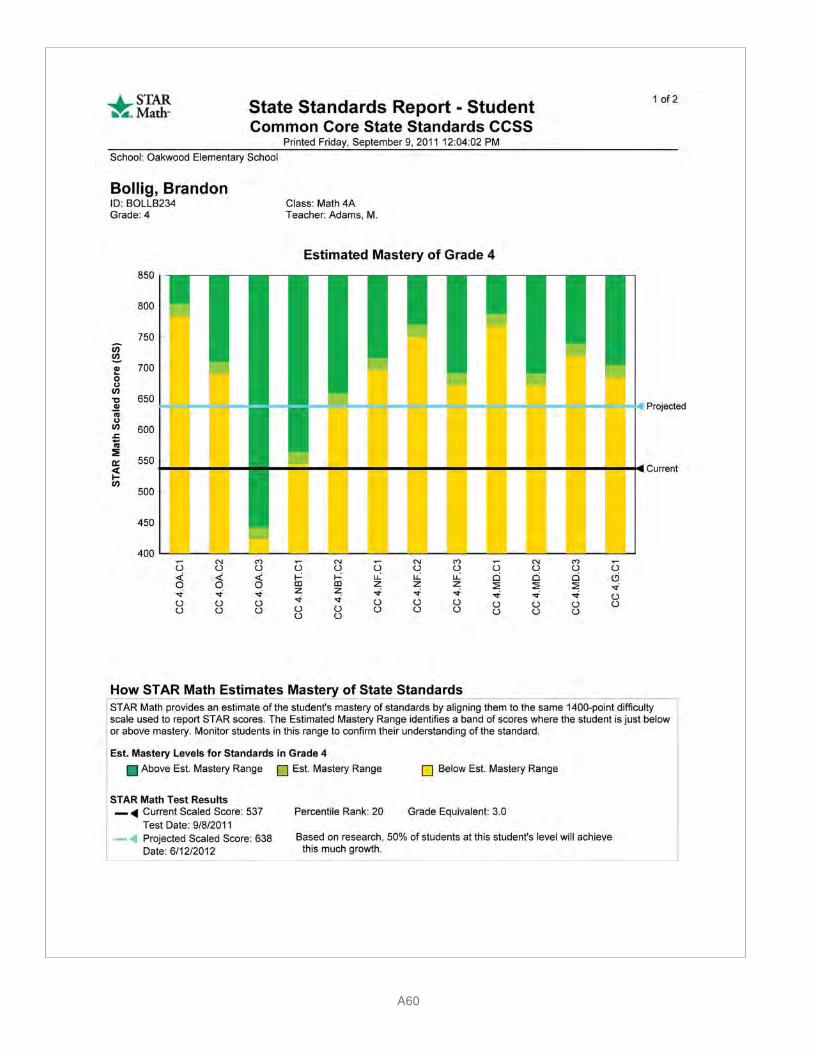
Getting the Most out of STAR Reading Enterprise and STAR Math Enterprise
A60

Appendix
A61
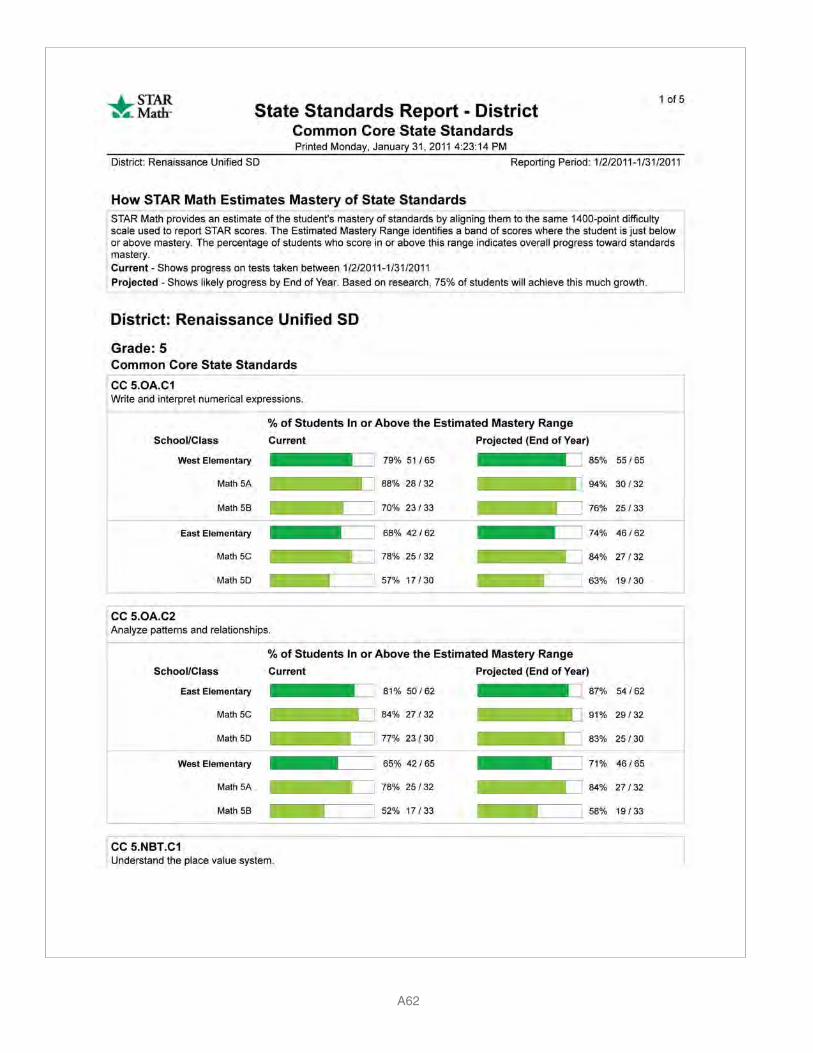
Getting the Most out of STAR Reading Enterprise and STAR Math Enterprise
A62

Appendix
A63

Getting the Most out of STAR Reading Enterprise and STAR Math Enterprise
A64
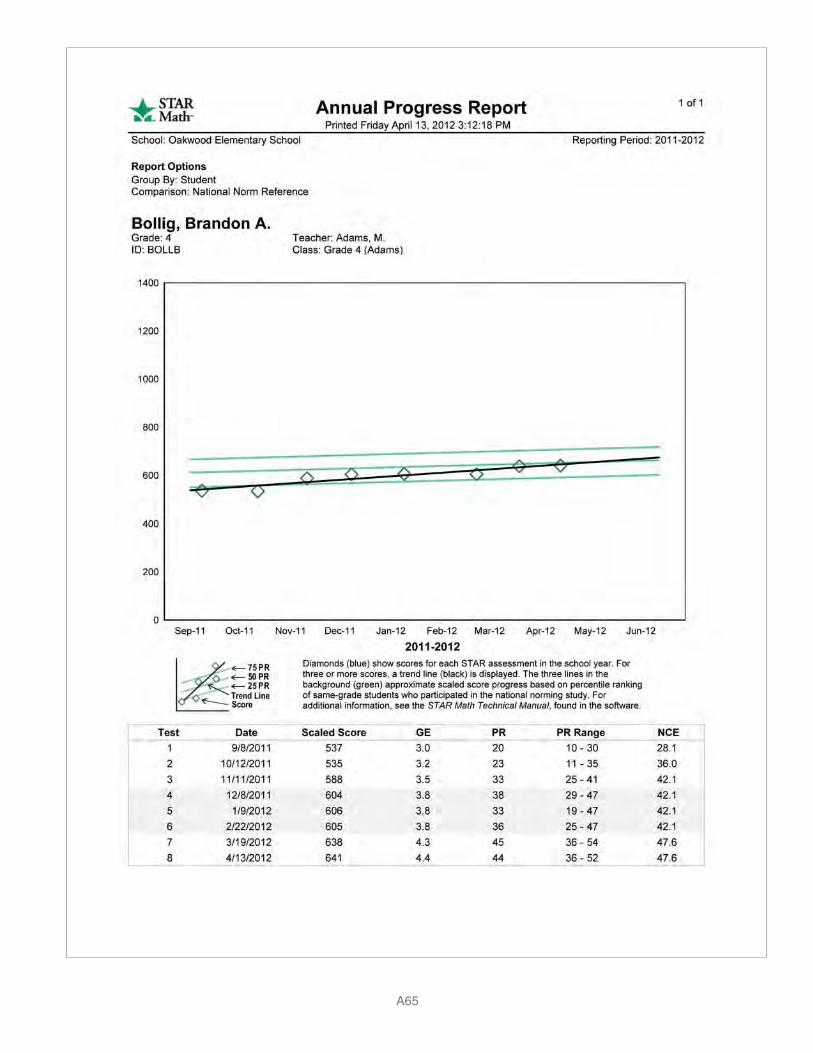
Appendix
A65

Getting the Most out of STAR Reading Enterprise and STAR Math Enterprise
A66

Appendix
A67

A68
Index absolute growth, 9, 44, 77academic peer, 8, 77, 79, 81Accelerated Math Library Report, 9, A13Accelerated Reader, 28, 30, 34, 90, A13ambitious goal, 41–42Annual Progress Report, 11, 81–82, A13, A39,
A65
baseline data, 39, 40benchmark
and goal setting, 39, 41–42, 45–46default, 18, 19, 23, A4definition, 17, 24editing, 18–19, A3–A4for oral reading fluency, 9on Instructional Planning Report, 51–53, A8on Longitudinal Report, 83–85, 87on Screening Report, 14, 23–28, 31–38settings, 17–19, 24viewing, A3
calculator, 4, 11, 88calibration, 7, 8calendar, 14–16, 17, 20categories, 17–18, 24, 31–38characteristics, 17, 25, 77, A13Class Report, A13Common Core State Standards, 8, 10, 14, 50, 56,
70–76, A14computer-adaptive, 3, 4, 10, 89core instructional program, 25, 27–28, 31, 34, 35,
38Core Progress learning progression, 8, 10, 50,
54–61, 75, 90, A9–A10criterion-referenced, 90cross-sectional method, 83, 84cut scores
and proficiency categories, 17–18and Screening Report, 23–24and state tests, 17definition, 24editing, A3–A4for oral reading fluency, 9for untested grades, 17viewing, A3
Diagnostic Report, A13DIBELS, 10differentiating instruction, 14, 18, 33, 46, 50–54
domain, 5, 6, 50, 51, 54, 57, A8, A9
editing an intervention and goal, 47, A6educator effectiveness, 86English language learners, 28, 42, 57, 88Enrollment Report, A13Estimated Mastery Range, 70–73, 74, A14estimated oral reading fluency, 9
fidelity of administration, 11, 89fidelity of implementation, 45, 46fluctuation in scores, 44frequency of testing, 3, 14–15
goal line, 44, 47, 48goal types, 41–42goals
custom, 41, A6, A7editing, 47, A6–A7for Accelerated Reader, 90for ELLs, 42grade-level, 27, 31, 34, 35, 36purpose of, 39, 90setting for intervention, 39–42, 90, A5–A7setting for school improvement, 13, 20, 85
grade-equivalent (GE), 8, 9, 11, 78, 88, 90grade-level teams, 13–14, 15, 17, 26–27, 31, 33,
47groups
for instructional planning, 28, 53–54, A8managing groups, 39, 89, A5
growth method, 83–84growth rate, 41, 44–45, 47, 82, 89, A6, A7Growth Report, 22, 77–81, A13, A37, A38, A63,
A64
high achievers, 33high school, 29, 88Home Connect, 30
Instructional Planning ReportClass, 28, 53–55, A8, A13, A29, A56groupings page, 53, A28, A55Student, 19, 50–52, 56, 57, 58, 89, 90, A7–A8,
A13, A27, A54Instructional Reading Level (IRL), 9, 24, 77, 88,
90, A14intervention
and Screening Report, 26, 27, 31, 33, 36, 37
A69
Index
editing an, 47, A6end date, 40forms of, 28, 29interpreting data, 44–47monitoring response to, 42–45naming, 40planning, 13, 14, 27, 28, 29setting up, 39–42, A5–A7start date, 40
Item Response Theory, 7items
calibration of, 7, 8examples of, 5–6
kindergarten, 3, 87, 88
length of the test, 6, 10, 11Lexiles, 90linking, 17, 24, 51, 63–64, 88Longitudinal Reports, 83–86, A9, A13, A40, A41,
A66, A67
MathFacts in a Flash, 30math instructional level, A2, A13, A14moderate goal, 41–42monitor password, 88, A2
National Center on Response to Intervention (NCRTI), 3, 10
normal curve equivalent (NCE), 78norm-referenced scores, 3, 8, 88, 90
outlook reporting period, 68
Parent Report, 30, A13, A22, A23, A49, A50parents, 20, 30, A11, A12, A13pathway to proficiency, 64–65, 66, 69percentile rank (PR), 8, 9, 11, 24, 41, 77, 88practice questions, 3, 4, 7, 87pretest instructions, 4, 11, 87, A2professional development, 15proficiency threshold, 64–65, 68–69progress monitoring
ongoing, 47–49report data, 42–45, 85, A5–A7responding to data, 45–47
Reading Range Report, A13reference points for goal setting, 41Registration Report, A13relative growth, 9reliability, 10
Response to Intervention (RTI), 14, 15, 37, 40, A11, A12
resuming a test, 88retesting a student, 89
scaled score (SS)and absolute growth, 9, 11and Core Progress learning progression, 50,
56, 90and ELLs, 28and standards, 70–72and state tests, 51, 63–64and student growth percentile, 8, 78, 79definition, 8for kindergarten, 88
scheduling, 11, 14–16, 26, 28, 29, 46, 78, 88screening
fall, 22–30spring, 34–37winter, 31–34
screening periods, 14, 22, 24, 78Screening Report, 17, 22, 23–28, 31–37, A7, A13,
A17–A21, A45–A48screening status preview, 23, A5SGP testing window, 78, 79, 80Snapshot Report, A13software instructions, A2–A10special education, 28, 29, 45standard error of measurement, 33, 44standard protocols, 49STAR Early Literacy, 3, 87starting level, 4, 88, A2State Performance Report, 63
by characteristic, A32Class, 66–67, A13, A31District, 67–68, A14, A33Student, 64–66, 68–69, A14, A30
State Standards Report, 70Class, 73, 75, A14, A35, A61District, 74, 75, A14, A36, A62Student, 71–72, 75, A14, A34, A60
stopping a test, 88Student Detail Report, A13student growth percentile (SGP), 8–9, 22, 77,
78–79, 80, A13 Student Information Report, 4, 11, 71, A14Student Progress Monitoring Report, 42–45,
47–48, 81, A7, A14, A25–A26, A52–A53Successful Reader, 28, 40Summary Report, 9, 24, A14, A16, A44
Teacher Report, A14

Getting the Most out of STAR Reading Enterprise and STAR Math Enterprise
A70
Test Activity Report, A14Test Record Report, 89, 90, A14test type, 89, A4testing conditions, 11, 87time limits, 6, 88, A2trend line
on Annual Progress Report, 81, 82on Performance Report (state tests), 14, 15,
64, 65, 67on Student Progress Monitoring Report,
44–45, 47, A14troubleshooting an intervention, 46
validity, 10
wizard for goal setting, 39, 40, 42, A24, A51
zone of proximal development (ZPD), 9, A13


$14.95
About Renaissance Learning
Renaissance Learning, Inc. is a leading provider of technology-based school improvement and student assessment programs for K12 schools. Renaissance Learning’s tools provide daily formative assessment and periodic progress-monitoring technology to enhance core curriculum, support differentiated instruction, and personalize practice in reading, writing and math. Renaissance Learning products help educators make the practice component of their existing curriculum more effective by providing tools to personalize practice and easily manage the daily activities for students of all levels. As a result, teachers using Renaissance Learning products accelerate learning, get more satisfaction from teaching, and help students achieve higher test scores on state and national tests.
STARENTGM.0212 R54548