gigamon inc. - visibility, the new business imperative. · 7/15/2016 · gigamon inc. -...
TRANSCRIPT

Michael Wong
Queen’s Smith School of Business
July 14, 2016
Long: [NYSE: GIMO]
Price Target: $47
Return: 18.1%
Gigamon Inc. - Visibility, the new business imperative.
Seeking Alpha – Summer Collegiate Stock Pitch Contest
Cybercriminals.
Now there’s nowhere to hide.
Discover the power of network visibility.
Company Overview I
Sources: Annual Report, Capital IQ
Revenue Distribution by Segment (2015)
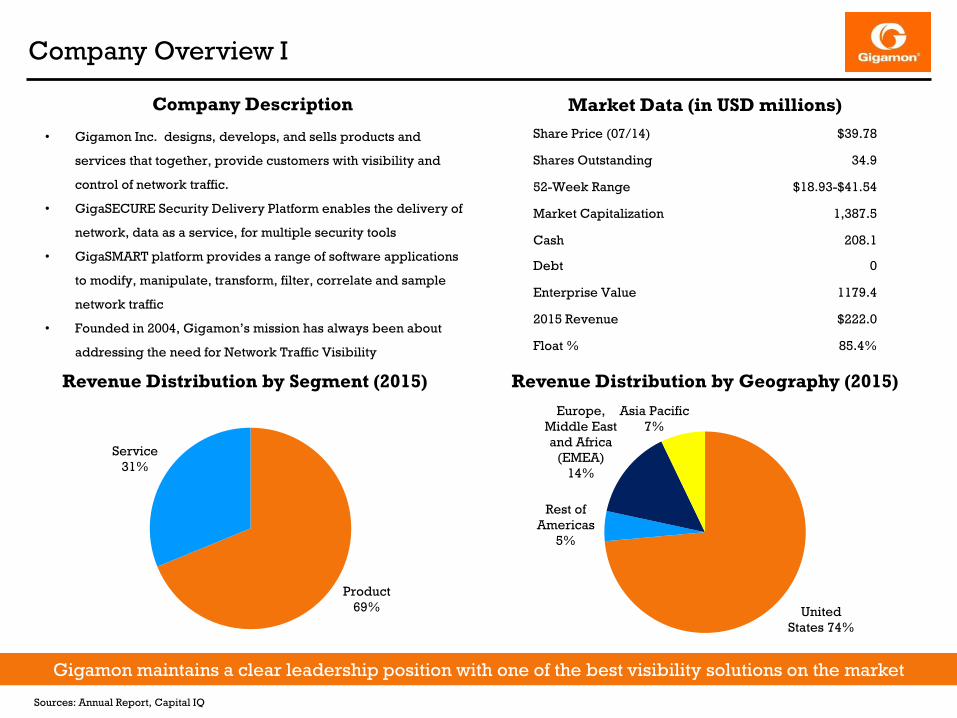
• Gigamon Inc. designs, develops, and sells products and
services that together, provide customers with visibility and
control of network traffic.
• GigaSECURE Security Delivery Platform enables the delivery of
network, data as a service, for multiple security tools
• GigaSMART platform provides a range of software applications
to modify, manipulate, transform, filter, correlate and sample
network traffic
• Founded in 2004, Gigamon’s mission has always been about
addressing the need for Network Traffic Visibility
Product
69%
Service
31%
United
States 74%
Rest of
Americas
5%
Europe,
Middle East
and Africa
(EMEA)
14%
Asia Pacific
7%
Gigamon maintains a clear leadership position with one of the best visibility solutions on the market
Market Data (in USD millions)
Share Price (07/14) $39.78
Shares Outstanding 34.9
52-Week Range $18.93-$41.54
Market Capitalization 1,387.5
Cash 208.1
Debt 0
Enterprise Value 1179.4
2015 Revenue $222.0
Float % 85.4%
Revenue Distribution by Geography (2015)
Company Description
Company Overview II
Sources: Company Website
Paul A. Hooper – CEO (2012 – Present)
Mike Burns – CFO (2014 – Present)
Shehzad Merchant – CTO (2014 – Present)
Sachi Sambandan – Sr. VP of Engineering (2014 –
Present)
• Joined in 2011 (6 years with Gigamon)
• Promoted to CEO on Dec 2012 with previous CEO
remaining on the Board of Directors
• Networking and high tech industry veteran
• Active in management calls for shareholders
• Over 20 years of experience in finance, strategic planning, M&A
and growth investing in public technology companies
• Over 20 years of experience in the high-tech industry
• Over 25 years of experience in Cloud, Virtualization and
Infrastructure domains
Management comprised of technology veterans have provided a solid past and a promising future
Gigamon’s Roadmap Execution
• Gigamon endured a tough year in 2014 due to revenue
shortfalls, cancellation of an EMEA contract
• In 2014, Gigamon went through a massive change in executive
leadership, recruiting new talent
• Revamped leadership has allowed Gigamon to propel into
success with a team of industry veterans
• Revenue grew by 41% from 2014 to 2015 with revenue
in each geographic segment increasing
• Gross margins grew from 76% to 79% from 2014 to
2015
• Growing capacity and driving efficiency within Gigamon
• 50% increase of engineering capacity, Q1’15 to Q1’16
• 14% decrease of cost/employee, Q1’15 to Q1’16
• 8% increase of R&D productivity, Q1’15 to Q1’16
• Expanded customer base by over 300 from 2014 to 2015
• Strong growth in security, representing 60% of revenue in Q1’16
Helmut Wilke – Sr. VP of Worldwide Sales (2014 –
Present)
• Veteran in the information technology market with over 20 years
of experience in global sales
“Accelerating profitable growth, consistent
execution and market leadership – these are
the hallmarks of our organization” – Paul
Hooper, CEO of Gigamon
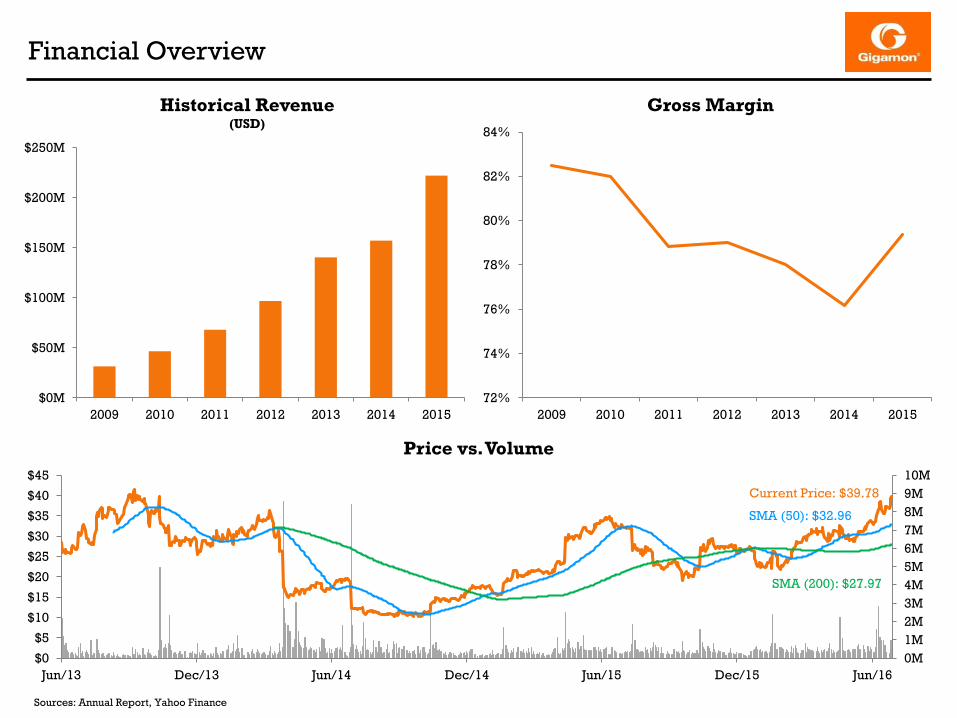
Financial Overview
Sources: Annual Report, Yahoo Finance
$0M
$50M
$100M
$150M
$200M
$250M
2009 2010 2011 2012 2013 2014 2015
Historical Revenue (USD)
72%
74%
76%
78%
80%
82%
84%
2009 2010 2011 2012 2013 2014 2015
Gross Margin
0M
1M
2M
3M
4M
5M
6M
7M
8M
9M
10M
$0
$5
$10
$15
$20
$25
$30
$35
$40
$45
Jun/13 Dec/13 Jun/14 Dec/14 Jun/15 Dec/15 Jun/16
Price vs. Volume
Current Price: $39.78
SMA (50): $32.96
SMA (200): $27.97
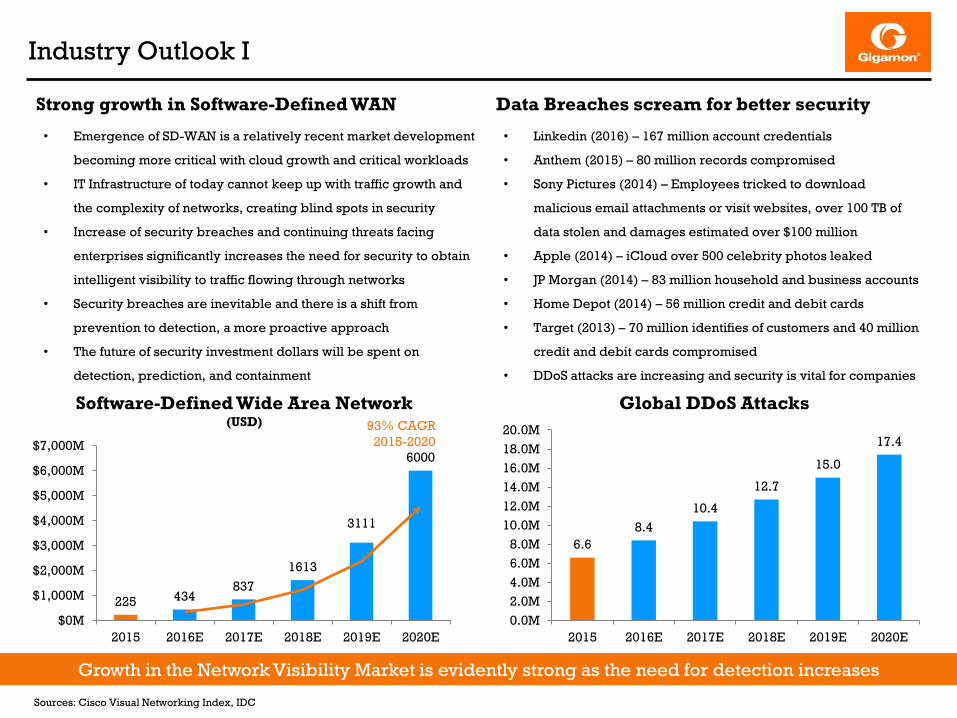
Industry Outlook I
Sources: Cisco Visual Networking Index, IDC
Strong growth in Software-Defined WAN Data Breaches scream for better security
• Emergence of SD-WAN is a relatively recent market development
becoming more critical with cloud growth and critical workloads
• IT Infrastructure of today cannot keep up with traffic growth and
the complexity of networks, creating blind spots in security
• Increase of security breaches and continuing threats facing
enterprises significantly increases the need for security to obtain
intelligent visibility to traffic flowing through networks
• Security breaches are inevitable and there is a shift from
prevention to detection, a more proactive approach
• The future of security investment dollars will be spent on
detection, prediction, and containment
• Linkedin (2016) – 167 million account credentials
• Anthem (2015) – 80 million records compromised
• Sony Pictures (2014) – Employees tricked to download
malicious email attachments or visit websites, over 100 TB of
data stolen and damages estimated over $100 million
• Apple (2014) – iCloud over 500 celebrity photos leaked
• JP Morgan (2014) – 83 million household and business accounts
• Home Depot (2014) – 56 million credit and debit cards
• Target (2013) – 70 million identifies of customers and 40 million
credit and debit cards compromised
• DDoS attacks are increasing and security is vital for companies
Growth in the Network Visibility Market is evidently strong as the need for detection increases
225 434837
1613
3111
6000
$0M
$1,000M
$2,000M
$3,000M
$4,000M
$5,000M
$6,000M
$7,000M
2015 2016E 2017E 2018E 2019E 2020E
Software-Defined Wide Area Network(USD) 93% CAGR
2015-2020
6.6
8.4
10.4
12.7
15.0
17.4
0.0M
2.0M
4.0M
6.0M
8.0M
10.0M
12.0M
14.0M
16.0M
18.0M
20.0M
2015 2016E 2017E 2018E 2019E 2020E
Global DDoS Attacks
Industry Outlook II
Sources: Cisco Visual Networking Index, Crehan Research
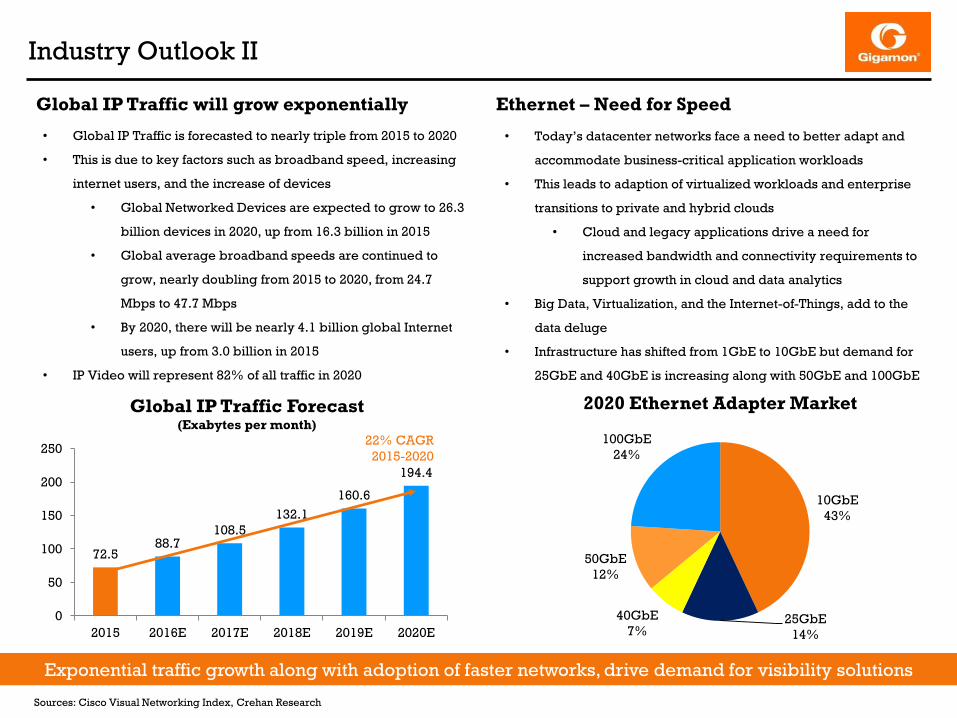
Global IP Traffic will grow exponentially
• Global IP Traffic is forecasted to nearly triple from 2015 to 2020
• This is due to key factors such as broadband speed, increasing
internet users, and the increase of devices
• Global Networked Devices are expected to grow to 26.3
billion devices in 2020, up from 16.3 billion in 2015
• Global average broadband speeds are continued to
grow, nearly doubling from 2015 to 2020, from 24.7
Mbps to 47.7 Mbps
• By 2020, there will be nearly 4.1 billion global Internet
users, up from 3.0 billion in 2015
• IP Video will represent 82% of all traffic in 2020
Ethernet – Need for Speed
Exponential traffic growth along with adoption of faster networks, drive demand for visibility solutions
72.588.7
108.5
132.1
160.6
194.4
0
50
100
150
200
250
2015 2016E 2017E 2018E 2019E 2020E
Global IP Traffic Forecast(Exabytes per month)
22% CAGR
2015-2020
• Today’s datacenter networks face a need to better adapt and
accommodate business-critical application workloads
• This leads to adaption of virtualized workloads and enterprise
transitions to private and hybrid clouds
• Cloud and legacy applications drive a need for
increased bandwidth and connectivity requirements to
support growth in cloud and data analytics
• Big Data, Virtualization, and the Internet-of-Things, add to the
data deluge
• Infrastructure has shifted from 1GbE to 10GbE but demand for
25GbE and 40GbE is increasing along with 50GbE and 100GbE
10GbE
43%
25GbE
14%
40GbE
7%
50GbE
12%
100GbE
24%
2020 Ethernet Adapter Market

Investment Thesis I - Management driving strong fundamentals
Sources: Annual Report, Company Website
Enormous growth expected to stay strong
• Gigamon’s Q1’16 revenue represents a 43.5% y/y growth and a
6-Year CAGR of 38.5% from 2009
• Gigamon has amassed over 2,000 end-user customers in Q1’16
(from 1,010 in 2012) which includes 78 of the Fortune 100 and 50 of
the Top 100 Global Service Providers
• Strong repeat buying demonstrates the strength of Gigamon’s
solutions with their Top 25 customers spending 92x the amount of
their first purchase
• The Federal Market is experiencing enormous growth with the U.S.
Government being the most attacked enterprise in the world
• Federal revenue experienced a 75% y/y growth rate
• Federal bookings have also increased 160% y/y
• Revenue broken down by geography has experienced increases
in all areas, indicating a growing global presence
Gigamon has displayed impeccable success with robust evidence for strong growth
Disrupting the Markets
• Renewed leadership has allowed Gigamon to stimulate success
with increased efficiencies, effectiveness, and innovation, posting
a 7th consecutive beat-and-raise quarters
• The demand for security has been one of Gigamon’s key segment
that will continue to disrupt markets with product innovation
• Security represented 35%, 45% and 60% of revenue in
FY’14, FY‘15, and Q1’16
• Inline bypass module for security shows a 50% attach rate
to all HC2 appliances sold in Q1’16
• Network and Metadata Generation, best seller of Q1’16
• Strength in mobility markets: FlowVUE and GTP
Correlation experiencing 100% y/y growth
• Continuous innovation to the Visibility Fabric, enhancing
functionality and scalability
10101300
16001900
2045
0
500
1,000
1,500
2,000
2,500
2012 2013 2014 2015 Q1 2016
Number of Customers

Investment Thesis II - Visibility into the Cloud
Sources: Annual Report, Company Website
Visibility into Information Traversing the Cloud
Market Mispricing
• On Sept 9, 2013 , Gigamon traded at $40.30 and as of July 14,
2016 Gigamon trades at $39.78
• The market has only reverted back to similar levels but fail to
realize its full potential
• The market has not realized the importance and impact that
Network Visibility will play in the future of cybersecurity,
relatively new market development
• The market does not realize the potential of growth with related
industry trends - increase of data, devices, and attacks
Gigamon’s caliber of talent has allowed them to lead the industry’s innovation, positioned for strong success
• Gigamon is offering the industry’s first visibility solution to
monitor information that traverses the public cloud
• Developed with Fortune 100 customers and field trials
will be carried out on Amazon’s Web Services
• Enables customers to gain visibility to AWS workloads,
guaranteeing performance and security that AWS does
not provide today
• Solution is platform agnostic, will be extended to Microsoft
Azure and Google Cloud
• Enterprises have been held back from the public cloud due to
constraints such as inability to access traffic, security concerns,
lack of sufficient tools and backhaul costs
• Visibility to information traversing the public cloud is critical for
continuous monitoring and security of application workloads
Visibility into Information – Anywhere, Anytime

Valuation - Summary
Sources: Annual Report, Capital IQ
Summary
Gigamon’s current price of $39.78 indicates a significant discount to a target price of $47.00, implying a 17.6% return. A target price of $47.00
was achieved through a blended DCF analysis using the Gordon Growth Method and Multiples Method. Gigamon is valued at a premium when
compared with its competitors based on trading multiples, P/E and EV/EBITDA. This is justified given the size of the comparables, measured by
market capitalization ($10B and under) and Gigamon’s growth potential. Viewed on a NTM P/E and EV/EBITDA multiple, Gigamon starts to
become more attractive in comparison with competitors as it grows revenues and earnings. With a six-year revenue CAGR of 39% and a
sustained gross margin over 80%, this presents an attractive opportunity to capture Gigamon at a discount. Gigamon commands the second
highest LTM revenue growth rate and gross margins among competitors with medians of 11.72% and 72.7% respectively. Gigamon is the
market leader in Network Visibility Solutions and is expanding in an industry yearning for innovative solutions to combat the growing number of
cyberattacks.
Current Price
$39.78
Target Price
$47.00
$53.83
$59.11
$39.73
$50.00
$33.62
$47.84
$18.93
$35.00
$0 $10 $20 $30 $40 $50 $60 $70
DCF (GGM)
DCF (MM)
52-Week Range
Analyst Consensus
Valuation – Financial Statements
Sources: Annual Report
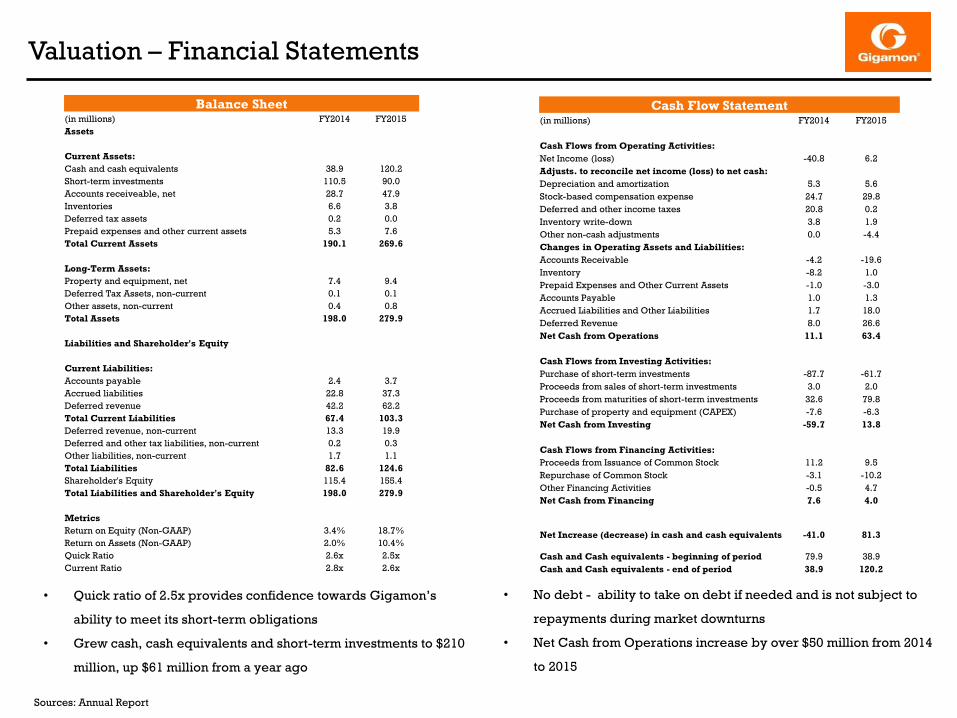
Balance Sheet(in millions) FY2014 FY2015
Assets
Current Assets:
Cash and cash equivalents 38.9 120.2
Short-term investments 110.5 90.0
Accounts receiveable, net 28.7 47.9
Inventories 6.6 3.8
Deferred tax assets 0.2 0.0
Prepaid expenses and other current assets 5.3 7.6
Total Current Assets 190.1 269.6
Long-Term Assets:
Property and equipment, net 7.4 9.4
Deferred Tax Assets, non-current 0.1 0.1
Other assets, non-current 0.4 0.8
Total Assets 198.0 279.9
Liabilities and Shareholder's Equity
Current Liabilities:
Accounts payable 2.4 3.7
Accrued liabilities 22.8 37.3
Deferred revenue 42.2 62.2
Total Current Liabilities 67.4 103.3
Deferred revenue, non-current 13.3 19.9
Deferred and other tax liabilities, non-current 0.2 0.3
Other liabilities, non-current 1.7 1.1
Total Liabilities 82.6 124.6
Shareholder's Equity 115.4 155.4
Total Liabilities and Shareholder's Equity 198.0 279.9
Metrics
Return on Equity (Non-GAAP) 3.4% 18.7%
Return on Assets (Non-GAAP) 2.0% 10.4%
Quick Ratio 2.6x 2.5x
Current Ratio 2.8x 2.6x
Cash Flow Statement(in millions) FY2014 FY2015
Cash Flows from Operating Activities:
Net Income (loss) -40.8 6.2
Adjusts. to reconcile net income (loss) to net cash:
Depreciation and amortization 5.3 5.6
Stock-based compensation expense 24.7 29.8
Deferred and other income taxes 20.8 0.2
Inventory write-down 3.8 1.9
Other non-cash adjustments 0.0 -4.4
Changes in Operating Assets and Liabilities:
Accounts Receivable -4.2 -19.6
Inventory -8.2 1.0
Prepaid Expenses and Other Current Assets -1.0 -3.0
Accounts Payable 1.0 1.3
Accrued Liabilities and Other Liabilities 1.7 18.0
Deferred Revenue 8.0 26.6
Net Cash from Operations 11.1 63.4
Cash Flows from Investing Activities:
Purchase of short-term investments -87.7 -61.7
Proceeds from sales of short-term investments 3.0 2.0
Proceeds from maturities of short-term investments 32.6 79.8
Purchase of property and equipment (CAPEX) -7.6 -6.3
Net Cash from Investing -59.7 13.8
Cash Flows from Financing Activities:
Proceeds from Issuance of Common Stock 11.2 9.5
Repurchase of Common Stock -3.1 -10.2
Other Financing Activities -0.5 4.7
Net Cash from Financing 7.6 4.0
Net Increase (decrease) in cash and cash equivalents -41.0 81.3
Cash and Cash equivalents - beginning of period 79.9 38.9
Cash and Cash equivalents - end of period 38.9 120.2
• No debt - ability to take on debt if needed and is not subject to
repayments during market downturns
• Net Cash from Operations increase by over $50 million from 2014
to 2015
• Quick ratio of 2.5x provides confidence towards Gigamon’s
ability to meet its short-term obligations
• Grew cash, cash equivalents and short-term investments to $210
million, up $61 million from a year ago

Valuation – Public Company Comparables
Sources: Annual Report, Capital IQ
Stock Price
(07/01/16)
Market
Capitalization
Enterprise
ValueP/E NTM P/E EV / EBITDA
NTM EV /
EBITDAEV/Revenue
NTM
EV/Revenue
Arista Networks, Inc. (NYSE:ANET) 63.66 4,368.9 3,647.5 35.1x 21.80x 20.4x 11.37x 4.0x 3.20x
Barracuda Networks, Inc. (NYSE:CUDA) 15.18 793.6 642.9 NM 32.02x 76.6x 11.80x 2.0x 1.89x
Brocade Communications Systems, Inc.
(NasdaqGS:BRCD)
9.25 4,322.6 3,697.4 12.5x 10.42x 6.8x 6.68x 1.7x 1.57x
F5 Networks, Inc. (NasdaqGS:FFIV) 113.52 7,603.6 6,828.6 22.4x 15.27x 11.7x 8.51x 3.5x 3.34x
Infoblox Inc. (NYSE:BLOX) 18.75 1,066.9 789.7 NM 43.22x NM 17.17x 2.2x 2.22x
Ixia (NasdaqGS:XXIA) 9.8 801.2 756.5 63.2x 18.67x 9.6x 9.11x 1.5x 1.50x
Juniper Networks, Inc. (NYSE:JNPR) 22.35 8,581.2 8,467.6 13.6x 10.69x 7.7x 6.39x 1.7x 1.71x
NetScout Systems, Inc. (NasdaqGS:NTCT) 22.16 2,077.7 2,039.0 NM 11.64x 29.1x 5.66x 2.1x 1.68x
Gigamon Inc. (NYSE:GIMO) 37.38 1,305.4 1,097.3 141.9x 33.63x 52.1x 16.60x 4.5x 3.59x
High 113.52 8,581.2 8,467.6 63.2x 43.22x 76.6x 17.17x 4.0x 3.34x
Low 9.25 793.6 642.9 12.5x 10.42x 6.8x 5.66x 1.5x 1.50x
Mean 34.33 3,701.9 3,358.6 29.4x 20.47x 23.1x 9.59x 2.3x 2.14x
Median 20.46 3,200.1 2,843.2 22.4x 16.97x 11.7x 8.81x 2.1x 1.80x
• As a small cap company, revenue growth is the most important
factor as it demonstrates attraction and its ability to grow
• Gigamon commanded 40.71% revenue growth in its LTM and
projects a 26.2% growth rate for its NTM
• Gigamon displayed an impressive 80.5% gross margin in its LTM
that remains strong as they increase efficiencies
LTM Total
Revenue
NTM
Revenue
LTM Revenue
Growth Rate
NTM Revenue
Growth Rate
LTM Gross
Margin %
LTM EBITDA
Margin %
LTM EBIT
Margin %
LTM Net Income
Margin %
NTM LT EPS
Growth Rate
Arista Networks, Inc. (NYSE:ANET) 900.7 1,140.55 39.45% 26.6% 64.5% 19.9% 18.1% 14.64% 20.25%
Barracuda Networks, Inc. (NYSE:CUDA) 320.2 340.14 15.39% 6.2% 78.1% 2.6% (1.2%) (1.38%) 22.43%
Brocade Communications Systems, Inc.
(NasdaqGS:BRCD)
2,238.2 2,348.62 0.25% 4.9% 67.3% 24.1% 20.1% 13.97% 6.76%
F5 Networks, Inc. (NasdaqGS:FFIV) 1,958.1 2,044.37 6.39% 4.4% 82.7% 29.9% 27.7% 18.15% 12.22%
Infoblox Inc. (NYSE:BLOX) 359.0 356.4 26.38% -0.7% 78.9% 0.2% (2.8%) (2.27%) 19.00%
Ixia (NasdaqGS:XXIA) 508.6 502.84 7.84% -1.1% 78.3% 15.5% 4.0% 2.53% 12.50%
Juniper Networks, Inc. (NYSE:JNPR) 4,888.3 4,944.49 8.04% 1.1% 63.6% 22.4% 18.9% 13.19% 11.30%
NetScout Systems, Inc. (NasdaqGS:NTCT) 955.4 1,211.58 110.60% 26.8% 65.6% 7.3% (2.6%) (2.97%) 14.00%
Gigamon Inc. (NYSE:GIMO) 242.3 305.89 40.71% 26.2% 80.5% 8.7% 6.5% 4.07% 26.29%
High 4,888.3 4,944.49 110.60% 26.8% 82.7% 29.9% 27.7% 18.15% 22.43%
Low 320.2 340.14 0.25% -1.1% 63.6% 0.2% (2.8%) (2.97%) 6.76%
Mean 1,516.1 1,611.12 26.79% 8.5% 72.4% 15.2% 10.3% 6.98% 14.81%
Median 928.1 1,176.06 11.72% 4.7% 72.7% 17.7% 11.1% 7.86% 13.25%
• Gigamon’s P/E of 141.9x stands out and may concern investors
but given the size of the company, this is expected given the
growth potential
• Considering NTM P/E of 33.63x remains above the comparable
mean, this is reasonable given the leadership position it holds
and robust future
Valuation – Discounted Cash Flow Analysis I
Sources: Annual Report, Company Website
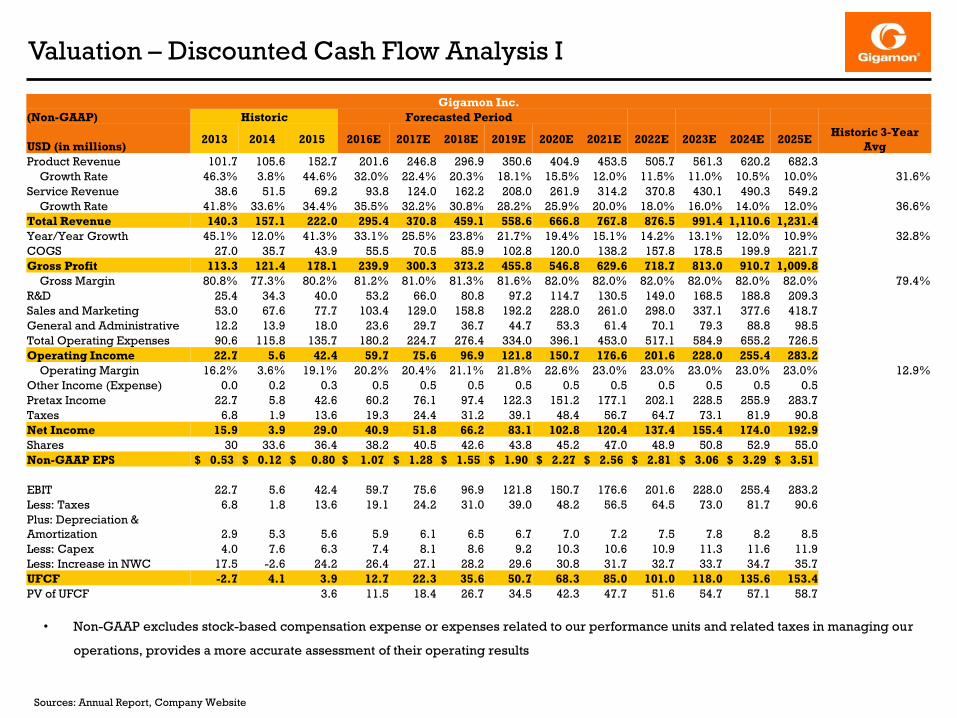
• Non-GAAP excludes stock-based compensation expense or expenses related to our performance units and related taxes in managing our
operations, provides a more accurate assessment of their operating results
Gigamon Inc.
(Non-GAAP) Historic Forecasted Period
USD (in millions)2013 2014 2015 2016E 2017E 2018E 2019E 2020E 2021E 2022E 2023E 2024E 2025E
Historic 3-Year
Avg
Product Revenue 101.7 105.6 152.7 201.6 246.8 296.9 350.6 404.9 453.5 505.7 561.3 620.2 682.3
Growth Rate 46.3% 3.8% 44.6% 32.0% 22.4% 20.3% 18.1% 15.5% 12.0% 11.5% 11.0% 10.5% 10.0% 31.6%
Service Revenue 38.6 51.5 69.2 93.8 124.0 162.2 208.0 261.9 314.2 370.8 430.1 490.3 549.2
Growth Rate 41.8% 33.6% 34.4% 35.5% 32.2% 30.8% 28.2% 25.9% 20.0% 18.0% 16.0% 14.0% 12.0% 36.6%
Total Revenue 140.3 157.1 222.0 295.4 370.8 459.1 558.6 666.8 767.8 876.5 991.4 1,110.6 1,231.4
Year/Year Growth 45.1% 12.0% 41.3% 33.1% 25.5% 23.8% 21.7% 19.4% 15.1% 14.2% 13.1% 12.0% 10.9% 32.8%
COGS 27.0 35.7 43.9 55.5 70.5 85.9 102.8 120.0 138.2 157.8 178.5 199.9 221.7
Gross Profit 113.3 121.4 178.1 239.9 300.3 373.2 455.8 546.8 629.6 718.7 813.0 910.7 1,009.8
Gross Margin 80.8% 77.3% 80.2% 81.2% 81.0% 81.3% 81.6% 82.0% 82.0% 82.0% 82.0% 82.0% 82.0% 79.4%
R&D 25.4 34.3 40.0 53.2 66.0 80.8 97.2 114.7 130.5 149.0 168.5 188.8 209.3
Sales and Marketing 53.0 67.6 77.7 103.4 129.0 158.8 192.2 228.0 261.0 298.0 337.1 377.6 418.7
General and Administrative 12.2 13.9 18.0 23.6 29.7 36.7 44.7 53.3 61.4 70.1 79.3 88.8 98.5
Total Operating Expenses 90.6 115.8 135.7 180.2 224.7 276.4 334.0 396.1 453.0 517.1 584.9 655.2 726.5
Operating Income 22.7 5.6 42.4 59.7 75.6 96.9 121.8 150.7 176.6 201.6 228.0 255.4 283.2
Operating Margin 16.2% 3.6% 19.1% 20.2% 20.4% 21.1% 21.8% 22.6% 23.0% 23.0% 23.0% 23.0% 23.0% 12.9%
Other Income (Expense) 0.0 0.2 0.3 0.5 0.5 0.5 0.5 0.5 0.5 0.5 0.5 0.5 0.5
Pretax Income 22.7 5.8 42.6 60.2 76.1 97.4 122.3 151.2 177.1 202.1 228.5 255.9 283.7
Taxes 6.8 1.9 13.6 19.3 24.4 31.2 39.1 48.4 56.7 64.7 73.1 81.9 90.8
Net Income 15.9 3.9 29.0 40.9 51.8 66.2 83.1 102.8 120.4 137.4 155.4 174.0 192.9
Shares 30 33.6 36.4 38.2 40.5 42.6 43.8 45.2 47.0 48.9 50.8 52.9 55.0
Non-GAAP EPS $ 0.53 $ 0.12 $ 0.80 $ 1.07 $ 1.28 $ 1.55 $ 1.90 $ 2.27 $ 2.56 $ 2.81 $ 3.06 $ 3.29 $ 3.51
EBIT 22.7 5.6 42.4 59.7 75.6 96.9 121.8 150.7 176.6 201.6 228.0 255.4 283.2
Less: Taxes 6.8 1.8 13.6 19.1 24.2 31.0 39.0 48.2 56.5 64.5 73.0 81.7 90.6
Plus: Depreciation &
Amortization 2.9 5.3 5.6 5.9 6.1 6.5 6.7 7.0 7.2 7.5 7.8 8.2 8.5
Less: Capex 4.0 7.6 6.3 7.4 8.1 8.6 9.2 10.3 10.6 10.9 11.3 11.6 11.9
Less: Increase in NWC 17.5 -2.6 24.2 26.4 27.1 28.2 29.6 30.8 31.7 32.7 33.7 34.7 35.7
UFCF -2.7 4.1 3.9 12.7 22.3 35.6 50.7 68.3 85.0 101.0 118.0 135.6 153.4
PV of UFCF 3.6 11.5 18.4 26.7 34.5 42.3 47.7 51.6 54.7 57.1 58.7
Valuation – Discounted Cash Flow Analysis II
Sources: Annual Report, Company Website
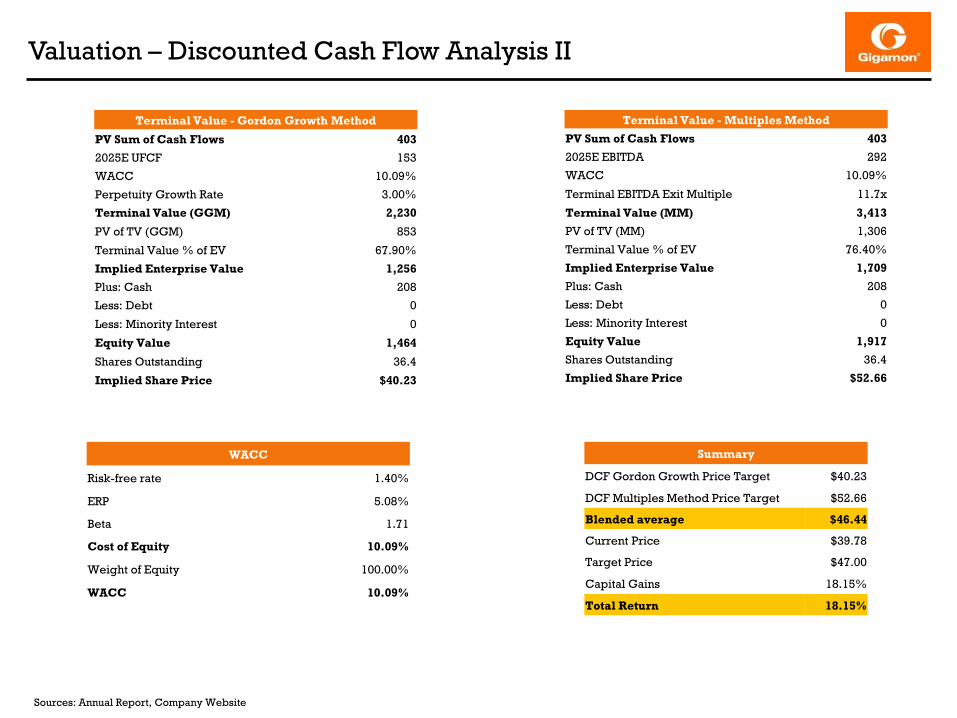
WACC
Risk-free rate 1.40%
ERP 5.08%
Beta 1.71
Cost of Equity 10.09%
Weight of Equity 100.00%
WACC 10.09%
Terminal Value - Multiples Method
PV Sum of Cash Flows 403
2025E EBITDA 292
WACC 10.09%
Terminal EBITDA Exit Multiple 11.7x
Terminal Value (MM) 3,413
PV of TV (MM) 1,306
Terminal Value % of EV 76.40%
Implied Enterprise Value 1,709
Plus: Cash 208
Less: Debt 0
Less: Minority Interest 0
Equity Value 1,917
Shares Outstanding 36.4
Implied Share Price $52.66
Terminal Value - Gordon Growth Method
PV Sum of Cash Flows 403
2025E UFCF 153
WACC 10.09%
Perpetuity Growth Rate 3.00%
Terminal Value (GGM) 2,230
PV of TV (GGM) 853
Terminal Value % of EV 67.90%
Implied Enterprise Value 1,256
Plus: Cash 208
Less: Debt 0
Less: Minority Interest 0
Equity Value 1,464
Shares Outstanding 36.4
Implied Share Price $40.23
Summary
DCF Gordon Growth Price Target $40.23
DCF Multiples Method Price Target $52.66
Blended average $46.44
Current Price $39.78
Target Price $47.00
Capital Gains 18.15%
Total Return 18.15%

Risks & Catalysts
Sources: Annual Report, Company Website
Risks
• Highly competitive industry, existing competitors will bundle
new and more competitive offerings
• New market entrants are expected
• Other market competitors will emerge that may have
greater name recognition, longer operating histories,
well-established relationships with end-user customers
or channel partners
• High importance for R&D - New technology could render
Gigamon’s existing products obsolete or less attractive to end-
user customers
• Ability to introduce new products/innovate
• Growing relationships with VAR resellers
• ePlus is the largest reseller of Cisco security in North
America and is a significant channel for Gigamon
• Focused on expanding internationally – hiring 2x sales people
internationally vs US
• Increase of global employees (375 in Q1 15 to 534 in Q1 16)
• Automated network topology visualization for data centers
• Enhances the ease of use and administration and network
visibility by providing end-to-end visualization of the
Visibility Fabric components
• Three long-term growth drivers:
• Virtualization
• 3G and LTE/VoLTE rollouts
• Network upgrade cycle from 1GbE to 10/40/100 GbE
Catalysts
Gigamon’s Security Ecosystem Partners

Thank you!
Gigamon Inc. – Visibility, the new business imperative.

Appendix I
Sources: Company Website
Challenges With Today’s Security Architectures
Gigamon’s Security Delivery Platform
Gigamon’s Platform enables deployment of a wide range of security solutions and scalability
• Perimeter-based prevention -> multi-layered exploits use
multiple ways to intrude
• Significant blind spots, blind to encrypted traffic
• Simple trust model -> network perimeters have dissolved,
as have trust zones
• Contention for access to traffic
• Static security policies -> devices are high mobile and now
so are servers
• Inconsistent view of traffic
• Complexity -> the number of security applications is
enormous and growing
• Extraordinary costs, too many false positives
• Delivers visibility into lateral movement of
malware
• Accelerates detection of exfiltration activity
• Significantly reduces overhead, complexity
and costs associated with security
deployments
• Fewer network touch points and enhanced
tool efficiency
• Provides consistent access to relevant data
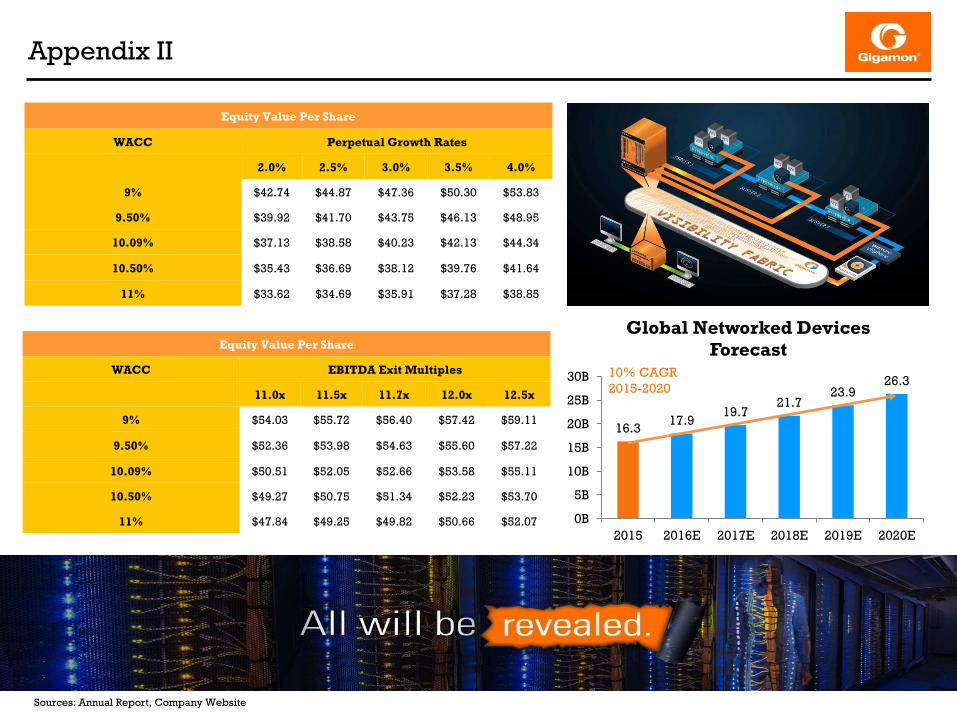
Appendix II
Sources: Annual Report, Company Website
Equity Value Per Share
WACC Perpetual Growth Rates
$40.23 2.0% 2.5% 3.0% 3.5% 4.0%
9% $42.74 $44.87 $47.36 $50.30 $53.83
9.50% $39.92 $41.70 $43.75 $46.13 $48.95
10.09% $37.13 $38.58 $40.23 $42.13 $44.34
10.50% $35.43 $36.69 $38.12 $39.76 $41.64
11% $33.62 $34.69 $35.91 $37.28 $38.85
Equity Value Per Share
WACC EBITDA Exit Multiples
$52.66 11.0x 11.5x 11.7x 12.0x 12.5x
9% $54.03 $55.72 $56.40 $57.42 $59.11
9.50% $52.36 $53.98 $54.63 $55.60 $57.22
10.09% $50.51 $52.05 $52.66 $53.58 $55.11
10.50% $49.27 $50.75 $51.34 $52.23 $53.70
11% $47.84 $49.25 $49.82 $50.66 $52.07
16.317.9
19.721.7
23.926.3
0B
5B
10B
15B
20B
25B
30B
2015 2016E 2017E 2018E 2019E 2020E
Global Networked Devices
Forecast10% CAGR
2015-2020