gini mean difference
DESCRIPTION
statisticsTRANSCRIPT
METRON - International Journal of Statistics2003, vol. LXI, n. 2, pp. 285-316
SHLOMO YITZHAKI
Gini’s Mean difference: a superior measureof variability for non-normal distributions
Summary - Of all measures of variability, the variance is by far the most popular. Thispaper argues that Gini’s Mean Difference (GMD), an alternative index of variability,shares many properties with the variance, but can be more informative about theproperties of distributions that depart from normality. Its superiority over the varianceis important whenever one is interested in one or more of the following properties:(a) stochastic dominance: the GMD can be used to form necessary conditions forstochastic dominance, while the variance cannot; (b) exchangeability: the GMD hastwo correlation coefficients associated with it, the difference between them beingsensitive to the exchangeability between the marginal distributions. This propertymay play an important role whenever the ”index number” problem is severe, (i.e.,whenever the choice of the base for comparison between two marginal distributionsmay determine the direction of the results), or whenever the investigation procedureis based on an optimization procedure; (c) stratification: when the overall distributionis composed of sub-populations, the GMD is sensitive to stratification among sub-populations. The paper surveys the properties of the two indices of variability anddiscusses their relevance to several fields of research.
Key Words - Variance; Correlation; ANOVA; Gini Mean Difference.
1. Introduction
Of all measures of variability, the variance is by far the most popular.In this paper, it is argued that Gini’s Mean Difference (Gini, 1912, hereafterGMD) is the most similar to the variance and shares many properties withit. However, while the variance is convenient and superior to the GMD fordistributions that are nearly normal, the GMD is more informative about theunderlined distributions. Its superiority over the variance is especially im-portant in three fields: (a) Stochastic dominance: the GMD can be used toform necessary conditions for second-degree stochastic dominance, while thevariance cannot. This property protects the investigator from making embar-
Received May 2003 and revised August 2003.
286 S. YITZHAKI
rassing mistakes in the fields of decision-making under risk and social welfare.(b) Exchangeability: it has two correlation coefficients associated with it, thedifference between them is sensitive as to whether the marginal distributions areexchangeable. This property may play an important role in two types of cases.One arises when the ”index number” problem is severe, that is whenever thechoice of the base for comparison may determine the direction of the results.For example, when measuring changes over time, the results may depend onthe choice of whether we are moving forward or backward in time. Alterna-tively, when comparing countries then the results may differ according to thecountry chosen to be the base for comparison. The other arises whenever theinvestigation procedure is based on an optimization procedure. By construc-tion, an optimization procedure results in an orthogonality condition whichimplies that a covariance (or covariances) is set to equal zero. Under the GMDframework the other covariance can be used to test the assumptions that ledto the optimization. For example, in the case of regression analysis, using theGMD enables the investigator to construct a built-in specification test (Schecht-man and Yitzhaki (2000)). (c) Stratification: when the overall distribution iscomposed of sub-populations, the GMD is sensitive to stratification among sub-populations. Therefore, we can claim that it reveals more information aboutthe distributions.
Before making the case for the GMD, it is worthwhile to review the usefulproperties of the variance. The most important are:
(a) Normality: the variance is a parameter in the normal distribution. This isan advantage whenever the distribution is normal or converges to normal.
(b) Decomposability:(b.1) The variance of the sum of two random variables decomposes neatly
into the sum of the variances, plus a term that is a function of thecorrelation between the two variables.
(b.2) In the special case of two independent variables the variance of thesum is equal to the sum of the variances.
(b.3) The variance of two mixed sub-populations can be decomposed intothe intra and inter group variances.
(c) The variance is a quadratic function of the variate, and a quadratic functionis easy to handle.
In contrast to the variance, the main advantage of the GMD lies in itsnon-decomposability. In general, it is impossible to decompose the GMD of asum of two random variables into a formula that is similar to the decompositionof the variance. However, under certain conditions on the distributions it ispossible to imitate the decomposition of the variance. The conditions thatallow the imitation enable the investigator to observe additional properties of

Gini’s Mean Difference: A superior measure of variability . . . 287
the distributions. Those properties may be important in areas like sociology andmarket structure. Another advantage of the GMD is that it is a member of afamily of variability measures, the extended Gini family (Yitzhaki, 1983), thatshares some of the main properties of the GMD, and it is useful for conductingsensitivity analysis. However, this family was mainly developed to fit economictheory and its adjustment to general data analysis brings complications. Forthis reason, I do not pursue this direction in this paper.
The structure of the paper is the following: Section 2 presents the similar-ities between the two measures of variability, Section 3 extends the comparisonto the covariances and correlations associated with each index. Section 4 isdevoted to the Absolute Concentration Curve, a tool that enables us to get ad-ditional information on the internal structure of the variance and GMD. Section5 is devoted to the connection between Stochastic Dominance and GMD, Sec-tion 6 is devoted to the decomposition of the variability of the sum of randomvariables, while Section 7 deals with decomposition by population subgroupsand stratification. Section 8 presents the extension to higher moments, andSection 9 discusses distances between distributions. Section 10 concludes.
To simplify the notation, I will make no distinction between populationparameters and estimators. The estimator is always assumed to be the sample’sversion of the population parameter. However, there are two cases where onehas to distinguish between the population and the sample. The populationversion will feature upper-case letters and be denoted with an equation numberfollowed by a p. The sample version will be displayed with lower-case letterswith an equation number followed by an s.
2. The similarities and differences between the variance and the GMD
2.1. Similarities
The most popular presentation of the variance is as a second central momentof the distribution. The most popular presentation of the GMD is as theexpected absolute difference between two i.i.d. variables. (See Giorgi (1990)for a bibliographic portrait.) Using the absolute difference between two i.i.d.variables in order to measure variability characterized the Italian school, led byCorrado Gini, while reliance on central moments characterized the rest of theprofession. This difference in outlook was the source of confrontation betweenthe Italian school and what Gini viewed as the Western schools. (See Gini,1965, 1966, p. 199; Hart, 1975.)
In retrospect, it seems that both sides were both right and wrong: bothmeasures can be presented as central moments and also as based on the expecteddifference between two i.i.d. variables. To see this note the following:

288 S. YITZHAKI
2.1.1 –a)
Both indices can be defined without reference to a location parameter.Let Xi(i = 1, 2) be two i.i.d. random variables. Then
G X = E{| X1 − X2 |}, (2.1)
where G X is the GMD of X . In contrast
VX = (1/2)E{(X1 − X2)2}, (2.2)
where Vx is the variance. That is, the GMD is the expected absolute differencebetween two randomly drawn observations, while the variance is the expectedsquare of the same difference. It is interesting to note that Equation (2.2)raised to the power r is referred to as generalized mean difference (Gini, 1966,Ramasubban, 1958, 1959, 1960). However, as far as I know, they were notaware that when r = 2 it is identical to the variance. Furthermore, both indicescan be written as a special case of a covariance:
G X = 4 COV(X, F(X)), (2.3)
whilst
VX = COV(X, X). (2.4)
That is, the GMD is (four times) the covariance of a random variable with itscumulative distribution, F(X), while the variance is the covariance of a randomvariable with itself (Yitzhaki, (1998). Stuart (1954) seems the first to identifythis identity, for normal distributions).
As can be seen from (2.1) and (2.2), both indices can be defined withoutreference to a specific location parameter, such as the mean. This property canexplain why it is possible, in regression analysis, to estimate the constant termin a different methodology then the one applied to estimate the slopes. To seethe importance of this property note that one justification for Least AbsoluteDeviation regression (Bassett and Koenker, 1978) is that one may want theregression line to pass through the median (instead of the mean). If one wantsto force the OLS (or GMD) regressions to pass through the median, one couldfirst minimize the variance of the error term using version (2.2), in order toestimate the regression coefficients. Then one has to subtract the contributionof the independent variables from the dependent variable, and then to minimizethe absolute deviation of the revised dependent variable by choosing a constantterm. The result will be an OLS regression that passes through the median.

Gini’s Mean Difference: A superior measure of variability . . . 289
2.1.1 –b)
Both indices are sensitive to all observations. Note that the range, theabsolute mean deviation, and inter-quantile difference do not have this property.The variance of the logarithm is sensitive to all observations, but it fails theDalton principle of transfers. See Hart (1975, p.431). Foster and Ok (1999)show that it is not Lorenz-consistent.
2.1.1 –c)
Both indices can be presented graphically by the difference between thecumulative distribution and a first moment distribution, a curve which is knowneither as an Absolute Concentration (AC) curve or as a first moment distribution.This curve enables us to study the detailed structure of the variability indexand the appropriate covariance that accompanies it, a property that is useful indetermining the effect of a monotonic transformation on the variability indexand on the sign of a regression coefficient. The presentation and implications ofthose properties will be discussed later following the description of AC curves.
2.1.1 –d)
Both indices can be presented as a weighted sum of distances betweenadjacent observations. In the population, the GMD can be written as:
COV(X, F(X)) = 0.5∫
F(x)[1 − F(x)]dx . (2.5.p)
To define the GMD in the sample, let �xi , = x(i+1) − x(i), where x(i) is theorder statistic, so that �xi , i = 1, . . . , n − 1 is the distance between adjacentobservations. Then
cov(x, F(x)) = 1
2n(n − 1)
n−1∑i=1
(n − i)i�xi , (2.5.s)
which means that the GMD attaches the largest weight to the section that isclose to the median, and then, the weights declines symmetrically the fartheris the section from the median.
The weighting scheme of the variance is given by:
cov(x, x) =n−1∑i=1
n−1∑j=i
t−1∑k=s
t−1∑p=s
�xk�xp
=n−1∑i=1
n−1∑
j=i
i(n − j)�xj +i−1∑j=1
j (n − i)�xj
�xi ,
(2.6.s)

290 S. YITZHAKI
where s = min(i, j) and t = max(i, j) (Yitzhaki, 1996). The population versionof (2.6.s) is (4.5), adjusted to represent the variance. To see the implicationof (2.6.s), it is convenient to think in terms of an equi-distant distribution, sothat �xi = c, for all i . In this case Equation (2.6.s) becomes
cov(x, x) = Kn−1∑i=1
(n − i)ic2 , (2.7.s)
where K is a normalizing factor, so that the weighting scheme is identical to theGMD weighting scheme. The only difference is that the GMD is a weightedaverage of c, while the variance is a weighted average of c2 (Yitzhaki, 1996).Note that the range is the sum of �xi and therefore can be interpreted asassigning equal weight to each section �xi .
2.1.1 –e)
Both indices can be presented as a weighted sum of Order Statistics.To see this, rewrite the covariance formula of the GMD.
cov(x, F(x)) = 1
n − 1
n∑i=1
2i − (n + 1)
2nx(i) .
The variance can be written in a similar way.
2.2. Differences: City Block versus Euclidean
Both indices are based on averaging a function of the distance betweentwo i.i.d. variables, a property that determines the weighting scheme illustratedin (2.5.s) and (2.6.s). In both cases the weighting scheme attaches the highestweight to the mid-rank observation (i.e., the median), and the weight declinessymmetrically the farther the rank of the observation is from the mid-rank. Thefundamental difference between the two measures of variability is the distancefunction they rely on. The GMD’s distance function is referred to as the “cityblock” distance (or L1), while variance’s distance is Euclidean. It is interestingto note that other measures of variability (e.g., the mean deviation) also relyon the L1 distance, but they do not share the weighting scheme caused by theaveraging.
To shed some light on the difference in distance functions, note that themost basic measure of variability is the range, which is equivalent to the simplesum of the distances between adjacent observations, so that we end up withthe difference between the most extreme parts of the distributions. If thedistributions are restricted to have only two observations then the variance and
Gini’s Mean Difference: A superior measure of variability . . . 291
the GMD (and all other measures of variability) will order all distributions inaccordance with the ordering of the range. However, the range suffers fromtwo major deficiencies: (1) it is not sensitive to the distribution of non-extremeobservations, and (2) there are many important distributions with an infiniterange. By comparing the distance between two i.i.d. variables, the range isdecomposed into segments (distance between adjacent observations) and bothindices have identical structure of weights. The difference is in the distancefunction used.
To illustrate the difference between the distance functions embodied in theGMD and the variance, we can ask, for a given range, which distribution hasthe smallest variance (GMD) and which has the maximum variance (GMD).Alternatively, for a given variance (GMD), we can ask which distribution hasthe largest range. Presumably, by answering those questions, we will be ableto form an opinion as to which distance function is more appropriate, andwhich one reflects our intuition. To illustrate, restrict the distributions to threeobservations, and assume a given (normalized) range so that the discussionis restricted to distributions of the type: [0, δ, 1]. Which δ maximizes orminimizes each variability index? Ignoring constants, the GMD is:
G(δ) =∑ ∑
| xi − xj |= 1 + δ+ | 1 − δ | ,so that the GMD equals 2 independent of the value of δ. Thus the position ofthe middle observation does not change the GMD. Repeating the same exercisewith the variance yields
σ 2(δ) = 1 + δ2 + (1 − δ)2 ,
so that the variance is maximized at δ = 0 or 1, and minimized at δ = 0.5.That is, the more equal are the distances defined by adjacent observations,the lower the variance. The result is that the variance is more sensitive thanthe GMD to variability in �xi , which is translated to sensitivity to extremeobservations.
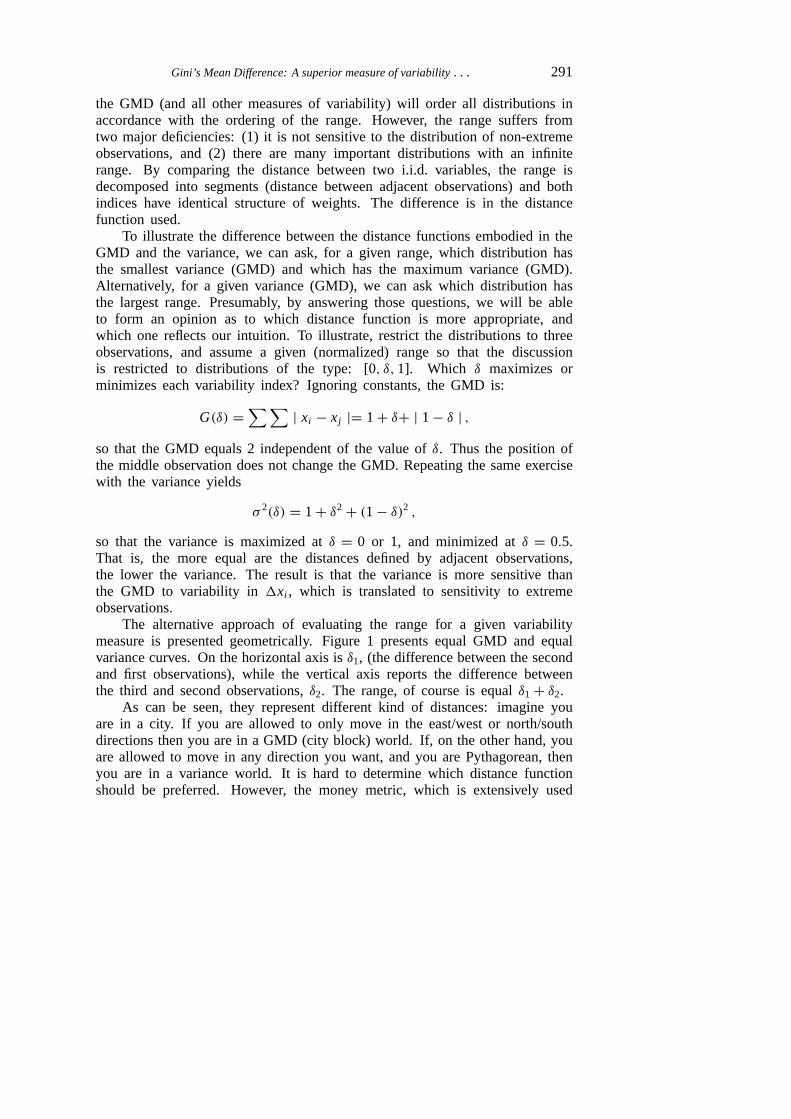
The alternative approach of evaluating the range for a given variabilitymeasure is presented geometrically. Figure 1 presents equal GMD and equalvariance curves. On the horizontal axis is δ1, (the difference between the secondand first observations), while the vertical axis reports the difference betweenthe third and second observations, δ2. The range, of course is equal δ1 + δ2.
As can be seen, they represent different kind of distances: imagine youare in a city. If you are allowed to only move in the east/west or north/southdirections then you are in a GMD (city block) world. If, on the other hand, youare allowed to move in any direction you want, and you are Pythagorean, thenyou are in a variance world. It is hard to determine which distance functionshould be preferred. However, the money metric, which is extensively used

292 S. YITZHAKI
1
1
Euclidean
city block
B
A
C
δ2
δ1
Figure 1. Equal GMD and variance curves.
by economists, resembles the city block metric because the distance functionembodied in the budget constraint is identical to the distance function of theGMD (Deaton, 1979; McKenzie and Pearce, 1982; Jorgenson and Slesnick,1984). Hence, one could have argued, that when it comes to choosing a metriceconomists have preferred the GMD type metric.
The implication of the difference in metrics can also be seen from thefollowing question: consider the following distributions: [0, 0, 1] vs. [0, 0.575,1.15]. Which distribution portrays a higher variability? If your intuitive answerpoints to the former (latter) distribution then you want to be in a variance(GMD) world (the variances are: 0.222, 0.220 respectively). This property isresponsible for the sensitivity of Ordinary Least Squares regression to extremeobservations. Another implication of the difference in metrics is that the GMDexists whenever the expected value exists while the existence of the variancerequires the existence of a second moment.
The extension to more than 3 observations is identical. As can be seenfrom (2.1) and (2.2), both indices are based on differencing i.i.d. variables.Since the differencing is based on every two observations, the weight that isattached to distance between observations is greater the closer the observationto the median, as can be seen from (2.5.s) and (2.7.s). It is interesting to notethat if the underlying distribution is normal, then the increase in the distancebetween adjacent observations when moving from the middle to the extremesis identical to the decrease in the weight due to being farther away from themedian, so that each observation gets an equal weight (Yitzhaki, 1996). Myconjecture is that this property leads to the statistical efficiency of variance-based statistics in cases of normality: the weights are distributed equally amongobservations.
Gini’s Mean Difference: A superior measure of variability . . . 293
3. Covariances and correlations
3.1.
The key parameters for decomposing the variance of the sums of ran-dom variables into its components are the covariances and the correlations,COV(X, Y ) and ρ = COV(X, Y )/[COV(X, X) COV(Y, Y )]0.5. Equation (2.3)is suggestive of how to construct the covariance and correlation equivalents forthe GMD. The GMD forms two asymmetric correlation coefficients, betweentwo random variables. Let (X, Y ) be two random variables. Then:
COV(Y, FX (X)) and COV(X, FY (Y )) , (3.1)
are the two covariance-equivalents associated with the GMD, and
�XY = COV(X, FY (Y ))
COV(X, FX (X))and �Y X = COV(Y, FX (X))
COV(Y, FY (Y )), (3.2)
are the (asymmetric) Gini correlation coefficients. Blitz and Brittain (1964)defined the Gini correlation by using concentration and Lorenz curves, whileKendall (1955) mentions it, but without connecting it to the GMD. The prop-erties of Gini correlation (G-correlation hereafter) coefficients are listed inSchechtman and Yitzhaki (1987, 1999) and Yitzhaki and Olkin (1991):
(a) The G-correlation coefficient is bounded, such that 1 ≥ �js ≥ −1( j, s =X, Y ); an important property of the G-correlation is that the bounds areidentical for all marginal distributions. (Schechtman and Yitzhaki, 1999).Note, that this property does not hold for the Pearson’s correlation coeffi-cient (De Veaux, 1976; Kotz and Seeger, 1991; Shih and Huang, 1992).
(b) If X and Y are independent, then �Y X = �XY = 0;(c) �Y X is not sensitive to a monotonic transformation of X ; (similar to Spear-
man’s correlation coefficient).(d) �Y X is not sensitive to a linear monotonic transformation of Y ; (similar to
Pearson’s correlation coefficient).(e) In general, �js need not be equal to �s j and they may even have different
signs. However, if the random variables Zj and Zs are exchangeable upto a linear transformation, then �js = �s j . Exchangeability implies thatthe shape of the marginal distributions is similar, and that the relationshipsbetween the variables are symmetric. Formally, as defined by Stuart andOrd (1987: 419), “a set of random variables is said to be exchangeable if, forall n ≥ 1, and for every permutation of n subscripts, the joint distributions of(xj1, . . . , xjn) are identical.”
The importance of property (a), which states that the G-correlations arealways bounded by the same bound, can be illustrated by comparison to a

294 S. YITZHAKI
Pearson correlation coefficient of 0.39. Is this a high correlation? Knowingthat the upper bound is 0.4 can change one’s impression of the associationbetween the variables.
Property (e), symmetry under exchangeability up to a linear transformation,enables the decomposition of the GMD of a sum of random variables in a waywhich is identical to the decomposition of the variance. We will return to thisproperty in Section 6.
In some cases, one may be interested in imposing a symmetric version ofthe correlation coefficients, i.e., to impose the property SXY = SY X , for anytwo distributions, as is the case in the Pearson’s and Spearman’s correlationcoefficients. There are several ways of defining a symmetric version of G-correlations (Yitzhaki and Olkin, 1991), but the most useful one is:
S = G X�XY + GY �Y X
G X + GY, (3.3)
so that the symmetric correlation coefficient is a weighted average of the asym-metric ones, weighted by the variability index (Yitzhaki and Wodon, 2000). Theproperties of (3.3) are discussed in Section 6.
3.2.
Both the Gini covariance (hereafter co-Gini) and the regular covariancecan be presented by concentration curves. The concentration curve enables oneto see whether the relationship between the variables is monotonic or whetherit may differ conditional on the section of the distribution examined. Thediscussion of this property will be carried out in Section 4.
3.3.
The property of having two covariances for two random variables is anextremely important one in cases in which the results are derived by an opti-mization procedure, as is the case of OLS regression. In the OLS example, theoptimization requires setting the covariance between the independent variableand the error term equal to zero (the normal equation). Having two covariancesimplies that although one covariance is set to zero, the other covariance is freeto have any value. Hence, one should be required to test whether the othercovariance is also equal to zero. Rejection of the hypothesis that the othercovariance is equal to zero implies rejection of the validity of the assumptionsthat led to the optimization. Therefore, unlike the OLS, which is based on thevariance, Gini-regressions have two versions, depending on which co-Gini is setto zero, and the existence of the other covariance enables testing the linearity

Gini’s Mean Difference: A superior measure of variability . . . 295
of the regression. (See, Olkin and Yitzhaki, 1992 for the simple regression caseand Schechtman and Yitzhaki, 2000 for an extension to multiple regression).
Note that the two covariances defined by the GMD, may have differentsigns. This property implies that the Gini regression coefficient of X on Ymay have a different sign than that of the regression coefficient of Y on X .Such a situation cannot occur in the OLS, because COV(X, Y ) = COV(Y, X).Further research is needed to evaluate the meaning and implications of suchan observation.
3.4.
The similarities between the Pearson and Gini correlations can be bestshown and investigated by using the copula. (See Nelsen (1999) for defi-nitions and properties of the copula, and Rockinger and Jondeau (2001) foran application in finance). Let D(X, Y ) = FXY (X, Y ) − FX (X)FY (Y ), whereFXY (X, Y ) is the joint cumulative distribution, be the deviation of the jointcumulative distribution from independence. Then it is shown by Schechtmanand Yitzhaki (1999) that
ρ = 1
σXσY
∫∫D(x, y)dxdy ,
where ρ is Pearson’s correlation coefficient, while
�XY = 1
G X
∫∫D(x, y)dxd FY (y) .
Thus, the only difference between Pearson’s and GMD correlation is in whetherthe integration is done over dy or d FY (y). This leads us to the conjecturethat any structure imposed on D(X, Y ) can be translated to GMD or Pearsoncorrelation in a similar way.
4. The absolute concentration curve
The concentration curve is a generalization of the well-known Lorenz curve.It is widely used in the field of income distribution to portray the impact oftaxes on the distribution of real income or to estimate the income elasticityof a consumption good (Kakwani, 1977, 1980; Lambert, 1993; Suits, 1977;and Yitzhaki and Slemrod, 1991). In a typical case, the horizontal axis wouldportray the poorest p percent of the population while the vertical axis wouldpresent the share of total expenditure on a consumption item spent by thepoorest p percent. The absolute concentration curve (ACC) differs from the

296 S. YITZHAKI
concentration curve by presenting the cumulative consumption (rather than thecumulative share of consumption) of the poorest p percent on the vertical axis.In this paper I am interested in the ACC as a general tool that can be appliedto any random variable. The definitions follow the terminology in Yitzhaki andOlkin (1991). The conclusion I would like to draw from this section is that theparameters of both approaches can be geometrically presented by versions of theconcentration curves. However, the curves representing the GMD parametersare bounded and therefore have a simple structure.
The following notation is used. A bivariate density function is denoted byfXY (x, y), or (when no confusion arises) more simply by f (x, y). Marginaldistributions are denoted fX (x) and fY (y). The means, or expected values,are µX and µY . The conditional density function is fY |X and the conditionalexpectation is g(x) = µY.X ≡ EY (Y | X = x). It is assumed that all densitiesare continuous and differentiable, and all second moments exist.
Definition 4.1. The absolute concentration curve (ACC) of Y with respect to X ,denoted AY.X (p), is implicitly defined by the relationship
AY.X (p) =∫ X p
−∞g(t)d FX (t) , (4.1)
where X p is defined by
p =∫ X p
−∞d FX (t) . (4.2)
A special case of the absolute concentration curve is AX.X (p). We will referto it as the absolute Lorenz curve. Shorrocks (1983b) calls this curve theGeneralized Lorenz Curve. Gastwirth (1971) presents a formal definition ofthe Lorenz curve (see also Pietra (1915, 1931).
The following definitions will be needed later:
Definition 4.2. The Line of Independence (LOI) is the line connecting (0, 0)
with (µY , 1). Let LY.X (p) = µY p denote the LOI of Y with respect to X .
Figure 2 presents an ACC curve and LOI that are convenient for ourpurposes. The solid curve [0ABC DE] is the absolute concentration curveof Y with respect to X and the dashed line [0FC E] is the LOI.
To apply the concentration curve to variance-related parameters, e.g., or-dinary least squares regression, it is convenient to redefine the concentrationcurve and the LOI as functions of the variate, X . In this case, we denote thetransformed ACC by VA and define it as
VAY.X (x) =∫ X
−∞g(t)d FX (t) . (4.3)

Gini’s Mean Difference: A superior measure of variability . . . 297
Cumulativedistribution of XFX
Cumulativevalue of Y
µY
B
A
CF
10
D E
+
Figure 2. The absolute concentration curve.
The LOI simply changes to LY.X (p(x)) = µY FX (x). Note, however, that itis no longer a straight line. In terms of figure 2 the only difference betweenequations (4.1) and (4.3) is that the horizontal axis is changed from p = FX (x)
to x .The ACC of Y with respect to X has the following properties (Unless
specifically stated the listed properties are for A and not VA curve):
(a) It passes through the points (0, 0) and (µY , 1).(b) Its derivative with respect to p is EY (Y | X = X P). This follows directly
from Definition 4.1. Consequently, AY.X (p) is increasing if and only ifg(x) = EY (Y | X = X P) > 0.
(c) It is convex (concave, straight line) if and only if∂g(x)/∂x >0. (∂g(x)/∂x<0, ∂g(x)/∂x = 0). AX.X (p) is always convex.
If Y and X are independent, the ACC coincides with the LOI.
(1) The area between the LOI and the ACC is equal to COV(Y, FX (X)), that is,
COV(Y, FX (X)) =∫ 1
0{µY p − AY.X (p)}dp . (4.4)
The term COV(Y, FX (X)), i.e., the covariance between a random variableand the cumulative distribution of another variable is the equivalent of theregular covariance when the Gini mean difference (GMD) is used as ameasure of variability.
(2) The area between the shifted (transformed) LOI and the shifted ACC isequal to COV(Y, X). That is:
298 S. YITZHAKI
COV(Y, X) =∫ ∞
−∞{µY FX (t) − VAY.X (t)}dt . (4.5)
Note that VAY.X (x) is the transformed ACC, while µY FX (t) is the trans-formed LOI. The variance of X is the area between the (transformed) LOIand the (transformed) ACC, denoted by VAX.X (see Yitzhaki, 1998).
Property (f) below is a modification of a result in Grether (1974), whopointed out that, in general, the signs of Pearson’s correlation coefficients arenot invariant to order-preserving transformations of one of the variables.
(f) The ACC is above the LOI for all p if and only if COV(Y, T (X)) < 0for any continuous differentiable monotonically increasing function T (X).(The ACC is below the LOI iff the covariance is positive.)
This implies that whenever the ACC intersects the LOI one can dividethe data into two sections, conditional on the values of X . In one sectionCOV(Y, X) < 0 and in the other COV(Y, X) > 0. By applying a monotonictransformation to X , the investigator can change the magnitude of the covari-ances in those sections, thereby affecting the sign of the overall covariance.This property is used in Yitzhaki (1990) to show the conditions under which itis possible to change the sign of a regression coefficient by applying a mono-tonic transformation to one of the variables. To illustrate, the ACC in figure 2intersects the LOI at C . Property (f) implies that the data used in figure 2 canbe divided into two groups according to whether X is greater or lower than XC ,the limit defined by C . The group (X < XC) would yield a positive covariancebetween Y and any monotonic transformation of X , while the group (X > XC)
will show a negative covariance. A transformation can increase (decrease) theabsolute value of a covariance if T ′(x) > 1(< 1). Note, however, that if AY.X
and LY.X intersect, it does not necessarily imply that AX.Y and L X.Y intersect.
(g) If, as is sometimes assumed, Y and X follow a bi-variate normal dis-tribution, AY.X and LY.X do not intersect. This means that a monotonictransformation of X or Y cannot change the sign of the covariance.
(h) The maximum vertical distance between AY.X and LY.X is bounded fromabove by the absolute deviation of Y . The proof is trivial, followingproperties (b) and (c).
Additional properties of ACC are presented in Yitzhaki and Olkin (1988).The estimators of LY.X and AY.X are based on what is known in statistics
as concomitant Y ’s of X (that is, the observations of Y ’s, after ordering themby their respective X values. See Barnett, Green and Robinson (1976) forproperties of concomitants). Then:
LY.X (p) = pyn , (4.6)

Gini’s Mean Difference: A superior measure of variability . . . 299
where p = i/n and yn is the mean of Y . The empirical ACC is
AY.X (p) = 1
n
i∑j=1
yj = pyi , (4.7)
where yi is the mean of the first i observations of Y , ordered according to theirrespective X values. The vertical difference between the LOI and ACC is:
LY.X (p) − AY.X (p) = p(yn − yi) , (4.8)
where p = i/n.Finally, there are several theorems concerning the convergence of empirical
concentration curves to the population curves (Goldie, 1977; Bishop, Formbyand Thistle, 1992), and several large sample tests concerning the intersectionof concentration curves. (Eubank, Schechtman and Yitzhaki, 1993; Beach andDavidson, 1983; Bishop, Chow and Formby, 1994; Davidson and Duclos, 1997;and Nygard, F. and A. Sandstrom, 1981). However, convergence issues andestimation issues (Gastwirth (1972), Hoeffding (1948)) are beyond the scopeof this paper.
5. GMD and second degree stochastic dominance
One of the dominant approaches to modeling behavior under risk is theexpected utility hypothesis. According to this approach, the decision makermaximizes the expected value of his utility function, defined over wealth orincome. Since the utility function is not observed, it is important to reduce theassumptions concerning the shape of the utility function, because the less oneassumes the more general is the analysis. Under the second degree stochasticdominance paradigm, the only assumptions about the utility function is thatthe first derivative is positive, and the second derivative is negative (Hadar andRussell, 1969; Hanoch and Levy, 1969). See the survey by Levy (1992). Theimplementation of the methodology offers only a partial ordering over the setof risky options. Furthermore, as far as I know, no algorithm has been foundthat is able to apply it in the typical portfolio allocation framework, which ischaracterized by several risky assets. Therefore, it is convenient to use twosummary statistics to describe each risky option, the mean of the distribution,which represents the reward, and a variability index that represents the risk.The two-parameter summary statistics approach offers scope for a completeordering, and can handle multiple risky assets. However, it is important toverify that the use of summary statistics does not contradict the expected utilityhypothesis.
300 S. YITZHAKI
A popular approach is to use the mean, µ, and the variance, σ 2, asthe summary statistics (MV approach) and to define the utility function overthe summary statistics, U (µ, σ ) with the derivative Uµ > 0, and UV < 0.This approach produces identical ranking to the expected utility approach ifthe distributions are restricted to belong to the multivariate normal, or ifthe utility function is quadratic (See Feldstein, 1969; Tobin, 1958, 1965;Hanoch and Levy, 1969; Levy and Markowitz, 1979). An alternative ap-proach is to use the GMD instead of the variance (Yitzhaki, 1982; Shalit andYitzhaki, 1984), the MG approach. Unlike the MV, the mean and the GMDcan be used to construct necessary conditions for second degree stochasticdominance:
Proposition 1. µX ≥ µY and µX − 2 cov(X, FX (X)) ≥ µY − 2 cov(Y, FY (Y ))
are necessary conditions for EX {U (X)} ≥ EY {U (Y )}, for all U with U ′ ≥ 0, andU ′′ ≤ 0.
If the cumulative distributions of X and Y are restricted to cross at mostonce, then the above conditions are sufficient as well.
Proof. Yitzhaki (1982). If it is assumed that U ′′ > 0, then the second inequalitytranslates into µX + 2 cov(X, FX (X)) ≥ µY + 2 cov(Y, FY (Y )) (Yitzhaki, 1999).However, most of the interest of economists is limited to concave functions,where U ′′ < 0.
To see why this property is important, consider using a complicated com-puter model to evaluate the following two distributions using the mean-variancemodel: one distribution is restricted to [0,1] while the other is on [1000, 2000].The mean and the variance of the latter distribution are greater than the meanand the variance of the former. This leads us to the embarrassing conclusionthat it is impossible to conclude which distribution is the preferred one. Byforming necessary conditions for stochastic dominance, the investigator is ableto omit from the mean-variance (or MG) efficient set these portfolios that are(second-degree) stochastically dominated by other portfolios. Proposition 1 en-ables one to restrict the MG efficient set to a subset of the Second-degreestochastic dominance efficient set. Similar conditions can be constructed usingthe variance, but they are restricted to distributions with equal means, or tonormal distributions. (See, Formby, Smith and Zheng, 1999).
6. The decomposition of the variability of a sum of variables
The decomposition of the variance of a linear combination of randomvariables is a basic tool used in regression analysis, portfolio analysis andmany other empirical applications. Hence, it is important to see whether the

Gini’s Mean Difference: A superior measure of variability . . . 301
GMD has similar properties.Let Z = αX + (1 − α)Y . Then:
σ 2Z = ασ 2
X + (1 − α)2σ 2Y + 2α(1 − α)σXσY ρXY , (6.1)
where ρ is Pearson’s correlation coefficient. The GMD of Z can be de-composed in a similar way, provided that some conditions on the underlyingdistribution hold. The violation of those conditions adds additional terms tothe decomposition.
Proposition 2. Let (X, Y ) follow a bi-variate distribution. Let Z = αX +(1−α)Y,
where α is a given constant. Then
(a)G2
Z − [αDX Z G X + (1 − α)DY Z GY ]G Z
= α2G2X + (1 − α)2G2
Y + α(1 − α)G X GY (�XY + �Y X )(6.2)
where GY = COV(Y, F(Y )) is (one-fourth) of Gini’s mean difference, �ZY =COV(Z ,F(Y ))
COV(Z ,F(Z))is the Gini correlation, and Di j = �i j −�j i (i, j = X, Y, Z) is the
difference between the Gini correlations.
(b) Provided that Di j = 0, for all X, Y, Z then the following decomposition holds:
G2Z = α2G2
X + (1 − α)2G2Y + 2α(1 − α)G1G2� , (6.3)
where � = �XY = �Y X is the Gini correlation between X and Y .
Clearly, case (6.3) is a special case of (6.2). Note that the right hand sideof (6.2) and (6.3) is identical to the decomposition of the variance of a weightedsum of random variables, except the the Gini parameters substitute for thevariance parameters. Because of its similarity to the variance decomposition, thepractical importance of case (6.3) is much higher than that of case (6.2) becauseit implies that any variance-based model can be replicated, using the GMD asa substitute for the variance. On the other hand, case (6.3) offers additionalinformation about the underlying distribution. Further research is needed toevaluate the usefulness of this additional information.
Proof of (6.2). Using the properties of the covariance we can write:
G Z = COV[αX + (1 − α)Y, F(Z)]
= α COV[X, F(Z)] + (1 − α) COV[Y, F(Z)]
= α�X Z G X + (1 − α)�Y Z GY .
(6.4)
Define now, the identity:
�i j = Di j + �j i for i = X, Y, Z .

302 S. YITZHAKI
Where Di j is the difference between the two Gini correlations. Using theidentity, we get:
G Z = α(�Z X + DZ X )G X + (1 − α)(�ZY + DZY )GY
Rearranging terms:
G Z − αDX Z G X − (1 − α)DY Z GY = α�Z X G X + (1 − α)�ZY GY
But, using the properties of the covariance:
�Z X = cov(Z , F(X))
cov(Z , F(Z))= 1
cov(Z , F(Z))
× {α cov(X, F(X)) + (1 − α) cov(Y, F(X))}= αG X + (1 − α)GY �Y X
G Z.
Writing �ZY in a similar manner, and applying it to (6.4) we get:
G2Z − [αDX Z G X + (1 − α)DY Z GY ]G Z
= αG X (αG X + (1 − α)GY �Y X ) + (1 − α)GY (α�XY G X + (1 − α)GY )
= α2G2X + (1 − α)2G2
Y + α(1 − α)G X GY (�XY + �Y X ) .
Proof of (6.3). Assuming equality of the Gini correlation coefficients betweenZ and X implies that DX Z = 0. A similar assumption with respect to violationof the assumption of equality between Z and Y correlations implies DY Z = 0.The assumption of � = �XY = �Y X completes the proof of (b).
Clearly, equation (6.3) is easier to work with than (6.2). The question arisesis how restricting are the assumptions Di j = 0, i, j = X, Y, Z . Schechtmanand Yitzhaki (1987) show that a sufficient condition for Di j = 0 is that thevariables are exchangeable up to a linear transformation.
The necessary and sufficient conditions for equality of Gini correlations canbe stated in terms of concentration curves. To take into account the “up to a lin-ear transformation” requirement, let X N , Y N be the normalized variables:X N =(X − µX )/G X where µ is the expected value and G X = COV(X, F(X)), andY N = (Y − µY )/GY . The variables X N and Y N have expected value of zeroand a GMD of one. Since the Gini correlations are not sensitive to a linearmonotonic transformation of the variables, �XY = �X N Y N and �Y X = �Y N X N ,so that equality of the correlations of the normalized variables implies equalityof the Gini correlations of the original variables.
Let eX (t) = E{Y N | X N = t} and eY (t) = E{X N | Y N = t} be theconditional expectations.
Gini’s Mean Difference: A superior measure of variability . . . 303
Proposition 3. A necessary and sufficient condition for �XY = �Y X is:∫
eY N (Y N (p))pdp =∫
eX N (X N (p))pdp ,
where Y N (p) and X N (p) are the inverse of the marginal distribution of Y N and X N ,
respectively.
Proposition 3 has a simple geometric presentation in terms of absoluteconcentration curves. It implies that for the two Gini correlations to be equalit is necessary and sufficient that the area enclosed by the concentration curveof X N with respect to Y N is equal to the area enclosed by the concentrationcurve of Y N with respect to X N .
Proof. The denominator in a Gini correlation of the normalized random variablesis equal to one by construction. Hence,
�XY = COV(X N , FY N (Y N )) = E{eY N (Y N )FY N (Y N )}=
∫ ∞
−∞eY N (Y N )FY N (Y N )d FY N (Y N ) =
∫ 1
0eY N (Y N (p))pdp ,
(6.5)
where Y N (p) is the inverse of the marginal distribution of Y N . The firstequality in (6.5) holds because the expected value of the normalized variableequals zero. The last equality is due to transformation of variable p = F().The same procedure can be applied to �Y X . It can be immediately seen thateX (X N (p)) = eY (Y N (p)) for all p is a sufficient condition for �XY = �Y X
while equality of the integrals is a necessary and sufficient condition.
To illustrate the interpretation of condition (6.5), it is useful to present itin terms of concentration curves. Define the absolute concentration curve as:
AX.Y (p) =∫ p
0eY (Y (t))dt , (6.6)
with the cumulative value of X given FY (Y ) ≤ p. Then:
∫ 1
0eY N (Y N (p))pdp =
∫ 1
0
∂ AX N .Y N (p)
∂ppdp = −
∫ 1
0AX N .Y N (p)dp . (6.7)
where the second step is derived by integration by parts, using the propertythat the expected value of X N is zero.
Note that requiring �XY = �Y X to hold, imposes no restriction on theshape of AX.Y versus the shape of AY.X . In particular, the absolute concentrationcurves are allowed to cross the horizontal axis, which means that the conditionalcorrelations in segments of the distribution can be of different signs. It allows

304 S. YITZHAKI
the conditional distributions to be of totally different shape, and hence they donot have to belong to the same family, nor does the joint distribution need tobe symmetric.
Assuming a multivariate distribution of a specific family impose strict con-ditions on the concentration curves, so they are not only identical but alsochange in an identical manner along the change in parameters of the distribu-tion. To illustrate the kind of conditions imposed by the multi-variate normaldistribution, note that in this case AY N X N (p) = AX N Y N (p) = ρ AX N X N (p) =ρ AY N Y N (p) for all 0 < p < 1, where ρ is Pearson’s (or Gini) correlationcoefficient.
This implies that the sufficient condition for equality of the Gini correlationsis much weaker than exchangeability, and the necessary and sufficient conditionscan be tested by comparing concentration curves. Further research is needed toevaluate the implications of the additional terms of the GMD decomposition.
Finally, the extension of (6.2) to more than 2 variables is immediate. It isgiven without a proof. Let Y0 = ∑k
i=1 ai Yi , then
G20 − G0
k∑i=1
ai Di0Gi =k∑
i=1
a2i G2
i +∑i=1
∑i �= j
ai aj Gi Gj�i j (6.8)
The additional terms in a GMD decomposition can play an important role ina convergence to normality process. Consider a sequence of i.i.d. variablesand let Yk = (X1+, . . . , +Xk)/k. Then the distribution of Yk converges tothe normal distribution. However, if the distribution is normal the additionalterms in the GMD decomposition should be equal to zero. Hence, wheneverwe are dealing with a convergence process, we can split the sample into twoindependent samples. In each sub-sample we take the averages of k obser-vations. If aggregation to size k implies that we have already converged toa normal distribution then we should expect the GMD decomposition of theoverall sample to two samples of averages of k observations to behave like thedecomposition of the variance. The value of the additional terms can be usedto evaluate the stage of the convergence.
7. The decomposition of a variability index into sub-groups
It is well known that the variance of the union of several sub-populationscan be neatly decomposed into intra- and inter-group components, with theinter-group component being the variance of the means appropriately weighted,and the intra-group component being the weighted sum of the internal variances(ANOVA). This result holds for any distribution.
In contrast, the GMD does not decompose neatly into two components.Using the covariance presentation of the GMD (equation 2.3), each observation

Gini’s Mean Difference: A superior measure of variability . . . 305
is represented by its rank and by the variate. Similarly, in the GMD framework,the group should be represented by the mean rank of its members in the overalldistribution, and the mean variate. Using this representation, one can decomposethe GMD into a formula in the following way.
Let Yi , Fi(Y ), fi(Y ), µi , pi , represent the random variable, the cumulativedistribution, the density function, the expected value, and the share of group iin the overall population, respectively. The overall population, Yo = Y1 ∪Y2, . . . , ∪Yn is the union of all groups. It is shown in Yitzhaki (1994) that:
Go =n∑
i=1
pi Oi Gi + G B , (7.1)
where Gi is the GMD of group i , Oi is an index of the overlapping of group iwith the overall population, (defined below), and G B is the between-groupGMD (also defined below). Before proceeding, it is worth mentioning that inthe area of income distribution, most interest focuses on the Gini coefficient,which is a relative measure of variability (similar to the coefficient of variation).The decomposition presented here is of the GMD. The decomposition of theGini coefficient follows similar lines.
Using these concepts the GMD can be decomposed similarly to the vari-ance, provided that the distributions of the groups are perfectly stratified. Al-ternative decompositions also exist but they will not be pursued in this paper(Rao (1969), Dagum (1987), Silber (1989)).
7.1. The overlapping index
The concept of overlapping is closely related to two other concepts fre-quently used in social sciences – stratification and segmentation. Stratificationis defined by Lasswell (1965, p. 10) as follows:
“In its general meaning, a stratum is a horizontal layer, usually thoughtof as between, above or below other such layers or strata. Stratification isthe process of forming observable layers, or the state of being comprised oflayers. Social stratification suggests a model in which the mass of society isconstructed of layer upon layer of congealed population qualities.”
According to Lasswell, perfect stratification occurs when the observationsof each group are confined to a specific range, and the ranges of differentgroups do not overlap. An increase in overlapping can therefore be interpretedas a reduction in stratification. Stratification plays an important role in thetheory of relative deprivation (Runciman (1966)), who argues that stratifiedsocieties can tolerate greater inequality (see also Yitzhaki (1982)).
Stratification may also be important in other areas of economics. Considera product that can be hierarchically ranked according to one attribute. For

306 S. YITZHAKI
example, assume that cars can be ranked according to price. Consider nowseveral producers, each producing several types of cars. We may define amarket as (perfectly) stratified if each producer offers cars in a certain pricerange, and those price ranges are separated, so that no producer offers a carin a price range of another producer. On the other hand, the market will be(perfectly) non-stratified if all producers offer the same range of prices for cars.Market segmentation is of interest because the less segmented is the market,the more competitive it is likely to be.
Another example of stratification concerns school segregation (segregationmay be interpreted as stratification without the hierarchical connotation, e.g.,boys and girls). Consider a population of students that can be ranked accordingto ability. The distribution of students will be perfectly stratified by schools ifthe students of each school occupy a certain range in the ability distribution andno student from another school is in that range. Stratification of the studentspopulation by schools allows one to predict students’ performance from knowingtheir school. Also, as shown in Yitzhaki and Eisenstaedt (2003), overlappingof distributions is an important factor in determining whether one can find analternative examination that will reverse the order of average scores of studentsin different schools. Stratification is a property that may be negatively correlatedwith variability, but need not be identified with it. Hence, it is important toseparate the two in a decomposition framework, so that one can distinguishstratification from non-variability.
In the real world one can rarely identify situations in which there is nooverlapping. We must therefore define situations of near-perfect stratificationand an index of the “degree of overlapping.”
Definition. Distribution j is perfectly overlapped by distribution i if the ob-servations of distribution j are either below or above the observations of dis-tribution i .
We will say that distribution i out-spans distribution j . The overlappingindex quantifies the term “out-span”.
The overlapping index for group i , with respect to group j , is defined as:
Oji = COVi [Y, Fj (Y )]/ COVi [Y, Fi(Y )] , (7.2)
where COVi denotes that the density function used in calculating the covarianceis that of distribution i . Specifically,
covi [Y, Fj (Y )] =∫
(y − µi)(Fj (y) − Fji)d Fi(y) , (7.3)
and
Fji =∫
Fj (t)d Fi(t) (7.4)

Gini’s Mean Difference: A superior measure of variability . . . 307
is the expected rank of observations of distribution i had they been rankedaccording to the ranking of group j . (In the sample, the cumulative distributionis estimated by the rank of the observation.) Alternatively, the overlapping indexis the G-correlation of observations of group i , with their assigned rank, hadthey been ranked according to distribution j . Note that ranking observationsaccording to various reference groups is common in sports, where athletesare ranked according to different groups (e.g., national, world,etc . . . ) and inbanking, where banks are ranked according to national and world ranking.
The overlapping index measures the degree to which distribution j is in-cluded in the range of distribution i . Its properties are the following:
(a) Oji ≥ 0. The index is equal to zero if no member of the j distribution isin the range of distribution i .
(b) The index is an increasing function of the fraction of group j that islocated in the range of group i .
(c) For a given fraction of distribution j that is in the range of distribution i ,the smaller the distance between the observations belonging to j to themean of group i , the higher is Oji .
(d) If the distribution of group j is identical to the distribution of group i ,then Oji = 1. Note that by definition Oii = 1.
(e) Oji ≤ 2. The maximum value will be reached if distribution j is concen-trated at the mean of distribution i .
(f) In general, the higher the overlapping index Oji the lower will be Oi j .That is, the more group j is included in the range of distribution i , theless distribution j is expected to be included in the range of i .
Properties (a) to (f) show that Oji is an index that measures the extent towhich group j is included in the range of group i and the degree to whichgroup i out-span group j .
The index Oi in equation (7.1) is a weighted average of the individualoverlapping indexes. That is,
Oi =∑
j
pj Oji , (7.5)
is an index indicating how the overlapping of the overall distribution by dis-tribution i can be constructed.
It is clear that the indices of overlapping are not independent. Moreover,they are correlated with intra-group inequality indices. This is so because anincrease in the variability of group i may increase the range, and thereforethe probability of overlapping with other groups. Hence, it is worthwhile topresent the contribution of each component to overall inequality.

308 S. YITZHAKI
7.2. Between-group variability
I will use the term GB to denote the between-group GMD as developedin Yitzhaki and Lerman (1991). It is defined as
G B = 2 COV(µi , Foi) . (7.6)
In words, G B is twice the covariance between the mean variate of each groupand its mean rank in the overall population. This definition differs from theusual definition used in the literature of income inequality by Dagum (1997),Pyatt (1976), Shorrocks (1983a) and Silber (1989). See also Dagum (1987). Intheir definition, the between-group term is based on the covariance between themean income of each group and the rank of the mean income of each groupin the overall ranking. Here the covariance is between mean income and meanrank of the observations. It can be shown that the between-group GMD in thispaper is never greater than the one defined in the above-mentioned papers.
The properties of the between-group GMD are the following:
(a) The between-group component can be zero either if mean variates areequal, or if mean ranks are equal. This definition is different from thedefinition of between-group variability that is embedded in the variance.
(b) The between-group component can, in some extreme cases, be negative.That is, the covariance between the average value of the groups and theaverage rank of the groups in the overall ranking can be negative. Forexample, one group may be composed of many small values of X and oneextremely large observation, so that the mean of the variate is high but themean rank is low.
(c) When groups are perfectly stratified, the upper bound for between-groupvariability is reached. The index in this case is identical to what is obtainedby ranking groups according to their mean income, which is Pyatt’s (1976)definition of between-group inequality. The difference between the upperbound and definition (7.6) can be used to evaluate the impact of overlappingon between-group inequality.
Since overall variability is given, the higher the stratification the higherthe between-group inequality and the lower the overlapping. This property canbe used to reflect the robustness of grouping. The ratio of the between-groupcomponent to its maximum value (under perfect stratification) can serve as anindex of the robustness of the grouping (Milanovic and Yitzhaki, 2002).
Figures 3a and 3b demonstrate the difference between GMD and vari-ance decomposition. Figure 3a presents two asymmetric distributions that areidentical except for the direction of the asymmetry. (The overall distribution is1∪2.) Figure 3b, presents the same distributions, except that each distribution istwisted 180◦ around its mean. The resulting overall distribution is 1′ ∪2′. Since

Gini’s Mean Difference: A superior measure of variability . . . 309
1 20 3 4 5 6 7 8 9
0 1 2 3 4 5 6 7 8 9
Density
(a)
(b)
1/3
1/3
1/3 5/3 8/3 10/3 13/3 17/3
(1') (2')
(1'
(1) (2)
(1∪ 2)
∪ 2')
=1/6=1/2=1/3
αγ
β
α
β
γ
Figure 3. Densities with equal inter and intra-group variance; equal intra-group GMD.
the distributions are identical in shape, the intra-group variances and GMD’sare identical. The means of each distribution and its twisted distribution infigures 3a and 3b are identical, so that between group and over-all variancesin the two figures are identical. The overlapping of distributions in figure 3ais larger than the overlapping in figure 3b. Therefore, we should expect thebetween-group GMD in figure 3b to be higher than between-group GMD atfigure 3a (the difference in average rank is higher in 3b, while the meansare identical). Hence, the GMD decomposition indicates that the grouping infigure 3b is more distinguishable than the grouping in figure 3a.
The decomposition of the GMD into the contribution of sub-groups revealsmore information on the underlying distributions than the decomposition of thevariance. The GMD is the appropriate index whenever stratification has someimplications for the interpretations of the results.
8. Moments versus extended Gini
As pointed out earlier, the major controversy between the Italian schooland the Western statisticians was whether to approach the description of the
310 S. YITZHAKI
distribution function through the differences between observations or, alterna-tively, to use the moment generating function. Once the GMD is presentedas a covariance, how to describe it as a moment of a distribution is clear.Moreover one can present the variance and the covariance as a result of differ-encing two i.i.d. variables. Thus, the difference between the schools of thoughtdissolves.
The variance is a central moment, that is, a linear function of the densityfunction and a power function of the variate. The natural extension is
µ(r) = E{[x − µ(1)]r } . (8.1)
The extension of the GMD to resemble a moment is accomplished by reversingthe role of the variate and the probabilities. Since one needs a monotonicfunction to have an inverse function, it is convenient to rely on the cumulativedistribution function.
µ − G(ν) =∫
[1 − Fx(x)]νdx = µ + ν COV(x, [1 − Fx(x)]ν−1) . (8.2)
If ν → 1, then (8.2) converges, by definition, to µ so that variability is ignored.If ν = 2, then (8.2) is equal to µ−2G X . As ν → ∞ (8.2) converges to the lowerbound of the distribution and as ν → 0, (8.2) converges to the upper bound.Equation (8.2) represents a family of variability measures that is referred to asthe extended Gini family in Yitzhaki, 1983. By selecting ν, the investigatorselects the distance function with which he works. Sections 3-7, can be gener-alized so that the G-correlations and decompositions can be performed on theextended Gini. Such an extension is beyond the scope of this paper. For afirst step in this direction, see Schechtman and Yitzhaki (2003).
The application of a power function to the variate, as in (8.1), changes theunit and in many cases one has to use the inverse of the power function toreturn to the original units (e.g., variance and standard deviation). Since F( ) isunit free, all extended Gini indices have the same unit, so that there is no needto “undo” the impact of the power function. Also, all extended Gini variabilityindices are special cases of Yaari’s (1988) dual approach to utility theory.
9. Moments versus distance between distributions
Can one produce convergence theorems for distributions using the GMD?The answer to this question was given in the late twenties and the early thirties,although it seems to have been forgotten.
Let Fn(X) be the empirical distribution function. Cramer (1928, p. 144-147) suggested the following statistic for the distance of the cumulative distri-bution from its expected value as a criterion for testing the goodness of fit of

Gini’s Mean Difference: A superior measure of variability . . . 311
a distributionGx
n= E
{∫[Fn(x) − F(x)]2dx
}. (9.1)
Cramer suggested the right hand-expression. He was not aware that it is equalto the GMD. See Darling (1957). For a proof that the term is equal to GMD,see Serfling (1980, p. 57), or Yitzhaki (1998, p. 17).
Equation (9.1) can be adjusted to describe the distance between two em-pirical distributions. Those extensions are beyond the scope of this paper.
Smirnov (1937) modified Equation (9.1) to
w2 = n∫
[Fn(x) − F(x)]2d F(x) . (9.2)
Changing the integration from dx to d F(x) changes the properties of the statis-tic from being asymptotically distribution-free to being distribution-free and, ofcourse, (9.2) is not related to the GMD. It is worth noting that Equation (9.1)can be adjusted to describe the distance between two empirical distributions.Those extensions are beyond the scope of this paper.
10. Conclusions
Without a doubt the variance is more convenient to use as a measure ofvariability. Because it is a parameter of the normal distribution, there is nochance for an alternative measure of variability to outperform it in describingthis class of distributions. However, there are many areas in economics and inother social sciences in which the normal distribution and even a symmetricdensity function do not provide a good approximation to the data. In thosecases, it may be that other measures of variability can outperform the varianceon a number of dimensions. For example, the covariance imposes a symmetricrelationship between the marginal distributions. This property is convenient andsimplifies the analysis but it is not required for economic analysis that is mainlydealing with asymmetric relationships among variables. The imposition ofsymmetric relationship among variables results in a loss of information, as canbe seen from the decomposition of the GMD. In other words, the decompositionof the GMD, whether one is dealing with decomposing the GMD of a sumof random variables, or a union of several groups, yields additional termsthat can help us in describing the properties of the underlying distributions.Other dimensions are the sensitivity to extreme observations, and the issue ofstochastic dominance.
The GMD is similar to the variance. The use of the GMD in case of anormal distribution may result in an inefficient method of estimation. But theincrease in the size of data sets implies that the relative disadvantage of this

312 S. YITZHAKI
property has declined over time. This can be viewed as a price paid for usingthe GMD, while the price associated with the use of the variance is the lossof information.
Provided that one is ready to impose certain restrictions on the distributionsinvolved (exchangeability or stratification) then one can achieve correspondingproperties for the analysis that relies on the GMD and the analysis that relies onthe variance. This means that by imposing those restrictions, one can replicateevery model that relies on the variance with a model that is based on the GMD,(by replacing every variance by the square of the GMD, and every Pearson’scorrelation coefficient by the G-correlation, see Shalit and Yitzhaki (2002) forsuch an exercise in portfolio theory and Schechtman and Yitzhaki (2002) inmultiple regression). Then, one can relax the restrictions that led to similaritybetween the GMD and the variance, to see whether there is an effect on theconclusion. In this sense the use of the GMD is superior to the use of thevariance. The only price paid is a loss of efficiency in cases that are close tothe normal distribution.
Further research is needed to be able to evaluate the contribution of theinsights added by using the GMD. Non-friendly Computer programs that candecompose the GMD of a sum of random variables, and the Gini coefficientinto population sub-groups, together with statistical tests will be supplied bythe author upon request.
Acknowledgments
Partial financing from the German-Israeli Fund is gratefully acknowledged. I am indebted toReuben Gronau, Samuel Kotz, Peter Lambert, Ingram Olkin, Edna Schechtman and Joel Slemrod andparticipants of a conference at Bocconi University for many helpful comments. I am grateful to twoanonymous referees who pointed out the contribution of the enormous Italian literature.
The literature on the GMD, has developed over more than a century, in different contexts,disciplines, languages, and journals. It is not surprising that many of the ideas were developedindependently (see David (1968, 1981), Giorgi and Pallini (1987) and Harter (1978), Simpson (1948)among many others). Sometimes it is really hard to determine what is required in order to attributean equation or a concept to a specific person or paper: is it writing an equation by passing, or do werequire a full understanding of its implications. I apologize in case I failed to give the credit to theperson or paper that deserves it.
REFERENCES
Barnett, V., Green, P. J., and Robinson, A. (1976) Concomitants and correlation estimates,Biometrika, 63, 2, 323-328.
Bassett, G. Jr. and Koenker, R. (1978) Asymptotic theory of least absolute error regression,Journal of the American Statistical Association, 73, 618-622.
Beach, C. M. and Davidson, R. (1983) Distribution-free statistical inference with Lorenz curvesand income shares, Review of Economic Studies, 50, 723-735.

Gini’s Mean Difference: A superior measure of variability . . . 313
Bishop, J. A., Chow, K. V., and Formby, J. P. (1994) Testing for marginal changes in incomedistributions with Lorenz and concentration curves, International Economic Review, 35, 2,(May), 479-88.
Bishop, J. A., Formby, J. P., and Thistle, P. D. (1992) Convergence of the south and non-southincome distributions, 1969-1979, American Economic Review, 82, 1, (March), 262-72.
Blitz, R. C. and Brittain, J. A. (1964) An extension of Lorenz diagram to the correlation of twovariables, Metron, 137-143.
Cramer, H. (1928) On the composition of elementary errors, second paper: statistical applications,Skandinavisk Actuareitidskrift, 11, 141-180.
Dagum, C. (1987) Measuring the economic affluence between populations of income receivers,Journal of Business & Economic Statistics, 5, 1, 5-12.
Dagum, C. (1997) Decomposition and interpretation of Gini and generalized entropy inequality mea-sures, Proceedings of the American Statistical Association, Business and Economic Section,200-205.
Darling, D. A. (1957) The Kolmogorov-Smirnov, Cramer-von Mises tests, Annals of MathematicalStatistics, 28, 823-838.
David, H. A. (1968) Gini’s mean difference rediscovered, Biometrika, 55, 573-575.
David, H. A. (1981) Order Statistics, (second edition), John Wiley & Sons, New York.
Davidson, R. and Duclos, J. Y. (1997) Statistical inference for the measurement of the incidenceof taxes and transfers, Econometrica, 65, 6, 1453-1465.
Deaton, A. (1979) The Distance function in consumer behavior with applications to index numbersand optimal taxation, The Review of Economic Studies, 46, 3, (July), 391-405.
De Veaux (1976) Technical Report Number 5, SIAM Institute for Mathematics and Society, StanfordUniversity.
Feldstein, M. S. (1969) Mean variance analysis in the theory of liquidity preference and portfolioselection, Review of Economic Studies, 36, (January), 335-46.
Formby, J. P., Smith, W. J., and Zheng, B. (1999)The coefficient of variation, stochastic dominanceand inequality: A new interpretation, Economics Letters, 62, 319-323.
Foster, J. and Ok, E. A. (1999)Lorenz dominance and the variance of the logarithms, Econometrica,67, 4, 901-907.
Eubank, R., Schechtman, E., and Yitzhaki, S. (1993) A test for second order dominance, Com-munications in Statistics, Theory and Methods, 61, 7, 1893-1905.
Gastwirth, J. L. (1971) A general definition of the lorenz curve, Econometrica, 39, 1037-39.
Gastwirth, J. (1972) The estimation of the Lorenz curve and Gini index, The Review of Economicsand Statistics, 54, 306-316.
Gini, C. (1912) Variabilita e mutabilita: contributo allo studio delle distribuzioni e delle relazionistatistiche, in Studi Economico-giuridici della Regia Facolta Giurisprudenza, anno III, parteII, Cuppini, Bologna.
Gini, C. (1965) On the characteristics of Italian statistics, Journal of the Royal Statistical Society,Series A, 128, 1, 89-109.
Gini, C. (1966) Statistical Methods, Instituto Di Statistica E Ricerca Sociale “Corrado Gini”, Uni-versita Degli Studi di Roma, Roma.
Giorgi, G. M. (1990) Bibliographic portrait of the Gini concentration ratio, Metron, 48, 1-4, 183-221.
Giorgi, G. M. and Pallini, A. (1987) About a general method for the lower and upper distribution-free bounds on Gini’s concentration ratio from grouped data, Statistica, 47, 2, 171-184.

314 S. YITZHAKI
Goldie, C. M. (1977) Convergence theorems for empirical lorenz curves and their inverses, Advancesin Applied Probability, 9, 765-791.
Grether, D. M. (1974) Correlations with ordinal data, Journal of Econometrics, 2, 241-246.
Hadar, J. and Russell, W. R. (1969) Rules for ordering uncertain prospects, American EconomicReview, 59, 25-34.
Hanoch, G. and Levy, H. (1969) The efficiency analysis of choices involving risk, Review ofEconomic Studies, 36, 335-346.
Hart, P. E. (1975) Moment distributions in economics: an exposition, Journal of The Royal Statis-tical Society, Series A, 138, 3, 423-434.
Harter, H. L. (1978) A chronological annotated bibliography of order statistics, vol. 1, Pre-1950,Government Printing Office, Washington, DC: U. S.
Hoeffding, W. (1948) A class of statistics with asymptotically normal distribution, Annals of Math-ematical Statistics, 19, 293-325.
Jorgenson, D. W. and Slesnick, D. T. (1984) Aggregate consumer behaviour and measurement ofinequality, Review of Economic Studies, 51, 3, (July), 369-392.
Kakwani, N. C. (1977) Applications of Lorenz curves in economic analysis, Econometrica, 45,719-727.
Kakwani, N. C. (1980) Income Inequality and Poverty, Oxford University Press, Oxford U. K.
Kendall, M. G. (1955) Rank correlation methods, (second edition), Hafner Publishing Company,New York.
Kotz, S. and Seeger, J. P. (1991) A New approach to dependence in multivariate distributions, inAdvances in Probability Distributions with Given Marginals, Kluwer Academic Publishers.
Lambert, P. (1993) The distribution and redistribution of income, (second edition), ManchesterUniversity Press, Manchester.
Lasswell, T. E. (1965) Class and stratum, Houghton Mifflin, Boston.
Levy, H. and Markowitz, H. M. (1979) Approximating expected utility by a function of mean andvariance, American Economic Review, 78, (June), 308-317.
Levy, H. (1992) Stochastic dominance and expected utility: survey and analysis, ManagementScience, 38, 4, 555-593.
Lorenz, M. O. (1905) Methods for measuring concentration of wealth, Journal of the AmericanStatistical Association, New Series 70, 209-219.
Mckenzie, G. W. and Pearce, I. F. (1982) Welfare measurement: a synthesis, American EconomicReview, 72, 4, (September), 669-682.
Milanovic, B. and Yitzhaki, S. (2002) Decomposing World Income Distribution: Does the WorldHave a Middle Class, Review of Income and Wealth, 48, 2, (June), 155-178.
Nelsen, R. B. (1999) An introduction to copulas, Springer-Verlag, New York.
Nygard, F. and Sandstrom A. (1981) Measuring income inequality, Almqvist & Wiksell Interna-tional, Stockholm.
Olkin, I. and Yitzhaki, S. (1992) Gini regression analysis, International Statistical Review, 60, 2,(August), 185-196.
Pietra, G. (1915) Delle relazioni tra gli indici di variabilita: I, II, Atti del reale Instituto Veneto diScienze, Lettere ed Arti, a.a. 1914-15, 74, 2, 775-804.
Pietra, G. (1931) Contributions a la methodologie du calcul du rapport de concentration, Bulletin del’Institut International de Statistique, XX session, (Madrid, 1931), tome 26, 2eme Livrasion,568-574.

Gini’s Mean Difference: A superior measure of variability . . . 315
Pyatt, G. (1976)On the interpretation and disaggregation of Gini coefficients, The Economic Journal,86, 243-254.
Ramasubban, T. A. (1958) The mean differences and the mean deviations of some discontinuousdistributions, Biometrika, 45, 56-549.
Ramasubban, T. A. (1959) The generalized mean differences of the binominal and poisson distri-butions, Biometrika, 46, 29-223.
Ramasubban, T. A. (1960) Some distributions arising in the study of generalized mean differences,Biometrika, 47, 73-469.
Rao, V. M. (1969) Two decompositions of concentration ratio, Journal of the Royal StatisticalSociety, Series A, 132, 418-425.
Rockinger, M. and Jondeau (2001) Conditional dependency of financial series: An applications ofcopulas, Working Paper.
Rothschild, M. and Stiglitz, J. E. (1970) Increasing risk: I: a definition, Journal of EconomicTheory, 2, 225-353.
Runciman, W. G. (1966) Relative deprivation and social justice, Routledge and Kegan Paul, London.
Shalit, H. and Yitzhaki, S. (1984) Mean-Gini, portfolio theory, and the pricing of risky assets,Journal of Finance, 39, 5, (December), 1449-68.
Shalit, H. and Yitzhaki, S. (2002) Derivation of the mean-Gini efficient portfolio frontier, Dis-cussion Paper No. 02-17, Ben-Gurion University, October.
Schechtman, E. (2000) Stratification: measuring and inference, Mimeo.
Schechtman, E. and Yitzhaki, S. (1987) A Measure of association based on Gini’s mean difference,Communications in Statistics Theory and Methods, Series A, 16, 1, 207-231.
Schechtman, E. and Yitzhaki, S. (1999) On the proper bounds of the Gini correlation, EconomicsLetters, 63, 2, (May), 133-138.
Schechtman, E. and Yitzhaki, S. (2000) Gini’s multiple regressions, Mimeo.
Schechtman, E. and Yitzhaki, S. (2003) A family of correlation coefficients based on extendedGini, Journal of Economic Inequality, forthcoming.
Serfling, R. J. (1980) Approximation theorems of mathematical statistics, John Wiley and Sons,New York.
Shih, W. J. and Huang, W. M. (1992) Evaluating correlation with proper bounds, Biometrics, 48,1207-1213.
Shorrocks, A. F. (1983a) The impact of income components on the distribution of family incomes,Quarterly Journal of Economics, 98, 311-326.
Shorrocks, A. F. (1983b) Ranking income distributions, Economica, 50, 3-17.
Silber, J. (1989) Factor components, population subgroups, and the computation of the Gini indexof inequality, Review of Economics and Statistics, 71, 107-115.
Simpson, E. H. (1949) Measurement of diversity, Nature, 163, 688.
Smirnov, N. V. (1937) On the distribution of the w2 criterion of von mises, Rec. Math., 2, 973-993.
Stuart, A. (1954) The correlation between variate values and ranks in samples from a continuousdistribution, British Journal of Statistical Psychology, 7, 37-44.
Stuart, A. and Ord, J. K. (1987) Kendall’s advanced theory of statistics, 1, (fifth edition), CharlesGriffin & Company, London.
Suits, D. B. (1977) Measurement of tax progressivity, American Economic Review, 67, 747-752.
Tobin, J. (1958) Liquidity preference as behavior toward risk, Review of Economic Studies, 25,(February), 65-87.

316 S. YITZHAKI
Tobin, J. (1965) The theory of portfolio selection, in Frank H. Hahn and Frank P. R., Brechling eds.,Theory of Interest Rates, MacMillan, London.
Yaari, M. E. (1988) A controversial proposal concerning inequality measuremen, Journal of Eco-nomic Theory, 44, 2, 381-397.
Yitzhaki, S. (1982) Stochastic dominance, mean variance and Gini’s mean difference, AmericanEconomic Review, 72, 178-185.
Yitzhaki, S. (1983) On an extension of the Gini inequality index, International Economic Review,24, 617-618.
Yitzhaki, S. (1990) On the sensitivity of a regression coefficient to monotonic transformations,Econometric Theory, 6, 2, 165-169.
Yitzhaki, S. (1994) Economic distance and overlapping of distributions, Journal of Econometrics,61, 147-159.
Yitzhaki, S. (1996)On using linear regression in welfare economics, Journal of Business & EconomicStatistics, 14, 4, (October), 478-86.
Yitzhaki, S. (1998) More than a dozen alternative ways of spelling Gini, in D. J. Slottje, ed., Researchon economic inequality, 8, 13-30.
Yitzhaki, S. (1999) Necessary and sufficient conditions for dominance using generalized Lorenzcurves, in D. J. Slottje, (ed.), Advances in econometrics, income distribution and scientificmethodology: Essays in honor of Camilo Dagum, Physica-Verlag, Heidelberg.
Yitzhaki, S. and Eisenstaedt, M. (2003) Groups’ Ranking versus Individuals’ Ranking, in: Fiscalpolicy, inequality, and welfare, Research on economic inequality, 10, (eds. Y. Amiel and J.H. Bishop), 10, JAI, Amsterdam, 101-123.
Yitzhaki, S. and Lerman, R. (1991) Income stratification and income inequality, Review of Incomeand Wealth, 37, 313-329.
Yitzhaki, S. and Olkin, I. (1988) Concentration curves, Working Paper No. 179, Dept. of Eco-nomics, The Hebrew University.
Yitzhaki, S. and Olkin, I. (1991) Concentration indices and concentration curves, in K. Mosler andM. Scarsini (eds.), Stochastic Orders and Decisions under Risk, Institute of MathematicalStatistics: Lecture-Notes Monograph Series, 19, 1991, 380-392.
Yitzhaki, S. and Slemrod, J. (1991) Welfare dominance: An application to commodity ctxation,American Economic Review, 81, 3, (June), 480-496.
Yitzhaki, S. and Wodon, Q. (2000) Mobility, inequality, and horizontal inequity, The World Bank,mimeo.
SHLOMO YITZHAKIDepartment of EconomicsHebrew UniversityJerusalem, 91905 (Israel)[email protected] Bureau of StatisticsJerusalem (Israel)