gis application - gvb€¦ · gis application tutorial 1: link the ... assuming that qgis is...
TRANSCRIPT
1
GIS Application
TUTORIAL 1: Link the CCDB to a Geographical Information System (GIS)
TUTORIAL 2: Editing the CCDB layer
TUTORIAL 3: Query Builder
2
TUTORIAL 1: Link the CCDB to a Geographical Information System (GIS)
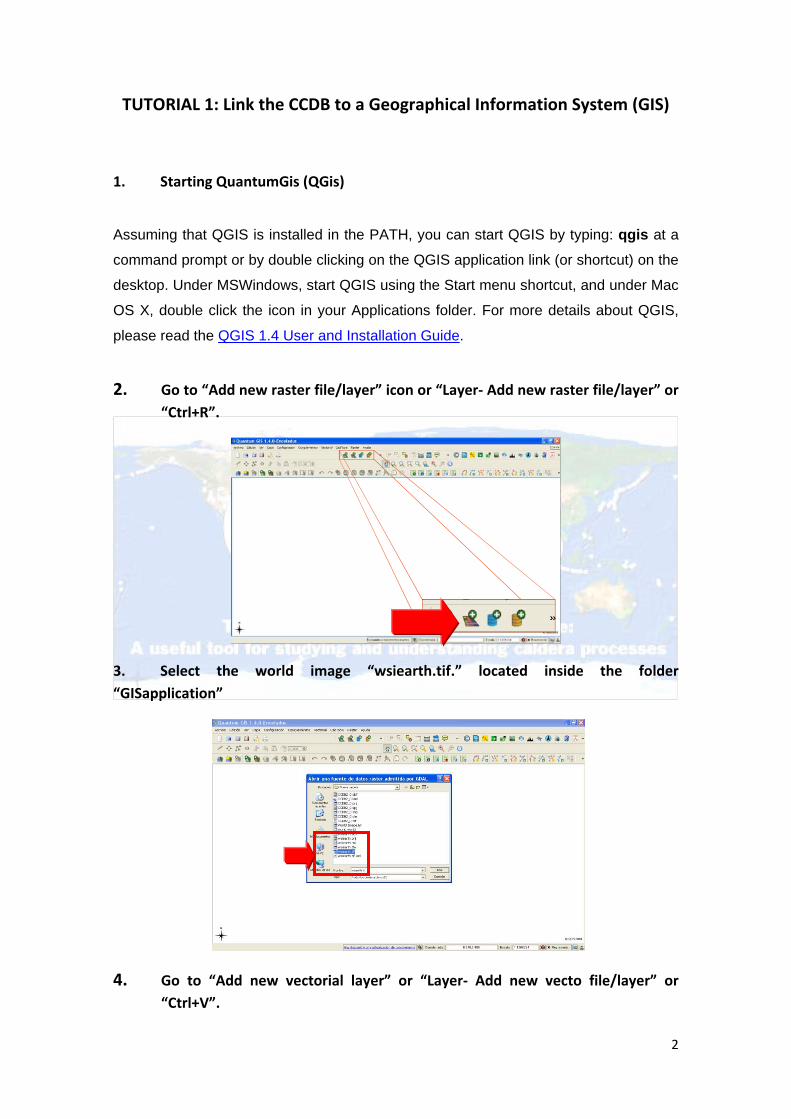
1. Starting QuantumGis (QGis)
Assuming that QGIS is installed in the PATH, you can start QGIS by typing: qgis at a
command prompt or by double clicking on the QGIS application link (or shortcut) on the
desktop. Under MSWindows, start QGIS using the Start menu shortcut, and under Mac
OS X, double click the icon in your Applications folder. For more details about QGIS,
please read the QGIS 1.4 User and Installation Guide.
2. Go to “Add new raster file/layer” icon or “Layer- Add new raster file/layer” or “Ctrl+R”.
3. Select the world image “wsiearth.tif.” located inside the folder “GISapplication”
4. Go to “Add new vectorial layer” or “Layer- Add new vecto file/layer” or “Ctrl+V”.

3
5. Use the button “Browse” to select the shape file “CCDB2_0.shp” located inside the folder “GISapplication”
The calderas included in the CCDB are plotted on the world image

4
TUTORIAL 2: Editing the CCDB layer
Click with the right button over the CCDB2_0.shp to open the contextual menu. Go to “Properties”
In the “Layer properties” window are seven different menus:
Simbology
Labels
Attributes
General
Metadata
Actions
Diagram overlay

5
Symbology Tab
QGIS supports a number of symbology renderers to control how vector features are
displayed. Currently the following renderers are available:
Single symbol - a single style is applied to every object in the layer.
Graduated symbol - objects within the layer are displayed with different symbols
classified by the values of a particular field.
Continuous color - objects within the layer are displayed with a spread of colors
classified by the numerical values within a specified field. This option is very useful to
differentiate the calderas according to their age, size, …in a visual way.
1. Select from the renderers list: “Graduate Symbol”

6
2. Select the classification field (e.g. area) (the field has to be a number (real or
integer)) (red arrow) and the number of intervals or classes (green arrow).
Press “Classify” (blue arrow).
The program takes the minimum and maximum values recorded in the field and
establishes the corresponding intervals. Each interval has its own symbol which can be
edited separately. Press “Accept”.
7
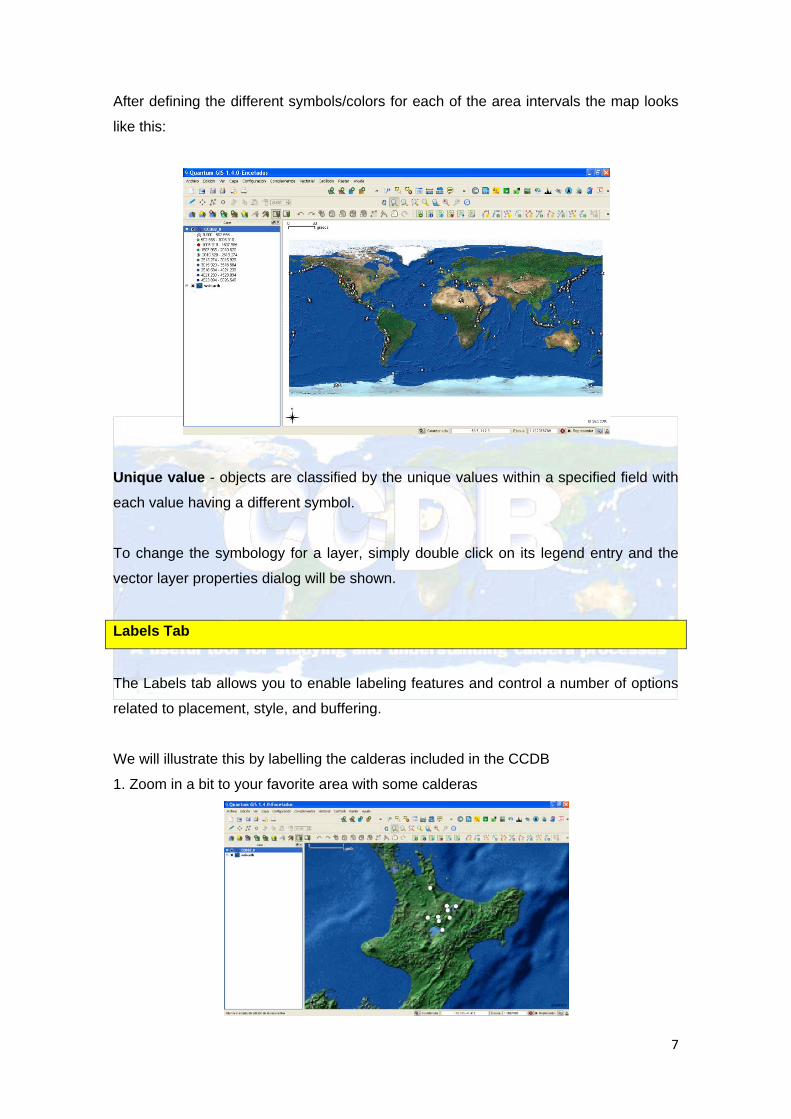
After defining the different symbols/colors for each of the area intervals the map looks
like this:
Unique value - objects are classified by the unique values within a specified field with
each value having a different symbol.
To change the symbology for a layer, simply double click on its legend entry and the
vector layer properties dialog will be shown.
Labels Tab
The Labels tab allows you to enable labeling features and control a number of options
related to placement, style, and buffering.
We will illustrate this by labelling the calderas included in the CCDB
1. Zoom in a bit to your favorite area with some calderas

8
2. Open the properties dialog of the layer “CCDB2_0” by clicking on it with the right
button.
3. Click on the “Labels” tab and check the “Display labels” checkbox to enable labeling
4. Choose the field to label with. We use the name of the caldera “CALDERA”

9
5. Enter a default for calderas that have no name (red arrow). The default label will be used each time QGIS encounters a caldera with no value in the CALDERA field. Click on the “Font Style” tab and use the Font (green arrow) and Color (blue arrow) buttons to set the font and color. It is possible to change position of the label regarding the point on the map (orange rectangle).Click Apply to see your changes without closing the dialog or press “Accept”.

10
General Tab The General tab is essentially like that of the raster dialog. It allows you to change the
information displayed when identifying specific objects in the map, set scale dependent
rendering options, create a spatial index of the vector file (only for OGR supported
formats and PostGIS), and view or change the projection.
The Query Builder button allows you to create a subset of the features in the layer (See
Tutorial 3)
Changing the display information
1. Select the tool “Identify spatial objects” and click on any caldera.
2. QGis display certain information regarding the selected caldera. In this case the
“Latitude”.
3. By pressing “+” at the left side of “Latitude” we can see all the information
regarding the selected caldera.

11
4. If we are interested in displaying the name of the caldera instead of the
“latitude” . Open the properties dialog of the layer “CCDB2_0” by clicking on it
with the right button. Click on the “General” tab (red arrow). In “Display Field”
select “CALDERA” (blue arrow). Press “Accept”
5. Select the tool “Identify spatial objects” and click on any caldera. QGis displays
certain information regarding the selected caldera. Now “CALDERA”.

12
Metadata Tab
The Metadata tab contains information about the layer, including specifics about the
type and location, number of features, feature type, and the editing capabilities. The
projection and attribute fields and their data type are displayed on this tab. This is a
quick way to get information about the layer.

13
TUTORIAL 3: Query builder
The Query Builder allows you to define a subset of a table and display it as a layer in
QGIS. It can be used for all OGR supported formats, GRASS files and PostGIS layers.
1. Click with the right button over the CCDB2_0.shp to open the contextual menu.
Go to “Attribute table” and select “Advance Search”
2. The query builder lists the layer’s database fields in the list box on the left. Select the Field you want to use for the query. In this example, we want to plot the calderas ONLY in the United States and Canada (World Region 12). Thus select the field “World region” (red arrow). To add a selected field or value to the query, double-click on it. The name of the selected field (in this case “World region”) appears in the SQL box at the bottom (blue arrow).

14
3. You can use the various buttons to construct the query or you can just type it into the SQL box. You can get a sample of the data contained in the field “World region” by clicking on the Sample button (red arrow). This retrieves the first 25 distinct values for the field from the database. To get a list of all possible values for a field, click on the All button (blue arrow).
4. To select those calderas located in United States select “12” on the values list (double click) and test a query, click on the Test button. This will return a count of the number of records that will be included in the layer.

15
When satisfied with the query, click “Accept”
The program will mark the calderas found by the query. It is possible to save the selection by clicking “Save the selection as shape file” in the contextual menu of the CCDB2_0_calderas layer. Later, it is possible to open the generated shape file as an independent layer.
For further help concerning QGIS and the CCDB , please, contact A. Geyer ([email protected])