gis introduction and sample uses - pdhonline.com · femas gis tutorial series (tutorials i, ii and...
TRANSCRIPT

PDHonline Course L145 (5 PDH)
GIS - Introduction and Sample Uses
2012
Instructor: Jonathan Terry, P.L.S.
PDH Online | PDH Center5272 Meadow Estates Drive
Fairfax, VA 22030-6658Phone & Fax: 703-988-0088
www.PDHonline.orgwww.PDHcenter.com
An Approved Continuing Education Provider

Welcome to:
FEMAs GIS Tutorial Series
(Tutorials I, II and III)
Screen-captures of FEMA’s well-thought-out and carefully
presented tutorial on:
GIS
(Geographic Information Systems)
TUTORIAL 1 OF 3
The tutorial series presents an introduction to GIS
illustrated with FEMA’s application of GIS in their
MAP MODERNIZATION OBJECTIVES

Page 2 of 33
Table of Contents
Page Description of Content --- INTRODUCTION ---
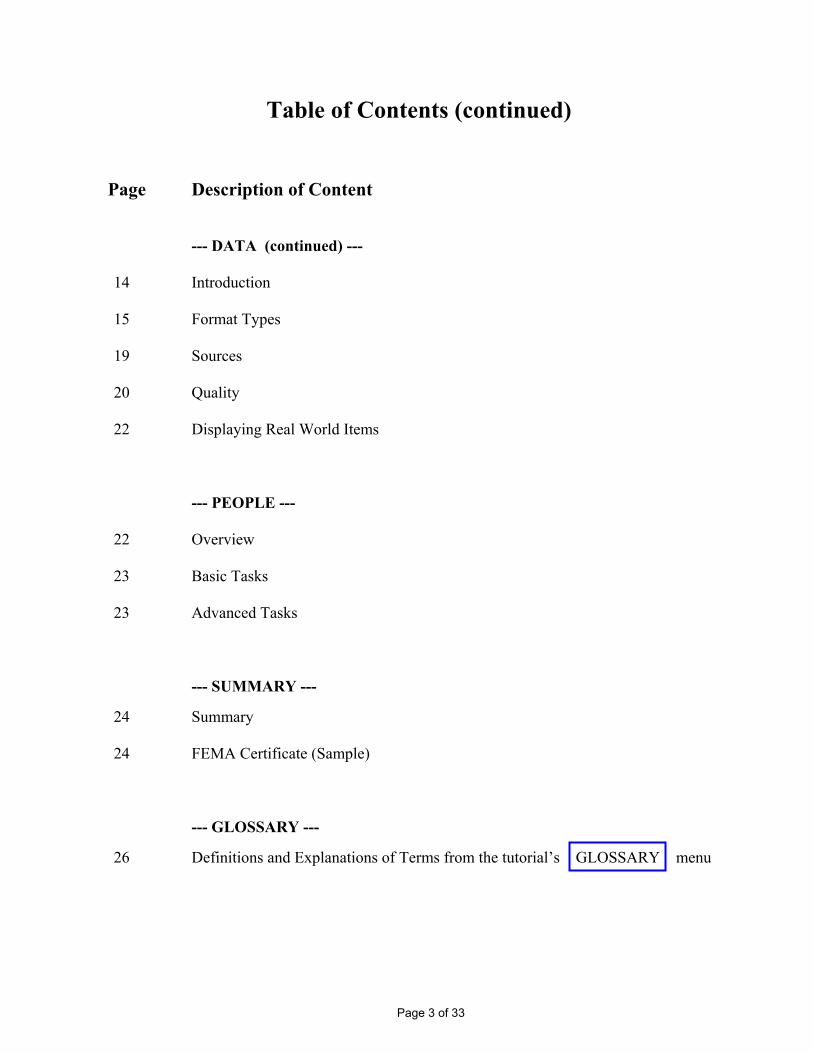
4 Title page & Links to the on-line tutorial 5 Learning Objectives / What is a GIS? 6 GIS Components
--- HARDWARE ---
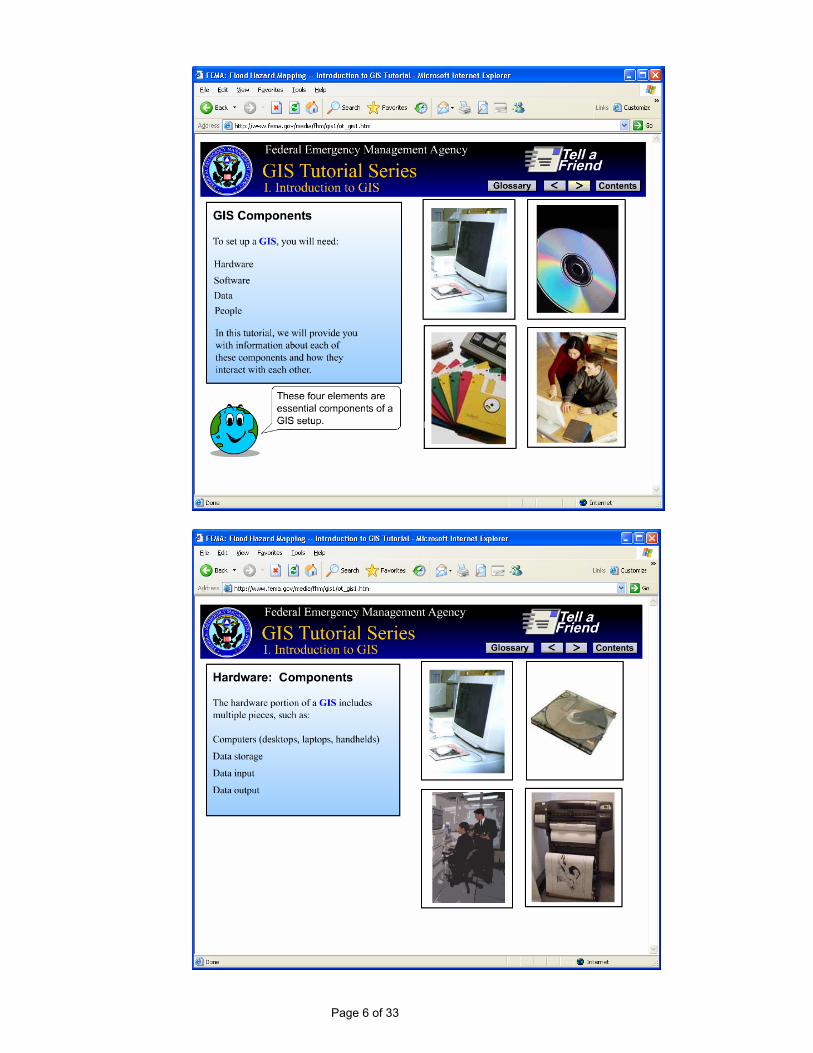
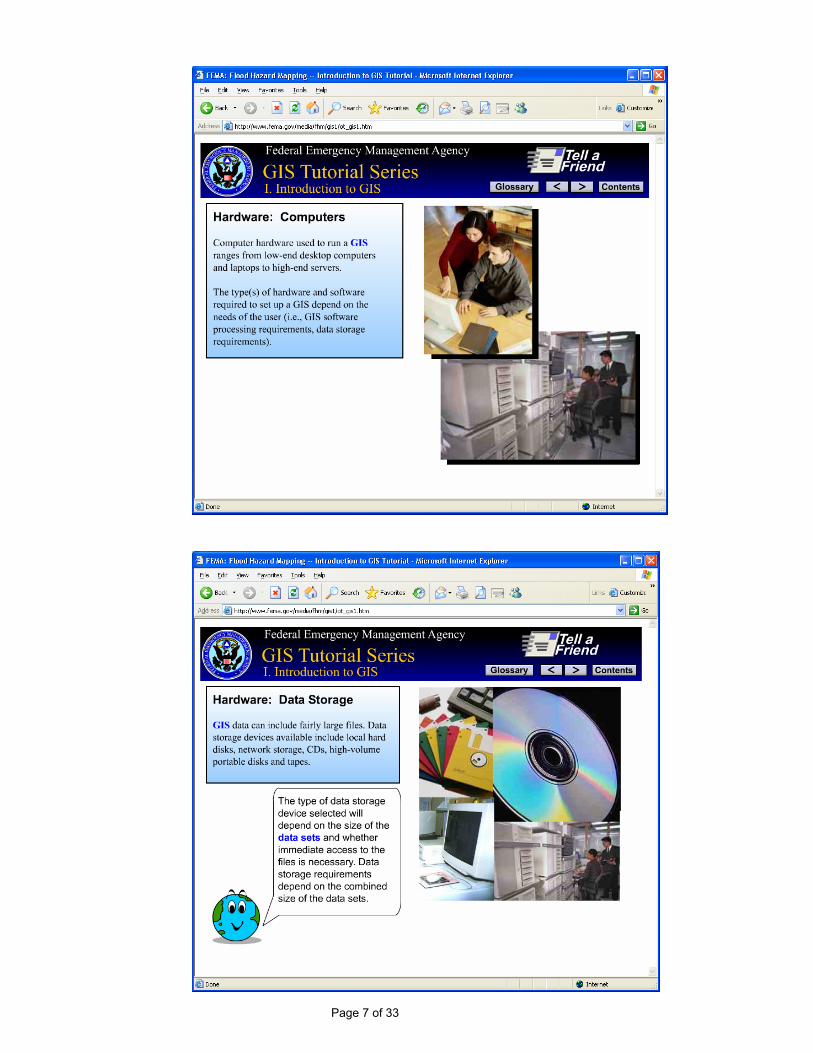
6 Hardware Components 7 Computers 7 Data Storage 8 Data Input 8 Data Input Output 9 Sample Setups
--- SOFTWARE ---
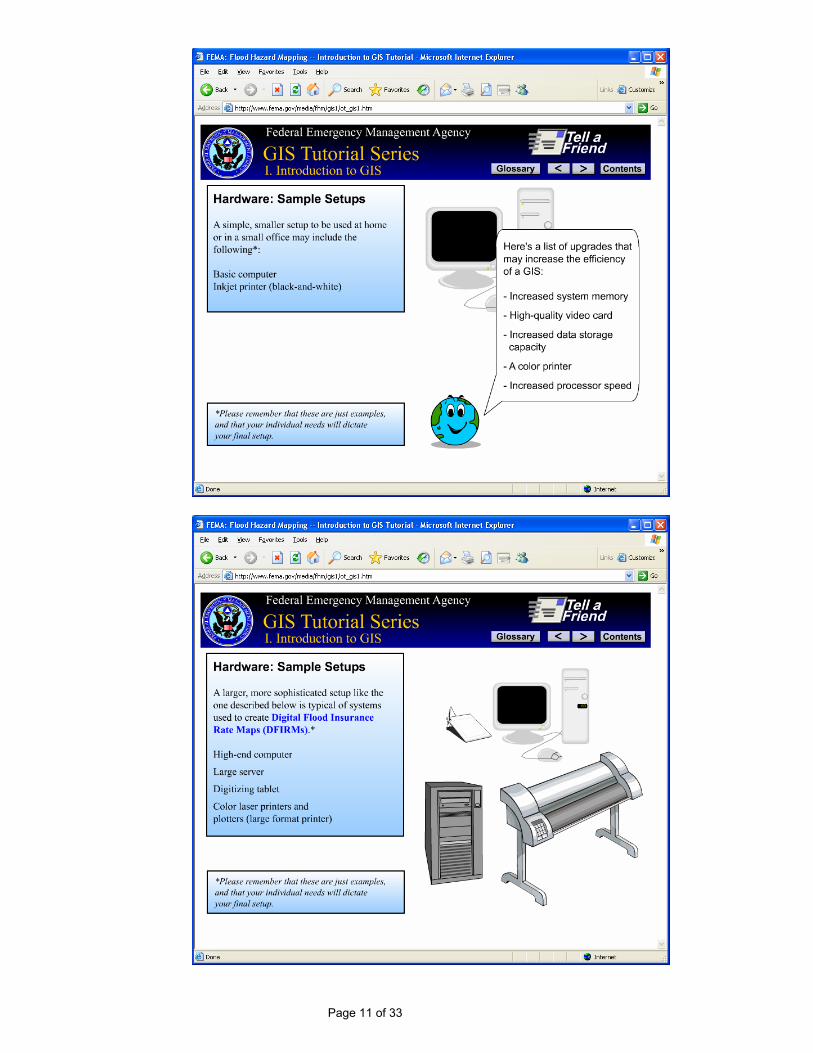
12 Programs 12 Sample Setups
--- Contents Continue on Following Page ---
IMPORTANT: The blue-text links in the course material and the GLOSSARY entries accessed through the pull-down menu provide significant benefits to those studying the “live,” on-line tutorial. For this reason, it is suggested that those using this hard-copy version of FEMA’s GIS tutorial series make frequent reference to the GLOSSARY section at the end of each portion of the tutorial. For your convenience and ease of study, each of these three hard-copy files (a separate file covering each session of FEMA’s 3-part GIS tutorial series) contains GLOSSARY entries from all three “live” tutorials. Both the course material and the quiz rely on frequent reference to these GLOSSARY entries.
Page 3 of 33
Table of Contents (continued)
Page Description of Content
--- DATA (continued) ---
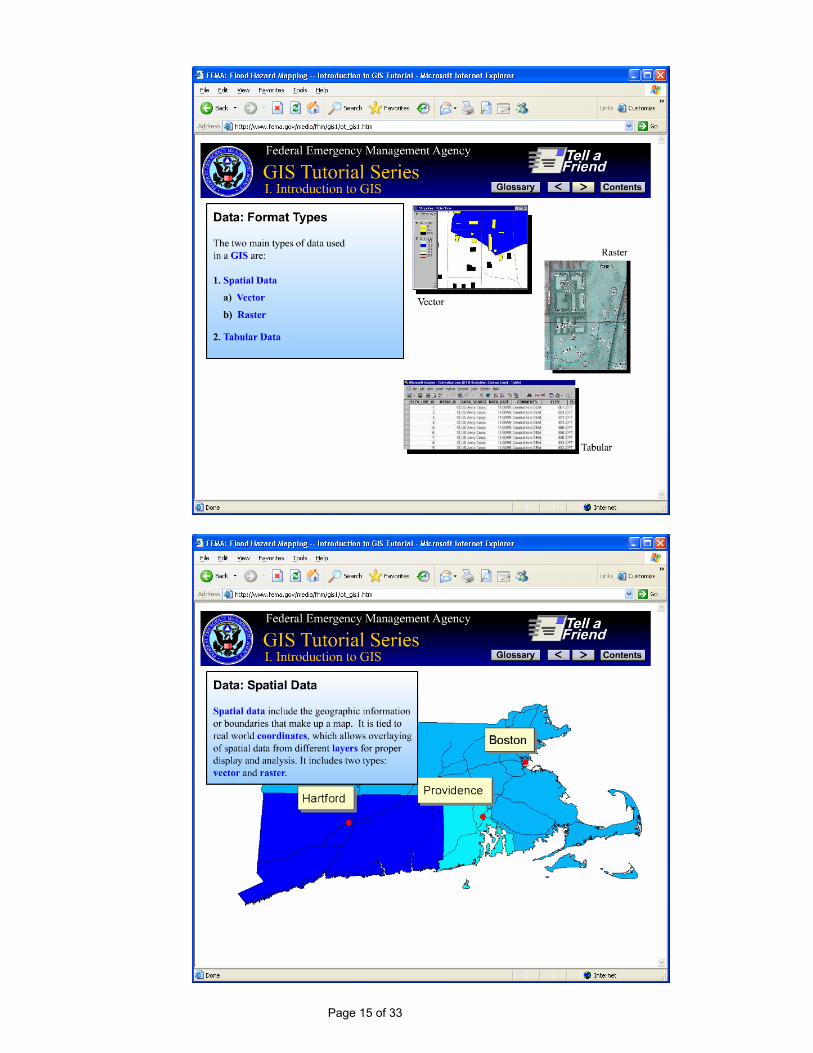
14 Introduction 15 Format Types 19 Sources 20 Quality 22 Displaying Real World Items
--- PEOPLE ---
22 Overview 23 Basic Tasks 23 Advanced Tasks
--- SUMMARY ---
24 Summary 24 FEMA Certificate (Sample)
--- GLOSSARY ---
26 Definitions and Explanations of Terms from the tutorial’s GLOSSARY menu

Page 4 of 33
Interested in viewing the on-line tutorial? Tutorial system reqmts
http://www.fema.gov/plan/prevent/fhm/ot_gisrq.shtm This link takes you directly to the tutorial
http://www.fema.gov/media/fhm/gis1/ot_gis1.htm

Page 5 of 33
Page 6 of 33
Page 7 of 33

Page 8 of 33

Page 9 of 33

Page 10 of 33
Page 11 of 33

Page 12 of 33

Page 13 of 33

Page 14 of 33
Page 15 of 33

Page 16 of 33

Page 17 of 33
Page 18 of 33

Page 19 of 33

Page 20 of 33
Page 21 of 33

Page 22 of 33
Page 23 of 33

Page 24 of 33
At the conclusion of the tutorial, you can create an attractive Certificate of Completion Enter your name as you want it to appear on the certificate and click on “Create Certificate.” The certificate looks most impressive if plotted in color as the screen-capture on the following page illustrates.
Page 25 of 33

Page 26 of 33
GLOSSARY
(Terms found in FEMA's three GIS tutorials)
100-Year Flood The flood having a 1-percent chance of being equaled or exceeded in any given year, also known as the base flood. The 1-percent annual chance flood, which is the standard used by most Federal and state agencies, is used by the National Flood Insurance Program (NFIP) as the standard for floodplain management and to determine the need for flood insurance. A structure located within a flood hazard area shown on an NFIP map has a 26 percent chance of suffering flood damage during the term of a 30-year mortgage. 1-percent annual chance floodplain This is the boundary of the flood that has a 1-percent chance of being equaled or exceeded in any given year. Also known as, "the 100-year floodplain." 500-Year Floodplain This is the boundary of the flood that has a 0.2-percent chance of being equaled or exceeded in any given year. Officially termed "the 0.2-percent annual chance floodplain." Accuracy This term refers to the conformance to a reasonable standard. The statistical meaning of accuracy is the degree with which an estimated mean differs from the true mean. Different projects require different levels of data accuracy than others. The National Standard for Spatial Data Accuracy (NSSDA) has implemented a well-defined statistical and testing methodology for the positional accuracy of maps and geospatial data derived from sources such as aerial photographs, satellite imagery, or maps. Accuracy specifications for data collection during a FEMA Flood Insurance Study are outlined in several FEMA-authored guidance documents. Area Data A fundamental unit of geographic information; it is a measure of a particular extent of the earth’s surface.

Page 27 of 33
Automated Floodplain Mapping The use of digital elevation models (DEMs) or digital terrain models with digital water surface elevation data in the GIS environment to define the limits of the floodplain. Base Flood The flood having a 1-percent chance of being equaled or exceeded in any given year, also known as the 100-year flood. The base flood, which is the standard used by most Federal and state agencies, is used by the National Flood Insurance Program (NFIP) as the standard for floodplain management and to determine the need for flood insurance. A structure located within a special flood hazard area on a NFIP map has a 26-percent chance of suffering flood damage during the term of a 30-year mortgage. Block Group (data) A geographical area bounded on all sides by visible or nonvisible features shown on Census maps. A block group is the third smallest geographic entity for which the Census Bureau collects and tabulates decennial Census information. Buffers A zone of a specified distance around spatial features. Both constant- and variable-width buffers can be generated for a set of spatial features based on each feature's attribute values. The resulting buffer zones form polygons-areas that are either inside or outside the specified buffer distance from each feature. Buffers are useful for proximity analysis (e.g., find all stream segments within 300 feet of a proposed logging area). Coordinate System A reference system used to measure horizontal and vertical distances on a planimetric map. A coordinate system is usually defined by a map projection, a spheroid of reference, a datum, one or more standard parallels, a central meridian, and possible shifts in the x- and y-directions to locate x,y positions of point, line, and area features. In some software packages, it is used to refer to a system with units and characteristics defined by a map projection. A common coordinate system is used to spatially register geographic data for the same area. Data Sets A collection of related records. Datum A fixed starting point of a scale. Density (Population Density Data) The number of inhabitants per unit ia a geographic region.

Page 28 of 33
Digital Flood Insurance Rate Map (DFIRM) A FIRM is a map produced by FEMA that shows flood hazard information and is used to rate flood insurance. A DFIRM is a FIRM that was produced suing digital technology. As part of FEMA's Map Modernization Objectives, a new Digital Flood Insurance Rate Map (DFIRM) product is being developed. The new DFIRM product will include a spatial database with options that can be invoked depending on the available data. The DFIRM spatial database will include certain standard features and meet minimum mapping requirements. Additional enhancements will be included depending on community needs, available data, and funding. A review of needs and available data will lead to recommendations concerning which options to exercise. Digitizing The process of converting map data from their original visual form (i.e., a paper map) to a digital format that can be handled by a computer. Discrete (cells) Self-contained, distinct units. Flood (also Flooding) A general and temporary condition of partial or complete inundation of normally dry land areas. For flood insurance claim purposes, two or more structures must be inundated before flood damage will be covered. Flood Hazard Data Information about a community’s flooding hazards used to prepare Flood Insurance Rate Maps and Flood Insurance Study reports. It may include information such as statistical analyses of records of river-flow, storm tides, and rainfall; information obtained through consultation with the community; floodplain topographic surveys; and hydrologic and hydraulic analyses. Flood Insurance Rate Map (FIRM) A map on which the 100-year (1% annual chance) and the 500-year (0.2% annual chance) floodplains, Base Flood Elevations, and risk premium zones (and floodway information on Map Initiatives FIRMs) are delineated to enable insurance agents to issue an accurate flood insurance policies to homeowners in communities participating in the National Flood Insurance Program. Floodplain or Flood-Prone Area Any land area susceptible to inundation by water from any source.

Page 29 of 33
Floodplain Management The operation of the program of corrective and preventive measures for mitigating flood damage, including, but not limited to, emergency preparedness plans, flood-control works, and floodplain management regulations. Floodway Channel of the stream plus any adjacent floodplain areas that must be kept free of encroachment so that a 100-year flood discharge can be conveyed without increasing the elevation of the 100-year flood by more than a specified amount (1 foot in most states). Geocoding Assigning locational coordinates, such as longitude/latitude, to map features (i.e., assigning a point location on the earth for a mailing address. Georeference To establish the relationship between page coordinates on a planar map and known real-world coordinates. GIS (Geographic Information System) A Geographic Information System (GIS) is a computer-based system to capture, store, retrieve, manipulate, analyze and display spatial information and its associated attributes. It combines spatial and tabular information to produce maps and to perform spatial analyses. GPS The Global Positioning System (GPS) is a satellite-based radio navigation system developed and operated by the U.S. Department of Defense (DOD). It allows land, sea, and airborne users to determine their three-dimensional position, velocity and time precisely and accurately, 24 hours a day, in all weather, anywhere in the world. Each GPS satellite transmits an accurate position and time signal. GPS receivers collect signals from satellites and display the user's position, velocity, and time is needed for their marine, terrestrial, or aeronautical applications. HAZUZ PC-based GIS software used to implement a standardized, nationally applicable earthquake loss estimation method. The HAZUZ software is being expanded to perform similar loss evaluations for wind (hurricanes, thunderstorms, tornadoes, extra tropical cyclones and hail) and flood (riverine and coastal) hazards. HAZUZ Development Is Being Funded by FEMA through a Cooperative Agreement with the National Institute of Building Sciences.

Page 30 of 33
Housing Unit (Data) A house, an apartment or other group of rooms, or a single room, is regarded as a housing unit when it is occupied or intended for occupancy as separate living quarters; that is, when the occupants do not live and eat with any other persons in the structure and there is direct access from the outside or through a common hall. IFSAR InterFerometric Synthetic Aperture Radar. It uses airborne or space-born radar antennae to obtain highly accurate terrain data over a larger geographical areas. LIDAR Light Detection And Ranging. Airborne laser system that combines a pulsing laser with a positioning system consisting of a Global Positioning System (GPS) receiver and an Inertial Measuring Unit (IMU) to measure the elevation of ground points on the earth's surface. Labeling The process of attaching identification codes to map features (i.e., attaching city names to city point locations. Layer A layer is a logical separation of mapped information according to theme. Many Geographic Information Systems and CAD/CAM systems allow the user to choose and work on a single layer or any combination of layers at a time. Line Data One of the basic geographical primitives. It is defined by at least two pairs of XY coordinates. National Flood Insurance Program (NFIP) Federal insurance program under which flood-prone areas are identified and flood insurance is made available to residents of participating communities that agree to adopt and enforce floodplain management ordinances to reduce future flood damage. Point Data A position, place or locality. Polygon A multi-sited figure representing an area on a map; a geographic primitive.

Page 31 of 33
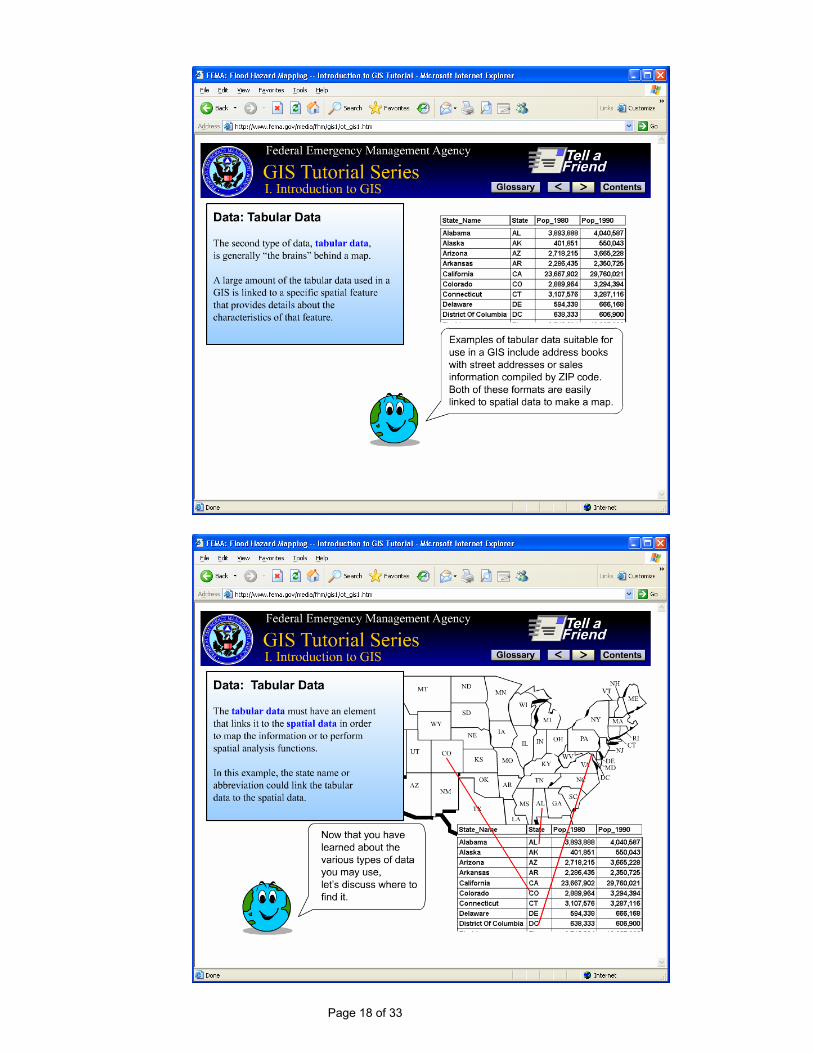
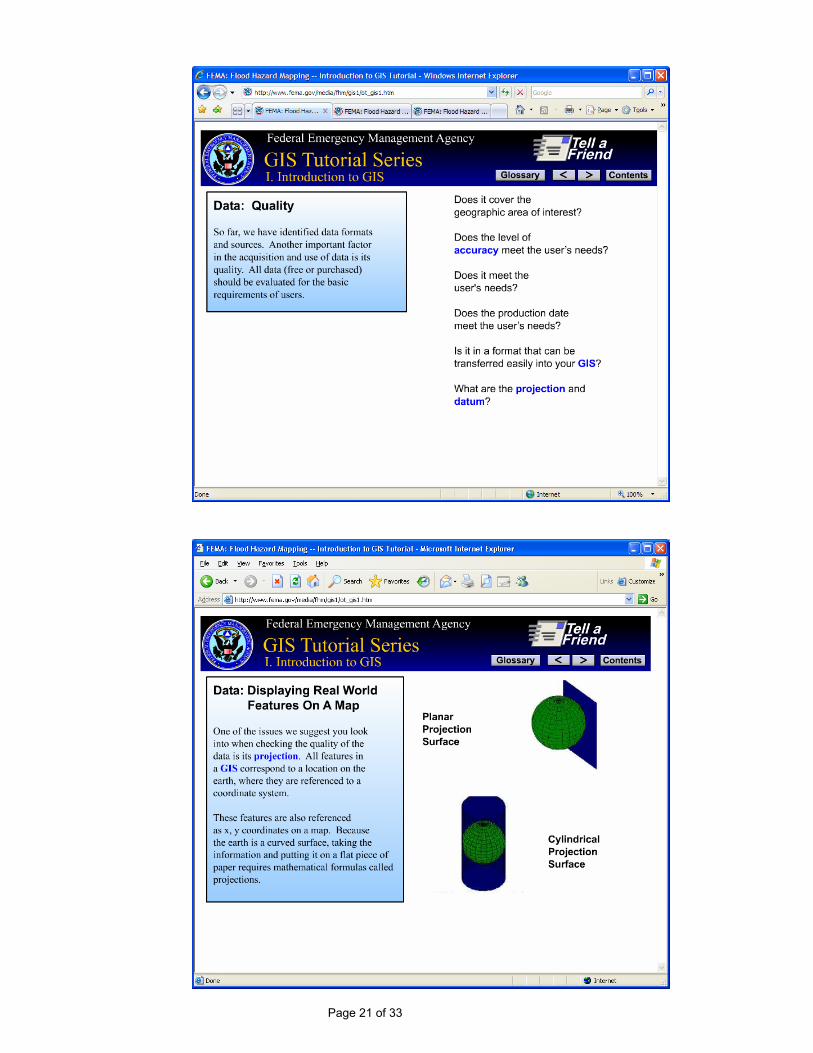
Projection A mathematical model the transforms the locations of features on the Earth's surface to locations on a two-dimensional surface. Because the Earth is three-dimensional, some methods must be used to depict a map in two dimensions. Some projections preserve shape; others preserve accuracy of area, distance, or direction. See also coordinates or coordinate system. Map projections project the earth's surface onto a flat plane. However, any such representation distorts some parameter of the earth's surface be it distance, area, shape, or direction. Q3 Data A digital representation of certain features of FEMA's Flood Insurance Rate Map (FIRM) product, intended for use with desktop mapping and GIS technology. Because of the scale of the digital Q3 Flood Data, it cannot be used to determine absolute delineations of flood risk boundaries. Raster A regular grid of cells covering an area. Raster Spatial Data A discrete set of uniform cells are coded to represent spatial information. Remote Sensing Acquiring information about an object without contacting it physically. Methods include aerial photography, radar, and satellite imaging. For example, when responding to a disaster, FEMA's Mapping and Analysis Center (MAC) may receive remote sensing data that indicates areas affected by the disaster, as derived from various imagery products. Typical examples include flooded, saturated and/or damaged areas. Special Flood Hazard Area (SFHA) Area inundated by the base (1-percent annual chance) flood, identified on the Flood Insurance Rate Map as Zones A, AE, AH, AO, AR, V, VE, or A99. Saturated Soaked with moisture. Spatial Data (or Spacial Information) Includes the geographic information of boundaries that make up a map; also known as georeferenced data. Tabular Data (or Tabular Information) Data organized in a table format.

Page 32 of 33
Thematic Map A map showing information about a particular topic, often statistical in nature (i.e., population per state). Vector The representation of spatial data by points, lines and polygons.
------------------------------------------ Below are Zones found on Flood Insurance Rate Maps (FIRMs):
Zone A The flood insurance rate zone that corresponds to the 100-your floodplains that is determined in the Flood Insurance Study by approximate methods. Because detailed hydraulic analyses are not performed for such areas, no Base Flood Elevations or depths are shown within this zone. Mandatory flood insurance purchase requirements apply. Zone A99 The flood insurance rate zone that corresponds to areas of the 100-year floodplains that will be protected by a Federal flood protection system where construction has reached specified statutory milestones. No Base Flood Elevations or depths are shown within the zone. Mandatory flood insurance purchase requirements apply.
Zone AE [Note: In the tutorial, the following definition for Zone AE is accessed through clicking a link titled, "Zone AE and A1-A30.] The flood insurance rate zone that corresponds to the 100-year floodplains that is determined in the Flood Insurance Study by detailed methods. In most instances, Base Flood Elevations derived from the detailed hydraulic analyses are shown at selected intervals within this zone. Mandatory flood insurance purchase requirements apply. Zone AH The flood insurance rate zone that corresponds to the areas of the 100-year shallow flooding with a constant water-surface elevation (usually areas of ponding) where average depths are between 1 and 3 feet. The Base Flood Elevations derived from the detailed hydraulic analyses are shown at selected intervals within this zone. Mandatory flood insurance purchase requirements apply.

Page 33 of 33
Zone AO The flood insurance rate zone that corresponds to the area of 100-year shallow flooding (usually sheet flow on sloping terrain) where average depths are between 1 and 3 feet. The depth should be averaged along the cross-section and then along the direction of flow to determine the extent of the zone. Average flood depths derived from the detailed hydraulic analyses are shown within this zone. In addition, alluvial fan flood hazards are shown as Zone AO on the Flood Insurance Rate Map. Mandatory flood insurance purchase requirements apply. Zone AR The flood insurance rate zone that results from the decertification of a previously accepted flood protection system that is being restored to provide protection from the 100-year or greater flood event. Zone D Designation on National Flood Insurance Program maps used for areas where there are possible, but undetermined, flood hazards. In areas designated as Zone D, no analysis of flood hazards has been conducted. Mandatory flood insurance purchase requirements do not apply, but coverage is available. The flood insurance rates for properties in Zone D are commensurate with the uncertainty of the flood risk.
Zone V The flood insurance rates zone that corresponds to the 100-year coastal floodplains that have additional hazards associated with storm waves. Because approximate hydraulic analyses are performed for such areas, no Base Flood Elevations are shown within this zone. Mandatory flood insurance purchase requirements apply. Zone VE The flood insurance rates zone that corresponds to the 100-year coastal floodplains that have additional hazards associated with storm waves. Base Flood Elevations derived from the detailed hydraulic analyses are shown at selected intervals within this zone. Mandatory flood insurance purchase requirements apply. Zones B, C and X The flood insurance rates zone that corresponds to areas outside the 100-year floodplains, areas of 100-year sheet flow flooding where average depths are less than 1 foot, areas of 100-years stream flooding where the contributing drainage area is less than 1 square mile, or areas protected from the 100-year flood by levees. No Based Flood Elevations or depths are shown within this zone.