gis modeling venkatesh merwade, university of texas at austin interdisciplinary aquatic modeling...
Post on 22-Dec-2015
217 views
TRANSCRIPT
GIS Modeling
Venkatesh Merwade, University of Texas at Austin
Interdisciplinary aquatic modeling workshop, July 21, 2005

Overview
• GIS and data representation
• Geodatabase design
• Vector and surface analysis
• 3D and visualization in GIS
• GIS and Modeling
• Case studies

Geographic Data Model
• Conceptual Model – a set of concepts that describe a subject and allow reasoning about it
• Mathematical Model – a conceptual model expressed in symbols and equations
• Data Model – a conceptual model expressed in a data structure (e.g. ascii files, Excel tables, …..)
• Geographic Data Model – a conceptual model for describing and reasoning about the world expressed in a GIS database

Data Model Data Model based on based on Inventory of Inventory of data layersdata layers
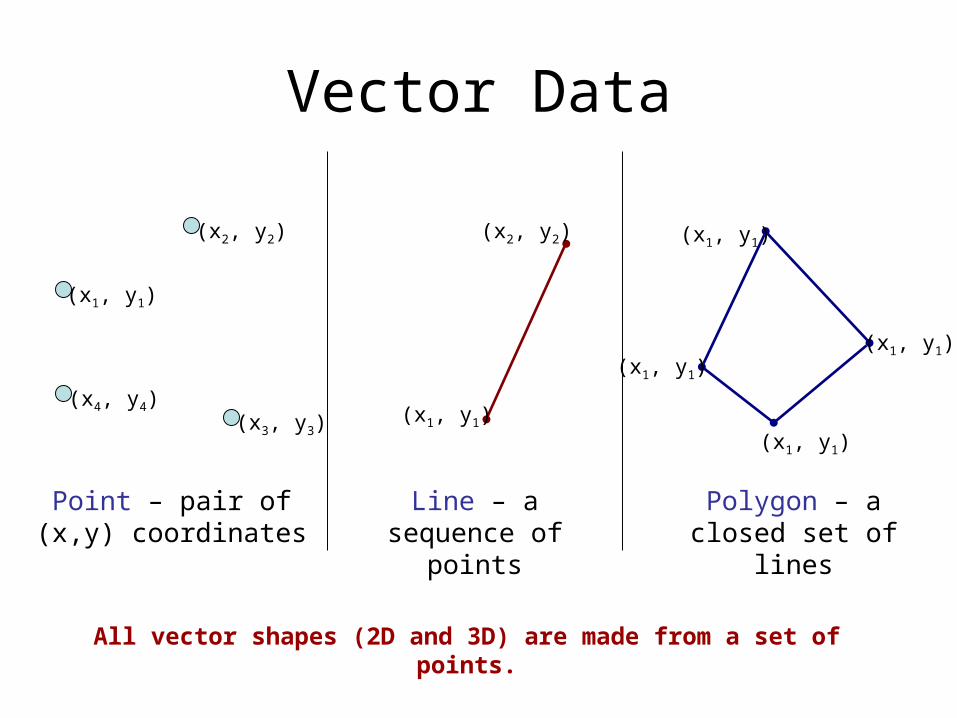
Vector Data
(x1, y1)
(x2, y2)
(x4, y4)(x3, y3)
Point – pair of (x,y) coordinates
(x2, y2)
(x1, y1)
(x1, y1)
(x1, y1)
(x1, y1)
(x1, y1)
Line – a sequence of points
Polygon – a closed set of lines
All vector shapes (2D and 3D) are made from a set of points.

Vector Data for Guadalupe Basin in Texas
Monitoring Points – USGS gaging
stations
Stream Network – Low resolution NHD
Flowlines
Watershed – 8 digit HUC units

Measure in ArcGIS
A PolylineMZ can store m and z at each vertex along with x and y coordinates.
064.0056 112.3213
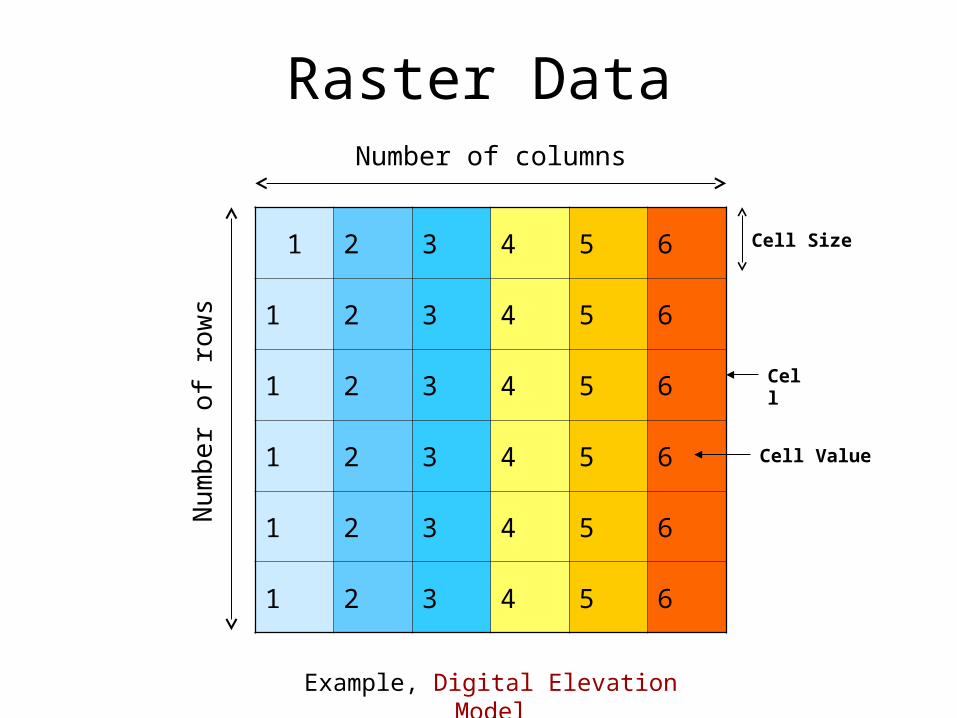
Raster Data
1 2 3 4 5 6
1 2 3 4 5 6
1 2 3 4 5 6
1 2 3 4 5 6
1 2 3 4 5 6
1 2 3 4 5 6
Number of columns
Num
ber
of r
ows
Cell Size
Cell
Cell Value
Example, Digital Elevation Model
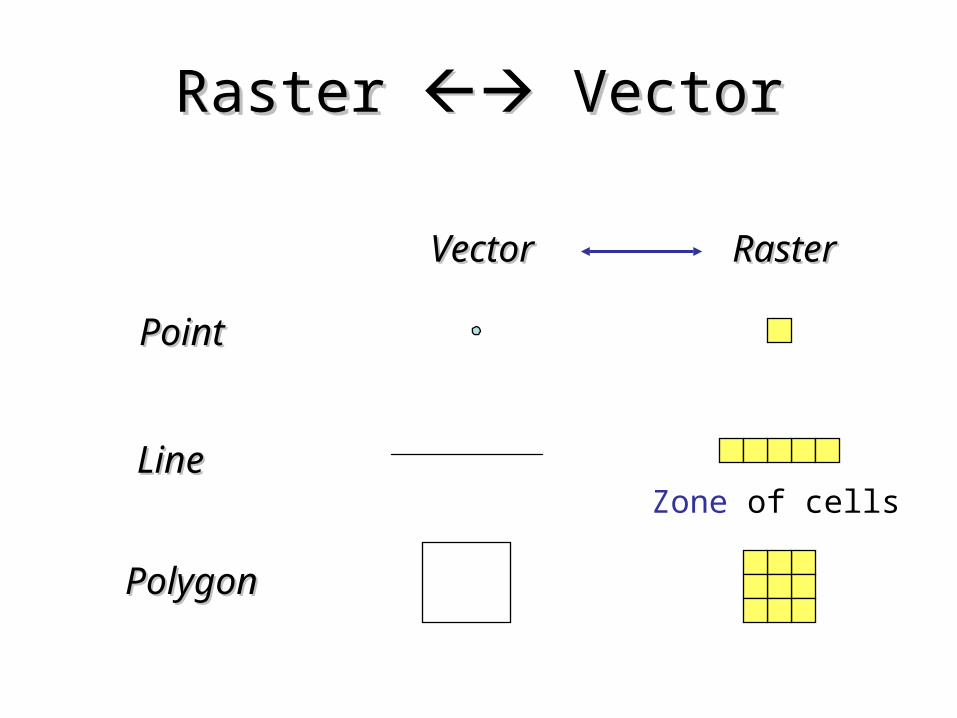
Raster Raster Vector Vector
PointPoint
LineLine
PolygonPolygon
VectorVector RasterRaster
Zone of cells
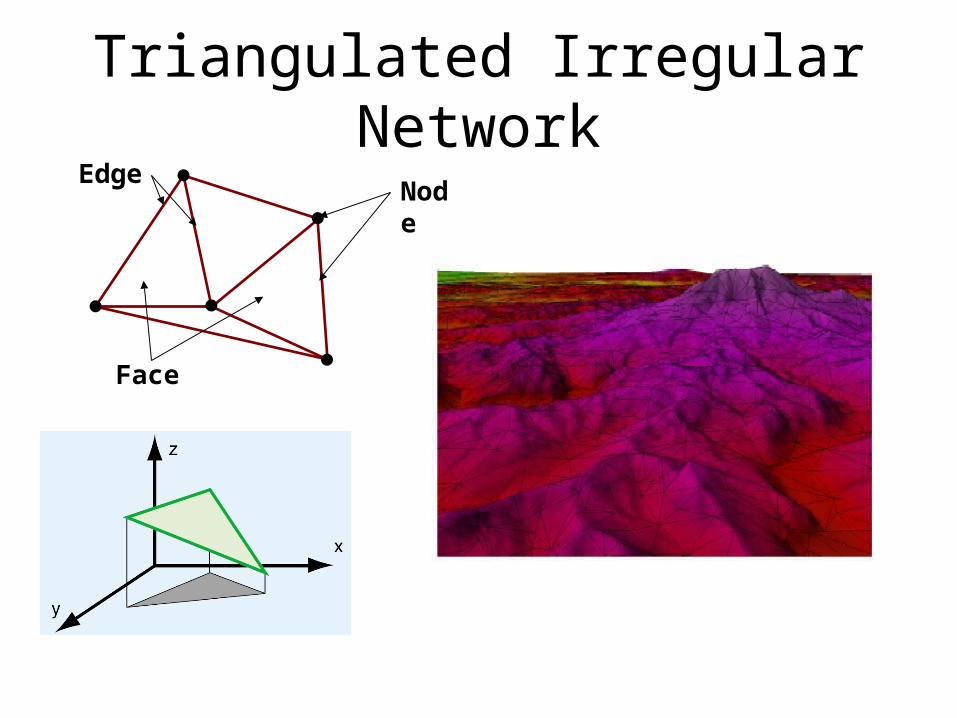
Triangulated Irregular NetworkEdge
Node
Face

How do we combine these data?
Digital ElevationModels
Watersheds Streams Waterbodies
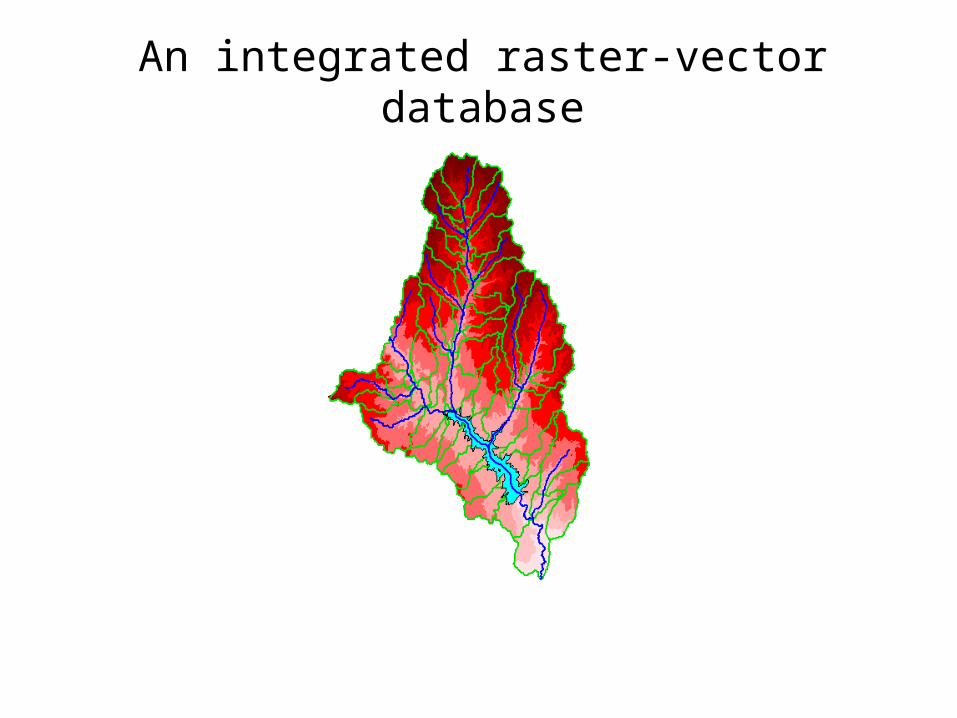
An integrated raster-vector database

Overview
• GIS and data representation
• Geodatabase design
• Vector and surface analysis
• 3D and visualization in GIS
• GIS and Modeling
• Case studies
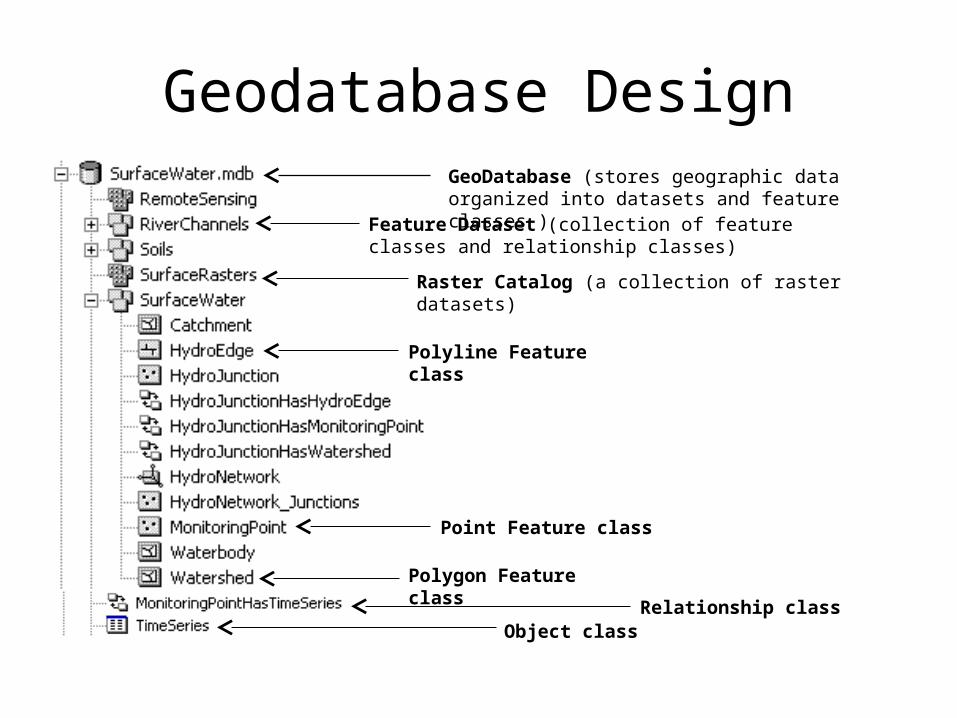
Geodatabase DesignGeoDatabase (stores geographic data organized into datasets and feature classes )
Feature Dataset (collection of feature classes and relationship classes)
Raster Catalog (a collection of raster datasets)
Polyline Feature class
Point Feature class
Polygon Feature class
Relationship classObject class
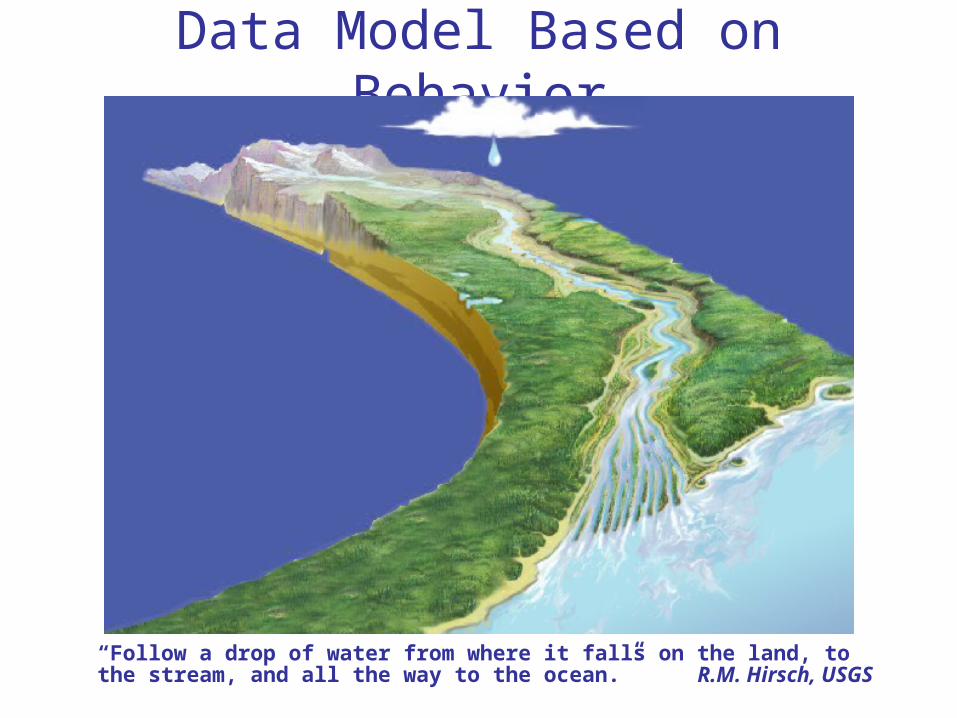
Data Model Based on Behavior
“Follow a drop of water from where it falls on the land, to the stream, and all the way to the ocean.” R.M. Hirsch, USGS

Integrating Data Inventory using a Behavioral Model
Relationships betweenobjects linked by tracing pathof water movement
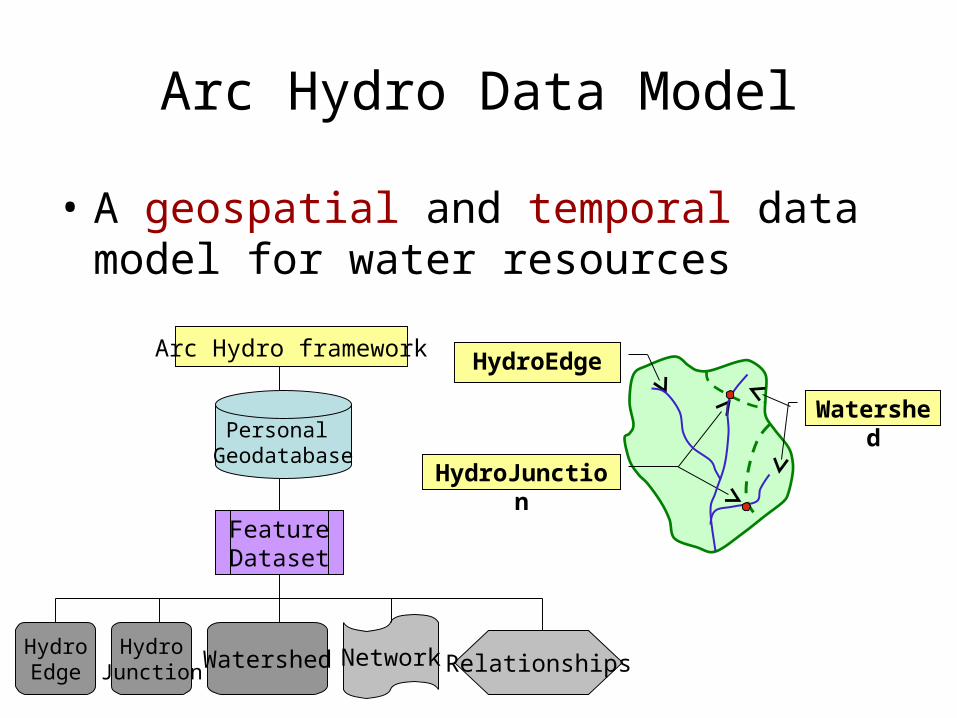
Arc Hydro Data Model
• A geospatial and temporal data model for water resources
HydroJunction
HydroEdge
Watershed
Arc Hydro framework
Personal Geodatabase
HydroEdge
HydroJunction Watershed Network Relationships
FeatureDataset
Overview
• GIS and data representation
• Geodatabase design
• Vector and surface analysis
• 3D and visualization in GIS
• GIS and Modeling
• Case studies

Vector Analysis
• Attribute tools – Join/relate, calculations
• Topology and Network analysis– geometric networks and solvers
• Geo-processing– Batch processing of geometries

Attribute Relationships
ReachHasCrossSectionsReachHasCrossSections

Calculations using vector attributes
70.68
3.23
49.301.6534.1702.6947.264.71898
AvgCN
51.32
3.23
49.366.3234.1753.3247.220.32898
AvgPR
Wshed 1 Area = 2.47
CN = 71.64
PR = 32.20
Wshed 2 Area = 3.49
CN = 65.01
PR = 32.66
Wshed 3 Area = 23.30
CN = 68.70
PR = 32.51
1
2
3

Geometric Network
Network Flag
Geometric Network for Streams in Geometric Network for Streams in Upper GuadalupeUpper Guadalupe
Trace DownstreamTrace Downstream
Trace UpstreamTrace Upstream Find PathFind Path
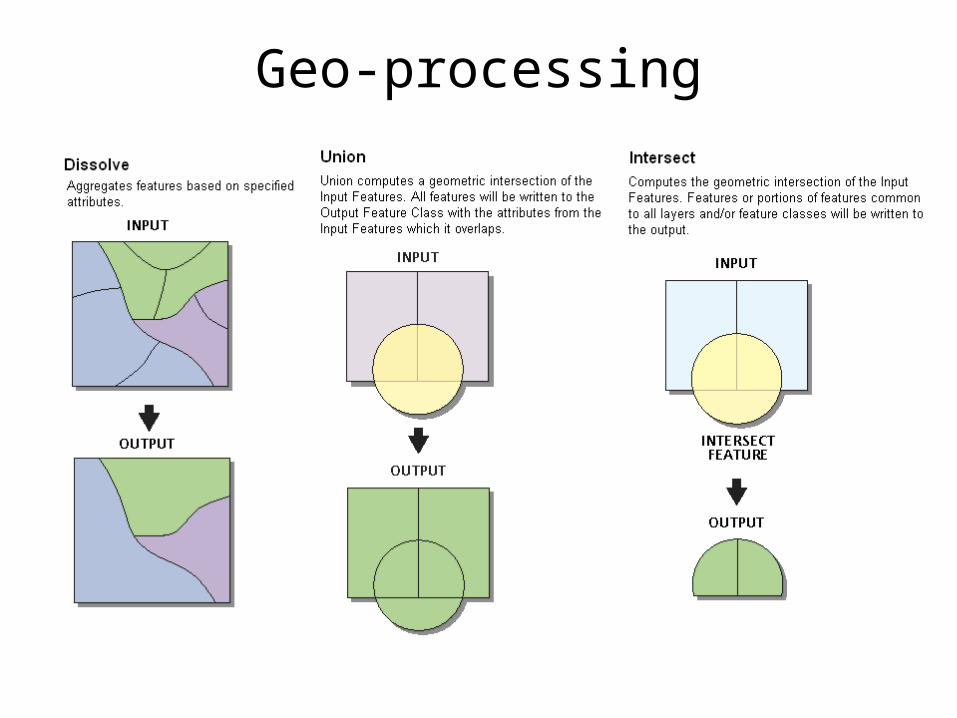
Geo-processing

Surface analysis
• Raster Models– Perform simple algebraic calculations on
raster cells
• Drainage Analysis using DEM– Flow direction, flow accumulation, watershed
delineation

Runoff calculations
Runoff, Q (mm/yr)Precipitation, P
(mm/yr)
P
Q
Cell by cell evaluations of mathematical functionsCell by cell evaluations of mathematical functions
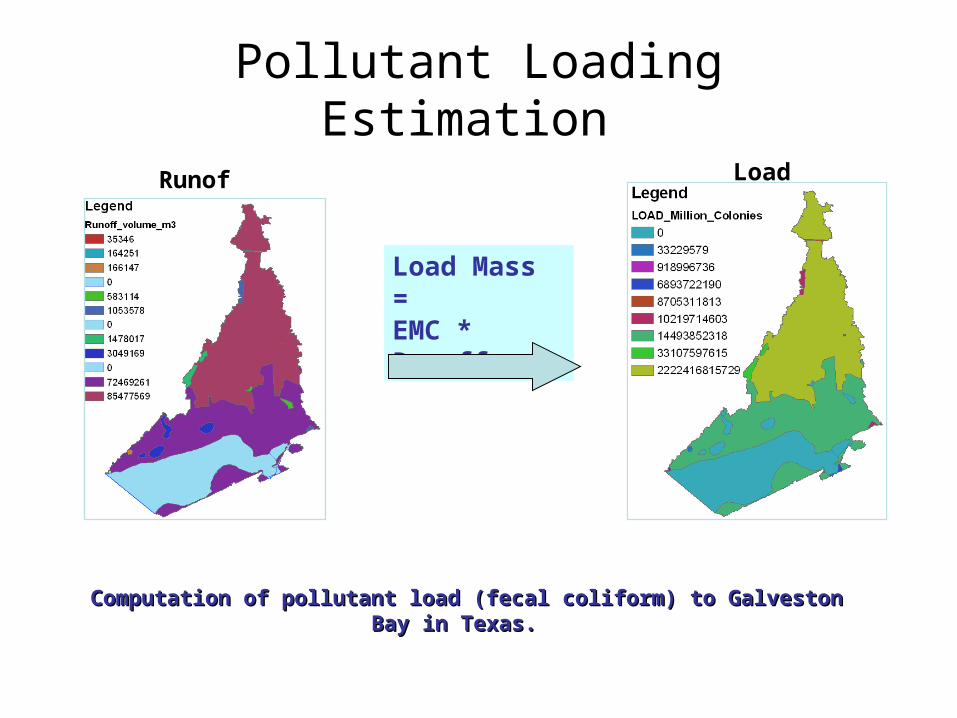
Pollutant Loading Estimation
Load Mass = EMC * Runoff
Runoff Load
Computation of pollutant load (fecal coliform) to Galveston Bay in Texas. Computation of pollutant load (fecal coliform) to Galveston Bay in Texas.

Drainage Analysis
75 77 79 85 92
76 80 73 85 89
72 75 81 83 87
90 85 83 72 82
95 90 89 80 70
32
16
8
64
4
128
1
2
DEM
Eight direction pour point model
Flow Direction Grid Contributing areas and stream definition
Stream Cell
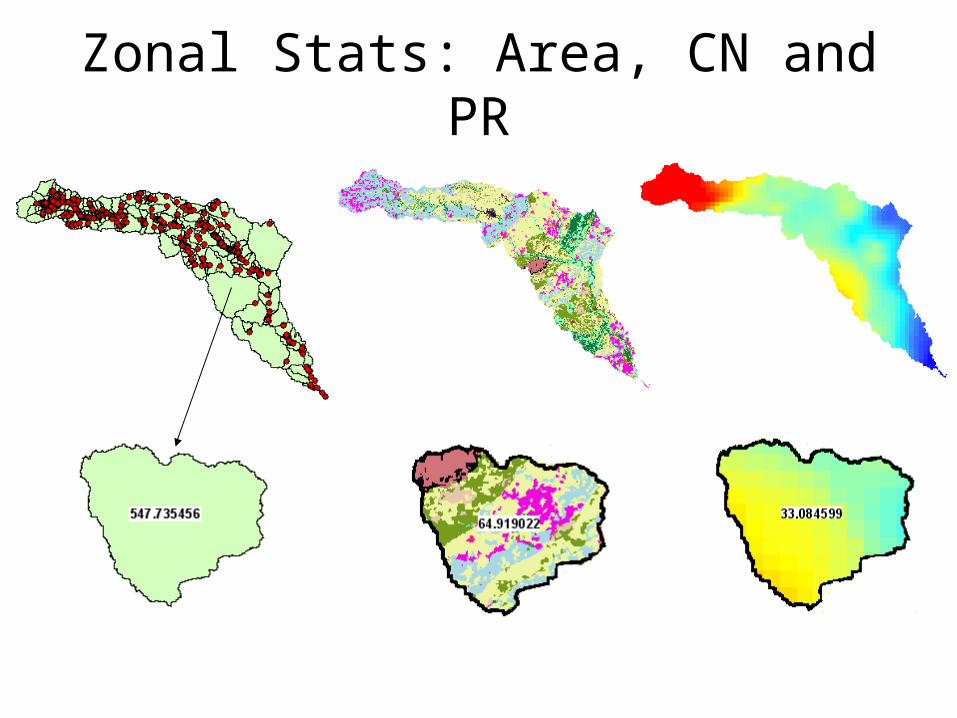
Zonal Stats: Area, CN and PR

Overview
• GIS and data representation
• Geodatabase design
• Vector and surface analysis
• 3D and visualization in GIS
• GIS and Modeling
• Case studies
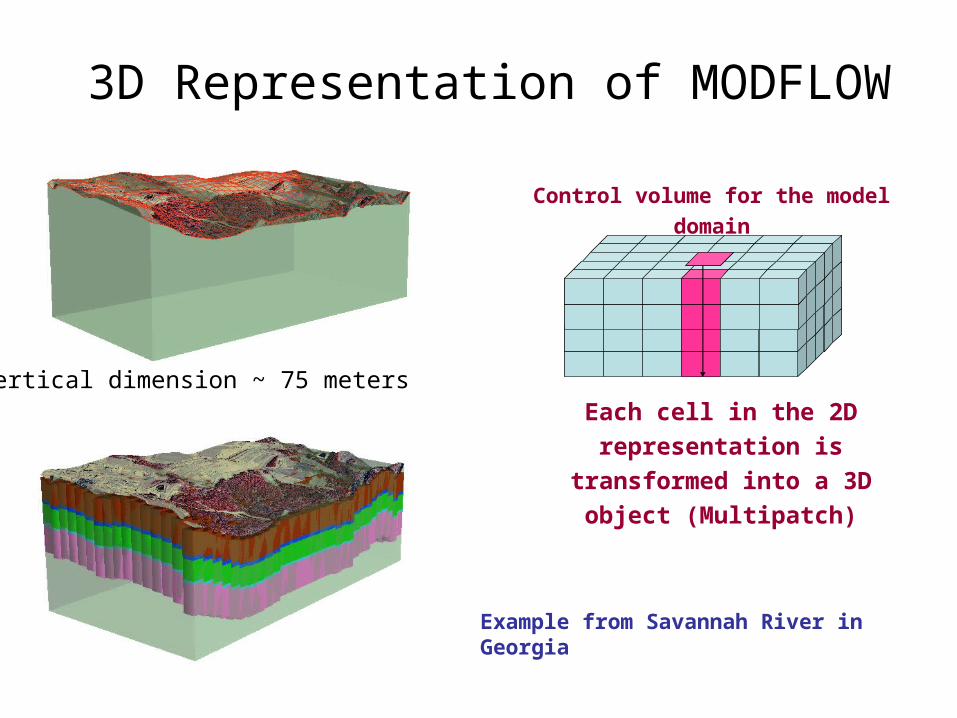
3D Representation of MODFLOW
Vertical dimension ~ 75 meters Each cell in the 2D representation
is transformed into a 3D object
(Multipatch)
Control volume for the model domain
Example from Savannah River in Georgia

3D HydroElement
Rainfall and Streamflow Variations
29 hour duration, 15-minute interval
Tracking Fecal Bacteria in Galveston Bay
Overview
• GIS and data representation
• Geodatabase design
• Vector and surface analysis
• 3D and visualization in GIS
• GIS and Modeling
• Case studies

GIS and Modeling
• Loose coupling – Use GIS to extract input data and display
output– Model runs independent of GIS
• Tight coupling– GIS and model are integrated in one system
(eg. EPA Basins)
• Hydrologic Information Systems– Framework for coupling

Loose Coupling
• HEC-GeoRAS– GIS interface for HEC-
RAS– cross-sections, reaches,
bank-lines in GIS– Creates geometry files– Display Results in GIS
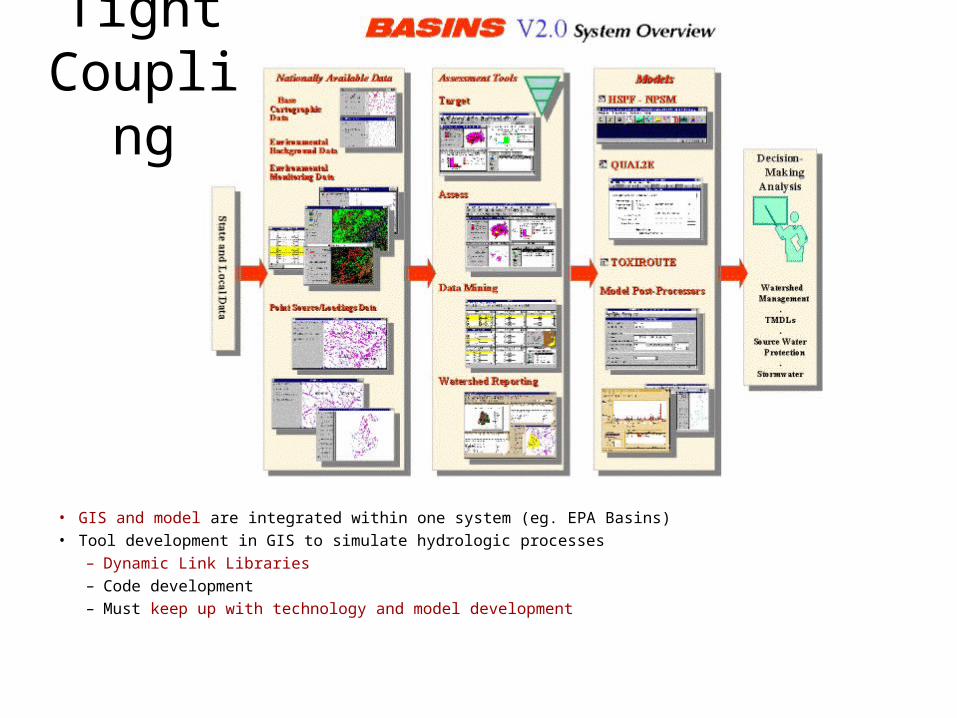
Tight Coupling
• GIS and model are integrated within one system (eg. EPA Basins)• Tool development in GIS to simulate hydrologic processes
– Dynamic Link Libraries– Code development– Must keep up with technology and model development

Hydrologic Information System
Modeling
Geodatabase
A hydrologic information system is a combination of geospatial and temporal hydrologic data with hydrologic models that supports hydrologic practice, science and education

HMSIDM
RASIDM
Interfacedata models
HMS
RAS
GIS
GeoDatabase
Arc Hydrodata model
Connecting Arc Hydro and Hydrologic Models

Model
Process
Process
Process
ProjectData
ProjectData
ProjectData
DerivedData
DerivedData
DerivedData
Tool
Tool
Tool
(a) (c)(b)
ArcGIS Model Builder
Overview
• GIS and data representation
• Geodatabase design
• Vector and surface analysis
• 3D and visualization in GIS
• GIS and Modeling
• Case studies
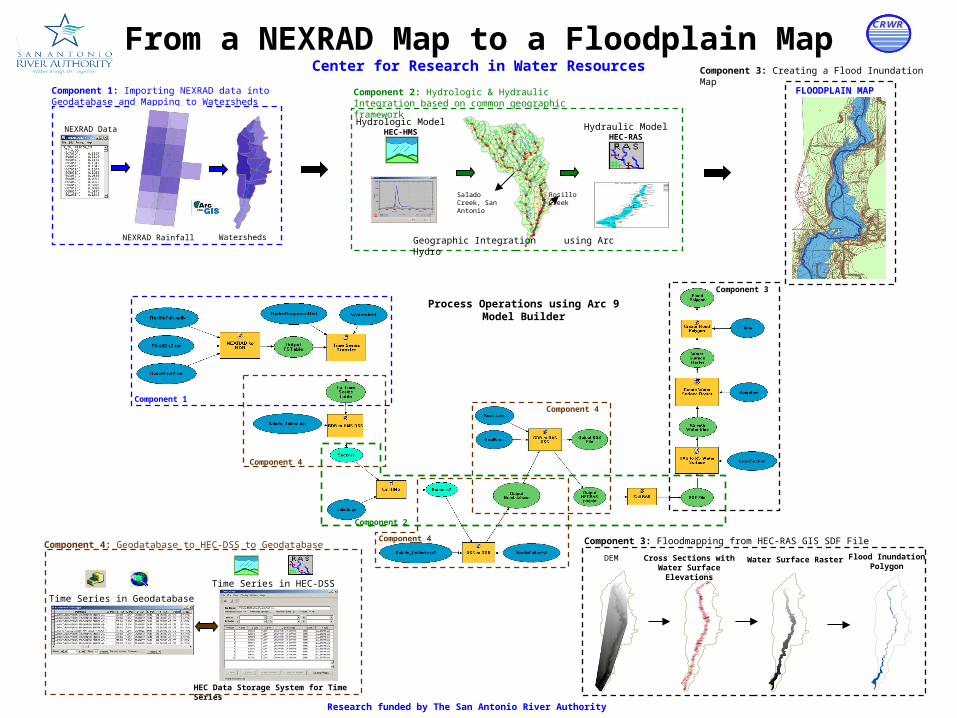
From a NEXRAD Map to a Floodplain MapCenter for Research in Water Resources
Component 2
Component 4
Component 1
Component 4
Component 3
Component 3: Floodmapping from HEC-RAS GIS SDF File
DEM Cross Sections with Water Surface Elevations
Water Surface Raster Flood Inundation Polygon
Component 2: Hydrologic & Hydraulic Integration based on common geographic framework
Hydrologic ModelHEC-HMS
Hydraulic ModelHEC-RAS
Geographic Integration using Arc HydroWatersheds
Component 1: Importing NEXRAD data into Geodatabase and Mapping to Watersheds
NEXRAD Data
Component 4: Geodatabase to HEC-DSS to Geodatabase
Time Series in Geodatabase
Time Series in HEC-DSS
HEC Data Storage System for Time Series
FLOODPLAIN MAP
Component 4
NEXRAD Rainfall
Salado Creek, San Antonio
Rosillo Creek
Component 3: Creating a Flood Inundation Map
Process Operations using Arc 9 Model Builder
CRWRCRWRCRWR
Research funded by The San Antonio River Authority

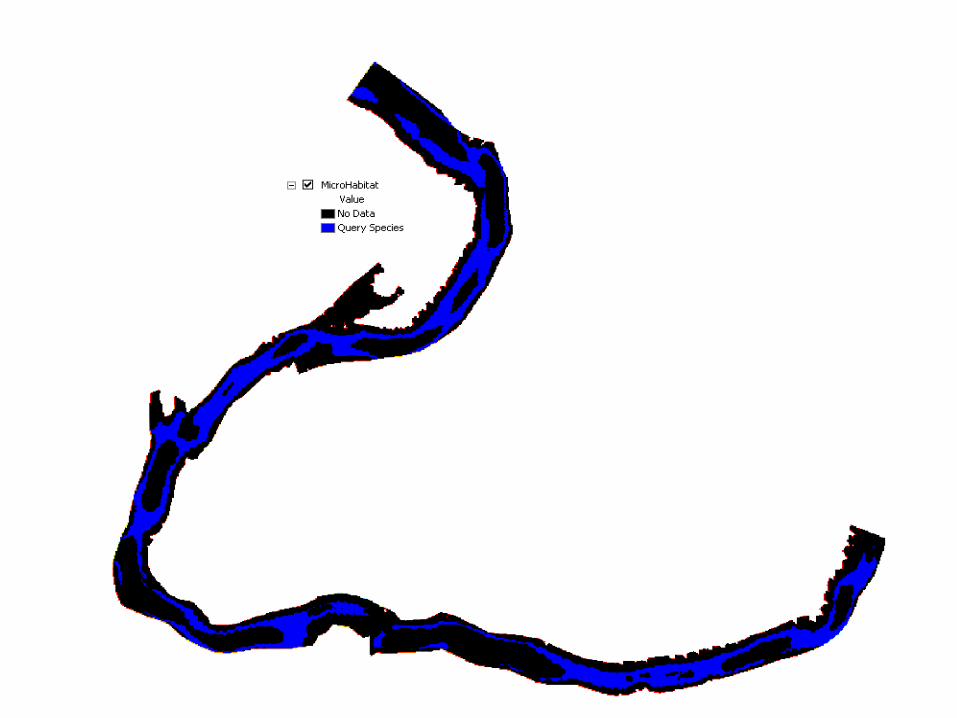
Fish Habitat Modeling
Instream Flow
Decision Making
Hydrodynamic
Model
Habitat
Descriptions
Habitat
Model
GISRMA2 Biological
Sampling
Depth & velocity
Species groups
Criterion

Hydraulic and Biological Data
Bathymetry Points
Attribute Table
Habitat Descriptions
Summary
• GIS can be used to store and visualize any type of data (geospatial and temporal)
• Geodatabase Model for storing Data• Vector and surface analysis in GIS help
accomplish data processing, parameter extraction and simple calculations
• Hydrologic Information Systems provides a way to integrate simulation models with GIS using a standard protocol
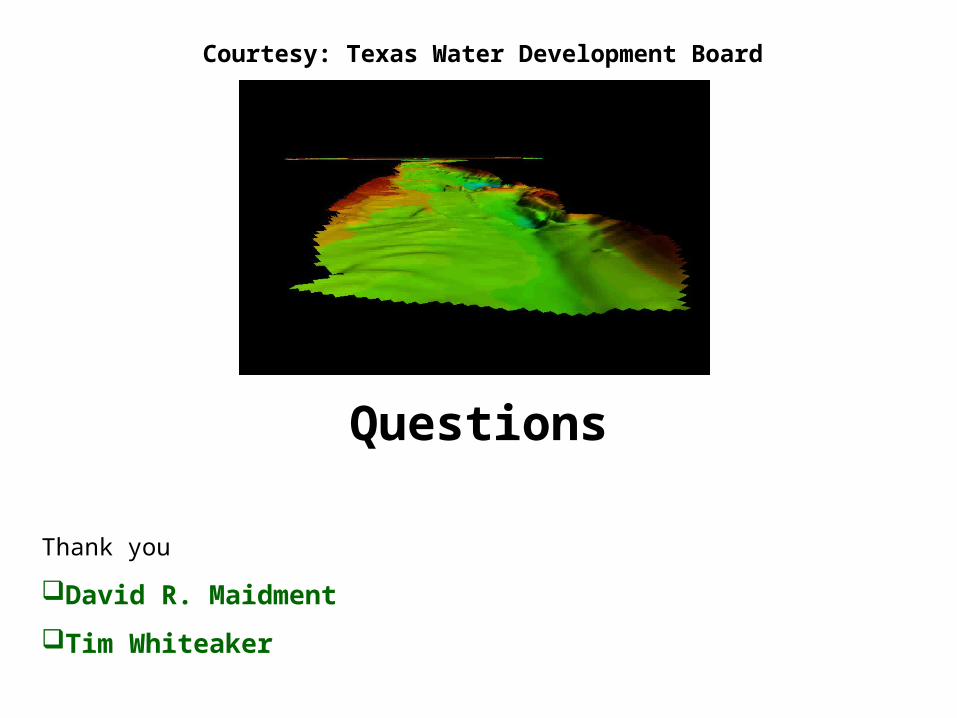
Questions
Courtesy: Texas Water Development Board
David R. Maidment
Tim Whiteaker
Thank you