gis workflow · 2012-05-01 · 1.the functional elements of gis ... it is said to be 2d gis. 2.5 d...
TRANSCRIPT

GIS workflow
m.j.ratnakanth babu

GIS WORK FLOW There are five essential elements that a GIS must contain They are •Data acquisition •Preprocessing it includes\ i. Format conversion, ii. data reduction and generalisation, iii. error detection and editing, iv. Merging of points into lines and lines into polygons, v. edge matching and tiling, vi. RectificationRegistration, vii. interpolation, viii. and Interpretation. •Data management •Manipulation •Analysis and Product generation.

The functions of database management govern the creation of an access to the database Itself. These functions provide consistent methods for Data entry, update deletion and retrieval. The list of manipulation analysis operations are •Reclassification and aggregation •Geometric operations as rotation translation and scaling\ •Rectification and registration •Controlled determination •Data structure conversion •Spatial operations of connectivity and neighbourhood operations •Measurement of distance and direction •Statistical analysis as descriptive statistics regression\ •Correlation and cross tabulation •Modelling.

Manipulation and analysis
Output and reporting
Storage and retrieval
Collection, input and correction
Database management systems
OUTPUT
WORKFLOW PROCESS IN GIS

THEORETICAL MODELS OF GIS These may be considered in two main groups 1.The functional elements of gis 2.The fundamental operations of gis •Problem processor model •Database model •Interface model FUNCTIONAL ELEMENTS OF GIS There were 4 functional elements to address the gis technology. They are Database approach-it stresses the ability of the underlying data structure to contain Complex geographic data Process oriented approach-focuses on the sequence of system elements used by an Analyst running an application Application oriented approach-it defines gis based on the kinds of information manipulated By the system and the utility of the derived information produced by the system Toolbox approach-emphasizes as the software components and algorithms.

FUNDAMENTAL OPERATIONS OF GIS The approach considers the functions which GIS is able to perform. They are classified as •Map algebra-which context the primitive operations of map analysis •Reclassification •Overlay •Distance connectivity measurement •Neighbourhood charecterisation of data These can be identified as Reclassification operations transform the attribute information associated with A single map coverage. Overlay operations involve the combination of two or more maps according to boolean conditions and may result in the delineation of new boundaries. Distance and connectivity measurement include both simple measure of inter Point distance and more complex operations such as the construction of zones Of increasing transport cost away from specified location Neighbourhood charecterization involves the values to a location both summary and Mean measures of variable, and include smoothing and enhancement filters, such as Manipulation operations have become known as cartographic modelling.

THEORITICAL FRAME WORK OF GIS
REAL WORLD
RAW DATA
MAP MAP
IMAGE
DATA COLLECTION DATA INPUT DATA DISPLAY
T1 T2 T3
T1- First transformation data is selected from the real world
T2- data inputting for the GIS to provide the basis for its digital map representation
T3- Manipulation and display of results.

GIS CATEGORIES
For more than 2 decades the GIS applications were dominated by the Map Geometry. That is GIS data with only x, y , coordinates… it is said to be 2D GIS. 2.5 D GIS- The two dimensional x-y geometry integrate with the third dimension Using the normal case DTM for the height is referred to be 2.5 D GIS 3D GIS-is difficult for handling and need more complex algorithms 4D GIS- temporal GIS

LEVELS/ SCALES OF MEASUREMENT

The 4 commonly referred levels of measurement are 1.Nominal scale-are those in which variables described by a name with no specific order Ex: landuse, parks, residential areas etc These are named data. The system allow us to make statements about what to call the objects, but it Does not allow direct comparisons between one named object and another. 2.Ordinal scale: are those variables which are lists in discrete classes but with an inherent order Ex: classes of streams, 1st order, 2nd order etc 3. Interval scale: the numbers are assigned to the items measured 4.Ratio scale: they are same as interval scale but they have natural zero or a starting point; Ex: rainfall per month etc. Data unit of measurement scale/level Hotel name text nominal Status of hotel three star ordinal Average tariff in rupees interval Size of hotel m2 Ratio

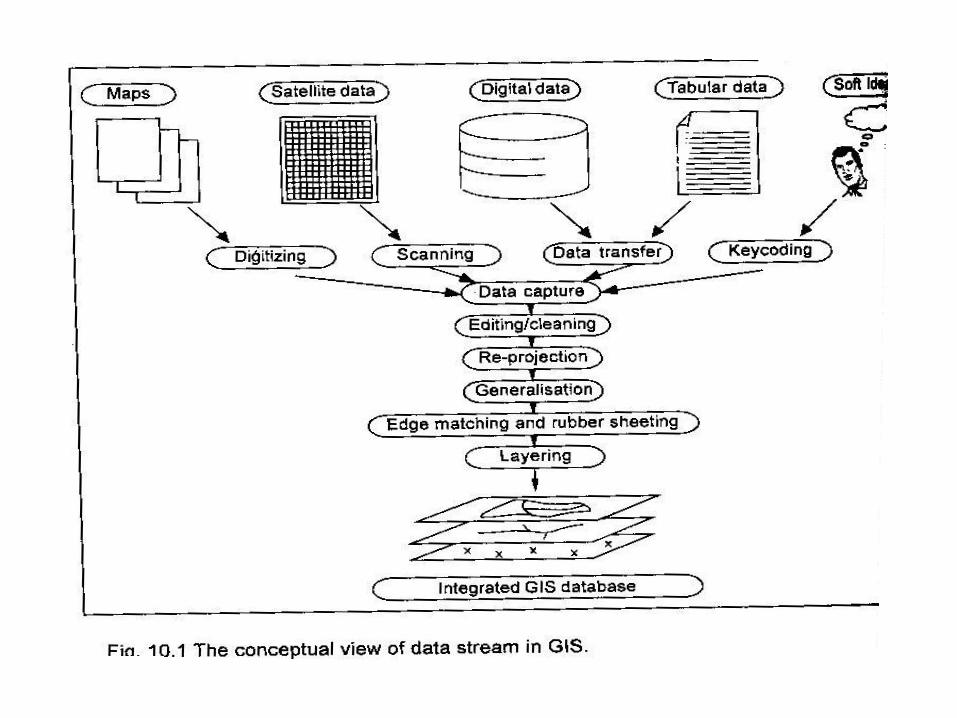
Data stream:
The data to be input for GIS are typically accquired in a diverse variety of forms.
They include
Maps
Photographs Records from site visits
Non spatial information
Digital data
Etc

Data types and their source in India
DATA INPUT, DATA EDITING AND DATA QUALITY
• It is necessary to make a distinction between analogue (non-digital) and digital sources of spatial data.
• Analogue data are normally in paper form and include paper maps, tables of statistics and hardcopy aerial photographs.
– All these forms of data need to be converted to digital form before use in a GIS.
– All data in analogue form need to be converted to digital form before they can be input into GIS.
• Digital data like remote sensing data are already in compute-readable formats and are supplied on diskette, magnetic tape or CD-ROM or across a computer network.
• There are four methods of data input which are widely used:
• keyboard entry,
• manual digitisation,
• automatic digitisation, and
• scanning.
• Digital data must be downloaded from their source media and may require reformatting to convert them to an appropriate format for the GIS being used.
• Reformatting or conversion may also be required after analogue data have been converted to digital form.
• For example, after scanning a paper map, the file produced by the scanning equipment may not be compatible with the GIS, so it needs reformatting.
• For both the analogue and digital data, keyboard entry method, manual digitising and automatic digitising and scanning methods are very important .

KEYBOARD ENTRY • Keyboard entry, often referred to as keycoding, is the entry data into a file at a
computer terminal.
• This technique is used for attribute data that are available only on paper.
• This technique can be mixed with digitising process for the creation of GIS
database as for different applications.
• The attribute data, once in digital format, are linked to the relevant map features in
the spatial database using identification codes.
• There are unique codes that are allocated to each point, line and area feature in the
dataset.

• The coordinates of spatial entities like point, line and area features can be encoded by
keyboard entry.
• This method is used when the coordinates of these spatial entities are known and there are not
too many of them.
• If the coordinates are more in number, this data can be encoded using digitising.
•
• The procedure of keyboard entry can be used to enter land record information etc.
• This method leads to obtain very high level of precision data by entering the actual surveying
measurements.

Manual Digitising
• Manual digitising is the most common method of encoding spatial features from paper maps.
• It is a process of converting the spatial features on a map into a digital format. Point, line, and area features that form a map, are converted into (x, y) coordinates.
• A point is represented by a single coordinate – A line by a string of coordinates, – when one or more lines are combined with a label point inside an outline, then an area
(polygon) is identified.
• Thus digitising is the process of capturing a series of points and lines ie. Process of making a vector layer comprised of shape files either point , polyline or polygon
• Points are used for two different purposes: to represent point features or to
identify the presence of a polygon. • Manual digitising requires a table digitiser that is linked to a computer

Digitisers
• Digitisers are the most common device for extracting spatial information from maps and photographs.
• The position of an indicator as it is moved over the surface of the digitising tablet is detected by the computer and interpreted as pairs of x, y coordinates.
• The indicator may be a pen-like stylus or a cursor.
• Frequently, there are control buttons on the cursor which permit control of the system without having to turn attention from the digitising tablet to a computer terminal.
• The current most popular digitiser is contemporary tablets using a gird of wires embedded in the tablet to a generate magnetic field which is detected by the cursor.
• The accuracy of such tables are typically better than 0.1mm which is better than the accuracy with which the average operator can position the cursor.
• • Sometimes the functions for transforming coordinates are built into the tablet and used to process
data before it is sent to the host
Stages of GIS Data Modeling The construction of models of spatial form can be taken as a series of stages Of data abstraction. By applying this abstraction process the GIS engineer moves from the position of observing the geographical complexities of the real world to one of Simulating them in the computer. This process involves •Identifying the spatial features from the real world that are of interest in the Context of an application
•Representing the conceptual model by an appropriate spatial data model. This involves choosing between one of the two approaches: rater to vector.
•Selecting an appropriate spatial data structure to store the model within the Computer.
•The spatial data structure is the physical way in which entities' are Coded for the purpose of storage and manipulation.


A surface entity is used to represent continuous features or phenomena. For these features these is a measurement or value at every location, as in the Case of elevation, temparature etc. A network is a series of interconnecting lines along which these is a flow of data Objects or materials. Ex the road network. The two fundamental methods of representing geographical entites are Raster method Vector method.
Graphic representation of spatial data: An entity is the element in reality. It is a phenomenon of interest in reality.

Graphic representation of spatial data:

Maps as Numbers
• GIS requires that both data and maps be represented as numbers.
• The GIS places data into the computer’s memory in a physical data structure (i.e. files and directories).
• Files can be written in binary or as ASCII text.
• Binary is faster to read and smaller, ASCII can be read by humans and edited but uses more space.

The Data Model
• A logical data model is how data are organized for use by the GIS.
• GISs have traditionally used either raster or vector for maps.

Two approaches to handling spatial data with GIS:
• Raster model
• Vector model
– Points,
– lines,
– polygons
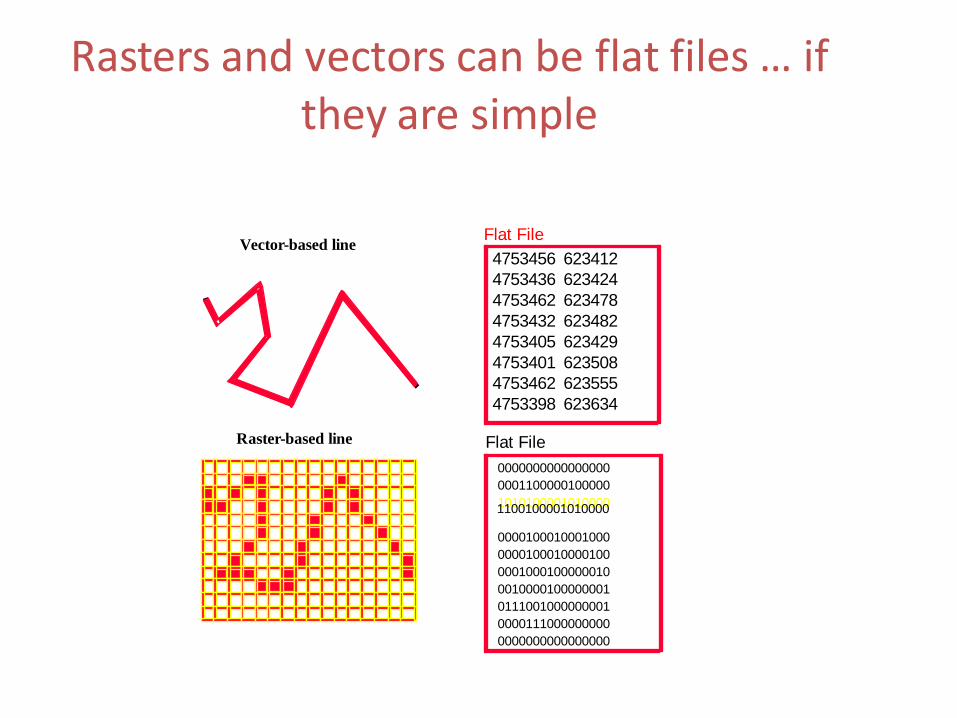
Rasters and vectors can be flat files … if they are simple
Vector-based line
Raster-based line
4753456 623412
4753436 623424
4753462 623478
4753432 623482
4753405 623429
4753401 623508
4753462 623555
4753398 623634
0000000000000000
0001100000100000
1010100001010000 1100100001010000
0000100010001000
0000100010000100
0001000100000010
0010000100000001
0111001000000001
0000111000000000
0000000000000000
Flat File
Flat File

Raster data models

Introduction
• Vector – discrete
• Raster – continuous
• Continuous
– precipitation
– elevation
– soil erosion
• Regular grid cell with value to correspond to the characteristics of the phenomenon

Raster Data Structure, Compression, and Files
• Data Structure – Cell-by-cell encoding
– Band interleaved (.bil)
– Band sequential (.bsq)
– Band interleaved by pixel (.bip)
– Run-length encoding (.rle
– Chain code
– Block code
– Quadtree
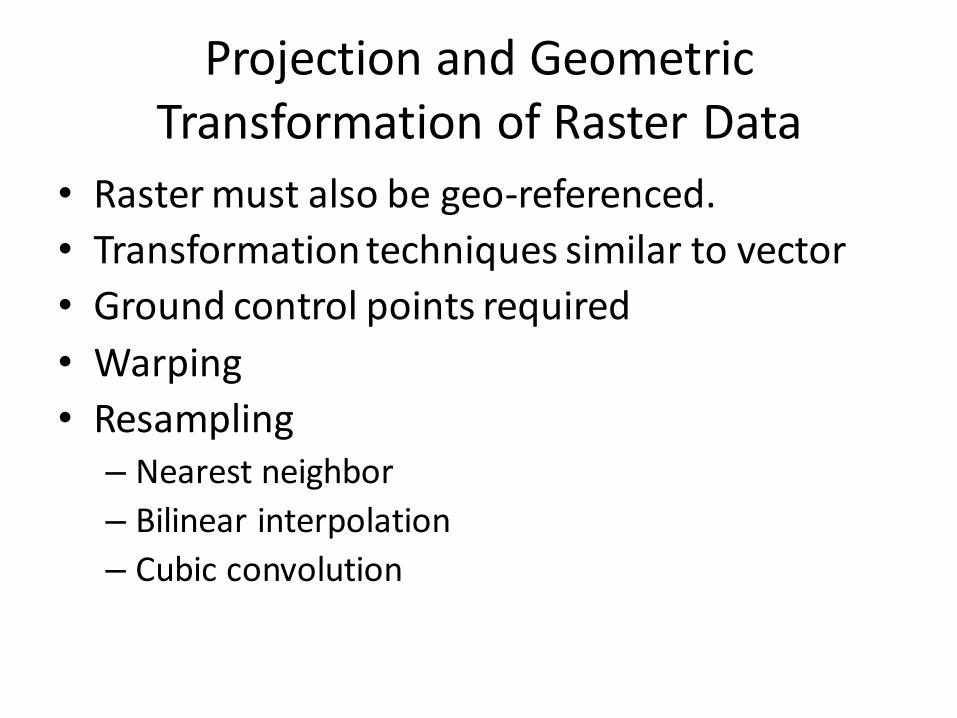
Projection and Geometric Transformation of Raster Data
• Raster must also be geo-referenced.
• Transformation techniques similar to vector
• Ground control points required
• Warping
• Resampling – Nearest neighbor
– Bilinear interpolation
– Cubic convolution

A raster data model uses a grid.
• One grid cell is one unit or holds one attribute.
• Every cell has a value, even if it is “missing.”
• A cell can hold a number or an index value standing for an attribute.
• A cell has a resolution, given as the cell size in ground units.
Raster GIS Models The simplest approach of structuring spatial data is to use grid cells to represent Quantized portion of the earth which is called GRID based GIS or Raster GIS. The grid based GIS spatial data can be stored, manipulated, analyzed and referenced Basically in any one of the 3 methods/ models. They are •GRID/LUNAR/MAGI MODEL •IMGRID MODEL •MAP MODEL

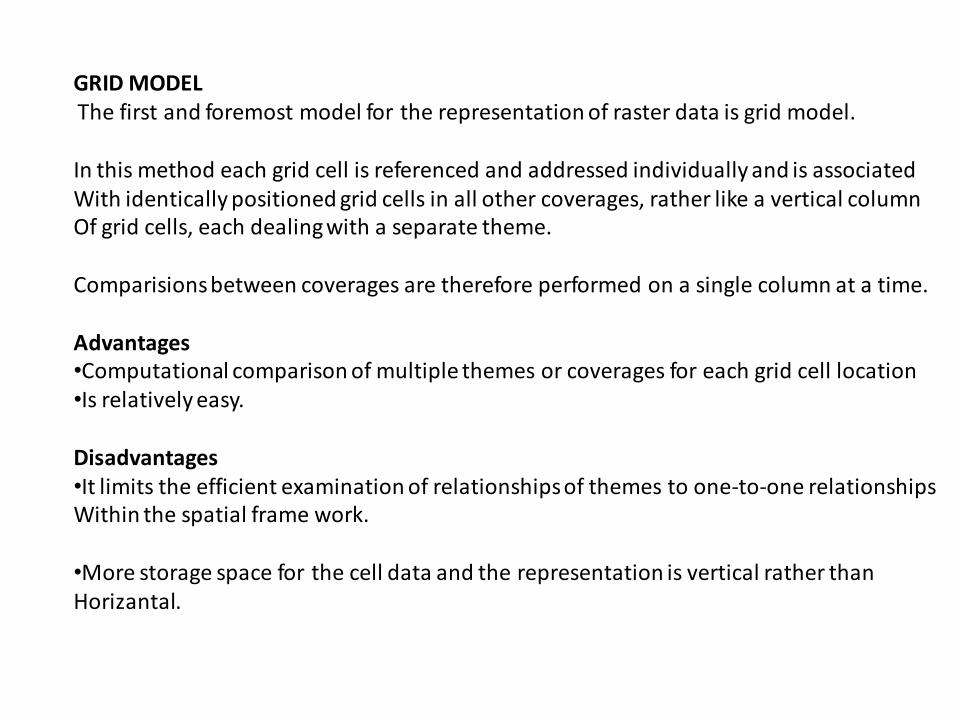
GRID MODEL The first and foremost model for the representation of raster data is grid model. In this method each grid cell is referenced and addressed individually and is associated With identically positioned grid cells in all other coverages, rather like a vertical column Of grid cells, each dealing with a separate theme. Comparisions between coverages are therefore performed on a single column at a time. Advantages •Computational comparison of multiple themes or coverages for each grid cell location •Is relatively easy. Disadvantages •It limits the efficient examination of relationships of themes to one-to-one relationships Within the spatial frame work. •More storage space for the cell data and the representation is vertical rather than Horizantal.

IMGRID MODEL This model is has advantages over the GRID model Advantages: Data will be in a contiguous objects We can reduce the numbers that must be contained in each coverage to 0’s and 1’s. MAP MODEL The third raster GIS model is MAP ANALYSIS PACKAGE (MAP) It is developed by C.Dana Tomlin It integrates the advantages of the above two raster data structures. In this each thematic coverage is recorded and accessed separately by map, name or title This is accomplished by recording each variable or mapping unit, of the coverages as a Separate number code or label which can be accessed individually when the coverage is Retrieved . It is compatible in almost all computer systems.

Sources of Raster Data
• Satellite data
– LANDSAT
– SPOT
• Scanned aerial photography
• Digital Orthophotography
• Scanned maps and documents
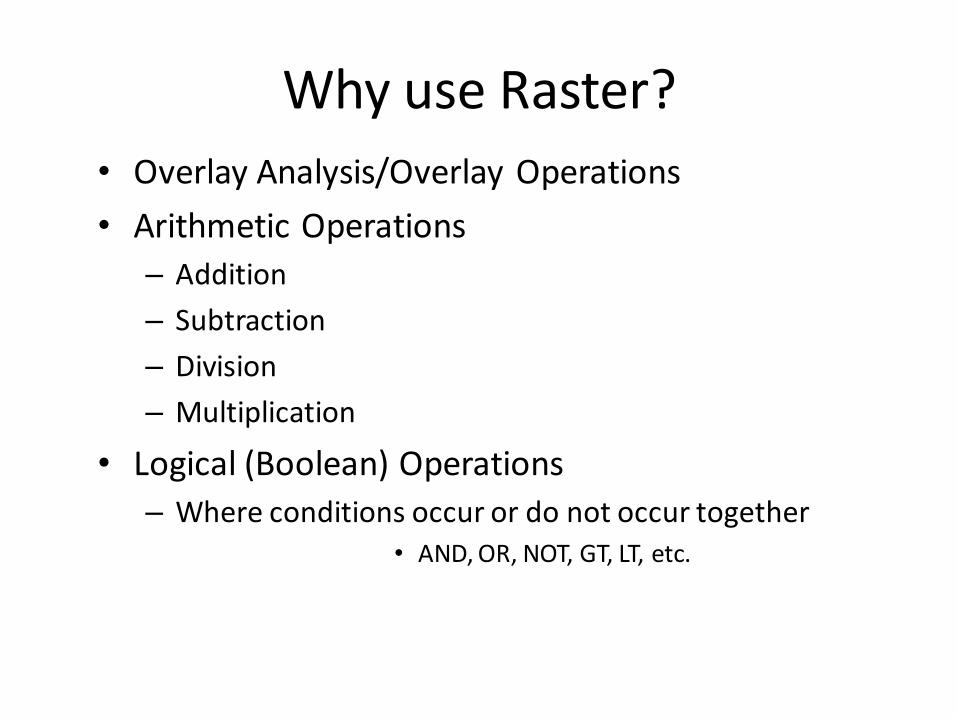
Why use Raster?
• Overlay Analysis/Overlay Operations
• Arithmetic Operations
– Addition
– Subtraction
– Division
– Multiplication
• Logical (Boolean) Operations
– Where conditions occur or do not occur together • AND, OR, NOT, GT, LT, etc.

Raster GIS Applications
• Integrate images to georeferenced data
– i.e., parcel deed image linked to parcel centroid
• Document Imaging
• Natural Resource applications where:
– Positional accuracy relaxed
– Imagery-oriented

Raster Applications
• Utility Corridor Siting
• Environmental Mapping
• Natural Communities Mapping
• Forest resource planning
• Spatial data variability decisions
• Forest inventory
• Wildlife habitat analysis

More Raster Applications
• Wetlands Vegetation Inventory & Analysis
• Agricultural analysis
• Planetary analysis (including lunar)
• Vector Updating
• Digital Terrain Modeling
• Flood Control & Emergency Preparedness
• Communication System Engineering

Raster Limitations
• Data storage requirements
• Overlay operations performed on every cell
• Sparse data sets require as much processing as dense ones

The Vector Model
• A vector data model uses points stored by their real (earth) coordinates and so requires a precise coordinate system.
• Geographic Coordinate System – Latitude/Longitude
• Cartesian Coordinate Systems – X,Y Coordinate system
– State Plane
– UTM (Universal Transverse Mercator)
• Lines and areas are built from sequences of points in order.
• Lines have a direction to the ordering of the points.
• Polygons can be built from points or lines.
• Vectors can store information about topology.

Vector GIS Data Model
• Precisely position features in space
– Points, Nodes, vertex, single X,Y coordinate pair
– Lines, Arcs, series of X,Y coordinate pairs
– Area, Polygons, area as a closed loop of X,Y coordinate pairs

point
zero-dimensional abstraction of an object
represented by a single X,Y co-ordinate.
normally represents a geographic feature too small
to be displayed as a line or area
stored by their real (earth) coordinates

line
set of ordered co-ordinates that represent the shape
of geographic features too narrow to be displayed
as an area at the given scale or linear features with
no area
lines and areas are built from sequences of points in
order.
lines have a direction to the ordering of the points.

polygon
feature used to represent areas.
defined by the lines that make up its boundary and a
point inside its boundary for identification.
have attributes that describe the geographic feature they
represent.

Areas are lines are points are coordinates

Dimensionality and property 0 dimensional objects • Point: geometric location with a set of coordinates • Node: topological junction 1 dimensional objects • Line segment (vector): a direct line between two points having length • Link: direct connection between two nodes directed link • String: sequence of line segments • Chain: directed sequence of nonintersecting line segments with nodes at each end • Arc: curve string • Ring: sequence of any line segments with closure 2 dimensional objects • Simple polygon: an area defined by an outer ring without inner rings • Complex polygon: an area defined by an outer ring with inner rings

Vector data structures allow the representation of geographical space in an Intuitive way reminiscent of the familiar analog map. Point; is the simplest spatial entity that can be represented in the vector world With topology. Two vector models Spaghetti model Topological model Spaghetti model The simplest vector data structure that can be used to reproduce a geographical Image in the computer is a file containing x, y, coordinate pairs that represent The location of individual point features.

Spaghetti Data Model •Viewed as raw digital data
•One-for-one translation of the analog map
•Each entity is a single record coded as x, y
•Coordinates
•No details of logical relationships between objects
• the line shared by two adjacent polygons is recorded separately in the
computer
• spatial relationships are only implied
•Efficient for cartographic display
•At first, GIS used vector data and cartographic
•spaghetti structures


Topological Model
• Topology: mathematical method to define spatial relationships
• The topological vector model uses the line (arc) as a basic unit. Areas (polygons) are built up from arcs.
• The endpoint of a line (arc) is called a node. Arc junctions are only at nodes.
• Stored with the arc is the topology (i.e. the connecting arcs and left and right polygons).


relationship between nodes, arcs and polygons.
ttopologically structured database for ease of retrieval and
implementation of spatial-relational operations.
advantages:
simple, elegant and efficient
relational database construction and analysis
complete topology makes map overlay feasible.
topology allows many GIS operations to be done without
accessing the point files.

Topological Data Spatial Operations
• Contiguity: spatial relationship of adjacency
– i.e., stand of coniferous trees adjacent to deciduous trees
• Connectivity: interconnected pathways or networks
– i.e., street and trail networks, stream networks

Sources of Vector Data
• RASTER-VECTOR conversions from scanned images
• Pre-existing digital data from disks or internet
• DIGITIZING
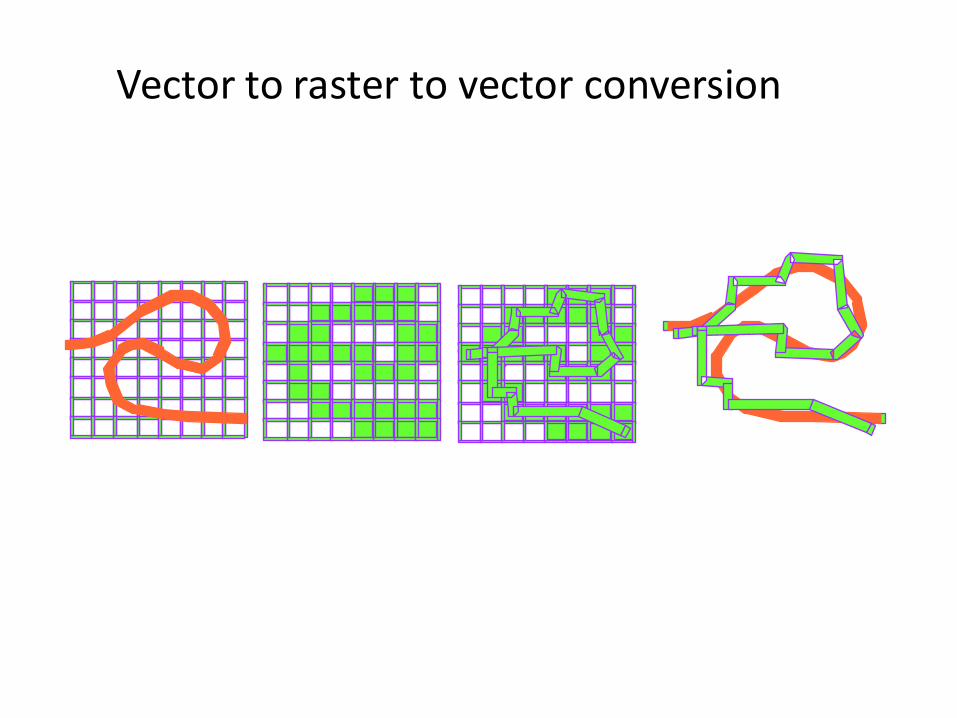
Vector to raster to vector conversion

Data Editing The process of detecting and removing the errors through editing is called Cleaning. Errors can be categorized into 3 groups •Entity errors •Attribute errors •Entity-attribute errors.
These errors can be rectified using the following methods 1.Detecting and correcting errors 2.Data reduction and generalization 3.Edge matching and rubber sheeting.

• If the map has stretched or shrunk in the interim, the newly digitised points will be slightly off in their location when compared to previously digitised points.
• Errors occur on these maps, and these errors are entered into the GIS data base as well.
• The level of error in the GIS database is directly related to the error level of the source maps.
• Maps are meant to display information, and do not always accurately record information.
• For example, when a train, a stream and a road all go through a narrow mountain pass, the pass may actually be depicted wider than its actual size to allow for the three symbols to be drafted in the pass

Common errors in GIS database
Missing entities
missing points, lines or boundary segments
Duplicate entities points, lines or boundary segments that have been digitised twice
Mislocated entities
points, lines or boundary segments digitised in wrong place.
Mislocated labels unidentified polygons
Duplicate labels
two or more identification labels for the same polygon.
Artifacts of digitising undershoots, overshoots, wrongly placed nodes, loops and spikes
Noise
Irrelevant data entered during digitising, scanning or data transfer.

Overshoots, undershoots and spikes
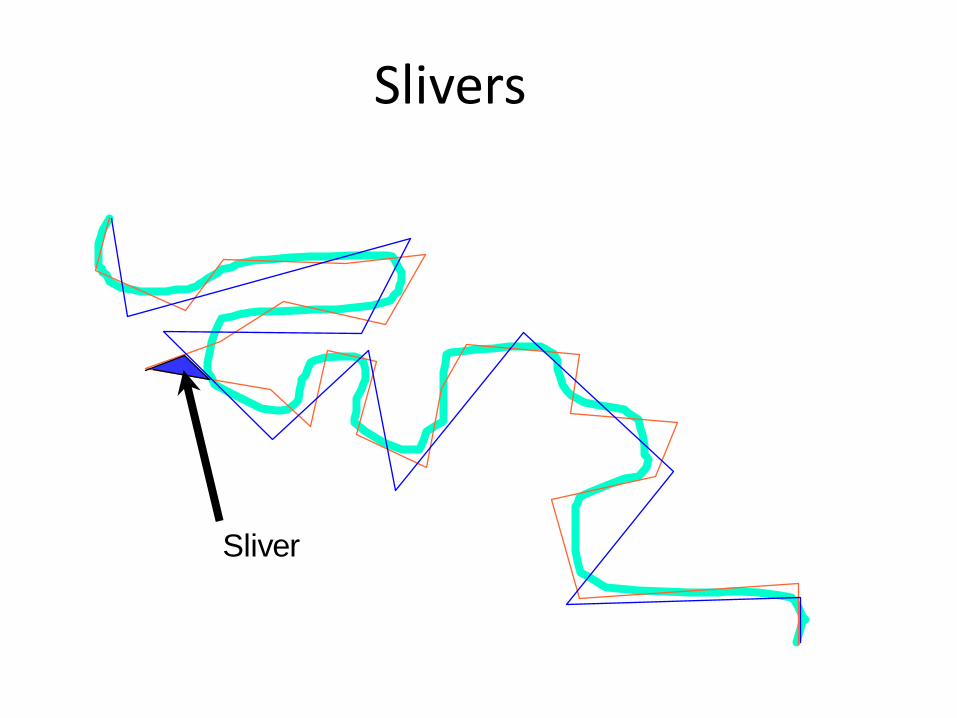
Slivers
Sliver

Unsnapped node
Edge matching
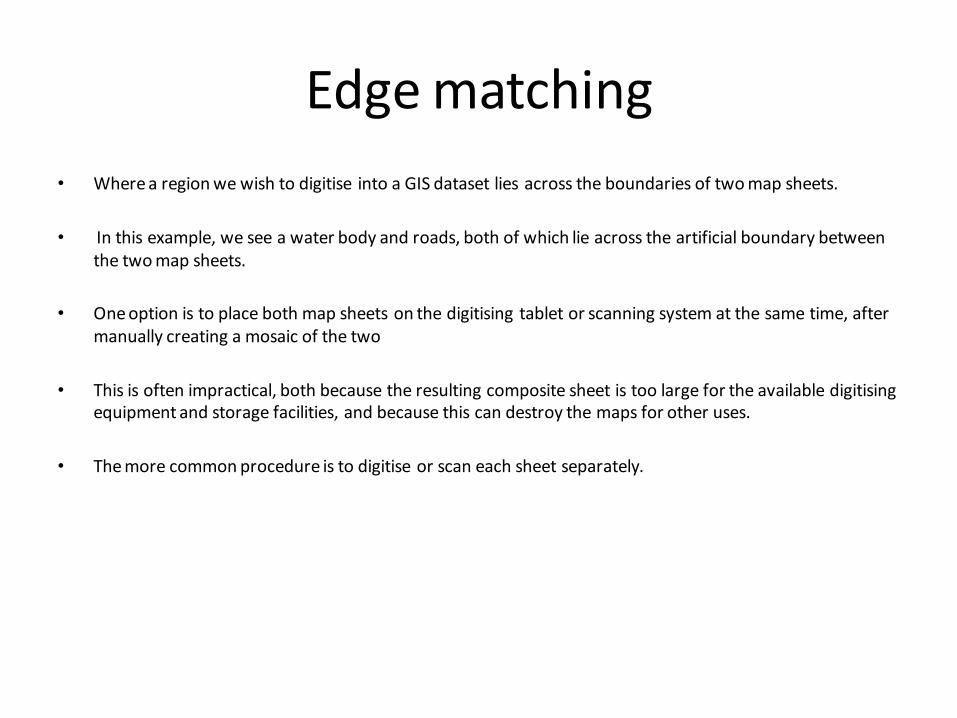
• Where a region we wish to digitise into a GIS dataset lies across the boundaries of two map sheets.
• In this example, we see a water body and roads, both of which lie across the artificial boundary between the two map sheets.
• One option is to place both map sheets on the digitising tablet or scanning system at the same time, after manually creating a mosaic of the two
• This is often impractical, both because the resulting composite sheet is too large for the available digitising equipment and storage facilities, and because this can destroy the maps for other uses.
• The more common procedure is to digitise or scan each sheet separately.

• Frequently, when the two map sheets are digitised or scanned separately, features that cross the boundary do not align properly.
• This distortion can come from several causes. – Even when maps are printed with no discernible error, the physical size of the map can change with
temperature and humidity, and this can be a significant problem with maps printed on paper.
– Errors at the margins can also be caused by georeferencing errors during the digitising process, extrapolations and numerical round-off errors in the georeferencing algorithms, accuracy errors in the digitising tablet itself caused by overlapping map coverage

Sheet A
Sheet B Sheet A Sheet B
There are two families of adjustments to correct these errors at the edges
between map sheets or between different digital data files.
We manually had to adjusts the locations of points and vectors to maintain the
continuity of the dataset.
We i.e analyst have to manually adjust vectors that cross the boundary
Another way of adjustments way for reducing the edge effects / errors due to
edge discrepencies is to firstly match Line attributes and the spatial distribution of the lines on either side of the boundary
Rubber sheeting
• Certain data sources may give rise to internal distortion within individual map sheets.
•
• This is especially true of data derived from aerial photographs as the movement of the aircraft and the distortion caused by the camera lens can cause internal inaccuracies in the location of features within the image.
• These inaccuracies remain even after transformation and reprojection.
• These problems can be rectified through a process known as rubber sheeting or conflation.

• Rubber sheeting involves stretching the map in various directions as if it were drawn on a rubber sheet.
• Objects on the map that are accurately placed are tacked down and kept still while others that are in the wrong location or have wrong shape are stretched to fit with the control points, which are known points identified on the ground and on the image.
• The coordinates of these control points may be determined from field observation using GPS.
Rubber sheeting

Components of data quality
• Accuracy
– Inverse of error is accuracy
– Relative measure rather than a absolute term
Spatial accuracy/positional accuracy Accuracy of Spatial component of a database
• Applies to horizontal and vertical position
• Error in X, Y, Z
• RMSE is commonly used
Temporal accuracy Data is uptodate
Databases of Historical purposes often omits Temporal accuracy

Attribute accuracy Ground truthing required
Conceptual accuracy User determine what amount of information is used and how it is classified into
appropriate categories
Sometimes users may misclassify information
Eg. Classifying stream network by order for drainage studies by user
Individual stream/channel may be misclassified if its tributaries are miscounted

Precision and Resolution Spatial Resolution- learnt in UNIT I
Temporal Resolution- Minimum duration of an event that is occured
Thematic Resolution- depends on measurement of scale i.e. quantitative data- precision in measurement device
For categorical data , resoultion is defined in terms of fineness of categorical definitions
Consistency- absence of contradictions Only one point may exist at a given location
Lines must intersect at nodes
Polygons are bounded by lines

• Completeness- relationship between objects in database
– Entity or feature Completeness • Eg if location of historical monuments to be entered in register
database of tourism deptt. 1997
• Incomplete if it includes only building
– Time Completeness • Eg. Incomplete when new buildings added after that time 1990

Sources of error in GIS • Obvious sources of error
– Age of data
– Areal coverage
– Map Scale
– Density of observations
– Relevance
– Format
– Accessibilty
• Errors resulting from natural variations or from original measurements
– Positional accuracy
– Accuracy of content
– Qualitative and Quantitative
– Variation in data
– Natural variation
– Data entry/ output faults

• Error through through processing
– Numerical error in computer
– Faults due to topological analyses
– Misuse of logic
– problem associated with map overlay
– Classification and generalisation problems
– Interpolation
Errors through processing is difficult to identify because they require knowledge of not only the data but also the data structures and the algorithm

Spaghetti model Topological model
Very simple and easy to understand
No spatial relationships retained
Lines between adjacent areas must bedigitised and stored twice
More complex data structure
Spatial relationships are retained
Spatial analysis can be performed largelywithout specifying co-ordinate data
Map updating requires re-establishingtopology

The Triangulated Irregular Network (TIN) data model is an alternative to the raster and vector data models for representing continuous surfaces. It allows surface models to be generated efficiently to analyze and display terrain and other types of surfaces. The TIN model creates a network of triangles by storing the topological relationships of the triangles. The fundamental building block of the TIN data is the node. Nodes are connected to their nearest neighbors by edges, according to a set of rules. Left-right topology is associated with the edges to identify adjacent triangles.

TIN: input locations
30 350
1550
980
810
1250
820 1100 1340
45
P

Irregular Tesselations: Triangulations
Delaunay Triangulation


Four Tables for TIN Model
•Node Table it lists each triangle and the nodes which define it.
•Edge Table it lists three triangles adjacent to each facets. The triangles that
border the boundary of the TIN show only two adjacent facets.
•XY Co-ordinate Table it lists the co-ordinate values of each node.
•Z Table it is the altitude value of each node.

90
What is Digital Elevation Model ( DEM ) and Digital Terrain Model?
Generation of DEM - photogrammetric technique
- interpolation technique - point and line
- Trinagulated Irregular Network ( TIN )
topographic parameter extraction - Slope,
- Aspect
- Perspective or 3D view
- Hill shading - Curvature
- Flow Direction
- Flow Accumulation
- Synthetic Channel network
- Time - Area Curve
91
• WHY DO WE NEED DEM ?
– Derivation of contour lines
– orthophoto generation
– production of visibility maps
– profile determination
– volume determination
– generation of slope/aspect maps
– perspective presentations
– 3D - GIS
• IDEA OF DEM GENERATION
– Determination of coordinates in object space / ground coordinate system

92
Digital Elevation Model

93
Digital Terrain Model

94
CONTOUR MAP ( from TOPOGRAPHIC MAP )
DIGITAL ELEVATION MODEL
3. Interpolation of contour lines

Digital Elevation Model (DEM)
Digital representations of altitude or elevation.
This is the altitude of the terrain surface.
If this surface is combined with a terrain information such as
streams etc., then it is called Digital Terrain Model.
780 770 690 710 715 720
740 680 710 720 725 730
675 690 705 710 712 715
685 673 680 685 700 705
690 671 675 680 695 705
700 702 666 680 681 710

SLOPE MAP
ASPECT MAP
SUB-WATERSHED MAP
FLOW DIRECTION MAP
FLOW ACCUMULATION MAP DRAINAGE MAP
FLOW LENGTH MAP
MAPS GENERATED USING DIGITAL ELEVATION MAP