glen eira city council annual report · -roods and lonewoys asset ... (policy outlining...
TRANSCRIPT

BENTLEIGH ● BENTLEIGH EAST ● BRIGHTON EAST ● CARNEGIE ● CAULFIELD ● ELSTERNWICK
GARDENVALE ● GLEN HUNTLY ● MCKINNON ● MURRUMBEENA ● ORMOND ● ST KILDA EAST
GLEN EIRA CITY COUNCIL
ANNUAL REPORT2016– 2017
LOCAL GOVERNMENT PERFORMANCE REPORTING FRAMEWORK

BENTLEIGH ● BENTLEIGH EAST ● BRIGHTON EAST ● CARNEGIE ● CAULFIELD ● ELSTERNWICK
GARDENVALE ● GLEN HUNTLY ● MCKINNON ● MURRUMBEENA ● ORMOND ● ST KILDA EAST
GLEN EIRA CITY COUNCIL
ANNUAL REPORT2016– 2017
GOVERNANCE AND MANAGEMENT CHECKLIST

GLEN EIRA CITY COUNCIL
LOCAL GOVERNMENT PERFORMANCE
REPORTING FRAMEWORK FOR THE YEAR ENDED 30 JUNE 2017
The Local Government Performance Reporting
Framework is a mandatory system of performance
reporting for all councils.
The regulations set out our reporting
requirements for Local Government in four broad
areas.
- A governance and management checklist
of 24 items.
- A set of prescribed service indicators, which aim
to measure efficiency and effectiveness of a range
of Local Government services.
- A set of four sustainability capacity indicators,
which aim to assess councils ability to meet
agreed service and infrastructure needs.
- A set of I 2 financial performance indicators,
which aim to provide information on the
effectiveness of financial management.
GOVERNANCE AND MANAGEMENT CHECKLIST
Governance and management items Assessment Outcome
Community engagement policy
(Policy outlining Council's commitment to engaging with
the community on matters of public interest)
Policy
Date of operation of current policy
./
I /07/2014
Community engagement guidelines
(Guidelines to assist staff to determine when and how to
Guidelines ./
engage with the community) Date of operation of current guidelines I /07/2014
Strategic Resource Plan
(Plan under section 126 of the Act outlining the financial
Adopted in accordance wrth section I 26 of the Act ./
and non-financial resources required for at least the next
four financial years) Date of adoption
27/06/2017
Annual Budget
(Plan under section 130 of the Act setting out the
Adopted in accordance wrth section 130 of the Act ./
services to be provided and initiatives to be undertaken
over the next 12 months and the funding and other
resources required)
Date of adoption 27/06/2017
Asset management plans
(Plans that set out the asset maintenance and renewal
Plans ./
needs for key infrastructure asset classes for at least the
next I O years) Date of operation of current plans Includes the:
- Asset Management Strategy
(25/ I I /2014);
- State of Community Assets Report
(17/3/2015);
- Roods and Lonewoys Asset Management
Pion (December 2015);
- Footpaths Pion (November 2014);
- Building Se1Vices Management Pion
(March 2014);
- Stormwoter Drainage Asset Management
Pion (November 2015); and
- Recreation Asset Management Pion (May
2013).

GOVERNANCE AND MANAGEMENT CHECKLIST (CONTINUED)
Governance and management items Assessment Outcome
Rating Strategy
(Strategy setting out the rating structure of Council to
levy rates and charges)
Strategy
Date of operation of current Strategy
./
27/06/2017
Risk policy
(Policy outlining Council's commitment and approach to
minimising the risks to Council's operations)
Policy ./
Date of operation of current policy 2/09/2014
Fraud policy
(Policy outlining Council's commitment and approach to
minimising the risk of fraud)
Policy ./
Date of operation of current policy 8/04/2015
Municipal Emergency Management Plan
(Plan under section 20 of the Emergency Management
Act I 986 for emergency prevention, response and
recovery)
Prepared and maintained in accordance wrth section 20
of the Emergency Management Act I 986
Date of preparation
./
4/12/2015
Procurement policy
(Policy under section 186A of the Local Government Act
I 989 outlining the matters, practices and procedures
that will apply to all purchases of goods, services and
works)
Prepared and approved in accordance wrth section I86A
of the Local Government Act
Date of approval
./
13/06/2017
Business Continuity Plan
(Plan setting out the actions that will be taken to ensure
key services continue to operate in the event of a
disaster)
Pion ./
Date of operation of current Plan 30/04/2014
Disaster Recovery Plan
(Plan setting out the actions that will be undertaken to
recover and restore business capability in the event of a
disaster)
Pion ./
Date of operation of current Plan 13/05/2015
Risk Management Framework
(Framework outlining Council's approach to managing
risks to the Council's operations)
Framework ./
Date of operation of current Framework 1/03/2008
Audit Committee
(Advisory Committee of Council under section 139
of the Act whose role is to oversee the integrity of a
Council's financial reporting, processes to manage risks
to the Council's operations and for compliance wrth
applicable legal, ethical, and regulatory requirements)
Established in accordance with section 139 of the Act ./
Date of establishment 15/ I I /2016
Internal audit
( Independent accounting professionals engaged by the
Council to provide analyses and recommendations
aimed at improving Council's governance, risk and
management controls)
Engaged ./
Date of engagement of current provider 21/09/2015
Performance Reporting Framework
(A set of indicators measuring financial and non-financial
performance, including the performance indicators
referred to in section 131 of the Act)
Framework
Date of operation of current Framework
./
30/06/2017
2

GOVERNANCE AND MANAGEMENT CHECKLIST
Governance and management items Assessment Outcome
Council plan reporting
(Report reviewing the performance of the Council
against the Council Plan. including the results in relation
to the strategic indicators, for the first six months of the
financial year)
Report ./
Date of operation of current report To Council every quarter. 30/8/2016;
20/12/2016; 28/2/2017 and 2/5/2017.
Financial reporting
(Quarterly statements to Council under section 138 of
the Act comparing budgeted revenue and expenditure
with actual revenue and expenditure)
Statements presented to Council in accordance with
section 138( I) of the Act ./
Dates statements presented Financial reporting to Council is performed
monthly until year-end: Dates statements
presented: 30/8/ 16: I 0/ I 0/ 16; 15/ I I/ 16:
29/11/16; 20/12/16; 7/2/17; 28/2/17;
21 /3/ 17; 2/5/ 17 and 23/5/ 17.
Risk reporting
(Six-monthly reports of strategic risks to Council's
operations, their likelihood and consequences of
occurring and risk minimisation strategies)
Reports ./
Date of reports To Audit Committee every quarter.
19/8/2016; 24/ I I /2016; 17/2/2017 and
26/5/2017.
Performance reporting
(Six-monthly reports of indicators measuring the results
against financial and non-financial performance, including
performance indicators referred to in section 13 I of
the Act)
Reports ./
Date of report Financial Reporting to Council on a monthly
basis and non-financial reporting provided
to Council on a quarterly basis. Dates
statements/reports presented: 30/8/ 16;
I 0/ I 0/ I 6; 15/ I I/ 16; 29/ I I/ I 6 ; 20/ 12/ 16;
7 /2/ 17; 28/2/ 17; 21 /3/ 17; 2/5/ 17 and
23/5/17.
Audit Committee received reports
covering the Local Government Performance
Reporting Framework on 19 /8/20 I 6;
24/ 1 I /2016 and 26/5/2017.
Annual Report
(Annual Report under sections 13 I , 13 2 and 133 of the
Act to the community containing a report of operations
and audited financial performance statements)
Considered at a Council Meeting in accordance with
section 134 of the Act ./
Date of consideration 18/ I 0/2016
Councillor Code of Conduct
(Code under section 76C of the Act setting out the
conduct principles and the dispute resolution processes
to be followed by Councillors)
Reviewed in accordance with section 7 6C of the Act ./
Date reviewed 14/02/2017
Delegations
(A document setting out the powers, duties and
functions of Council and the Chief Executive Officer
that have been delegated to members of staff)
Reviewed in accordance with section 98(6) of the Act ./
Date reviewed 9/8/2016 and 2/5/2017
Meeting procedures
(A local law governing the conduct of meetings of
Council and special committees)
Meeting procedures local law made in accordance with
section 91 ( I) of the Act ./
Date local law made 24/ 1 I /2009
Rebecca McKenzie
CHIEF EXECUTIVE OFFICER
Dated: 28 September 20 17
Councillor Mary Delahunty
MAYOR
Dated: 28 September 20 17
I certify that this information presents fairly the status of Council's governance and management arrangements.
3
BENTLEIGH ● BENTLEIGH EAST ● BRIGHTON EAST ● CARNEGIE ● CAULFIELD ● ELSTERNWICK
GARDENVALE ● GLEN HUNTLY ● MCKINNON ● MURRUMBEENA ● ORMOND ● ST KILDA EAST
GLEN EIRA CITY COUNCIL
ANNUAL REPORT2016– 2017
SERVICE PERFORMANCE INDICATORS

STATE GOVERNMENT SERVICE
PERFORMANCE INDICATORS FOR THE YEAR ENDED 30 JUNE 2017
The results contained in the Local Government Performance Reporting Framework indicators below have not been rounded
. Results Results Results . . . SERVICE/ Indicator/ Measure Material variations
2015 2016 2017
AQUATIC FACILITIES
Satisfaction
User satisfaction with aquatic facilities (optional) 0.00 000 0.00 This is an optional measure as there is currently no standard survey instrument for measuring user satisfaction that allows
[User satisfaction with how council has performed on for accurate comparisons. provision of aquatic facilities]
Service standard
Health inspections of aquatic facilities 4 00 4 00 55 The Public Health area aims to inspect and test all Council-owned aquatic facilities at least quarterly.
[Number of authorised officer inspections of Council
aquatic facilities/number of Council aquatic facilities]
HEALTH AND SAFETY
Reportable safety incidents at aquatic facilities 8 00 12 00 9 00 The result for this measure has decreased from 2015-16;
this is a positive result
[Number of WorkSafe reportable aquatic facility
safety incidents]
Service cost
Cost of indoor aquatic facilities -$2.27 -$2.61 -$1.93 Glen Eira Sports and Aquatic Centre delivers an operational surplus. This reflects uses of a diverse range of facilities
[Direct cost of indoor aquatic facilities less income including aquatics, gymnasium, child care. hydrotherapy. indoor stadium and fitness classes. The surplus per visit received/number of visits to indoor aquatic facilities] shows a decrease year-on-year. This decrease reflects significantly higher visits to the aquatic facility than previous years. A new overhead people counting system has been installed which is much more accurate than the older visitor counting system. The facility is meeting community needs and expectations.
Cost of outdoor aquatic facilities $3.98 $4.97 $4 42 This measure has improved from the previous year due to a reduction in overall cost Council will be considering
[Direct cost of outdoor aquatic facilities less income redevelopment of the facility over coming years to improve customer experience. received/number of visits to outdoor aquatic facilities]
Utilisation
Utilisation of aquatic facilities 7.97 8.16 10.39 The Glen Eira Sports and Aquatic Centre (GESAC) delivers a diverse range of facilities including aquatics, gymnasium,
[Number of visits to aquatic facilities /municipal population] child care, hydrotherapy, indoor stadium and fitness classes. A new overhead people counting system has been installed which is much more accurate than the older visitor counting system and reflects a higher level of visits to GESAC
ANIMAL MANAGEMENT
Timeliness
Time taken to action animal management requests 0.00 1 42 I J I Whilst Council received more complaints in the latest period compared to the previous period, we managed to
[Number of days between receipt and first response improve our response times by reviewing our processes achieving greater efficiency. action for all animal management requests/number of
animal management requests]
Service standard
Animals reclaimed 70% 67.19% 63.33%
[Number of animals reclaimed/number of animals
collected] x I 00
4

STATE GOVERNMENT SERVICE
PERFORMANCE INDICATORS FOR THE YEAR ENDED 30 JUNE 2017
. Results Results Results . . . SERVICE/ Indicator/ Measure Material var,at,ons
2015 2016 2017
ANIMAL MANAGEMENT (CONTINUED)
Service cost
Cost of animal management service $39.45 $43.71 $38.63 2016-17 animal management costs are more in line with expected costs and somewhat comparable with the
[Direct cost of the animal management service/number 2014-15 figures. However, the unusually high figures for 2015-16 years can be attributable to the higher than of registered animals] normal legal costs expended on several contested and protracted cases.
Health and safety
Animal management prosecutions 16.00 13.00 4.00 Successful education and patrols over the past twelve months has resulted in the reduction of serious dog attacks
[Number of successful animal management prosecutions]
FOOD SAFETY
Timeliness
Time taken to action food complaints 0.00 1.64 2.00 From I July 2016, 'Time taken to action food complaints' will be reported by calendar year. Previously this indicator was
[Number of days between receipt and first response reported by financial year. This has been implemented to better align reporting with the Department of Health and action for all food complaints/number of food complaints] Human Services. This may result in some variances year on year.
Service standard
Food safety assessments 105% 102.86% 103.21%
[Number of registered class I food premises and class
2 food premises that receive an annual food safety
assessment in accordance with the Food Act I 9841
number of registered class I food premises and class
2 food premises that require an annual food safety
assessment in accordance with the Food Act I 984] x I 00
Service cost
Cost of food safety service $657.95 $638.83 $606.38
[Direct cost of the food safey t service/number of food
premises registered or notified in accordance with the
Food Act I 984]
Health and safety
Critical and major non-compliance outcome notifications
[Number of crrtical non-compliance outcome notifications
and major non-compliance notifications about a food
premises followed up/number of critical non-compliance
outcome notifications and ma1or non-compliance
notifications about a food premises] x I 00
100.00% 100.00% 9852% From I July 2016, 'Critical and maJor non-compliance outcome notifications' will be reported by calendar year. Previously this indicator was reported by financial year. This has been implemented to better align reporting wrth the Department of Health and Human Services. This may result in some variances year on year.
5
STATE GOVERNMENT SERVICE
PERFORMANCE INDICATORS FOR THE YEAR ENDED 30 JUNE 2017
. SERVICE/ Indicator/ Measure
Results
2015
Results
2016
Results
2017
. . . Material var1at1ons
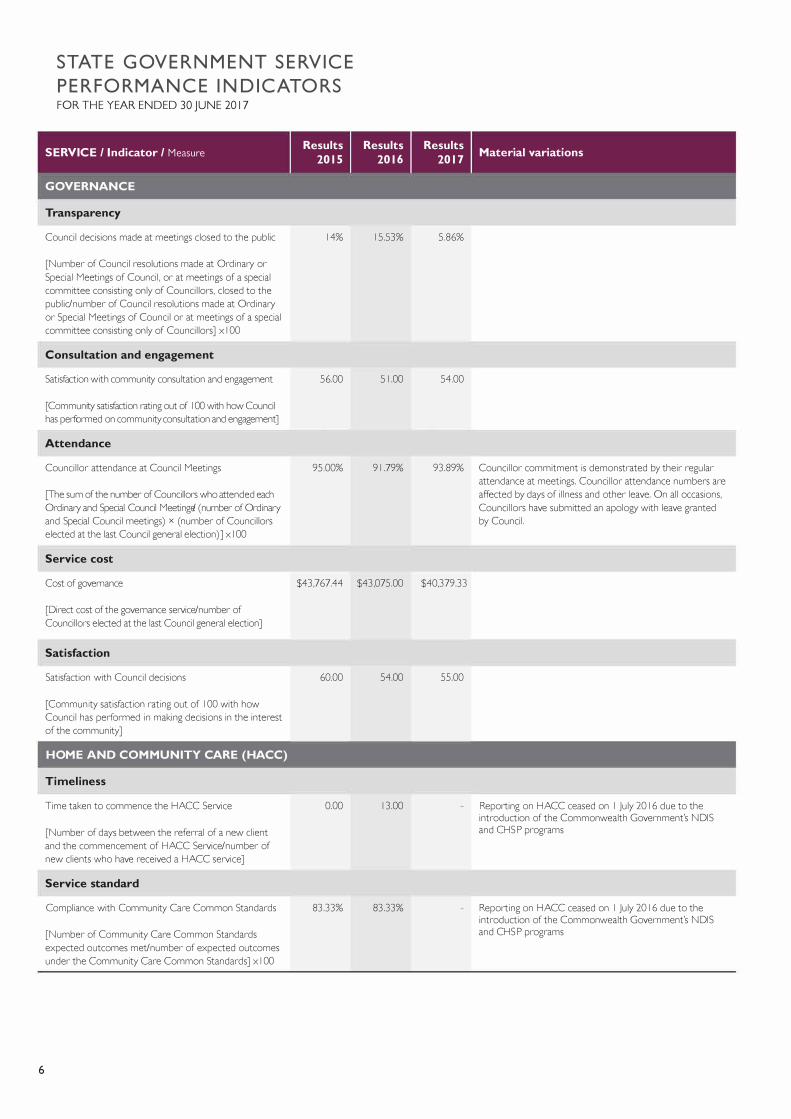
GOVERNANCE
Transparency
Council decisions made at meetings closed to the public
[Number of Council resolutions made at Ordinary or Special Meetings of Council. or at meetings of a special committee consisting only of Councillors, closed to the public/number of Council resolutions made at Ordinary or Special Meetings of Council or at meetings of a special committee consisting only of Councillors] x I 00
14% 15.53% 5.86%
Consultation and engagement
Satisfaction with community consultation and engagement
[Community satisfaction rating out of I 00 with how Council has performed on community consultation and engagement]
56.00 51.00 54.00
Attendance
Councillor attendance at Council Meetings
[The sum of the number of Councillors who attended each Ordinary and Special Council Meetinge/ ( number of Ordinary and Special Council meetings) x (number of Councillors elected at the last Council general election)] x I 00
95 00% 91.79% 93.89% Councillor commitment is demonstrated by their regular attendance at meetings. Councillor attendance numbers are affected by days of illness and other leave. On all occasions, Councillors have submitted an apology with leave granted by Council.
Service cost
Cost of governance
[Direct cost of the governance service/number of Councillors elected at the last Council general election]
$43,767.44 $43,075.00 $40,37933
Satisfaction
Satisfaction with Council decisions
[Community satisfaction rating out of I 00 with how Council has performed in making decisions in the interest of the community]
60.00 54.00 55.00
HOME AND COMMUNITY CARE (HACC)
T imeliness
Time taken to commence the HACC Service
[Number of days between the referral of a new client and the commencement of HACC Service/number of new clients who have received a HACC service]
000 13.00 Reporting on HACC ceased on I July 2016 due to the introduction of the Commonwealth Government's NDIS and CHSP programs
Service standard
Compliance with Community Care Common Standards
[Number of Community Care Common Standards expected outcomes met/number of expected outcomes under the Community Care Common Standards] x I 00
8333% 8333% Reporting on HACC ceased on I July 2016 due to the introduction of the Commonwealth Government's NDIS and CHSP programs
6

STATE GOVERNMENT SERVICE
PERFORMANCE INDICATORS FOR THE YEAR ENDED 30 JUNE 2017
. Results Results Results . . . SERVICE/ Indicator/ Measure Material var1at1ons
2015 2016 2017
HOME AND COMMUNITY CARE (HACC) (CONTINUED)
Service cost
Cost of domestic care service
[Cost of the domestic care service/ hours of domestic
care service provided]
$0.00 $43.24 Reporting on HACC ceased on I July 20 I6 due to the introduction of the Commonwealth Government's NDIS and CHSP programs
Cost of personal care service
[Cost of the personal care service/ hours of personal care
service provided]
$0.00 $42.98 Reporting on HACC ceased on I July 20 I6 due to the introduction of the Commonwealth Government's NDIS and CHSP programs
Cost of respite care service
[Cost of the respite care service/ hours of respite care
service provided]
$0.00 $5337 Reporting on HACC ceased on I July 20 I 6 due to the introduction of the Commonwealth Government's NDIS and CHSP programs
Participation
Participation in HACC service
[Number of people that received a HACC service /
municipal target population for HACC services] x I 00
26.00% 24.49% Reporting on HACC ceased on I July 20 I 6 due to the introduction of the Commonwealth Government's NDIS and CHSP programs
Participation in HACC service by cuH:urally and
linguistically diverse (CALD) people
[Number of CALD people who receive a HACC
service/municipal target population in relation to CALD
people for HACC services] x I 00
21.51% 20.00% Reporting on HACC ceased on I July 20 I6 due to the introduction of the Commonwealth Government's NDIS and CHSP programs
LIBRARIES
Utilisation
Library collection usage
[Number of library collection item loans/number of
library collection items]
7.87 831 8.21
Resource standard
Standard of library collection
[Number of library collection items purchased in the last
five years/number of library collection items] x I 00
71.00% 70.75% 73.17%
Service cost
Cost of Ii b rary service
[Direct cost to Council of the library service/number of visits]
$5.78 $5.83 $5.54
7

STATE GOVERNMENT SERVICE
PERFORMANCE INDICATORS FOR THE YEAR ENDED 30 JUNE 2017
. SERVICE/ Indicator/ Measure
Results
2015
Results
2016
Results
2017
. . . Material var1at1ons
LIBRARIES (CONTINUED)
Participation
Active library members
[Number of active library members/municipal population] x I 00
17.00% 17.18% 16.88%
MATERNAL AND CHILD HEALTH (MCH)
Satisfaction
Participation in nrst MCH home visit
[Number of nrst MCH home visits/number of birth notincations received] x I 00
105 09% 10357% 104.13%
Service standard
Infant enrolments in the MCH Service
[Number of infants enrolled in the MCH Service (from birth notincations received) I number of birth notincations received] x I 00
100.00% 99.19% 100%
Service cost
Cost of MCH Service
[Cost to Council of the MCH Service hours worked by MCH nurses]
$0.00 $81 68 $75.16
Participation
Participation in the MCH Service
[Number of children who attend the MCH Service at least once (in the year) /number of children enrolled in the MCH Service] x I 00
87 00% 87.51% 87.37%
Participation in the MCH Service by Aboriginal children
[Number of Aboriginal children who attend the MCH Service at least once (in the year) I number of Aboriginal children enrolled in the MCH Service] x I 00
88.00% 92.86% I09.09% Twelve Aboriginal children were seen for Key Ages Stages visits throughout the year. At some stage during the year, one of these children has moved out of the council. We now only have I I Aboriginal children enrolled at Glen Eira at year end.
ROADS
Participation
Sealed local road requests
[Number of sealed local road requests/kilometres of sealed local roadse] x I 00
41.25 56.74 66.20 There is an increase in the number of sealed local roads requests in the 2015-16 and 20 I6-17 reporting periods because of Railway Level Crossing Removal proIects and large scale private developments in the Municipality This is a result of an increase in heavy vehicle usage of the local roads causing some damage, potholes and deterioration.
Condition
Sealed local roads below the intervention level
[Number of kilometres of sealed local roads below the renewal intervention level set by Council/kilometres of sealed local roads] x I 00
9700% 95.37% 9658%
8

STATE GOVERNMENT SERVICE
PERFORMANCE INDICATORS FOR THE YEAR ENDED 30 JUNE 2017
. SERVICE/ Indicator/ Measure
Results
2015
Results
2016
Results
2017
. . . Material var1at1ons
ROADS (CONTINUED)
Service cost
Cost of sealed local road reconstruction
[Direct cost of sealed local road reconstruction/square metres of sealed local roads reconstructed]
$91.45 $12556 $126.16 Council's asset renewal processes determine which local roads will be prioritised for work each year The works are undertaken by contractors following a competitive procurement process. Individual road reconstruction costs can vary depending on the extent of reconstruction specified for each prOJect.
Cost of sealed local road resealing
[Direct cost of sealed local road resealing/square metres of sealed local roads resealed]
$19.38 $17.65 $17.61
Satisfaction
Satisfaction with sealed local roads
[Community satisfaction rating out of I 00 with how Council has performed on the condition of sealed local roads]
7400 69.00 67.00 This measure is derived from the State Government's Community Satisfaction Swvey. Main roads within the municipality are the responsibility of VicRoads whilst lesser roads are the responsibility of Local Government. The Survey does not differentiate between the responsibilities of State and Local Government. This measure risks measuring satisfaction with VicRoads and attributing rt to councils.
STATUTORY PLANNING
Timeliness
Time taken to decide planning applications
[The median number of days between receipt of a planning application and a decision on the application]
7200 90.00 I03.00 The increase in number and complexity of applications coupled with a substantial increase in the number of appeals has resulted in an increase in the time taken to decide planning applications. The Town Planning Department has conducted a service review that will be implemented during the 2017-18 financial year that will improve service standards and the time taken to decide planning applications.
Service standard
Planning applications decided within required time frames
[(Number of regular planning application decisions made within 60 days) + (Number of VicSmart planning application decisions made within IO days)e/ Number of planning application decisions made] x I 00
77% 61.98% 57.81 % From I July 2016 this indicator will be updated to include VicSmart planning applications which should be assessed within IO days. This may result in some variances year on year.
Service cost
Cost of statutory planning service
[Direct cost of the statutory planning service/number of planning applications received]
$2,341.87 $2,21 1.86 $2,287.66 The cost of service remains fairly consistent despite the overall increase in application numbers.
Decision-making
Council planning decisions upheld at VCAT
[Number ofVCAT decisions that did not set aside Council's decision in relation to a planning application/number of VCAT decisions in relation to planning applications] x I 00
59% 56.86% 41 .80% During the last I2 months there has been an increase in the number of appeals for applications refused by Council. This has resulted in a decrease in the number of Council's decisions upheld at VCAT VCAT is legally required to take account of Council's planning scheme policies but is not legally required to apply them. Further, applicants can change their plans significantly before they get to VCAT so VCAT may be considering a qurte different proposal to the one decided by Council. It follows that VCAT is often not making the same decision as Council. The measure does not capture mediated outcomes.
9

STATE GOVERNMENT SERVICE
PERFORMANCE INDICATORS FOR THE YEAR ENDED 30 JUNE 2017
. SERVICE/ Indicator/ Measure
Results
2015
Results
2016
Results
2017
. . . Material var1at1ons
WASTE C OLLECTI ON
Satisfaction
Kerbside bin collection requests
[Number of kerbside garbage and recycling bin collection requests/number of kerbside bin collection households] x I 000
161.80 12264 116.90
Service standard
Kerbside collection bins missed
[Number of kerbside garbage and recycling collection bins missed/number of scheduled kerbside garbage and recycling collection bin lifts] x I 0,000
3.33 1.20 1.18
Service cost
Cost of kerbside garbage bin collection service
[Direct cost of the kerbside garbage bin collection service/number of kerbside garbage collection bins]
$114.93 $114.61 $115.29
Cost of kerbside recyclables collection service
[Direct cost of the kerbside recyclables bin collection service /number of kerbside recyclables collection bins]
$9.19 $10.08 $10.80
Waste diversion
Kerbside collection waste diverted from landfill
[Weight of recyclables and green organics collected from kerbside bins/weight of garbage, recyclables and green organics collected from kerbside bins] x I 00
43% 44.18% 45.28%
Defin itions
''.Aborigi nal ch i ld" means a ch i ld who is an Aborigi nal person
"Aborigi nal person" has the same mean i ng as i n the Aboriginal Heritage Act 2006
"active l i brary member" means a member of a l ibrary who has borrowed a book from the l i brary
"annual report" means an annual report prepared by a counc i l under sections 1 3 1 , 1 32 and 1 33 of the Act
"class I food p remises" means food premises, with i n the meaning of the Food Act 1 984, that have been declared as c lass I food premises under section I 9C of that Act
"class 2 food p remises" means food premises, with i n the meaning of the Food Act I 984, that have been declared as c lass 2 food premises under section I 9C of that Act
"Community Care Common Standards "means the Commun ity Care Common Standards for the del ivery of HACC services, publ ished from time to time by the Commonwealth
"critical non-compl iance outcome notification" means a notification received by counc i l under section I 9 N (3) or (4) of the Food Act I 984, or advice given to counc i l by an authorised officer
under that Act, of a deficiency that poses an immediate serious threat to publ ic health
"food premises" has the same mean ing as i n the Food Act I 984
"HACC program" means the Home and Community Care program establ ished under the Agreement entered i nto for the purpose of the Home and Community Care Act I 985 of the
Commonwealth
"HACC service" means home help , personal care or commun ity respite provided under the HACC program
" local road" means a sealed or unsealed road for which the counc i l is the responsib le road authority under the Road Management Act 2004
"major non-compl iance outcome notification" means a notification received by a counc i l under section 1 9N (3) or ( 4) of the Food Act I 984, or advice given to counc i l by an authorized officer
under that Act, of a deficiency that does not pose an immediate serious threat to pub l ic
health but may do so if no remedial action is taken
"MCH" means the Maternal and Ch i ld Health Service provided by a counc i l to support the health and development of ch i ldren with i n the mun ic i pality from birth unti l school age
"popu lation" means the res ident population estimated by counc i l
"target population" has the same mean i ng as i n the Agreement entered i nto for the purposes of the Home and Community Core Act I 985 of the Commonwealth
"WorkSafe reportable aquatic fac i l ity safety inc ident" means an inc ident re lating to a counc i l aquatic fac i l ity that is requ i red to be notified to the Victorian WorkCover Authority under Part 5 of
the Occupational Health and Safety Act 2004
1 0

BENTLEIGH ● BENTLEIGH EAST ● BRIGHTON EAST ● CARNEGIE ● CAULFIELD ● ELSTERNWICK
GARDENVALE ● GLEN HUNTLY ● MCKINNON ● MURRUMBEENA ● ORMOND ● ST KILDA EAST
GLEN EIRA CITY COUNCIL
ANNUAL REPORT2016– 2017
SUSTAINABLE CAPACITY INDICATORS
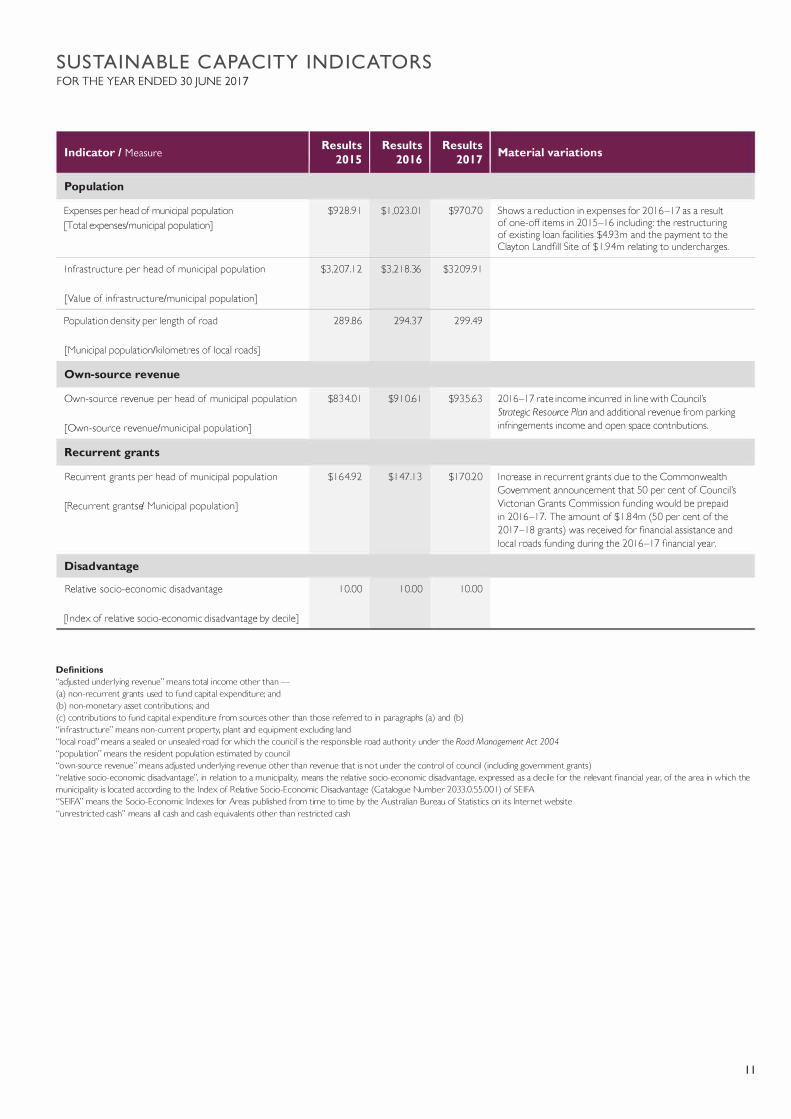
S U STA I N A B L E CAPAC I TY I N D I CATO RS FOR THE YEAR ENDED 30 JUNE 2017
Indicator/ Measure --- Material variations
Population
Expenses per head of municipal population
[Total expenses/municipal population]
$928.91 $1,02301 $970.70 Shows a reduction in expenses for 2016-17 as a resuH: of one-off items in 20 I 5-1 6 including: the restructuring of existing loan facilities $4.93m and the payment to the Clayton Landfill Site of $1 .94m relating to undercharges.
Infrastructure per head of municipal population
[Value of infrastructure/municipal population]
$3,207.12 $3,21836 $3209.91
Population density per length of road
[Municipal population/kilometres of local roads]
289.86 2943 7 29949
Own-source revenue
Own-source revenue per head of municipal population
[Own-source revenue/municipal population]
$834.01 $910.61 $935.63 2016-17 rate income incurred in line with Council's Strategic Resource Pion and additional revenue from parking infringements income and open space contributions.
Recurrent grants
Recurrent grants per head of municipal population
[Recurrent grantse/ Municipal population]
$164.92 $147.13 $170.20 Increase in recurrent grants due to the Commonwealth Government announcement that 50 per cent of Council's Victorian Grants Commission funding would be prepaid in 2016-17. The amount of $1.84m (50 per cent of the 2017-18 grants) was received for financial assistance and local roads funding during the 2016-17 financial year.
Disadvantage
Relative socio-economic disadvantage
[Index of relative socio-economic disadvantage by decile]
10.00 10.00 1000
Defin itions
"ad1usted underlying revenue" means total i ncome other than -
(a) non-recurrent grants used to fund capital expend iture; and
(b) non-monetary asset contri butions; and
(c) contributions to fund capital expend iture from sources other than those referred to in paragraphs (a) and (b)
" infrastructure" means non-current property, p lant and equ i pment exc lud ing land
" local road" means a sealed or unsealed road for which the counc i l is the respons ib le road authority under the Road Management Act 2004
"popu lation" means the resident population estimated by counc i l
"own-source revenue" means adjusted underlying revenue other than revenue that is not under the control of counc i l ( inc lud i ng government grants)
"relative socio-economic d isadvantage", in re lation to a mun ic ipal ity, means the relative socio-economic d isadvantage, expressed as a deci le for the relevant financial year, of the area in which the
munic i pal ity is located accord ing to the I ndex of Relative Socio-Economic Disadvantage (Catalogue Number 2033.0.55.00 I ) of SE I FA
"SE IFA: ' means the Socio-Economic I ndexes for Areas publ ished from time to time by the Austral ian Bureau of Statistics on its I nternet website
"unrestricted cash ' ' means all cash and cash equ ivalents other than restricted cash
1 1

BENTLEIGH ● BENTLEIGH EAST ● BRIGHTON EAST ● CARNEGIE ● CAULFIELD ● ELSTERNWICK
GARDENVALE ● GLEN HUNTLY ● MCKINNON ● MURRUMBEENA ● ORMOND ● ST KILDA EAST
GLEN EIRA CITY COUNCIL
ANNUAL REPORT2016– 2017
FINANCIAL PERFORMANCE INDICATORS

F I N A N C IAL P E R F O RMAN C E I N D I CATO RS FOR THE YEAR ENDED 30 JUNE 2017
Average residential rate per residential property assessment
[Residential rate revenue/number of residential property assessments]
$1.415.61 $1,485.03 $ 1 ,521.45 $1,549.42 $1,572.02 $1,599.97 $1,62851 Movements in line with Council's Strategic
Resource Pion.
Expenditure level
Expenses per property assessment
[Total expenses/number of property
assessments]
$2,149.69 $2,332.85 $2,230.99 $2,341.25 $2,360.19 $2,382.49 $2,417.85 Shows a reduction in expenses for 20 I 6-17 as a result of one-off rtems in 2015-16 including: the restructuring of existing loan facilities $4.93m and the payment to the Clayton Landfill Site ofe$ l .94m relating to undercharges.
Workforce turnover
Resignations and terminations compared to average staff
[Number of permanent staff resignations and termination/average number of permanent staff for the financial year] x I 00 [depreciation] x I 00
9.82% 1148% 9.23% 10.69% 10.69% 10.69% 10.69% The workforce turnover indicator has seen a reduction from 2015-16. The movements are attributable to normal variances in operational departures.
LIQUIDITY
Working capital
Current assets compared to current liabilrties
[Current assets/current liabilities] x I 00
98.80% 99.31% 123.96% 117.86% 112.96% 107.83% 103.66% Increase in 20 I 6-17 relates to: higher than anticipated income from parking infringements, open space contributions and brought forward income for Victorian Grants Commission funding. Forecast movements in line with Council's Strategic Resource Pion.
Unrestricted cash
Unrestricted cash compared to current liabilities
[Unrestricted cash/current liabilities] x I 00
25.21% 28.15% 453e1% 26.16% 29.78% 23% 18.05% Increase in 20 I 6-17 relates to: higher than anticipated income from parking infringements, open space contributions and brought forward income for Victorian Grants Commission funding. Forecast movements in line with Council's Strategic Resource Pion.
1 2

F I N A N C IAL P E R F O RMAN C E I N D I CATO RS FOR THE YEAR ENDED 30 JUNE 2017
Asset renewal
Asset renewal compared to depreciation
[ Asset renewal expenses/asset depreciation] x l 00
78.26% 82.14% 69.79% 79e03% 94.96% 83.73% 73.85% Lower expenditure on asset renewal as a result of a reduced capital program in 2016-17. Forecast movements in line wrth Council's Strategic Resource Plan.
Loans and borrowings
Loans and borrowings compared to rates
[Interest bearing loans and borrowings/rate revenue] x I 00
23.35% 25.68% 21.38% 17.55% 13.83% 10.16% 6.62% Borrowings restructured in June 2016, which resulted in a net financial benefit to Council. Reflects repayment of loan borrowings according to schedule. The principal loan was to build the Glen Eira Sports and Aquatic Centre.
Loans and borrowings repayments compared
to rates
[Interest and principal repayments on interest
bearing loans and borrowings/rate revenue]
x l 00
321% 3.11% 3.94% 3.84% 3.71% 3.59% 3.48% Borrowings restructured
in June 2016, which
esulted in a net financial
benefit to Council.
Reflects repayment of loan
borrowings according to
chedule.
r
s
Indebtedness
Non-current liabilities compared to own
source revenue
[Non-current liabilrties/own source revenue]
x l 00
20.45% 19.44% 15.91% 13.17% 10.42% 7.64% 4.91% Reflects Council's
reduction in debt
according to scheduled
loan repayments.
OPERATING POSITION
Adjusted underlying result
Adjusted underlying surplus ( or deficit)
[ Adjusted underlying surplus ( deficit)/
adjusted underlying revenue] x I 00
9.32% 6.90% 16.20% 9.43% 10.13% 10.32% I 0.36% Underlying result for
2015-16 impacted by
one-off, unbudgeted
expendrture items.
Increase for 20 I 6-17
relates to: higher than
anticipated income from
parking infringements,
open space contributions
and brought forward
income for Victorian
Grants Commission
funding.
1 3

F I N A N C IAL P E R F O RMAN C E I N D I CATO RS FOR THE YEAR ENDED 30 JUNE 2017
DIMENSIONS/ Indicator/ Measure Results
20 I 5 I 20 1 6 I 20 I 7
Forecasts
20 I 8 I 20 1 9 I 2020 I 202 1
Material variations
STABILITY
Rates concentration
Rates compared to adjusted underlying
revenue
[Rate revenue/ad1usted underlying revenue]
x l 0O
61.72% 61.12% 58.73% 61.36% 61.28% 61.65% 61.81% Rates concentration was reduced in 2016-17 due to increased ad1usted underlying revenue. Thisis a result of increased parking fees, increased planning and subdivision fees and prepayment of Victorian Grants Commission grant income.
Rates effort
Rates compared to property values
[Rate revenue/caprtal improved value of
rateable properties in the municipality] x I 00
0.19% 0.20% 0.17% 0.16% 0.16% 0.16% 0.15% The reduction in 20 I 6--17
reflects a large increase in
property values throughout
the municipalrty compared
to capped rate increases.
Defin itions
"adjusted underlying revenue" means total income other than -
(a) non-recu rrent grants used to fund capital expend iture; and
(b) non-monetary asset contri butions; and
(c) contri butions to fund capital expend iture from sources other than those referred to in paragraphs (a) and (b)
"adjusted underlying surplus (or deficit)" means adjusted underlying revenue less total expend iture
"asset renewal expend iture" means expend iture on an existing asset or on rep lac ing an existing asset that returns the service capabi l ity of the asset to its original capabi l ity
"current assets" has the same meaning as in the AAS
"current l iabi l ities" has the same mean i ng as in the AAS
"non-current assets" means all assets other than current assets
"non-current l iab i l ities" means all l iabi l it ies other than current l iabi l it ies
"non-recurrent grant" means a grant obtai ned on the condition that it be expended i n a specified manner and is not expected to be received again during the period covered by a counc i l 's
Strategic Resource Plan
"own-source revenue" means adjusted underlying revenue other than revenue that is not under the control of Counc i l ( inc lud i ng government grants)
"population "means the res ident population estimated by Counc i l
' ' rate revenue" means revenue from general rates, munic i pal charges, service rates and service charges
" recurrent grant "means a grant other than a non-recurrent grant
" residential rates" means revenue from general rates, mun ic ipal charges, service rates and service charges levied on residential properties
"restricted cash" means cash and cash equ ivalents, with i n the mean i ng of the AAS, that are not avai lable for use other than for a purpose for which it is restricted, and includes cash to be used
to fund capital works expend iture from the previous financial year
"unrestricted cash" means a l l cash and cash equ ivalents other than restricted cash
1 4