glimpse of our achievements…
TRANSCRIPT

1
Glimpse of our Achievements….
• Consistently reported profit in its 25 years of existence, an enviable trackrecord
• Consistent Dividend paying company for the last 10 years. Paid dividend for15 years out of 25 years of its existence
• Impeccable and enviable track record of timely meeting all financial• Impeccable and enviable track record of timely meeting all financialobligations for the last 25 years.
• In 2012 FCCB’s redeemed despite global challenges – continuation of legacyof meeting financial obligation timely
• One of the least leveraged companies in the Line Pipe Sector
• Promoted by Mansukhani Family
• The MAN Group, established in 1970, is a USD One Billion conglomerate
• Group consists of following major companies:
ABOUT US
3
• Group consists of following major companies:
– Man Industries (India) Ltd. (MIIL)– Man Infraprojects Ltd.
• Man Industries (India) Ltd., flagship Company of the group, is a widely held Public Limited Company, incorporated in 1988
• One of the largest SAW pipe manufacturers in the country with total installed capacity up to1 million tonnes.
• State-of-the-art manufacturing facilities.
• More than 10,000 kilometers of line Pipes have been supplied by MIIL worldwide.
• Dedicated to highest Operating and Quality standards, Environment Protection,
COMPANY SNAPSHOT
• Dedicated to highest Operating and Quality standards, Environment Protection,Occupational Health & Safety Standards and accredited with ISO 9001, ISO 14001 and ISO18001 Certifications.
• Committed to Corporate Social Responsibility by contributing to various social projects.
• Shares listed on stock exchanges at BSE, NSE in India.
• Plants spread over 150 acres of land at Prime location in Anjar, Gujarat. in the vicinity oftwo major ports.
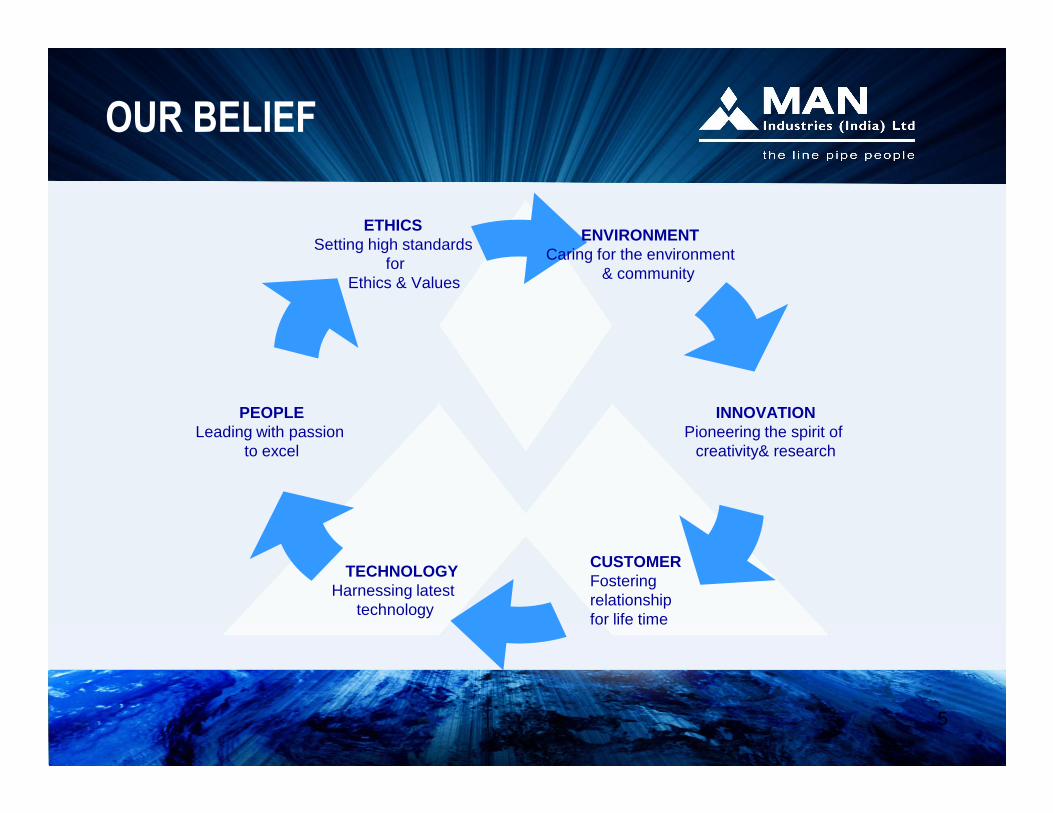
ENVIRONMENTCaring for the environment
& community
INNOVATION
ETHICSSetting high standards
forEthics & Values
PEOPLE
OUR BELIEF
5
INNOVATIONPioneering the spirit of
creativity& research
PEOPLELeading with passion
to excel
TECHNOLOGYHarnessing latest
technology
CUSTOMER Fostering relationship for life time
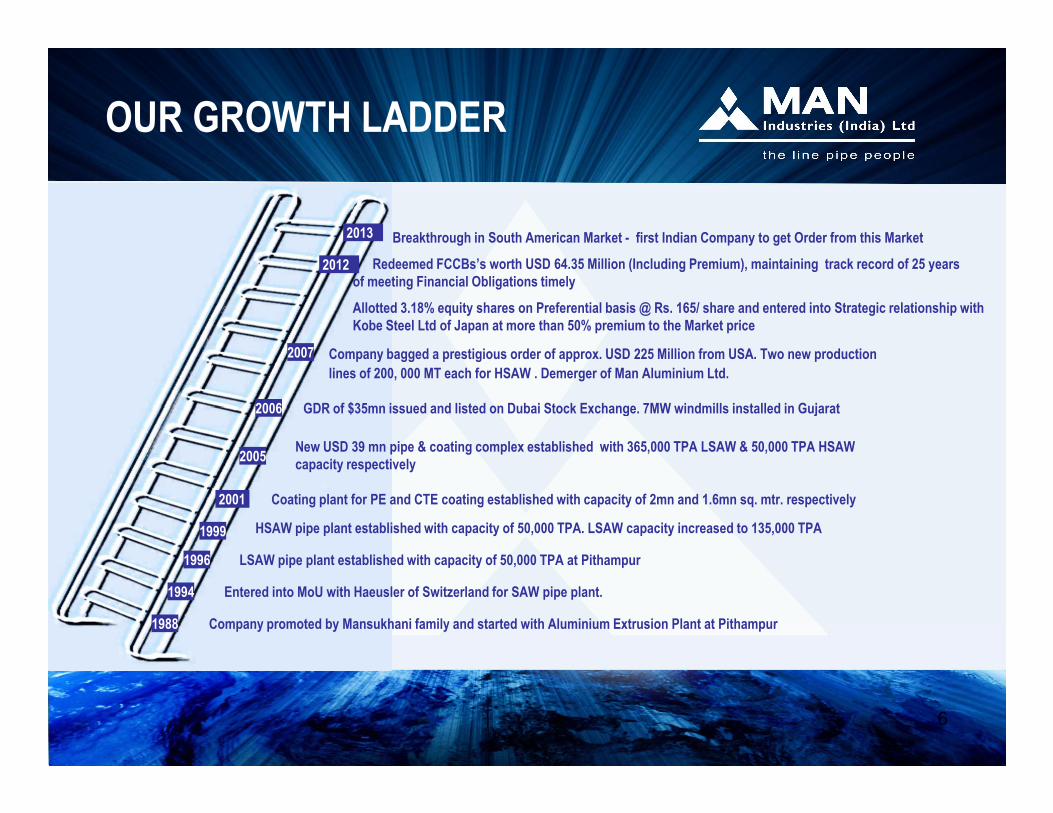
2007 Company bagged a prestigious order of approx. USD 225 Million from USA. Two new production
2006 GDR of $35mn issued and listed on Dubai Stock Exchange. 7MW windmills installed in Gujarat
OUR GROWTH LADDER
lines of 200, 000 MT each for HSAW . Demerger of Man Aluminium Ltd.
Breakthrough in South American Market - first Indian Company to get Order from this Market
Redeemed FCCBs’s worth USD 64.35 Million (Including Premium), maintaining track record of 25 years of meeting Financial Obligations timely
Allotted 3.18% equity shares on Preferential basis @ Rs. 165/ share and entered into Strategic relationship with Kobe Steel Ltd of Japan at more than 50% premium to the Market price
2012
2013
6
1988 Company promoted by Mansukhani family and started with Aluminium Extrusion Plant at Pithampur
1994 Entered into MoU with Haeusler of Switzerland for SAW pipe plant.
1996 LSAW pipe plant established with capacity of 50,000 TPA at Pithampur
1999 HSAW pipe plant established with capacity of 50,000 TPA. LSAW capacity increased to 135,000 TPA
2001 Coating plant for PE and CTE coating established with capacity of 2mn and 1.6mn sq. mtr. respectively
2005New USD 39 mn pipe & coating complex established with 365,000 TPA LSAW & 50,000 TPA HSAWcapacity respectively
2006 GDR of $35mn issued and listed on Dubai Stock Exchange. 7MW windmills installed in Gujarat

Shareholding Pattern as on 31th March’ 2014
(As per BSE/NSE filing )In %
SHAREHOLDING PATTERN
13%
8%
Promoters and PAC's
Mutual Funds, FIs &
Insurance Cos
Source: Company
60%
2%2%
15%
Insurance Cos
Clearing Member and
Trusts
HNIs and Corporate
Bodies
FIIs and FFIs and NRIs and
Foreign Companies
Public
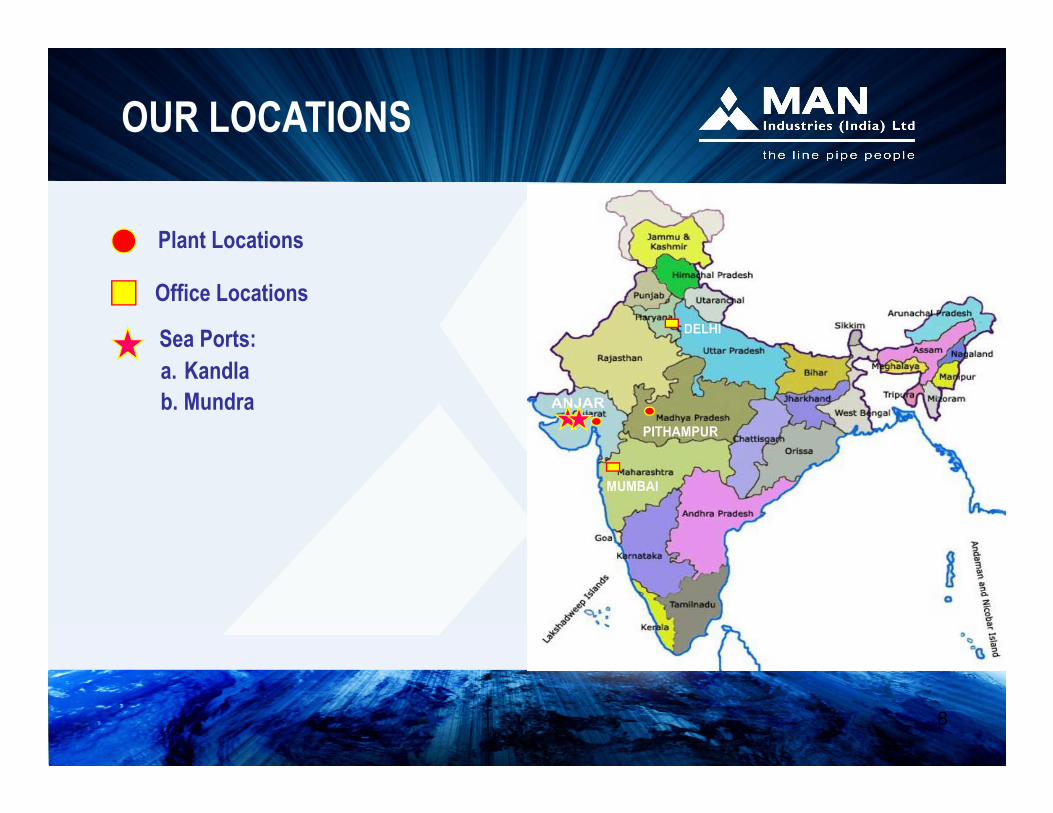
Plant Locations
Office Locations
Sea Ports:
a. Kandla
b. Mundra
OUR LOCATIONS
8
b. Mundra
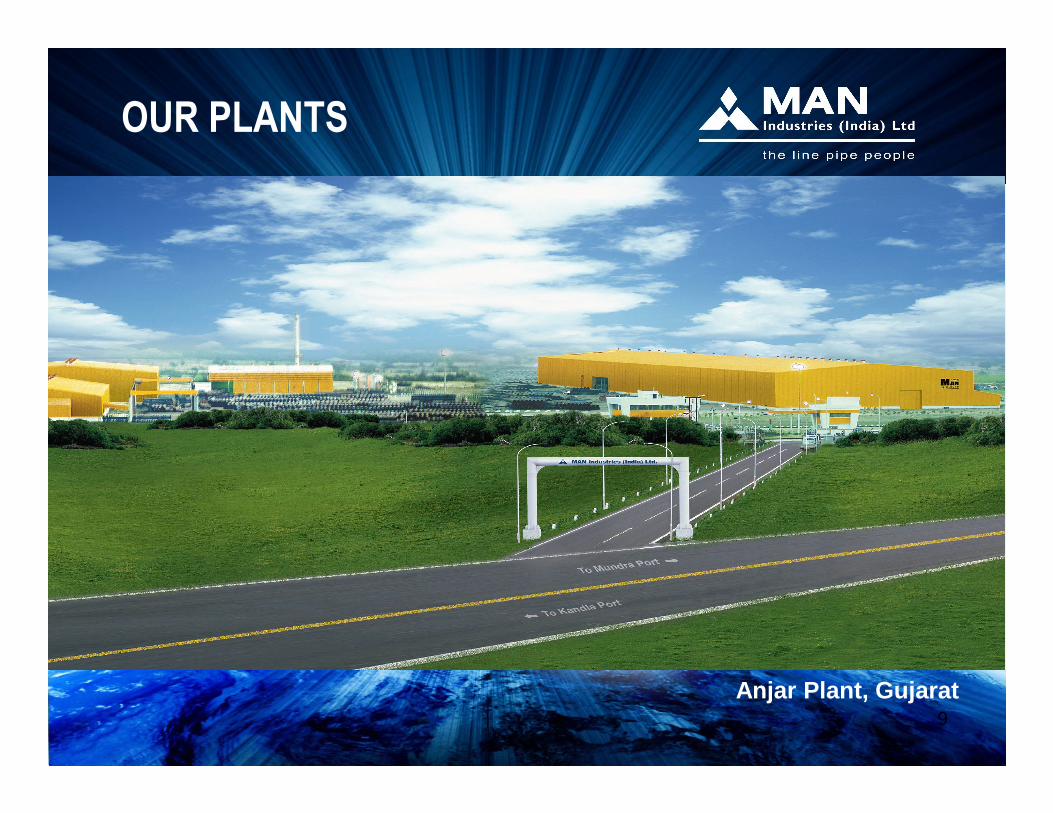
OUR PLANTS
9Anjar Plant, Gujarat
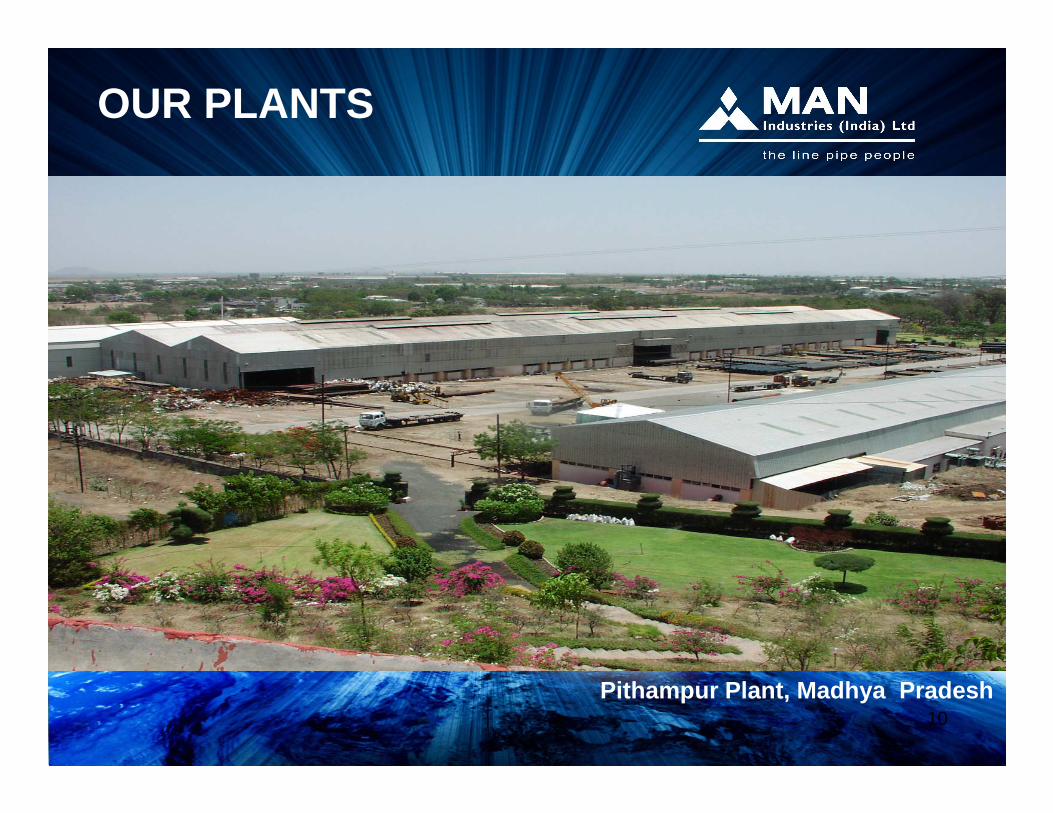
OUR PLANTS
10Pithampur Plant, Madhya Pradesh
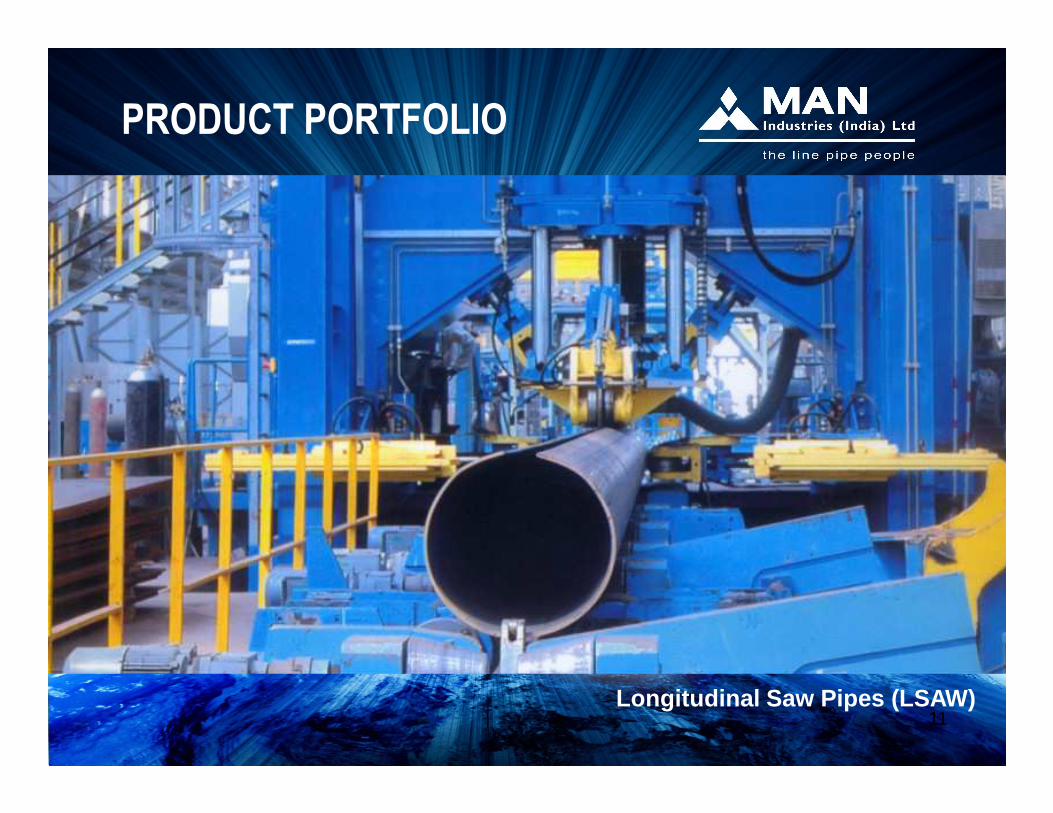
PRODUCT PORTFOLIO
11Longitudinal Saw Pipes (LSAW)
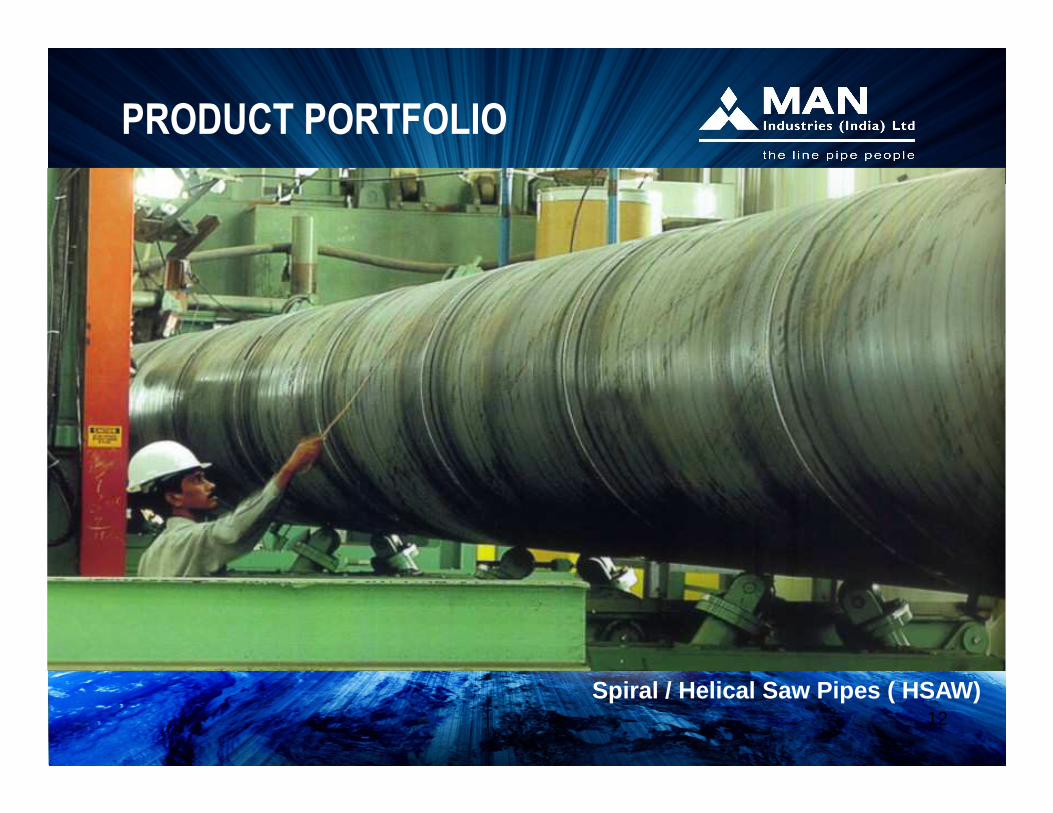
PRODUCT PORTFOLIO
12Spiral / Helical Saw Pipes ( HSAW)
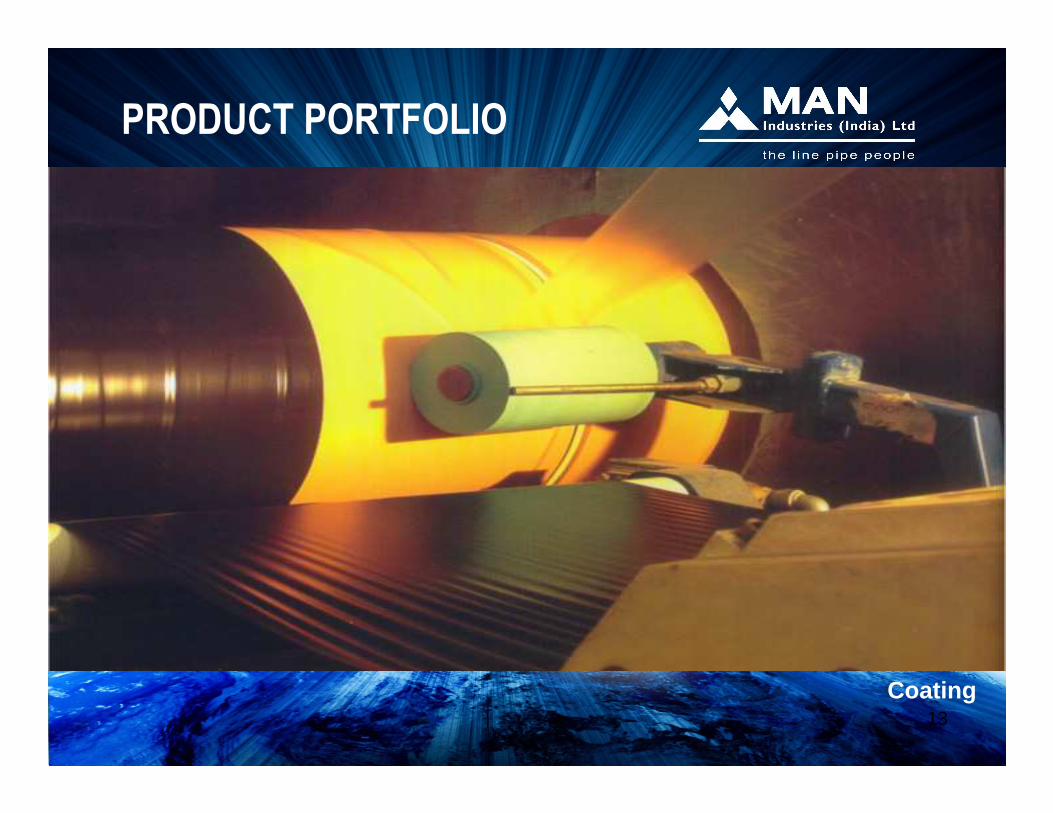
PRODUCT PORTFOLIO
13Coating
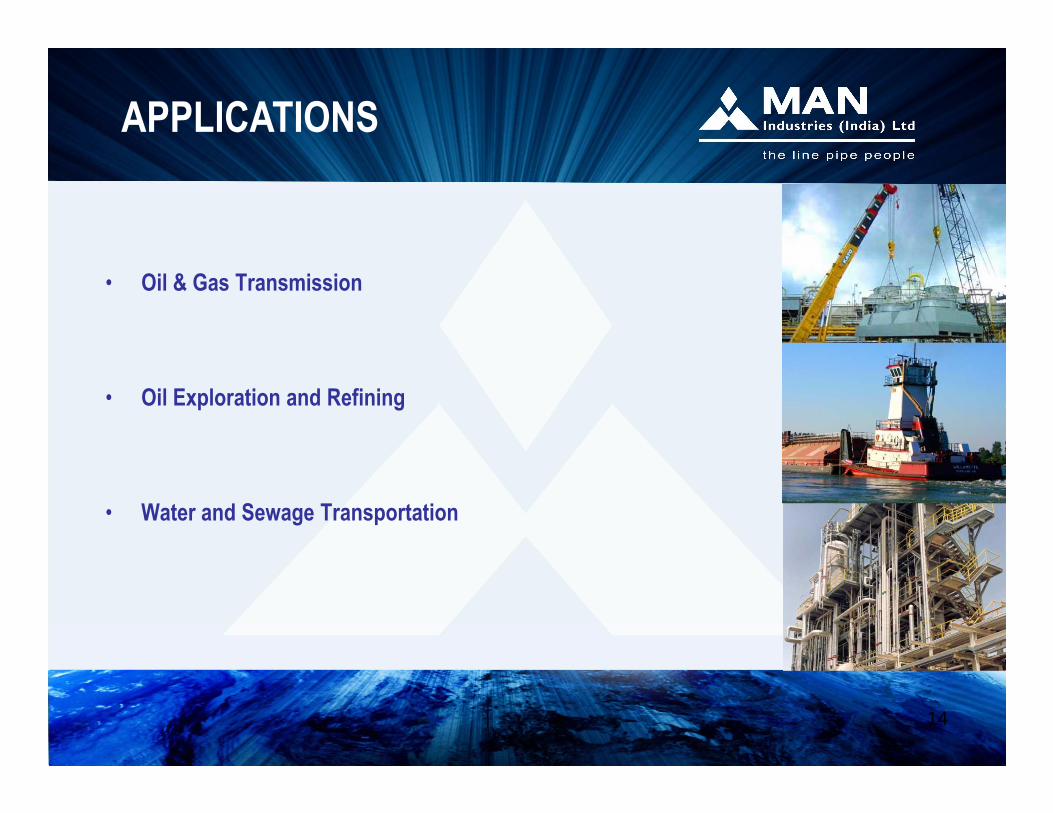
• Oil & Gas Transmission
• Oil Exploration and Refining
APPLICATIONS
14
• Oil Exploration and Refining
• Water and Sewage Transportation
Some of the biggest names in the Energy industry, including some of the frontline Fortune 500 companies in India and abroad are our clients .
International Clients
ESTEEMED CLIENTELE
15

International Clients
ESTEEMED CLIENTELE
16
International Clients
ESTEEMED CLIENTELE
17
Domestic Clients
ESTEEMED CLIENTELE
18
ESTEEMED CLIENTELE
Domestic Clients
19
• ISO 9001, 14001, 18001 certification for all divisions.
• American Petroleum Institute (API) Certification
• Government recognized 2 STAR “EXPORT HOUSE” status
ACCREDITATIONS & AWARDS
20
• Recipient of GAIL AWARD 2010-11
• Recipient of EEPC’s STAR PERFORMER AWARD 2009-10
• Recipient of EEPC’s STAR PERFORMER AWARD 2008-09
• Recipient of NIRYAT SHREE AWARD OF FIEO 2001-02
• Recipient of EEPC AWARD 1996, 1999, 2002
• Recipient of RAJEEV RATNA AWARD 1994
• Recipient of UDYOG RATNA AWARD 1995
ACCREDITATIONS & AWARDS
21
• Recipient of UDYOG RATNA AWARD 1995
• Recipient of MANAGEMENT EXCELLENCE AWARD 1995
• Recipient of EXPORT EXCELLENCE AWARD 1993 & 1994

DETAILS OF BALANCE SHEET AND RATIOS
Particulars
( in ` million) `
FY 2010 FY 2011 FY 2012 FY 2013 FY 2014
Share Cap 267 276 276 298 285
Reserves 4365 5219 6173 6248 6320
FINANCIAL PERFORMANCE
22
Reserves 4365 5219 6173 6248 6320
Loans 3084 1832 643 3686 3774
Net Fixed Assets 4221 3866 3489 3971 4049
NWC 3696 3632 2289 4257 5346
D/E 0.66 0.33 0.10 0.55 0.57
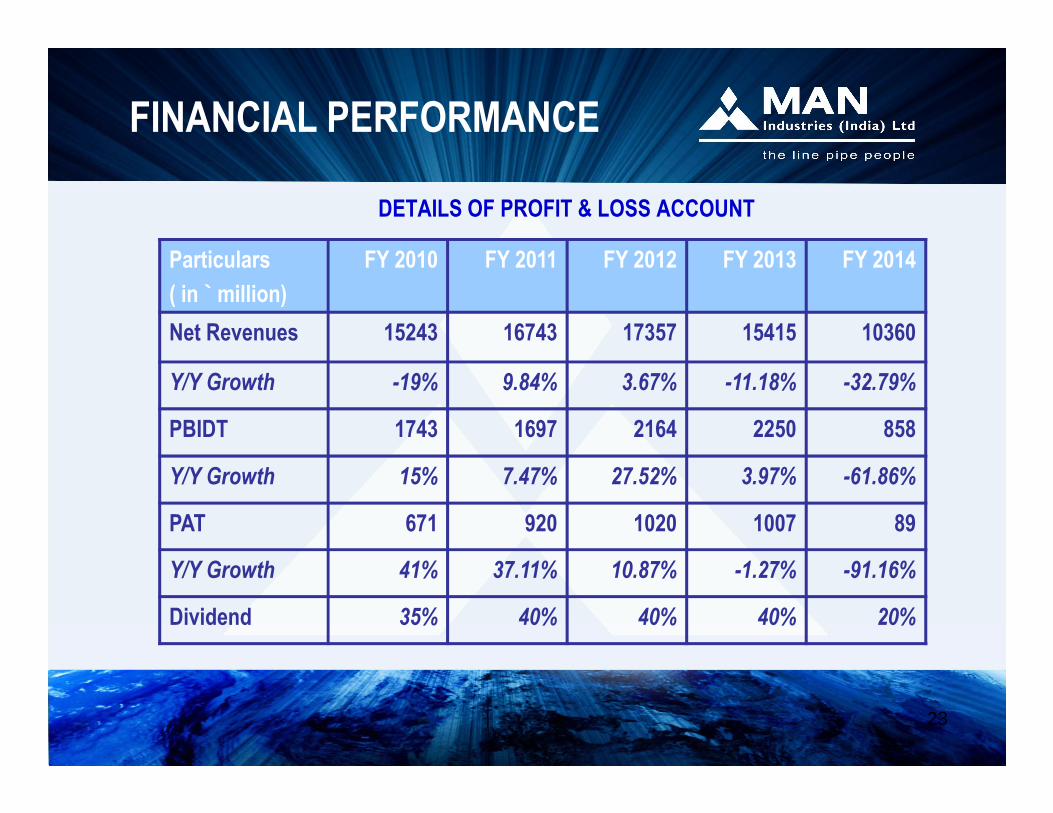
DETAILS OF PROFIT & LOSS ACCOUNT
Particulars
( in ` million)
FY 2010 FY 2011 FY 2012 FY 2013 FY 2014
Net Revenues 15243 16743 17357 15415 10360
Y/Y Growth -19% 9.84% 3.67% -11.18% -32.79%
FINANCIAL PERFORMANCE
23
PBIDT 1743 1697 2164 2250 858
Y/Y Growth 15% 7.47% 27.52% 3.97% -61.86%
PAT 671 920 1020 1007 89
Y/Y Growth 41% 37.11% 10.87% -1.27% -91.16%
Dividend 35% 40% 40% 40% 20%
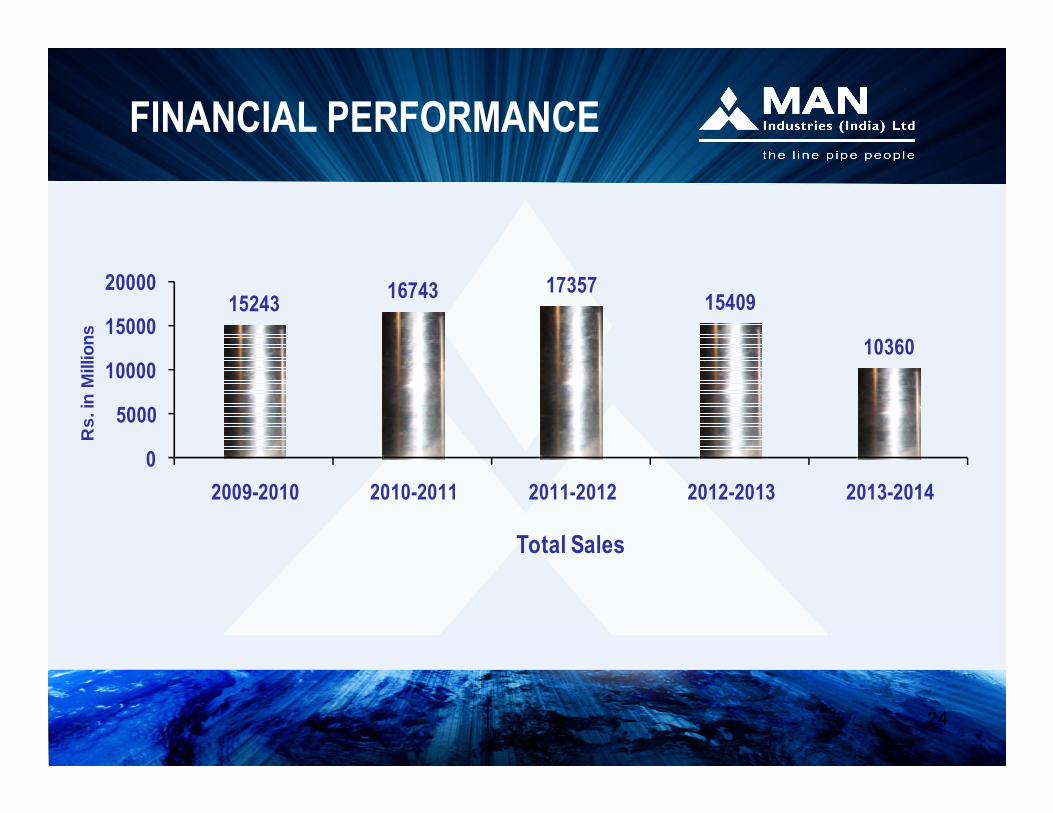
1524316743 17357
15409
10360
5000
10000
15000
20000
Rs.
in M
illion
s
FINANCIAL PERFORMANCE
24
0
5000
2009-2010 2010-2011 2011-2012 2012-2013 2013-2014
Rs.
in M
illion
s
Total Sales

1743 1697
2164 2250
858920 1020 10071000
1500
2000
2500
Rs
in M
illio
ns
FINANCIAL PERFORMANCE
25
858671
920 1007
890
500
1000
2009-2010 2010-2011 2011-2012 2012-2013 2013-2014
Rs
in M
illio
ns
PBIDT PAT

Particulars
( in ` million)
Q4
FY13
Q1
FY14
Q2
FY14
Q3
FY14
Q4
FY14
Net Revenues 2656 1717 1676 3215 3750
QUARTERLY PERFORMANCE
FINANCIAL PERFORMANCE
26
Net Revenues 2656 1717 1676 3215 3750
EPS 3.38 0.40 0.26 0.42 0.47
PBIDT 628 192 189 233 244
PAT 196 23 15 24 27

QUARTERLY PERFORMANCE
2656
1717 1676
32153750
2000
3000
4000
Rs.
in M
illio
ns
FINANCIAL PERFORMANCE
27
1717 1676
0
1000
2000
Q4 FY 13 Q1 FY 14 Q2 FY 14 Q3 FY 14 Q4 FY 14
Rs.
in M
illio
ns
Net Revenue

628
192 189 233 244197200
400
600
800
Rs
in M
illi
on
s
QUARTERLY PERFORMANCE
FINANCIAL PERFORMANCE
28
23 15 24 270
200
Q4 FY13 Q1 FY14 Q2 FY14 Q3 FY14 Q4 FY14
2013 - 2014
Rs
in M
illi
on
s
EBIDTA PAT
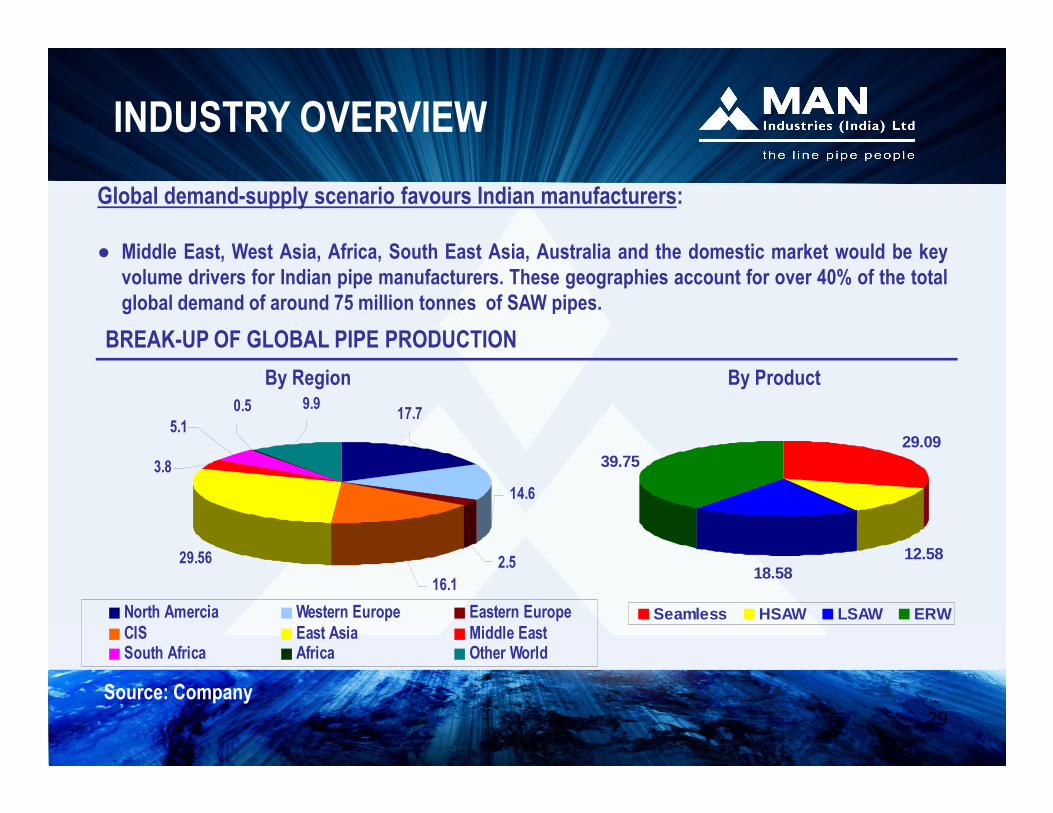
Global demand-supply scenario favours Indian manufacturers:
● Middle East, West Asia, Africa, South East Asia, Australia and the domestic market would be keyvolume drivers for Indian pipe manufacturers. These geographies account for over 40% of the totalglobal demand of around 75 million tonnes of SAW pipes.
By Region By Product
BREAK-UP OF GLOBAL PIPE PRODUCTION
17.79.90.5
INDUSTRY OVERVIEW
29Source: Company
29.09
12.5818.58
39.75
Seamless HSAW LSAW ERW
29.56
16.1
2.5
14.6
17.79.90.5
5.1
3.8
North Amercia Western Europe Eastern Europe CIS East Asia Middle EastSouth Africa Africa Other World
GLOBAL DEMAND TRIGGERS
• Increasing Gas focused E & P activity due to oil shortage
• Rising demand for gas; Gas is considered as the future fuel- Shale gas to be gamechanger
• Increase in refining capacity
• Inter-regional oil & gas demand supply mismatch, resulting in need of Oil & GasInfrastructure and Trans-country pipelines. Need to connect marginal oil fields with mainInfrastructure and Trans-country pipelines. Need to connect marginal oil fields with mainhubs
• Cost-effective, eco-friendly mode of transportation
• Global energy demand to be remain strong in the near future. Strong demand expectedfrom “New Markets” like South America, Africa and Australia.
• Indian companies best placed to exploit robust global demand due to low cost ofmanufacturing and high productivity
3.5
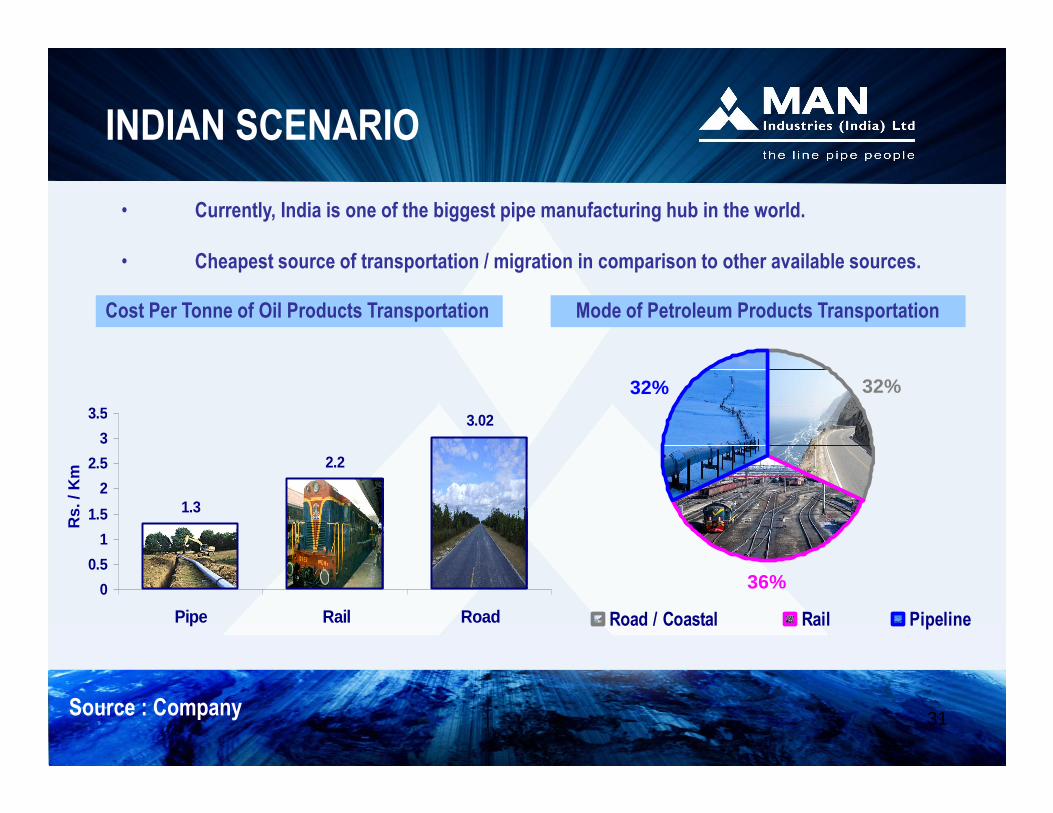
Cost Per Tonne of Oil Products Transportation Mode of Petroleum Products Transportation
• Currently, India is one of the biggest pipe manufacturing hub in the world.
• Cheapest source of transportation / migration in comparison to other available sources.
32% 32%
INDIAN SCENARIO
31
3.02
1.3
2.2
0
0.5
1
1.5
2
2.5
3
3.5
Pipe Rail Road
36%
Road / Coastal Rail Pipeline
Rs.
/ K
m
Source : Company
• Proposed National Gas Highway Network. (Gas Grid)
• Increase in exploration activity by E & P companies.
• Infrastructure required to transport gas to the consuming states.
• India’s Pipeline infrastructure is under invested. Currently, only 1/3 of
INDIAN DEMAND TRIGGERS
32
• India’s Pipeline infrastructure is under invested. Currently, only 1/3 ofIndia’s petroleum products move through pipelines.
• Pipeline density in India is 3 km /1000 sq km as compared to 50 km /1000sq km in USA, UK and China.
• Domestic demand estimated at over 21,000 km over the next 5 years.
• Govt. impetus to improve Water infrastructure.
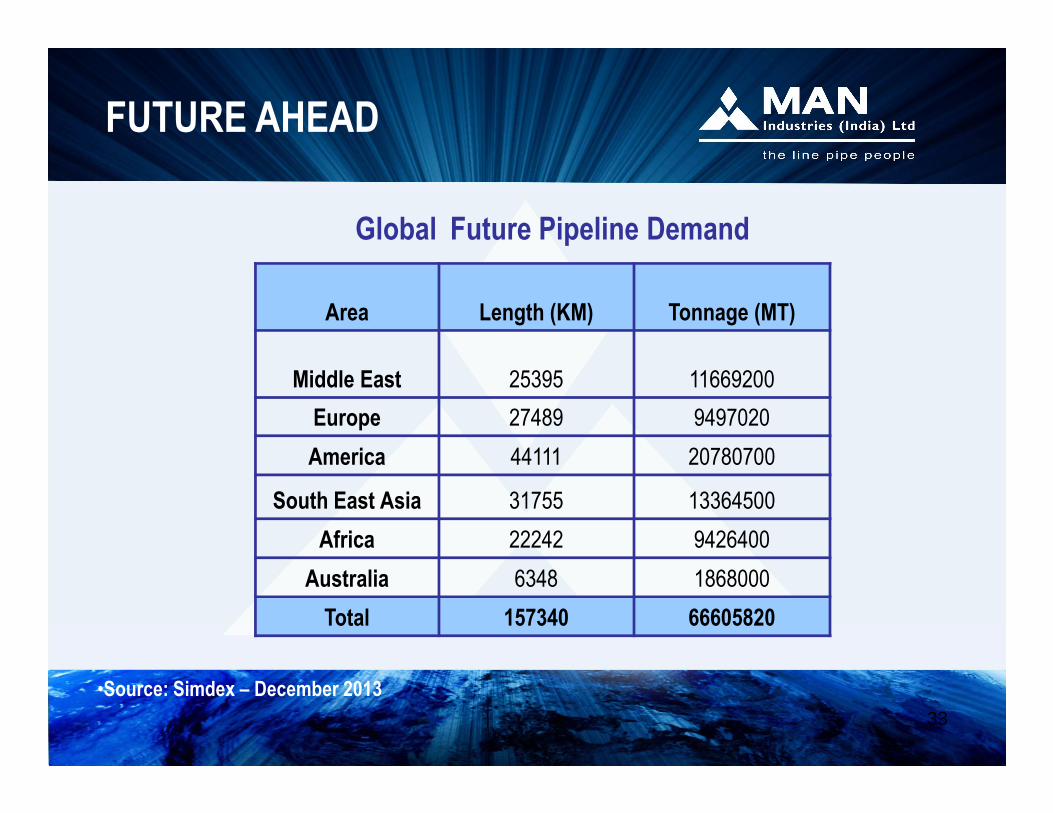
Global Future Pipeline Demand
FUTURE AHEAD
Area Length (KM) Tonnage (MT)
Middle East 25395 11669200
Europe 27489 9497020
33
•Source: Simdex – December 2013
Europe 27489 9497020
America 44111 20780700
South East Asia 31755 13364500
Africa 22242 9426400
Australia 6348 1868000
Total 157340 66605820

UPCOMING PROJECTS SCENARIO IN THE MIDDLE EAST NEXT 5 YEARS
Sr. No Region Length (km) Tonnage (MT)
1 UAE 2820 646600
2 OMAN 2370 774000
3 SAUDI ARABIA 4400 21970003 SAUDI ARABIA 4400 2197000
4 IRAN 5650 3016000
5 IRAQ 6435 3345600
6 QATAR 2845 1519000
7 KUWAIT 875 171000
Total 25395 11669200
• Source: Simdex – December 2013
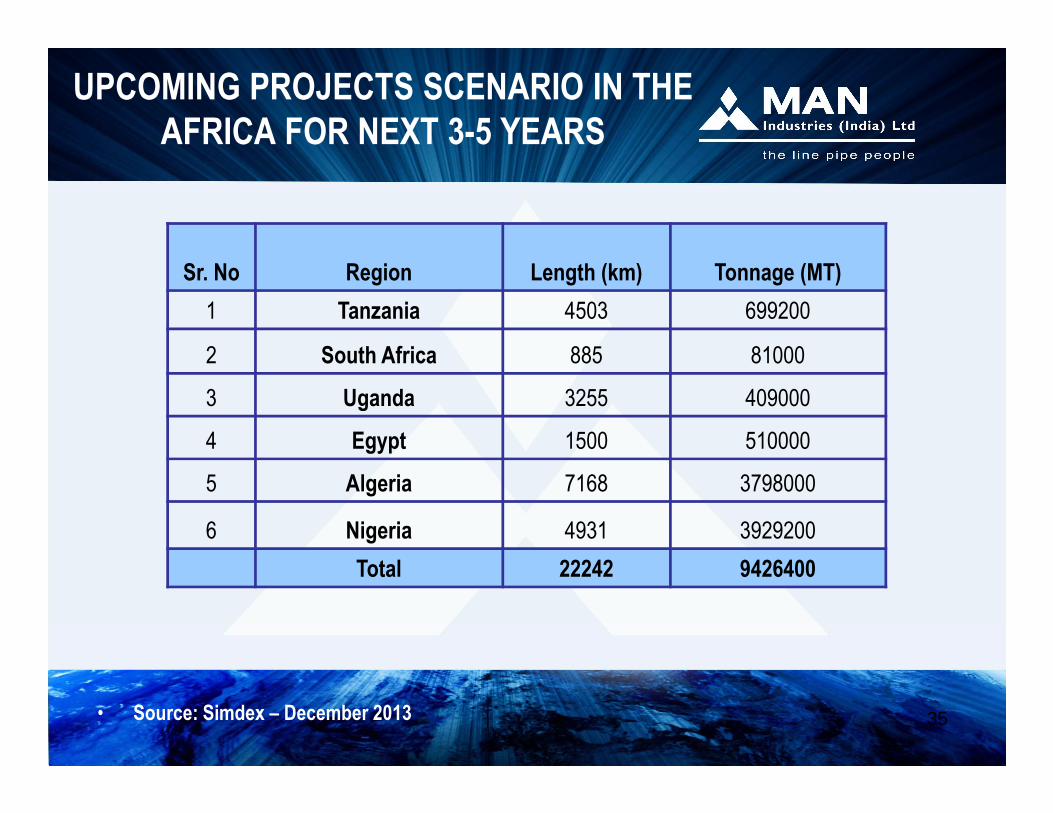
UPCOMING PROJECTS SCENARIO IN THE AFRICA FOR NEXT 3-5 YEARS
Sr. No Region Length (km) Tonnage (MT)
1 Tanzania 4503 699200
2 South Africa 885 81000
3 Uganda 3255 409000
35
3 Uganda 3255 409000
4 Egypt 1500 510000
5 Algeria 7168 3798000
6 Nigeria 4931 3929200
Total 22242 9426400
• Source: Simdex – December 2013

UPCOMING PROJECTS SCENARIO IN THE SOUTH EAST ASIA NEXT 5 YEARS
Sr. No. Region Length (Km) Tonnage (MT)
1 BANGLADESH 416 97000
2 CHINA 11795 4164000
3 INDONESIA 6823 2323000
4 JAPAN 19 2300
36
4 JAPAN 19 2300
5 MALAYSIA 5516 2313000
6 PHILIPPINES 320 44600
7 VIETNAM 928 176000
8 KOREA 4370 3040000
Total 30187 12159900
• Source: Simdex – December 2013
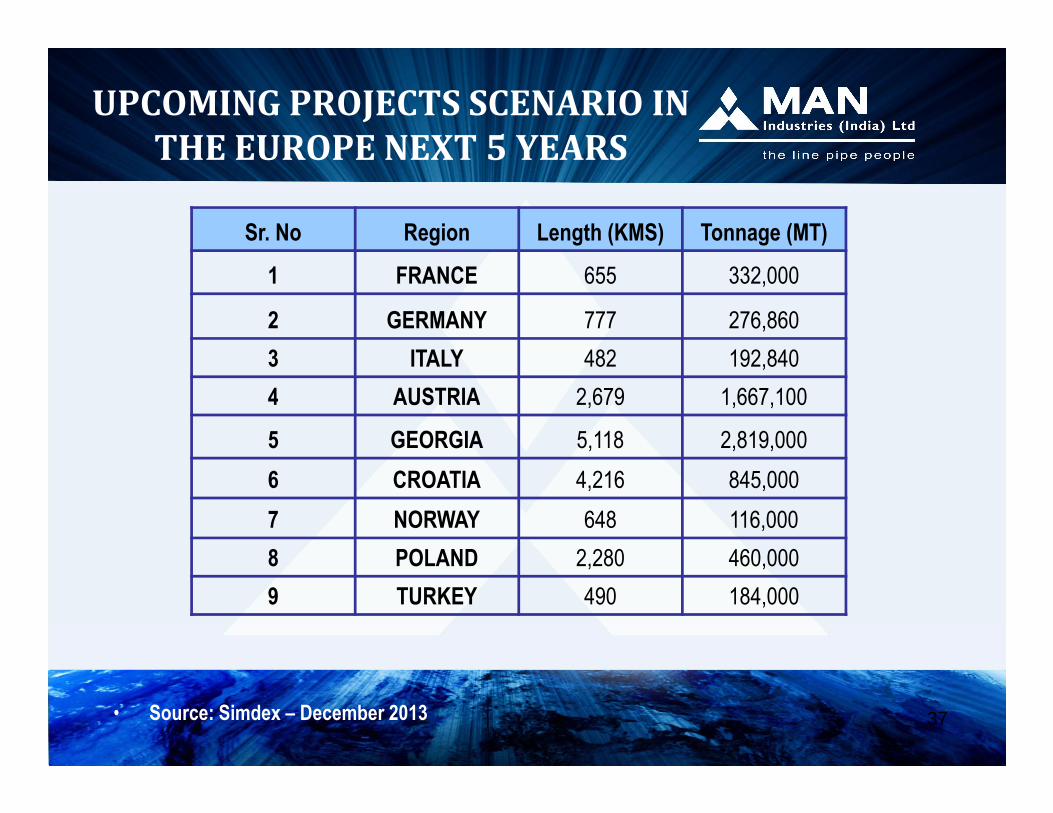
UPCOMING PROJECTS SCENARIO IN
THE EUROPE NEXT 5 YEARS
Sr. No Region Length (KMS) Tonnage (MT)
1 FRANCE 655 332,000
2 GERMANY 777 276,860
3 ITALY 482 192,840
4 AUSTRIA 2,679 1,667,100
37
4 AUSTRIA 2,679 1,667,100
5 GEORGIA 5,118 2,819,000
6 CROATIA 4,216 845,000
7 NORWAY 648 116,000
8 POLAND 2,280 460,000
9 TURKEY 490 184,000
• Source: Simdex – December 2013
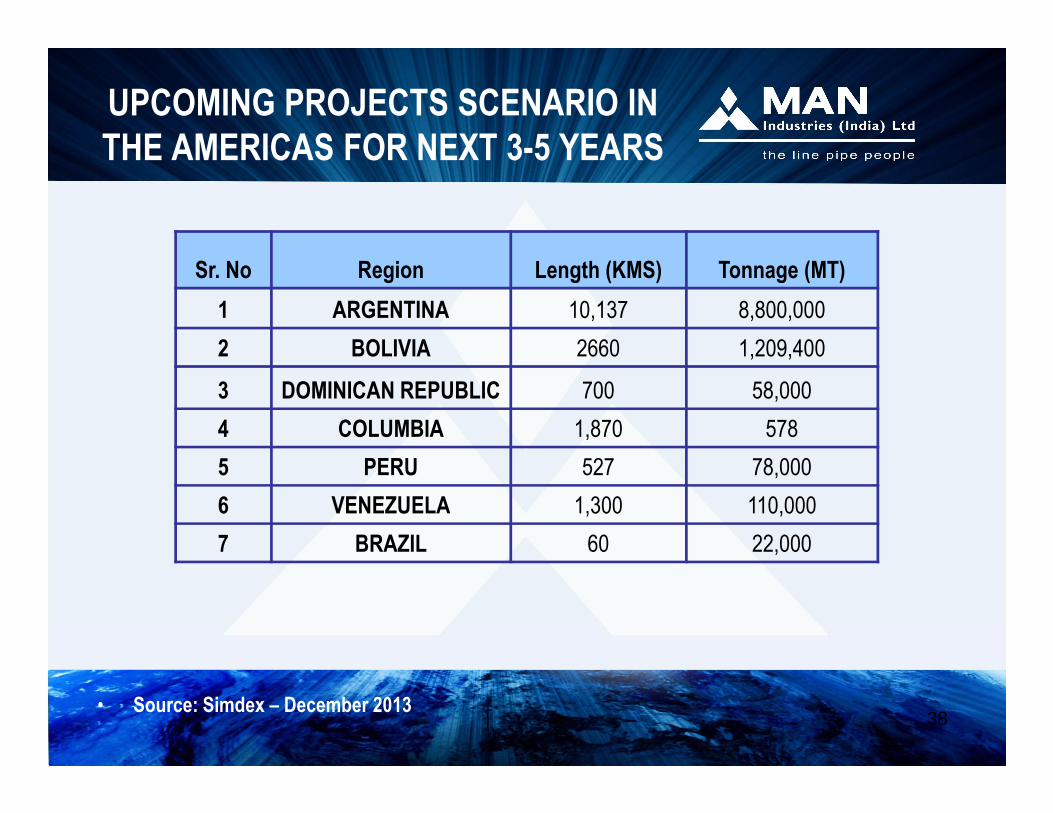
UPCOMING PROJECTS SCENARIO IN THE AMERICAS FOR NEXT 3-5 YEARS
Sr. No Region Length (KMS) Tonnage (MT)
1 ARGENTINA 10,137 8,800,000
2 BOLIVIA 2660 1,209,400
3 DOMINICAN REPUBLIC 700 58,000
38
4 COLUMBIA 1,870 578
5 PERU 527 78,000
6 VENEZUELA 1,300 110,000
7 BRAZIL 60 22,000
• Source: Simdex – December 2013
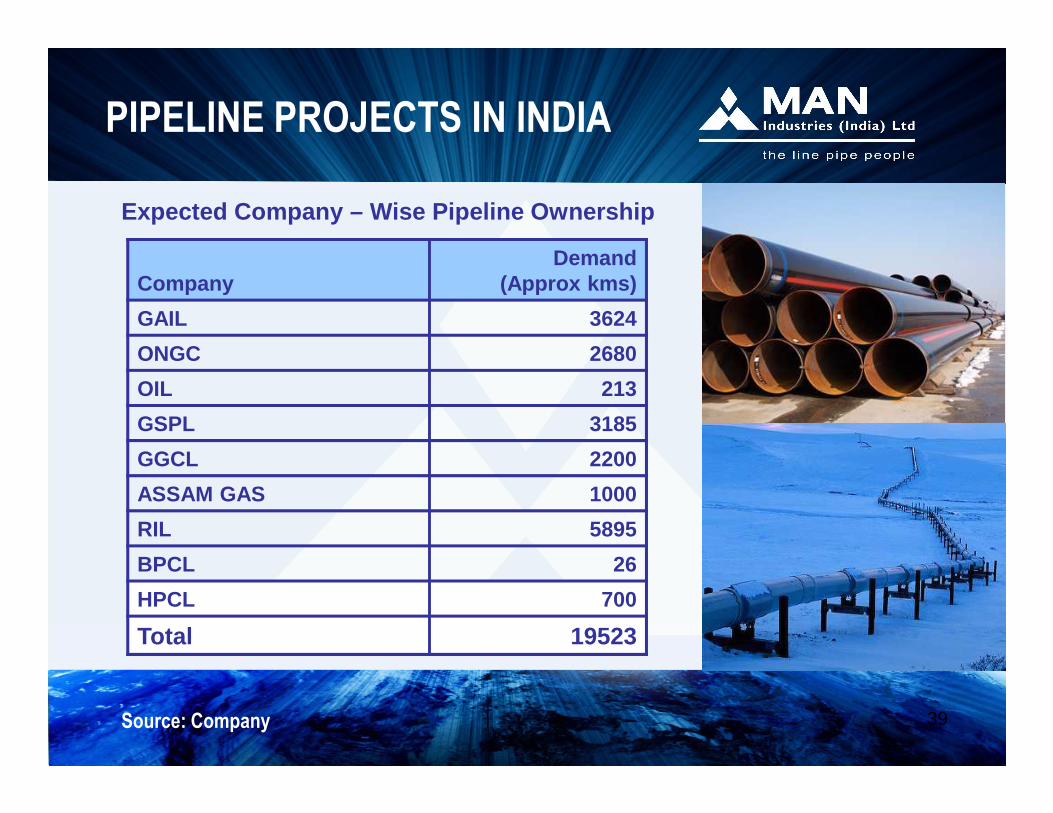
CompanyDemand
(Approx kms)
GAIL 3624
ONGC 2680
OIL 213
Expected Company – Wise Pipeline Ownership
PIPELINE PROJECTS IN INDIA
39
GSPL 3185
GGCL 2200
ASSAM GAS 1000
RIL 5895
BPCL 26
HPCL 700
Total 19523
Source: Company

• Low capital cost due to selection of 3RBE technology.
• Low operational costs - India advantage.
• Strategically placed to cater to the demand of both LSAW & HSAWline pipe segments.
COMPETITIVE ADVANTAGE
• Integrated Pipe Plant with coating facilities.
• Anjar facility located close to Mundra and Kandla ports whichenhances export competitiveness.
• Lean Organisation.
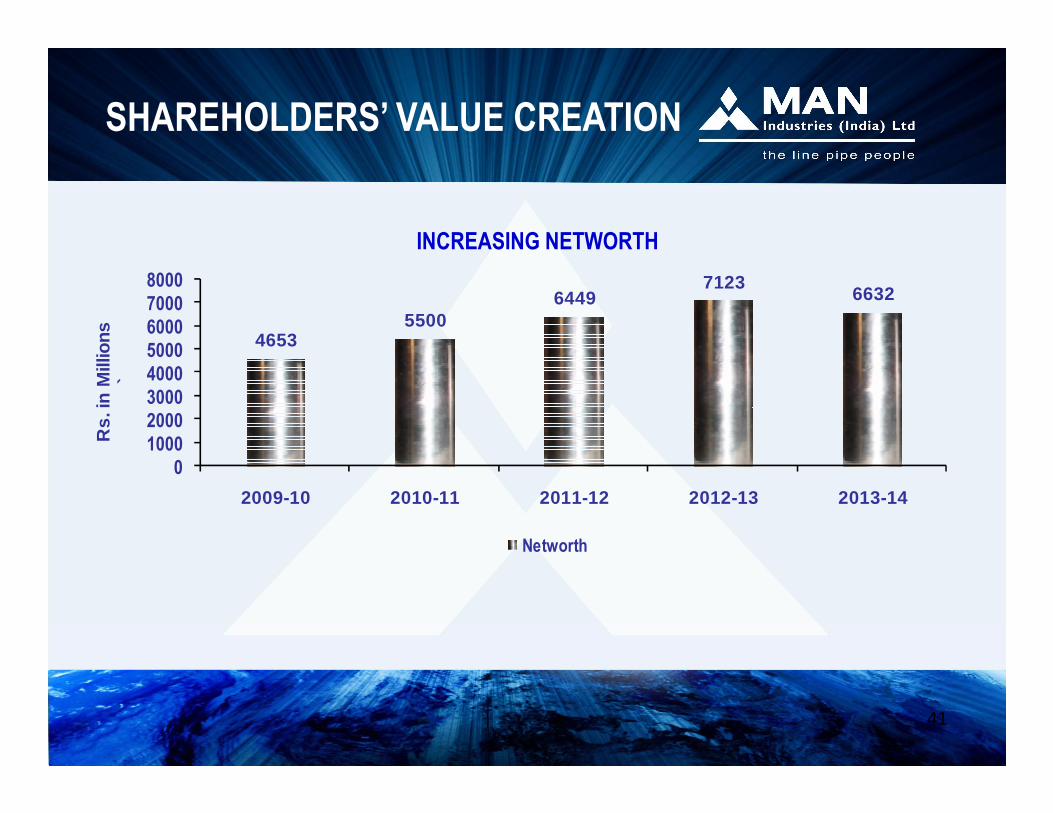
INCREASING NETWORTH
46535500
64497123
6632
300040005000600070008000
Rs.
in M
illion
s`
SHAREHOLDERS’ VALUE CREATION
41
0100020003000
2009-10 2010-11 2011-12 2012-13 2013-14
Rs.
in M
illion
s
Networth
SHAREHOLDERS’ VALUE CREATION
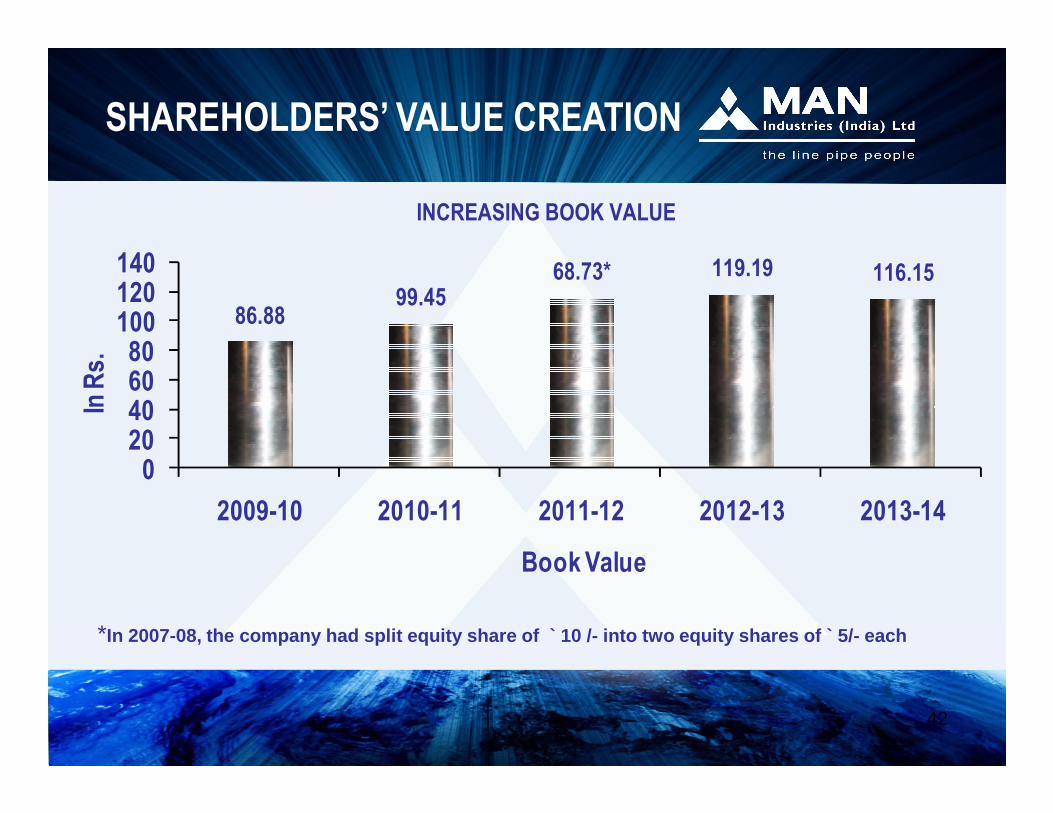
86.8899.45
68.73* 119.19 116.15
406080
100120140
In R
s.
INCREASING BOOK VALUE
42
02040
2009-10 2010-11 2011-12 2012-13 2013-14
In R
s.
Book Value
*In 2007-08, the company had split equity share of ` 10 /- into two equity shares of ` 5/- each
• Annual growth seen at 10-15% YoY basis for the next 3 to 5 years withoutsignificant CAPEX.
• Profitability growth to be maintained with positive bias on EBIDTA margins.
• Determined to capitalize on the present capacities to ensure growth.
• With a view of focused vision, Company has announced a Scheme of
GOING FORWARD
• With a view of focused vision, Company has announced a Scheme ofDemerger/ Merger of which resultant Structure – Two Listed Companies withmirror shareholding of public shareholders in both the companies.
• Scheme of Arrangement is subject require approval from Jurisdictional HighCourt, SEBI, Stock Exchanges and Corporate Law Authorities.
• MAN Infra to issue 1 equity share of Rs. 5/- (free of cost) for every 1 equityshare of Rs. 5/- of MAN Industries – MAN Infra to get listed.
• Volatility in raw material prices.
• Any protectionist measures like import duties imposed by thegovernment of importing countries.
CHALLENGES AHEAD
44
• Volatile Currency.
• Global Economic Challenges .
Disclaimer
Certain statements made in this presentation may not be based on historical information or facts and may be “forward looking
statements,” including those relating to general business plans and strategy of Man Industries (India) Ltd. (MIIL) its futureoutlook and growth prospects, and future developments in its businesses and its competitive and regulatory environment.Actual results may differ materially from these forward-looking statements due to a number of factors, inter alia including futurechanges or developments in MIIL's business, its competitive environment, its ability to implement its strategies and initiativesand respond to technological changes and political, economic, regulatory and social conditions in India. This presentation doesnot constitute a prospectus, offering circular or offering memorandum or an offer invitation, or a solicitation of any offer, topurchase or sell, any shares of MIIL and should not be considered or construed in any manner whatsoever as a recommendationthat any person should subscribe for or purchase any of MIIL's shares. Neither this presentation nor any other documentation or
45
that any person should subscribe for or purchase any of MIIL's shares. Neither this presentation nor any other documentation orinformation (or any part thereof) delivered or supplied under or in relation there to shall be deemed to constitute an offer of or aninvitation by or on behalf of MIIL to subscribe for or purchase any of its shares.
MIIL, as such, makes no representation or warranty, express or implied, as to, and does not accept any responsibility or liabilitywith respect to, the fairness, accuracy, completeness or correctness of any information or opinions contained herein. Theinformation contained in this presentation, unless otherwise specified is only current as of the date of this presentation. MIILassumes no responsibility to publicly amend, modify or revise any forward looking statements contained herein, on the basis ofany subsequent development, information or events, or otherwise. Unless otherwise stated in this document, the informationcontained herein is based on management information and estimates. The information contained herein is subject to changewithout notice and past performance is not indicative of future results. MIIL may alter, modify or otherwise change in any mannerthe content of this presentation, without obligation to notify any person of such revision or changes.
THANK YOU!
46
THANK YOU!
Presentation released on 25.06.2014