global & local economic review
TRANSCRIPT

�All right reserved
Editorial Offices: Corso Umberto I , n . 83 - 65�22 PescaraTel . +39 08542�9�09 – Fax +39 08542�9380
Website: www.gler.itE-mail: [email protected]
Global & LocalEconomic Review
EDITORIAL BOARD
NICOla aCOCElla, “la Sapienza” University of RomeMaRIO aRCEllI V, l.U.I.S.S. University of Rome
PIERlUIGI CIOCCa, “luigi Einaudi Foundation” of TurinalBERTO QUaDRIO CURZIO, “Cattolica del Sacro Cuore” University of Milan
GIUSEPPE DE RITa, President of CENSIS FoundationMaURO GallEGaTI, University of ancona
aDRIaNO GIaNNOla, “Federico II” University of NaplesGIaNaNDREa GOISIS, University of Milan
GalEaZZO IMPICCIaTORE, “la Sapienza” University of RomePaOlO lEGRENZI, “IUaV” University of Venice
NICOla MaTTOSCIO, University of Chieti-PescaralUIGI PaGaNETTO, “Tor Vergata” University of Rome
GUIDO PaGGI, “S. Pio V” University of RomeVINCENZO PaTRIZI, University of Florence
MaRIa PaOla POTESTIO, “Roma Tre” University of RomeGIaN CESaRE ROMaGNOlI, “Roma Tre” University of Rome
alDO ROMaNO, “e-Business Management School ISUFI” University of leccePIER lUIGI SaCCO, “IUaV” University of Venice
DOMINICK SalVaTORE, “Fordham” University of New YorkPaSQUalE lUCIO SCaNDIZZO, “Tor Vergata” University of Rome
GIUlIaNO SEGRE, University of VeniceJOSEPH STIGlITZ, Nobel Prize-winning economist, “Columbia” University of New York
KUMaRaSWaMY VEla VElUPIllaI , University of TrentoMaURIZIO VICHI, “la Sapienza” University of Rome
STEFaNO ZaMaGNI, University of BolognaSTEFaNO ZaMBEllI, University of Trento
Editing and revisingDONaTElla FURIaalINa CaSTaGNa
ISSN (print) �722-424� ISSN (online) �974-5�25
Aut. Trib. PE n. 7 del 14.7.1999, No. 2/2009Editor
Nicola Mattoscio
«Global & Local Economic Review» is included in JEL on CD, e-JEL and Econlit,the electronic indexing and abstracting service
of the American Economic Association


Tracce Edition
Global & LocalEconomic ReviewVolume 14 No. 1 2010
SOMMARIO
Alina Castagna, Donatella FuriaGlobalization and its dimensions Pag. 5
Olga Marzovilla, Marco MeleFrom Dollar Peg to Basket Peg: The experienceof Kuwait in view of the GCC monetary unification “ �9
Mario GiaccioThe internationalisation of retail businesses:The emblematic fashion clothing sector “ 49
Cosimo Magazzino“Wagner’s law” in Italy: empirical evidencefrom �960 to 2008 “ 9�
Edgardo Bucciarelli, Nicola Mattoscio, Domenico ScamuffaE-learning diffusion among european SMEs andits relationship with economic performance “ ��7

4

5
1 The autors wish to thank Ernesto Savaglio for his helpful comments.2 A first draft of this paper has been presented at the European Integration - New Challenge for the Romanian Economy - International Scientific Conference, 5th Edition, University of Oradea, Faculty of Economics.
Abstract
In spite of its frequent use, globalization is an unclear term and there is large consensus on the fact that it is a result of d�namic interactions bet�eena result of d�namic interactions bet�een different factors �hich are related to social a�areness and to human progress���� This paper2 stems from the need to take a further step for�ard in the construction of a multidimensional frame�ork combining different elementar� dimensions of globalization in order to achieve an overall assessment of integration across countries�� �tarting from a de��nition of a sustainable globalization, �e�tarting from a de��nition of a sustainable globalization, �e implement a k-means Clustering Algorithm to classif� 71 countries into three groups b� considering a data set of 14 selected variables as indicators of the main dimensions of a sustainable globalization in 2006��
JEL CLassifiCation: E60, F0,F�5,F43,O�
KEywords: globalization, cluster analysis, k-means algorithm, international ranking��
Introduction.
There is a large consensus in the international community on the idea that studies on globalization require a careful analysis of numerous factors which are likely to affect development dynamics
G. & L. E. R., Vol. 14 No. 1, 2010
Castagna A., Furia D.1
GLOBALIzATION AND ITS DIMENSIONS

6
and not just economic integration.This paper focuses on a selection of indicators and their assessment, as
a preliminary step in building a composite index, it may be appropri-ate to proceed in three complementary steps: the selection of those variables which are representative of the phenomenon (descriptive phase); the aggregation of indicators, for each unit of analysis, across the domains of globalization (aggregation phase); and a logical conclusion starting from the results of the previous steps (inference phase) (Chiappero Martinetti 2005). The second phase received most of attention in our earlier works (Mattoscio, Castagna and Furia 2007, Furia and Castagna 2008), which focused on the need to overcome some controversial problems about the definition of the relative weight of each indicator in the overall index.
Nevertheless, our results and other empirical studies (lockwood 200�, Heshmati 2006) have shown that the selection of relevant variables can affect the final rank more than the changes in weight-ing procedures (de lombearde and Iapadre 2008). By aiming at improving the framework to measure country integration in the global community, this paper provides an evaluation of the suit-ability of data.
This will be done by implementing a k-means Clustering algo-rithm to classify 7� countries into three groups taking into account a data set of �4 selected variables with reference to 2006.
The paper is organized as follows. First, we introduce the se-lection of indicators beginning with a critical review of literature about globalization and its role in the process of development. Section two presents the main results of the data analysis and sec-tion three concludes.
1. A critical review of Globalization literature
There are few studies dealing with multidimensional frame-works of globalization and most of them concern criticisms and improvements (andersen 2003, lockwood 2004) of a pioneer work about this argument, namely A��T�� Kearne� Foreign Polic� Magazine Index (Kearney a.T. 200�a, 200�b, 2006). This index is an assessment
Globalization and its dimension
7
of globalization as a result of economic, technological and political integration. However, there are lots of international organizations that use synthetic indexes to monitor global and complex phenom-ena which represent some different expressions of integration, like human development, global competitiveness, human rights and environment preservation (UNDP �990-2007, WEF 2004 – 08, la Camera 2005; Wackernagel et al. 2004, www.rsf.org).
a multidimensional index is a continuous real valued function which summarize the information about a given distribution. Each distribution is represented by an nxK matrix X=xik є M(n), where M(n) is the set of nxd matrices with non negative elements, d stands for the set of D attributes (d= [�, 2, …D]) and i = [�,2, … n] is the set of n individuals (countries). let xi represent the row vector of attributes for the i-th individual and xd the column vector of the d-th attribute among countries, the multidimensional index can be expressed by the following function ( ) ℜ→= )(nMXI n (lugo 2005).
It stands for a score representing the country position in the international ranking. In defining this function, decisions about the extent to which each attribute or dimension is assumed to contribute to the overall score hade to be made. On one hand, the weight system is defined on the basis of subjective criteria, on the other hand factorial analysis methods may be useful to overcome individual biases. In these direction studies on the well being and poverty are drown by making use of fuzz� set theor� (Zadeh �965; Dubois and Prade �980; Basu �987; Cerioli and Zani �990; Cheli et al. �994, �995, �999; Ok �995; Chiappero Martinetti �994, �996, 2000, 2005; Baliamoune et al�� 2003, 2006, Bérenger and Verdier Chouchane 2007), which is based on the idea that “(…) a fuzz� set is a class �ith a continuum of grades of membership (…)�� Essentiall�, such a frame�ork provides a natural �a� of dealing �ith problems in �hich the source of imprecision is the absence of sharpl� de��ned criteria of a class membership (…)” (Zedeh �965, p. 339).
Dealing with the aggregation of information across dimensions for each units of analysis is just one of the problems inherent with a multidimensional framework. Ravallion (2004) argues that the selec-tion of indicators is a crucial point in the debate between globalization
Castagna A��, Furia D�� G�� & L�� E�� R�� Vol�� 14 No 1 (2010), 5-18
8
supporters and its discontents because the effects globalization generates on inequality may be affected by inherent value judgment of measure-ments and each opposing thesis may be sustained by data evidence. In these connection, over the last few years, a number of globalization measures concerning economic indicators have made a distinction between prerequisites and outcomes, i.e. reduction of transaction barriers and results of integration dynamics (Brahmbhatt �998). The economic dimension, which was a crucial element of integra-tion in the past centuries, becomes a means of diffusion of ideals able to affect growth dynamics followed by people’s capabilities and improvement of their way of life. Economic integration has produced benefits to those countries which have expanded their commercial borders, especially where governments have played a central role in this process. The other face of the medal are the millions of people for whom globalization has been ran without control and whose living conditions are nowadays worsen off (Stiglitz 2002). The easy way by which people get in touch with other cultures, and the awareness of lifestyles and living conditions different from their own, shift the focus of debate about inequality and poverty from a local point of view to a global level analysis and the related issues begin to gain the same weight of national ones (Milanovic 2002). Studies about globalization effects on per capita income inequality between countries show a convergence evolution over the past two centuries attributable to complex mechanisms at various levels of income hierarchy of citizens all over the world. When life expectanc� at birth is taken into account to examine lifelong income inequality in order to explain this kind of dynamics the result is a current divergence in living conditions which have reached levels like two centuries ago (Bourguignon and Morrison 2002). Ben-David (�993) provides evidence that income convergence among specific industrialized3 countries may be related to movement toward free trade: timing of trade: timing of trade reform coincides with periods of reduction in income disparity, convergence which was not apparent among the same countries
3 France, West Germany, Belgium, The Netherlands, Luxemburg and Italy during the transition period which lasted from 1959 until 1968 (Ben-David 1993, p. 654).
Globalization and its dimension

9
prior their liberalization nor among other industrialized countries.. Focusing on countries’comparative advantage and its implication for trade, Venables (2003) yields predictions about the formation of custom unions leading to the conclusion that agreements betweenthat agreements between low income countries may lead to a divergence of income levels, and to the opposite direction an integration between high income members. Differences in inequality across countries in their start-ing point are crucial in the ongoing debate whether the openness to foreign trade and investment rises the living standards for the poor in developing countries. Starting point conditions are centralStarting point conditions are central in explaining whether poor countries are able or not to take up the opportunities provided by an expanding economy. In his work, Ravallion (200�) argues that there are lots of factors, like location,there are lots of factors, like location, social exclusion, exposure to insured risk and not just endowments of physical and human capital, which need more attention to deter-mine why people all over the world show different performances in meeting globalization. Different long run growth paths, therefore,. Different long run growth paths, therefore, have produced a divergence between rich and poor countries be-cause idiosyncratic characteristics regarding not just their distance from the technological frontier but also desegregation of social and institutional milieu may conduce to an implosion of the system which may lose growth opportunities (Pritchett �997). Olson (�996) has come to similar conclusions drawing on the fact that a subset of the lower income countries, those countries who have adopted relatively good economic policies along with solid institutions, are growing faster than higher income countries. He also tries totries to explain the large differences in per capita income across countries by claiming that this divergence is due to differences in attaining their potentials, which are related to the quality of institutions and economic policies and not to differences in factors of produc-tion4. Stiglitz (2002) advocates that the role of globalization in the development process is not clear and that a number of elements which are the basis of democracy, such as poor people interest,
4 “(...) access to the world’s stock of productive knowledge or to its capital markets, (...) ratio of population to land or natural resources, or (...) the quality of marketable human capital or personal culture.” (Olson 1996, p.19).
Castagna A��, Furia D�� G�� & L�� E�� R�� Vol�� 14 No 1 (2010), 5-18
�0
environment preservation, free trade and human rights, has to be taken into account to reach its bene��cial potentials.
With that caveat in mind, in the present work, the following four elementary globalization domains underlining its sustainable features are selected: economic integration, technological potential, social awareness, environment sustainability. Each of them has been described by selected variables which are showed in the tab �. With reference to our previous works some changes have been made. The economic dimension has been split in two components, one for the prerequisites and the other for the outcomes of globaliza-tion. Income payments and receipts as percentage of GDP has been eliminated from the outcomes and there are three new indicators for the former component: a composite measure of the absence of tariff and non-tariff barriers (Trade freedom5) that affect imports and exports of goods and services, data on the Investment freedom which scrutinizes a country’s overall investment climate and, as a proxy of social and institutional background, data on extensive perceptions of corruption within countries6. Secure Internet servers (per � mil-lion people) are removed from the technological dimension because of its high correlation with Internet users. Workers’ remittances and compensation of employees, received as percentage of GDP, has been substituted by migration flows as percentage of population to analyze the dimension of social awareness. The group of variables representing environment sustainability7 has been replaced by the ecological de��cit (or reserve), as a measure of the reduction of the resources on which human life and biodiversity depend and its trade. The next section will present a data application.
5 The Trade freedom score is based on the trade-weighted average tariff rate and non-tariff barriers. (...) The weighted average tariff uses weights for each tariff based on the share of imports for each good. (...) An NTB penalty is assigned (...) according to a country’s trade policy regime using both qualitative and quantitative information (2008 Index of economic freedom, p. 442).6 The CPI is a composite index, making use diverse sampling frames and different methodologies (2008 Index of economic freedom, p. 450).7 Marine and Nationally protected areas as % of surface area, CO2 emissions (metric tons per capita), forest as % of total land area.
Globalization and its dimension

��
2. Globalization indicators: some stylized facts.
This section presents some stylized facts concerning globaliza-tion as a main result of a cluster analysis based on k-means algo-rithm used to investigate the role of �4 variables in the description of integration across countries. The aim of k-means algorithm (Hartigan �975, Hartigan and Wong �979) is to divide the selected 71(n) countries in 14 (d) domains into three (k) clusters. The general procedure is to search for a k-partition by moving the objects from a cluster to another, with the purpose to minimize the variance of elements within the cluster and to maximize the variance of ele-ments outside the clusters.
let { } ,,1 nxxX K= and kcc ,, 1 K be respectively the set of n points and a set of k random centers in d ℜ . The algorithm parti-tions these points into clusters with an loop that will converge as follows:
�. For each { } ,,1 ki K∈ , assign to the cluster Ci the points in X that are closer to ci than they are to cj for all ij ≠ .
2. For each { } ,,1 ki K∈ set ci to be the center of mass of all
points in each ∑∈
=ij cx
ji
ii xc
cC 1: .
3. Repeat the assignment steps and update step until the as-signment do not change.
The implementation yielded three clusters, which are shown in tab 2. Fig � is useful in going over the differences in means between groups and their performances.
There are no doubts in attributing the role of leaders in the global challenge to Hong Kong and Singapore. Most of the analyzed Eu-ropean countries demonstrate good levels of international integra-tion, as well as North america and Pacific high income countries do. The most populous group is cluster �, which presents perfor-mances marginalized relative to the rest of the world (cfr. Fig �).
Castagna A��, Furia D�� G�� & L�� E�� R�� Vol�� 14 No 1 (2010), 5-18

�2
In 2006 both members of cluster 3 presented zero percent aver-age tariff rate. With respect to investment climate there are similar treatments between foreign and domestic capital, with a strong government position in encouraging foreign investment. In the same manner, perceived corruption cannot be considered as an obstacle to business transitions. In this connection, an high open-ness to trade and high foreign direct investment rate characterize this group as the best performer on economic integration.
Economic performance for cluster 2 requires a different judg-ment on its components. On one hand it presents good prerequisites of the integration process, due to low levels of corruption, few deterrents to investments, and a relatively high trade freedom. The EU members, which have an high incidence in this group, share a common policy on trade, including subsidies on agricultural and manufacturing, imports restriction for some goods and services, and some services sectors present access market restrictions. The U.S. enterprises are legally equal to foreign ones, and the U.S. were the first in the world to pass an anti-bribery law.
Globalization and its dimension

�3
Chile is the only latin american country belonging to this cluster thanks to its openness to trade due to free trade agreements, its mac-roeconomic stability and an encouraging investment climate. On the other hand, this cluster registers a marked difference from Hong Kong and Singapore on outcomes of the integration process.
The analysis shows differences across countries in technological potential. The selected variables may be considered good indica-tors, as they are a fair representation of different achievements in global competitiveness. This dimension is representative of a
Castagna A��, Furia D�� G�� & L�� E�� R�� Vol�� 14 No 1 (2010), 5-18

�4
digital divide between the North and the South of the world, where developed countries score higher than DC’s. Cluster 3 is better performing than the others; nevertheless, it falls down for R&D expenditure as a percentage of GDP and its Ict expenditures are com-parable with the other units of analysis.
High income countries, which are grouped in cluster 2 and 3, present excellent quality of life, while low income countries inci-dence in the first cluster puts its expectanc� life at birth mean down as a consequence of starvation, illness, lack of freshwater and generalized poor standards of living. Social indicators, as a whole, may be considered good markers since they catch the variances among groups. Environment sustainability presents very close performances for the three groups but with a reversal order in the achievements if referred to other dimensions. Ecological deficit, as a difference between biocapacit� and ecological footprint, stands as a unique indicator of this domain. In this connection, the analysis proves that industrialized countries are importing biocapacity through trade.
3. Concluding remarks
The analysis has documented some stylized facts on global-ization in order to take a further step forward in implementing a multidimensional framework as an overall assessment of the level of integration across countries. This work has been helpful in justifying the selection of relevant variables through a critical review of some of the most important studies on this topic and its effects on growth. In addition, the cluster application has allowed us to evaluate the suitability of data to understand the implica-tions of the methodological choices during subsequent phases of the construction of an overall index of globalization.
The paper presents some innovation with reference to the au-thor’s previous works. Economic integration, which is the histori-cal core of globalization, has been split in two components which stand for drivers and results of the process of globalization, with the introduction of variables representative of trade freedom, invest-
Globalization and its dimension

�5
ment climate and perceived corruption. In a view of a sustainable process, the ecological deficit has been taken into account for each country, representing the environmental impact of trade.
The data application shows that Western countries seem to be performers in a play where the market may produce different effects with respect to raw materials distribution, human capital characteristics and institutional performances. The rest of the world needs to improve its potential to meet the global challenge.
This is a result that is in agreement with policymakers and so-cial activists who claim that globalization is not a result of explicit political choices, with a specific reference to poor economies. Nev-ertheless, the selection of variables in the descriptive phase may involve a value judgment which affects the measures. It is necessary to go deeper in the analysis of winners and losers from globaliza-tion not just by dealing with the aggregation of information across dimensions, but also introducing dominance criteria to be able to define under which conditions a multivariate distribution is more equal than another. This will be the next challenge to be met.
Bibliography
andersen M. (2003), Measuring globalization, IZa Discussion Paper No. 8�7.
Baliamoune M. (2003), On the Measurement of Human Well-be-ing: fuzz� set theor� and �en’s capabilit� Approach, Working paper, WIDER, Helsinki.
Baliamoune-lutz M., McGillivary M. (2006), Fuzz� Well-being Achievement in Paci��c Asia, Journal of the asia Pacific Economy, ��, 2, �68-�77.
Ben-David D. (�993), Equalizing Exchange: Trade Liberalization And Income Equalization, Quarterly Journal of Economics, �08(3), 653-679.
Bérenger V., Verdier-Chouchane a. (2007), Multidimensional Measures of Well-Being: �tandard of Living and Qualit� of Life across Countries, World Development, 35, 7, �259-�276.
Bourguignon F., Morrison C. (2002), Inequalit� among �orld citi-
Castagna A��, Furia D�� G�� & L�� E�� R�� Vol�� 14 No 1 (2010), 5-18
�6
zens: 1820-1992, american Economic Review, 92(4), 727-44.Brahmbhatt M. (�998), Measuring Global Economic Integration: A
Revie� Of The Literature And Recent Evidence, www�.worldbank.org.
Cerioli a., Zani S. (�990), A Fuzz� Approach to the Measurement of Povert�, in Dagum Zenga, Income and Wealth Distribution, Inequalit� and Povert�, Sprinter Vertag Berlin, 272-284.
Cheli B., Betti G. (�999), Fuzz� anal�sis of povert� d�namics on an italian pseudo panel, Metron, 57, �-2, 83-�03.
Cheli B., lemmi a. (�995), A Totall� Fuzz� and Relative Approach to the Multidimensional Anal�sis of Povert�, Economic Notes, �, ��5-�34.
Cheli B., Ghellini G., lemmi a., Pannuzzi N. (�994), Measuring povert� in the countries in transition via a TFR method: the case of Poland in 1990-1991, Statistics in Transition, 5, �, 585-636.
Chiappero Martinetti E. (�994), A ne� approach to the evaluation of �ell-being and povert� b� fuzz� set theor�, Giornale degli Economisti ed annali di Economia, 53, 367-388.
Chiappero Martinetti E. (�996), �tandard of living evaluation based on �en’s approach: some methodological suggestions, Notizie di Politeia, �2, 37-53.
Chiappero Martinetti E. (2000), A multidimensional assessment of �ell-be ing based on �en’s functioning approach, Rivista Internazionale di Scienze Sociali, 2, 207-239.
Chiappero Martinetti E. (2005), Capabilit� Approach and Fuzz� �et Theor�: Description, Aggregation and Inference Issues, in lemmi a. and Betti G., Fuzz� �et Approach to Multidimensional Povert� Measurement, Springer, New York.
De lombaerde P., Iapadre P.l. (2008), International Integration and �ocietal Progress: A Critical Revie� of Globalisation Indicator, in OECD (2008) �tatistics, Kno�ledge and Polic� 2007: Measuring and Fostering the Progress of �ocieties, OECD, Paris.
Dubois D., Prade H. (�980), Fuzz� �ets and ��stems, accademic Press, Boston, New York, london.
Furia D., Castagna a. (2008), Globalization and development: a fuzz� model, Global & local Economic Review XI, 59-�00.
Globalization and its dimension

�7
Hartigan J.a. (�975), Clustering Algorithms, Wiley, New York. Hartigan J.a., Wong, M.a. (�979), Algorithm A� 136: A K-Means
Clustering Algorithm, applied Statistics, 28(�), �00–�08.Heshmati a. (2006), Measurement of a Multidimensional Index of
Globalisation, Global Economy Journal, 6(2), �-28.Kearney a.T., Inc. Global Policy Group&Foreign Policy Maga-
zine (200�a), Measuring Globalization, Foreign Policy, �22, 56-65.Kearney a.T., Inc. Global Policy Group&Foreign Policy Maga-
zine (200�b), Globalization’s last Hurrah?, Foreign Policy, �28, 38-5�.
Kearney a.T., Inc. Global Policy Group&Foreign Policy Maga-zine (2006), The globalization index, Foreign Policy, 6, 74-8�.
la Camera F. (2005), �viluppo �ostenibile: origini, teoria e pratica, Editori Riuniti, Roma.
lockwood B. (2004), Ho� Robust is the Kearne�/Foreign Polic� Globalisation Index?, The World Economy, 27(4), 507-523.
lockwood B. (200�), Ho� Robust is the Foreign Polic�/Kearne� Index of Globalisation?, CSGR Working Paper, 79, University of Warwick, Warwick.
lugo a.M. (2005), Comparing Multidimensional Indices of Inequal-it�: Methods and Application, ECINEQ WP 2005 – �4.
Mattoscio N., Castagna a., D. Furia (2007), a multidimensional measuring of globalization: an experimental application, Global & local Economic Review, X, 85-�20.
Milanovic B.(2002), True World Income Distribution, 1988 and 1993: First Calculation Based on Household �urve� Alone, Economic Journal, ��2(476), 5�-92
Ok E. (�995), Fuzz� Measurement of Income Inequalit�: a Class of Fuzz� Inequalit� Measures, Social Choice and Welfare, �2, ���-�36.
Olson M.J. (�996), Big bills left on the side�alk: �h� some nations are rich, and others poor, Journal of Economic Perspectives, �0(2), 3-24.
Pritchett l. (�997), Divergence, Big Time, The Journal of Economic Perspectives, ��, 3, 3-�7.
Ravallion M. (200�), Gro�th, Inequalit� and Povert�: Looking Be-�ond Averages, World Development, 29(��), �803-�8�5.
Castagna A��, Furia D�� G�� & L�� E�� R�� Vol�� 14 No 1 (2010), 5-18

�8
Ravallion M. (2004), Competing Concepts of Inequalit� in the Global-ization Debate, Brookings Trade Forum 2004, Brookings Institution Press, Washington, DC, �-38.
Stiglitz J.E. (2002), Globalization and Its Discontents, W.W. Norton and Company, New York, (ed. it, 2003 , La globalizzazione e i suoi oppositori, Einaudi, Torino)
UNDP (�990-07), Human Development Report, in http://hdr.undp.org/en/.
Venables a.J. (2003), Winners and Losers from Regional Integration Agreements, Economic Journal, ��3(490), 747-76�.
Wackernagel M., Monfreda C., Deumling D. (2004), Establish-ing National Natural Capital Accounts Based on Detailed Ecological Footprint and Biological Capacit� Accounts, land Use Policy, 2�, 23�-246��
WEF-World Economic Forum (2004-08), The Global Competitive-ness Report, in http://www.weforum.org.
Zadeh l.a. (�965), Fuzz� �ets, Information and Control, 8, 338-353.
Globalization and its dimension

�9
* San Pio V University of Rome, [email protected] San Pio V University of Rome, [email protected]
Abstract
In Ma� 2007, Ku�ait unilaterall� dropped the dollar peg, �hich had been adopted in 2003 as a ��rst step to�ards the monetar� integration of GCC coun-tries, to return to the previous basket peg s�stem�� The decision �as motivated b� the need to curb inflationar� pressures arising from prolonged depreciation of the dollar against major currencies�� Given the relevance of the anti-infla-tionar� objective in this choice, this �ork �ill focus on the peculiarities of Ku�ait’s econom� in order to justif� it and revie� the d�namics of prices in the light of re-pegging to a basket, believing that its composition �as affected b� inflationar� trends�� To this end, an “Auto-Regressive Moving Average” econometric model is proposed to de��ne the �eights of currencies in the basket and the estimation sho�s that the influence of the Euro has increased during the last period, consistent �ith the goals against inflation�� This is of particular importance to the future of the planned monetar� union of the GCC countries, given the rene�ed commitment of Ku�ait to be part of it, despite the existence of different exchange rate s�stems in force in other countries��
JEL CLassifiCation: F15; F31; F32; F33; E31
KEywords: GCC countries; exchange rate regimes; basket peg; dol-lar peg; inflation
G. & L. E. R., Vol. 14 No. 1, 2010
Olga Marzovilla*, Marco Melet
FROM DOLLAR pEG TO bAskEt pEG: ThE ExPERIENCE OF kuwAIT IN VIEw OF ThE GCC MONETARy uNIFICATION

20
1. Introduction
In December 2009, four countries of the Gulf Cooperation Council (GCC) - Saudi arabia, Bahrain, Kuwait, Qatar - reconfirmed their com-mitment to proceed towards monetary unification, whose preliminary step, to be completed by 20�0, is the foundation of the Gulf Monetary Council, embryo of the future Central Bank�. This decision renewed the interest in the exchange rate regime that will distinguish the integrated monetary area.
In 2003, the GCC countries pegged de jure their currencies to the dollar, as a first step towards the single currency, formalizing a system which de facto had already been in place for more than twenty years. among the various reasons for this choice was also the awareness that pegging national currencies to the currency of a country with sound institutions and traditions of stability would enable the small economies in the area to import stability from the centre country and, consequently, credibility and confidence in their respective economies.
although the dollar peg met their expectations for a long time, since 2002, due to unbalances in the economy of the United States and to di-vergent economic cycles in the GCC countries and the USa, it became a propagator of instability in the Gulf area, amplifying the inflationary im-pact of repeated increases in the price of oil. In this context, the economic debate began to indicate the superiority of a basket peg which included the currencies most used in financial and commercial transactions in the GCC countries, in order to stabilize the effective exchange rates, reduce fluctuations in trade and investment flows and gain a partial flexibility in the use of monetary policy. In particular, some empirical studies have confirmed the opportunity for the Gulf countries to prefer a basket peg over a dollar peg (abed, Nuri Erbas and Guerami 2003; aleisa, Ham-moudeh and Yuan 2008; Habib and Stráský 2008); others have acknowl-edged its superiority in the case of an ongoing process of depreciation of the dollar (J.l.Rosmy and others 2007); while still others have tried to
From dollar peg to basket peg: the experience of Ku�ait������
1 Oman and the UAE have not ratified the agreement. Oman, in particular, in December 2006 declared its inability to partecipate in the monetary union on the originally scheduled for 2010, deeming the indicated fiscal constraints to be too stringent. The Emirates, in turn, withdrew from the agreement in May 2009 after the Council’s decision to situate the headquarters of the Gulf Central Bank in Riyadh, rather than in their territory.

2�
ascertain the composition and role of the various currencies. Thus, the study of aleisa, Hammoudeh, Yuan (2008) suggests a basket consisting of US dollars, euro and yen. With reference to a similar basket, Jen and Bindelli (2008) estimate the weight of the dollar to be 70 % and that of the yen and the euro �5 %. Considering the use of different currencies in trade and financial flows and in the composition of official reserves, Saidi, Scacciavillani, Prasad and ali propose a basket consisting of 45 % dollars, 30% euro, 20 yen and 5 pounds (2008).
Our study follows this line of research, but differs from others as it focuses on the concrete experience of a country, Kuwait, which, after a brief experience of dollar peg, in May 2007 returned to the previous basket peg system, motivating its choice through the inflationary effects related to the exclusive link to the dollar. In the context of Kuwait’s renewed commitment in December 2009 to participate in the monetary union, its decisions regarding the exchange rate system, different from those of the other countries in the area, gain great importance for the future of the planned integration and require careful examination of the reasons underneath which can give useful guidelines to the other economies of the GCC.
Given the importance of the anti-inflationary goal in the country’s decision, this work focuses on the peculiarities of Kuwait’s economy that explain its decision and reviews the dynamics followed by prices in the light of re-pegging to a basket, believing that its composition has influ-enced the inflationary trends and was, in turn, influenced by them. Since the Central Bank of Kuwait has not submitted neither the weights nor the currencies in which the basket consist, this study estimate them through an Auto-Regressive Moving Average econometric model that shows that in the period of our analysis the weight of the euro has increased, in order to adapt the composition of the basket to the inflationary goal.
2. The inflationary process in the GCC countries
after two decades of substantial price stability, at the beginning of the new millennium, the GCC economies have been characterized by rapid and significant inflationary processes. The average inflationary rate,
Marzovilla O��, Mele M�� G�� & L�� E�� R�� Vol�� 14 No 1 (2010), 19-48

22
measured by the consumer price index, in all GCC member countries, rose from 0.2 % between �998 and 2002 to �0.8% in 2008, with peaks recorded in Qatar (�5%), the UaE (�2.3%), Oman (�2.6%) and Kuwait (�0.5%). In Saudi arabia, where inflation has always been under �%, an increase in the consumer prices has been witnessed since 2006, leading to an inflationary rate of about �0% in 2008 (Fig. �)
Several internal and international factors combined to fuel the infla-tionary process.
among the internal ones, a key role was played by the growth in public spending and investments, facilitated by higher oil revenues stemming from the increase in demand and the prices of hydrocarbons. Higher investments, mainly in real estate, construction and services, have triggered income multiplication processes and increased demand for consumer goods that could not be promptly met by the supply. Infla-tionary pressures were, however, accentuated by the strong immigration flows that have accompanied the growth process and that raised the price of rents and fed speculative bubbles in real estate.
External factors also contributed to the increase in prices. Thus, be-tween 2006 and 2008, the international increase in food prices heavily influenced inflationary dynamics in the economies of the area which
From dollar peg to basket peg: the experience of Ku�ait������

23
are major importers of agricultural products and foodstuffs, due to their arid climate and scarcity of arable land and water. Similarly, the rising prices of raw materials, particularly iron and copper, have triggered cost and price hikes in the construction sector.
Several studies have attempted to isolate and quantify the contribu-tion of the different components of inflation with reference to the entire area (al-Qudsi and others 2008; Woertz and others 2008; Saidi and oth-ers 2009) or individual countries (Hasan and alogeel 2008; Kandil and Morsy 2009). However, although several factors have contributed to the rise in inflation, the original exchange rate regime adopted by the countries of the area played a fundamental role.
3. The inflationary effects of the dollar peg in GCC countries
For almost thirty years, Gulf economies have formally or informally tied their currencies to the dollar. Oman has officially pegged the riyal to the US currency since �973, while Saudi arabia, Bahrain, Qatar and the UaE, despite having de jure tied their currencies to the SDR until 200�, de facto pegged the dollar at a fixed rate since the eighties. Even the Kuwaiti dinar, which was formally tied to a basket peg until 2002, has always shown a pronounced stability against the dollar. However, as of January �, 2003, as a first step towards full monetary union, the Gulf countries formally adopted a dollar peg monetary regime, pledging to adhere to a fixed exchange rate against the dollar. Thus, at present, the currencies of all the countries of the Gulf area are tied to the US dollar, with the exception of Kuwait which, in 2007, withdrew from the agreement by switching to a basket peg, whose composition has not been revealed.
The reasons justifying the choice of the dollar peg by the GCC mem-bers are manifold.
The most frequently mentioned one focuses on the importance of oil as a source of foreign exchange earnings for the economies of the region. Since international oil prices are quoted in dollars, linking the national currencies to the US dollar guarantees the stability of export earnings, protecting them against exchange risks. On the other hand, invoicing
Marzovilla O��, Mele M�� G�� & L�� E�� R�� Vol�� 14 No 1 (2010), 19-48

24
oil in dollars ensures to the oil-producing countries profits in a currency readily convertible in financial assets in a more liquid and articulated international market and anchoring the national currencies to the dollar minimizes currency risks arising from the holding of foreign reserves and financial assets in dollars.
However, there is also another important reason for choosing to link the Gulf currencies to the dollar. Indeed, given the delays that have characterized their financial, economic and institutional aspects, pegging national currencies to the currency of a country with strong institutions and traditions of stability ensures credibility and confidence to the small economies of the region.
For over twenty years, anchoring to the dollar has allowed the GCC countries fundamentally stable price dynamics. However, since 2002, worsening internal and external US economy imbalances and different economic cycles in the GCC countries and the United States, made the dollar peg a propagator of instability from the anchor country to the Gulf, amplifying the inflationary impact of repeated increases in the price of oil through the liquidity and the cost effect.
The link with the US currency has transformed the oil surpluses recorded by the countries of the Gulf area in increases in the monetary base, preventing at the same time, the possibility to control it, due to the need to avoid speculative capital flows. This led to the alignment of GCC member interest rates to the lower US rates, encouraging the resort to borrowing and the credit expansion, at a time when the rapidly growing economies of the area would have required more stringent monetary policies. The increase in money supply in its broadest defini-tion, has thus fuelled and blunted the rise of internal tensions, which strayed into speculative bubbles such as those that affected the stock market and real estate.
Besides the liquidity effect, a cost effect resulted from the deprecia-tion of the dollar against the currencies of major trading partners of the Gulf countries and, in particular, the EU and Japan. It resulted, in fact, in an increase of prices in domestic currency for a wide range of imported goods, with significant repercussions on the costs of domestic production, living and wage trends. Essentially, the redistribution ef-fects of inflation, in the presence of an expansion in currency circulation,
From dollar peg to basket peg: the experience of Ku�ait������

25
increased the imbalance, driving hikes on the cost side. Rising prices, especially for food and housing, have resulted in a
decline in real income for large sections of the population, prompting demands for wages increases. The highest increases have been granted by the public sector, enhancing the interest in state employment and making it more difficult for the private sector to hire domestic work-ers. Thus, the private sector’s dependence on foreign labor increased in a period of strong wage demands dictated by the need to defend the purchasing power of salaries, resulting in a gradual annual increase of wages (from 7% in 2005 to ��,4% in 2008) (GulfTalent 2009).
Overall, then, the dollar peg, in the presence of different economic cycles in the GCC countries and the United States, conveyed the infla-tionary process initiated by an increase in the international oil demand and price into the expansion of monetary circulation that fed a mixed inflationary escalation, in which pressure on the cost side are superim-posed on those on the demand side. This development fuels doubts on the opportunity of maintaining a strict connection between the currencies of the Gulf countries and the US dollar, in a context characterized by deep structural changes in their economies that highlight the differences among them and add to the demands of competitiveness.
In truth, the experiences of the seventies and eighties, which, in a short period of time, witnessed a drastic drop in the huge oil revenues accumulated after the shocks of �973 and �979 and the transformation of external surpluses and public balance sheets into deficits, prompted the GCC country governments to undertake, in the late eighties, policies aimed at diversifying the production activities in order to reduce the weight of the oil sector and the dependence of economic growth on the variability of the oil prices. These policies have become more marked in the last decade. The significant oil revenues that have characterized this period were mostly used to accelerate the processes of diversification, encouraging the development of the non-oil sector at higher rates than that of hydrocarbons (Fig. 2);
Marzovilla O��, Mele M�� G�� & L�� E�� R�� Vol�� 14 No 1 (2010), 19-48

26
However, to the extent in which the Gulf countries proceed on the path of diversifying their economic structures, the effects of inflation on the competitiveness of products not related to hydrocarbons are particu-larly important given the substantial similarity of their factor endow-ments which causes them to essentially compete in the same production. In reality, despite the progress made, the diversification process is still incomplete and has encouraged both the sectors directly related to oil (exploration and research, refining, marketing and distribution) and the heavy ones that take advantage of low energy prices (petrochemicals, fertilizers, aluminum, steel, iron, concrete). In this context, inflationary pressures raise the important question of their influence on the effective real exchange rates and thus the competitiveness of rival producers in international markets.
as shown in fig. 3, during the last decade, in correspondence with a general depreciation tendency in nominal effective exchange rates of all the countries of the area, in line with the dollar, effective real exchange rates posted divergent trends, reflecting the different extent of domestic inflationary imbalances. In fact, the reduction of the imbalances in Saudi arabia, Oman and Bahrain were opposed by the appreciation in the UaE, Qatar and Kuwait. Thus, inflation has affected the competitiveness of the various members in different ways, threatening tensions that can jeopardize the objectives of the integration of the area.
From dollar peg to basket peg: the experience of Ku�ait������

27
Due to the relevance of inflationary differentials in the competitive-ness of Gulf countries and the process of their diversification activities, a more careful evaluation of the costs and benefits of the dollar peg is needed. This need becomes greater in view of a future monetary union. In the absence of unification, the single countries can severe their close link with the dollar if it becomes expensive; after the monetary union it will be more difficult to do so unilaterally.
Considerations of this nature led to the decision of Kuwait to drop the dollar peg in 2007 and return to the pre-existing basket peg system.
4. The cost of the dollar peg for the economy of kuwait
The tendency to consider GCC economies as substantially homogeneous is widespread. In fact, they seem to share several features: small size, limited population, shared language and culture, an arid climate and shortage of water affecting the possibilities of the agricultural sector, great importance of the oil sector, large trade openness, high incidence of migrant labor on the population and the overall labor force, substantial population growth rates. However, behind the apparent uniformity, the advancement of the diversification process has given greater importance to their relative differences in the availability of oil and natural gas re-sources, importance of the oil sector, levels of income per capita; labor market, demographic growth and budgetary constraints.
Marzovilla O��, Mele M�� G�� & L�� E�� R�� Vol�� 14 No 1 (2010), 19-48

28
These differences may make some countries particularly vulnerable to the effects of inflationary pressures, requiring careful evaluation of the effects of the exchange rate regime to be adopted. This need is par-ticularly felt in Kuwait, given its specificity regarding: a) the structure of the production activit�; b) labor market and demographic gro�th; c) foreign trade and ��nancial relations.
a) The economic structure��Kuwait is the GCC country that has the greatest dependence on the
oil sector. It posts, in fact, the highest percentage of oil exports on the total (95%) and of oil revenues on the total public ones (93.8%); while it is ranked after Qatar for the weight of hydrocarbon production on GDP (59.3%). Moreover, the high relevance of oil revenues on exports justifies the sharp incidence of the current account balance on GDP (43.73%), which appears to be the highest in the area.
These data are explained through the characteristics of the diversifica-tion process implemented in the country, which has mainly focused on the exploitation of oil resources, fostering the creation of a comprehensive and advanced industrial infrastructure dependent on oil. This led to deepen-ing the dual nature of the country’s economic structure, pitting a modern oil sector, controlled by the state and by a few large families, against a traditional and obsolete sector mainly managed by private individuals.
From fare standardization to functional uni��cation������From dollar peg to basket peg: the experience of Ku�ait������

29
The strong dependence on the oil sector makes the economy of Ku-wait particularly vulnerable to the vicissitudes of the oil market, by tying its growth to oil demand and price trends. Thus, sudden drops in price may cause recessionary effects, while rapid and large increases may en-courage appreciation of the real exchange rate, which could jeopardize the competitiveness of the non-oil sector and the needs of diversification. The costs of the previous effect, known in literature as Dutch Disease, can be amplified by the dollar peg. Indeed, the higher incidence of oil exports on total exports, in the presence of increases in oil prices, favors large surpluses in the current account balance, that the dollar peg can turn into higher monetary circulation, amplifying the inflationary ef-fects of higher oil prices. It is no coincidence, in this regard, that in the past decade the weight of the current account balance to GDP in Kuwait consistently exceeded that of other economies of the area. The risks as-sociated with a close link with the dollar in the presence of economic structures heavily dependent on the oil sector cannot be overlooked, especially when considered in the light of Kuwait’s demographics and labor market, which complicate the effects of inflation.
b) The labor marketKuwait is a small country with an area of about �7,8�8 sq km and a
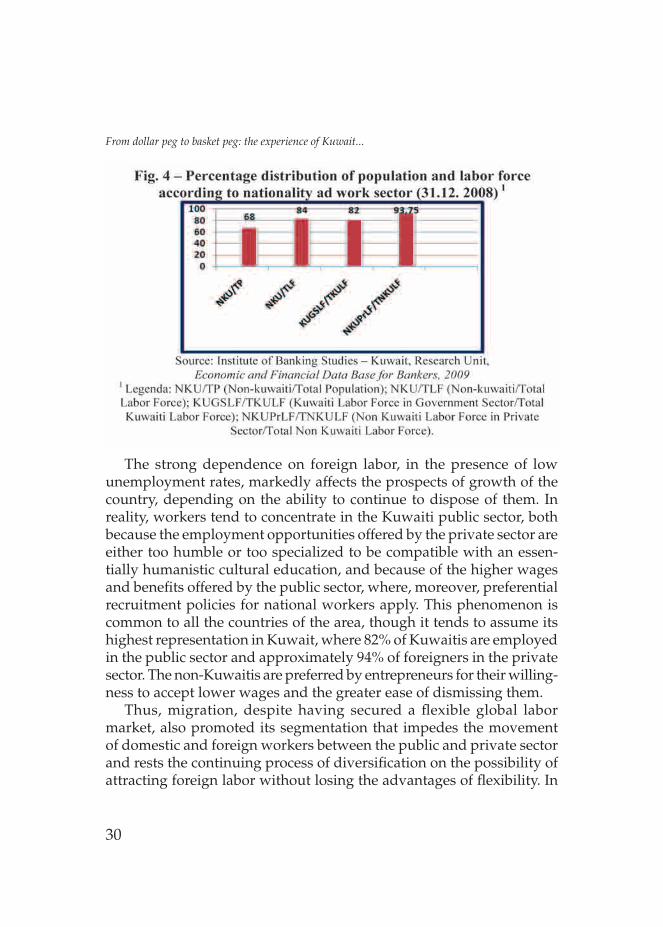
population of over 3.44�,800 inhabitants: Kuwaitis compose 32% and immigrants 68%. Similar proportions characterize the labor market. In fact, given the scarcity of the national population, the development of the oil sector and the diversification of the production process were made possible thanks to strong inflows of foreign workers, composing today 84% of the total labor force (fig. 4). Thanks to the contributions of workers coming from India, Pakistan, Philippines, Egypt, lebanon and Jordan, Kuwait was able to initiate a process of substantial de-velopment with growth rates above 7% on average for the 2002 -2008 period (IMF, Regional Economic Outlook), and an unemployment rate at the end of 2008 of �,82%, resulting from the average rate of 5.33% for the Kuwaiti labor force and �.�3% for foreigners (Institute of Banking Studies 2009).
Marzovilla O��, Mele M�� G�� & L�� E�� R�� Vol�� 14 No 1 (2010), 19-48
30
The strong dependence on foreign labor, in the presence of low unemployment rates, markedly affects the prospects of growth of the country, depending on the ability to continue to dispose of them. In reality, workers tend to concentrate in the Kuwaiti public sector, both because the employment opportunities offered by the private sector are either too humble or too specialized to be compatible with an essen-tially humanistic cultural education, and because of the higher wages and benefits offered by the public sector, where, moreover, preferential recruitment policies for national workers apply. This phenomenon is common to all the countries of the area, though it tends to assume its highest representation in Kuwait, where 82% of Kuwaitis are employed in the public sector and approximately 94% of foreigners in the private sector. The non-Kuwaitis are preferred by entrepreneurs for their willing-ness to accept lower wages and the greater ease of dismissing them.
Thus, migration, despite having secured a flexible global labor market, also promoted its segmentation that impedes the movement of domestic and foreign workers between the public and private sector and rests the continuing process of diversification on the possibility of attracting foreign labor without losing the advantages of flexibility. In
From dollar peg to basket peg: the experience of Ku�ait������
3�
this context, the inflationary effects of the dollar peg may be particu-larly relevant for the country’s economy. The redistributive effects are dumped, in fact, on a population and a workforce characterized by a predominance of non-Kuwaitis, with the risk of arousing, in addition to demands for wage increases, a climate of tension and intolerance. In Kuwait, moreover, the redistributive effects of inflation on the labor market are exacerbated by the structure of its trade flows.
c) Trade flo�sFor economies like that of Kuwait - small and open to foreign trade
- trade relations count on and promote the choice of an exchange rate regime that reduces transaction costs, related to the conversion of cur-rency and foreign exchange risk. This requires careful consideration of the direction and composition of trade flows.
With reference to the direction of trade, the main areas of origin of Kuwaiti imports are asia and Europe: in fact, about 25% of Kuwait’s imports come from Western European countries, surpassing those from the United States (��%) and ranking second to those from the asian area (38%) (Fig. 5); whereas Europe is a small partner in terms of exports. a significant flow of Kuwaiti exports, amounting to 7% of the total, goes, in fact, to only four EMU countries (the Netherlands, Belgium, France and Spain). The main market of destination of Kuwaiti goods is, however, asia and, in particular, Japan, Korea, India, Singapore and China (fig. 6).
With reference to the composition of trade flows, hydrocarbons are the main export item, with an impact on the total that exceeds 95% and is mainly directed to asian countries. Imports, however, consist mainly in foodstuffs, manufactured goods and machinery and come mostly from European countries.
Marzovilla O��, Mele M�� G�� & L�� E�� R�� Vol�� 14 No 1 (2010), 19-48

32
In this context, the phenomenology of exchange rate system is particu-larly important. Indeed, the foreign currency revenues related to exports are mainly in dollars, both because the hydrocarbons are quoted in the US currency, and because they are widely used as a transaction currency in the asian economies. On the contrary, the payment of their imports is largely in euro, given the current practice in European countries to list their exports in their national currency. The relations of exchange between the euro and the dollar have, therefore, great importance for
From dollar peg to basket peg: the experience of Ku�ait������

33
the countries of the Gulf area and, in the last decade, in the presence the dollar peg, they caused huge monetary losses due to the depreciation trend of the US currency compared to the euro that has characterized most of this period.
The depreciation of the dollar against the euro, moreover, implying also that of the dinar, has led to rising prices in domestic currencies for goods imported from the EU. This is an effect that is particularly relevant for the economies such as the Kuwaiti: small; open to international trade; highly specialized in the production of hydrocarbons; with a segmented labor market characterized by the significant incidence of foreign work-ers; with limited agricultural production and manufacturing, which forces them to import a large share of their consumer goods, raw materi-als, intermediate inputs and capital goods. The classification of imports on the basis of their economic use demonstrates that the purchase of foreign consumer goods and intermediate products are respectively 39% and 40% of total imports (Central Bank of Kuwait, Quarterly Bulletin). In this context, the pass-through effect can be particularly burdensome for Kuwait, resulting in increased costs of production and consumer prices. In this regard, the high incidence of imported products in the wholesale price index, estimated at 769.�8‰, is significant (Central Bank of Kuwait).
In considering consumer prices, equally important is the country’s high dependence on imported agricultural products and foodstuffs, which constitute about 26% of imports of consumer goods (Central Bank of Kuwait). In fact, the country’s arid climate, the scarcity of arable land and the high rates of population growth make the domestic supply fall short of domestic needs, forcing them to buy significant quantities of foodstuffs from abroad, particularly asia and Europe. as they occupy an important place in the population’s consumption, about 200‰, an increase in import prices caused by the depreciation of the dollar, in dollar peg conditions, can drive their prices up, worsening the living conditions of the working classes, and especially of migrant workers, fueling demands for higher wages and social tensions.
Marzovilla O��, Mele M�� G�� & L�� E�� R�� Vol�� 14 No 1 (2010), 19-48

34
5. The experience of re-pegging to the basket
On May 20, 2007, Kuwait unilaterally withdrew its commitment to peg its currency to the dollar, made in 2002 as a first step towards the monetary integration of the GCC countries, and restored the pre-exist-ing basket peg regime, anchoring the dinar to a basket of currencies, whose composition and weights were not disclosed. The decision was motivated by the need to curb inflationary pressures arising from the prolonged depreciation of the dollar against major currencies, although, unlike other area coin, the dinar was allowed to fluctuate within margins of ± 3, 5% around the declared parity of 299.63 ��ls per dollar2.Given the importance that the anti-inflationary objective has taken in the choice of the exchange rate regime, it is interesting to review the dynamics followed by prices after the re-pegging to the basket in the light of that choice, although fully aware that other important variables have heavily influenced its development in recent years.as shown in Fig. 8, in 2007-2009, inflation and dollar-dinar exchange rates have moved in an essentially antithetical manner, featuring two different sub-periods: in the first (2007 - July, 2008), the revaluation of the dinar against the dollar has been accompanied by an accentuation of inflationary pressures; in the second (July 2008, 2009), the depreciation has been associated with their moderation.
1 One Kuwaiti dinar equals to 1,000 fils
From dollar peg to basket peg: the experience of Ku�ait������

35
From 2007 to mid 2008, the dinar has consistently appreciated against the dollar. appreciation was accentuated after abandoning the dollar peg and reached its peak in July 2008. Overall, during the period from May 2007 to July 2008, the dinar appreciated by more than 8 %, from 288.27 to 265.27 fils per dollar. In the same period, contrary to expectations, inflation has significantly accelerated: the quarterly rates of variation in the consumer price index have risen consistently, from 0.69% in the second quarter of 2007 to 4.2% in the first quarter of 2008. Overall, the cumulative increase in prices during that period was more than �0%.
Since the second half of 2008, these trends are reversed. The dinar started to depreciate against the dollar by more than �0% between July 2008 (265.27 fils) and March 2009 (29�.87 fils), while the quarterly rates of growth in the index of consumer prices rose in same period from �, 8% to 0.5%.
Some explanations have been given to justify these trends: what happened in the first period was attributed to the uncertainty that ac-companied the decision to abandon the dollar peg, while the trend of the second period was attributed to economic policy decisions aiming at supporting the continuation of the growth process.
With reference to the first period, in particular, the burst of inflation-ary pressures, despite the appreciation of the dinar against the dollar, was motivated by the lack of transparency that has characterized the introduction of the basket peg. according to a widespread opinion, the failure to disclose the composition of the basket and the weights of currencies created a climate of uncertainty that fueled expectations of a revaluation of the dinar and speculative pressures, with a consequent influx of capital from abroad. The need to contain the pressure towards appreciation of the national currency has pushed down interest rates, encouraging the resort to borrowing, the expansion of circulation credit and inflationary pressures (Khan 2008).
With reference to the second period, however, the coexistence of the depreciation of the dollar with the easing of inflationary pressures was attributed to a deliberate economic policy strategy aimed at curbing the spread of the recessionary effects resulting from the international economic and financial crisis. The depreciation of the dinar, in fact, could have increased the revenues in national currency resulting from
Marzovilla O��, Mele M�� G�� & L�� E�� R�� Vol�� 14 No 1 (2010), 19-48

36
oil exports, thus facilitating investments in public activities supporting the national economy in the presence of a decline in global demand (Reuters 2009).
While agreeing with the former explanations, we believe that the different trends shown by the evolution of exchange rates and prices may have been influenced by the new exchange rate regime and, in particular, the composition of the basket and its possible variations. This impression is based on the strong resemblance, visually ascertainable, characterizing the monthly trend of the dinar-dollar exchange rate and the dollar-euro one in the period 2007-2009. as shown in Fig.9, the dy-namics of the exchange rate of the dinar compared to the US currency tends to reproduce that of the dollar-euro exchange rate, justifying the possibility that the weight of the euro in the basket may have affected the relationship between the Kuwaiti and US currencies. In fact, the cor-relation coefficient we estimated between the two series is positive and equal to 0.5997 and gives some foundation to the previous option.
The next part of this work proposes and econometric estimation that aims at verifying the composition of the basket and its possible changes in the belief that the weight of the euro in the basket may have had some influence on price trends observed more recently. Obviously, it is clear that the narrowness of the survey period and the concurrence
From dollar peg to basket peg: the experience of Ku�ait������
37
of a set of variables closely related to a period of deep uncertainty and imbalances in the international and Kuwaiti economy does not allow a precise estimate of the possible causal changes in the basket on infla-tion dynamics.
6. The estimation of weights and the econometric model
The estimation of the weights of the currencies making up the currency basket of Kuwait is conducted, with appropriate changes, on an approach devised by Frankel (�993) and Frankel and Wei (�994, �995), based on the ordinar� least square regression (OlS) for the exchange rate of domestic currency compared to those in the basket and which the two economists propose when it is anchored to a basket with limited flexibility 3. In later studies they developed a new and more appropriate approach for basket pegging where exchange rates fluctuate around a stated fixed rate and where, in addition to the estimated weights of the currencies, there is also the need to evaluate the flexibility de facto of the exchange rate compared to the central parity.4 In the case of Kuwait, however, the original method is preferred since former analyses conducted again by Frankel and Wei through the new approach, with reference to the eighties of last century, estimated a coefficient concerning the flexibility of the central exchange rate close to zero, in line with the classification de facto of exchange systems implemented by the International Monetary Fund, which defines the one of Kuwait as a “conventional pegged arrangement to a composite” (IMF 2009).
In this case, moreover, besides the weights, the currencies composing the basket should also be identified since the Central Bank of Kuwait has not disclosed its composition. This, however, can be reconstructed on the basis of the relevance of the major currencies financing the country’s imports. Data provided by the Institute of Banking Studies 3 The same technique was subsequently employed by Bénassy, Quéré and Agnès (1999), Ohno (1999), Frankel, Schmukler and Servén (2001), Benassy, Quéré. Coeur and Mignon (2004). It also has been recently used by Eichengreen (2006), Shah, Zeleis and Patnaik (2005); Ogawa and Yoshimi (2008) to verify the weight of the currencies that make up the basket per of China.4 A new contribution has been recently proposed by Frankel and Xie (2010) for the case when the countries do not maintain a single consistent regime for more than a few years at a time, but rather switch parameters every few years and even switch regimes.
Marzovilla O��, Mele M�� G�� & L�� E�� R�� Vol�� 14 No 1 (2010), 19-48

38
of Kuwait (2009) reveal in order of importance: the dollar, concerning 60.7 percent of imports in 2007; the euro, with an incidence of ��.3 percent and the yen with 8,4 percent. Thus, it is realistic to suppose that these currencies are included in the country’s basket. Moreover, it is appropriate to include also the British pound. Indeed, despite its low weight in the financing of imports (0.9 percent), it is probably used in financial transactions, given the broad relevance of the london financial market. The Swiss franc, instead, given its limited use in the country’s commercial trade, is used as a constant to measure the variability of the exchange rate of the dinar against those allegedly composing the basket5.
With these clarifications the regression model is as follows:
∆lnDinar/FRsv= α+β�∆ lneU�D/FRsv+ β2∆lneJPY/FRsv+β3∆ lneERsv/FRsv+
+β4∆lnepound/FRsv (�)
In it:
- ∆ln� Dinar/FRsv,, ∆lne U�D/FRsv,,∆lneJPY/FRsv,,∆ lneERsv/FRsv,, ∆ lnepound/FRsv represent, respectively, the exchange rate of the dinar, the dollar, the yen, the euro and the pound against the Swiss franc6; - coefficients ß are the weights of the respective currencies in the basket. The closer the coefficient is to �, the greater is the tie between the dinar and the currency taken into account;- regression is based on first differences of logarithms of exchange rates:7
- it is also assumed that the standard error is close to zero and RR2 is near the unit.
5 Frankel and Wei (1994, 2006), Ohno (1999) and Eichengreen (2006) have used the Swiss franc as the constant; Benassy and Quéré (1999) the dollar Yamazaki (2006) the Canadian dollar. Subsequent contributions (Frankel and Wei 2007) are regarded a basket of currencies as a costant, such as, for example, the Special Drawing Rights.6 In particular, if the fluctuation of the dinar against the franc are largely explained by those of the dollar against the Swiss currency we can deduce the existence of a close anchorage between the Kuwaiti and the US currencies.7 The autors have carried out a logarithmic analysis motivated by the need to reduce the standard error for each value of the coefficient obtained and to analyze stochastic processes through a linear model.
From dollar peg to basket peg: the experience of Ku�ait������
39
However, the proposed model seems to ignore the modern econo-metric contributions in “time series”. Indeed, the time series on exchange rates, even in studies on the percentage changes, do not always represent the result of a stationary process8. Several tests on the regression model outlined by Equation (�) - from Durbin-Watson’s to ljung-Box’s-, and the observation of the correlogram could highlight some issues related to autocorrelation especially among the residuals9.
For these reasons, in our work we believe it best to integrate Fran-kel’s OlS model with an “Auto-Regressive Moving Average”�0 approach supported by the Kalman ��lter11. Furthermore, given the volatility that normally characterizes the daily exchange rates, we also included the Hodrick-Prescott filter in the analysis as a method of leveling the time series.
With these changes our regression model takes the following form:
∆d.ln�Dinar/FRsv= α+β�∆d.lneU�D/FRsv+ β2∆d.lneJPY/FRsv+β3∆d.lneERsv/FRsv+
+ β4∆d.lnepound/FRsv + µt (2)
α 0,t= α0,t-�+ŋ0,tβ�,t= β �,t-�+ŋ�,tβ2,t= β2, t-�+ŋ2,tβ3,t= β 3, t-�+ŋ3,tβ3,t= β 4, t-�+ŋ3,t
and it is analyzed in an autoregressive moving average (aRMa). Based on this amended model, the estimation of the weights of the currency basket of Kuwait is conducted with reference to three different periods: 2000-2003, June 2007-July 2008, august 2008-February 20�0. The first period is the one preceding the decision of Kuwait to adopt the dollar-peg; the second, following the re-pegging to the basket, includes the period of appreciation of the dinar against the dollar and 8 See: Appunti di analisi delle serie storiche, Riccardo Lucchetti - 2008, free access online,in “Lucchetti home page”.9 For a more detailed examination of these issues, see Mele (2009).10 For the analysis were used two econometric software: Stata SE ver. 11A; Gretl ver.1.8.4.11 McKinnon (2002) and Ogawa (2006) used the Kalman filter to estimate basket peg regimes in Southeastern Asia. However, it has been used to a simple OLS model where the coefficients assumed temporal variations.
Marzovilla O��, Mele M�� G�� & L�� E�� R�� Vol�� 14 No 1 (2010), 19-48

40
accentuations of inflationary pressures; the third period includes the phase of depreciation of the Kuwaiti currency against the US one and the mitigation in price increases. Regarding the data, the first series uses monthly data, while the second and third use daily data (maximum 5 days). The data were drawn from the “Paci��c Exchange Rate �ervice 2010”�2 and then estimated through a model “aR-Ma (2;2)”.
7. Results13
12 The University of British Columbia, www.http://fx.sauder.ubc.ca/data.html13 *** p<0.01; ** p<0.05; * p<0.1
From dollar peg to basket peg: the experience of Ku�ait������

4�
Marzovilla O��, Mele M�� G�� & L�� E�� R�� Vol�� 14 No 1 (2010), 19-48

42
From the results of the informative criteria, it is shown that the aRMa-“Kalman” model (2,2) presents for its similar values, therefore, doesn’t differentiate itself. The model, moreover, doesn’t demonstrate common factors, confirming the reliability of the data obtained: an estimation of the robust initial type, it has permitted moreover to limit the effect of the het-eroschedasticity of the model, therefore avoiding an aRCH analysis.
The values of R2 adjusted for each regression (developed in the initial OlS model) range from 89% to 98%, indicating that the explanatory variables justify well the dependant variables; standard errors of regres-sions showed values close to zero, with a maximum value of 0.0026��. Finally, analyzing the respective charts of the correlogram of residues the estimate for each period does not reveal any autocorrelation.
analysis of the coefficients for the three analyzed periods clearly shows that the weight of the considered currencies (dollar, euro, yen and pound sterling) has changed over time.
In the first period, 2000-2003, the currencies whose weight is signifi-cant in the basket (from the analysis of the p-value) – besides the constant- are the dollar and euro, whose coefficient is respectively 0.89 and 0.04. It is obvious that the influence of the European currency on the Kuwaiti dinar is almost nil, and this may be due to its still young life.
In the second period, June 2007 – July 2008, only the US currency is significant. The value of its coefficient is, in fact, about 0.6. although in May 2007, Kuwait officially came under a basket peg, in the period under review it actually continued to closely peg the dinar to the dollar and this may have contributed to worsen the inflationary trends, lead-ing to a change in the composition of the basket. The almost exclusive relationship with the dollar may, in fact, have intensified the expansion of the monetary circulation related to inflows of speculative capital that followed the de-pegging.
The results change dramatically when we analyze the latest period, august 2008-February 20�0. Here to, as in the first period, the only cur-rencies that appear to compose the basket are the dollar and the euro. However, while the weight of the US currency falls to 0.8�, that of the European currency rises to 0.�6. There are therefore strong assumptions supporting the impression that the inflationary consequences of the link with the dollar may have led Kuwait to increase the weight of the euro in its basket.
From dollar peg to basket peg: the experience of Ku�ait������

43
8. Conclusion
For economies such as those of the Gulf - small, highly specialized in a few productions and open to foreign trade - the commercial and fi-nancial relations matter and make it particularly appropriate to consider the choice of an exchange rate regime that is not a vehicle of inflationary pressures and reduces transaction costs related to currency conversion and exchange risks. In the new millennium the dollar peg has not com-plied with these requirements. In the presence of diverging economic cycles in the GCC countries and the United States, it has amplified the inflationary impulses initiated by the increasing international demand for oil and its rising price, through a liquidity and a cost effect.
awareness of the inflationary consequences of the dollar peg has thus cast doubt on the opportunity to maintain a rigid link between the Gulf and the US currencies, in a context characterized by deep structural changes in the economies of the region, which would highlight the dif-ferences between them and add to the demands of competitiveness.
Doubts on the benefits of pegging to the dollar have been more relevant for Kuwait, taking into account the peculiarities of its produc-tion structure and the characteristics of its labor market, which tend to increase the inflationary effects of the dollar peg. In fact, given its heavy dependence on the hydrocarbon sector and the high incidence of oil exports on the total, the link with the dollar may boost the expansion-ary effects of oil surpluses on monetary circulation. On the other hand, the marked prevalence of immigrants in the total population and labor force, low unemployment rates and the preference of Kuwaitis for public employment, tend to exaggerate the redistributive effects of inflation, increasing the risk of wage demands and social tensions.
In this context, the choice of Kuwait to peg the dinar to a basket of currencies widely used in trade and finance is perfectly justified in terms of economic logic. It is consistent with the requirement that the definition of the exchange rate takes also into account the direction and intensity of trade and financial flows on the international market. In other words, the weight of currencies in anchor peg exchange rate regimes should reflect the structure of foreign economic and financial relations. In this respect, therefore, the decision of Kuwait to include the euro in
Marzovilla O��, Mele M�� G�� & L�� E�� R�� Vol�� 14 No 1 (2010), 19-48

44
its basket and increase its weight is fully justified, given the importance of the European currency in its economic and financial trade.
The experience of Kuwait is a useful example for other GCC econo-mies which, despite their close relations with the euro countries, neglect their money in their own exchange rate systems. The importance of their trade with EU countries suggests, in fact, the opportunity to increase the weight of the euro in their systems. anchoring to a basket peg that includes the euro could bring undeniable benefits: firstly, reducing the dependence of the monetary circulation of the GCC economies from the US monetary policy choices; secondly, limiting the fluctuations in effective exchange rates of national currencies and the risks linked to renewed appreciation processes of the euro against the dollar.
However, at present, the choice of Kuwait to anchor the dinar to a basket peg raises important questions about the future of the planned monetary union. Indeed, although justified in terms of economic logic, this choice differs from that of other partners who continue to adopt a dollar peg.
aPPEndiX
From dollar peg to basket peg: the experience of Ku�ait������

45
Marzovilla O��, Mele M�� G�� & L�� E�� R�� Vol�� 14 No 1 (2010), 19-48
46
References
abed G., Nuri Erbas S., Guerami B. (2003), The GCC Monetar� Union: �ome Consideration for the Exchange Rate Regime, IMF Working Paper, april.
aleisa E., Hammoudeh S., Yuan Y. (2008), External and Regional �hocks in the GCC Region: Implications for a Common Exchange Rate Regime, Eco-nomic Research Forum, Working Paper, 426.
al-Qudsi S., Kaloti a., Numan F., Obeid S., Marar H. (2008), Trade Volatilit�, the Dollar Peg and Inflation in the GCC Countries: �ome Prelimi-�ome Prelimi-nar� Research Findings, The arab Bank Review, �0 (�).
Bènassy, Quèrè, agnès (�999), Exchange Rate Regime and Policies: An Empirical Anal�sis, Exchange Rate Policies in Emerging asian Coun-tries, eds. Stefan Collignon, Jean Pisani-Ferry, and Yung Chul Park., Routledge, london.
Bénassy, Quéré, Coeuré, Mignon (2004), On the Identi��cation of de facto Currenc� Pegs, Journal of Japanese and International Economies, 4, ��2–27.
Central Bank of Kuwait, Quarterly Bulletin.Durbin J., Watson G. S. (�95�), Testing for �erial Correlation in Least
�quares Regression, Biometrika, I.Biometrika, I., I..Eichengreen B. (2006), China’s Exchange Rate Regime: The Long and
�hort of It, Paper for Conference on Chinese Money and Finance; 2–3 February, Columbia University, New York.
Frankel J. (�993), Is Japan Creating a Yen Bloc in East Asia and the Paci��c?, in J.Frankel and M. Khaler (eds), Regionalism and Rivalry: Japan and the US in Pacific asia, University of Chicago Press, Chicago.
Frankel J., Schmukler S., Serven l. (200�), Verif�ing Exchange Rate Regimes, Journal of Development Economics, 66.
Frankel, J., Wei S. (�994), Yen Bloc or Dollar Bloc? Exchange Rate Policies of the East Asian Economies, in T. Ito and a. O. Krueger (eds), Macroeco-nomic linkages: Savings, Exchange Rates and Capital Flows, University of Chicago Press, Chicago.
Frankel, J., Wei S. (�995), Emerging Currenc� Blocs, in H. Genberg (ed.), The International Monetar� ��stem: its Institutions and its Future, ���–43, Springer, Berlin.
From dollar peg to basket peg: the experience of Ku�ait������
47
Frankel, J., Wei S. (2007), Assessing China’s Exchange Rate Regime, Economic Policy 5�, 575–6�4.
Frankel, J., Xie D. (20�0), Estimation of De Facto Flexibilit� Parameter and Basket Weight in Evolving Exchange Rate Regimes, american Economic Review (In Press), May.
Gulf Talent (2008), Gulf Compensation Trends, GulfTalent.com, October.
Gulf Talent (2009b), Emplo�ment and �alar� Trends in the Gulf, 2009-2010, GulfTalent.com, December.
Habib M. M., Stráský J. (2008), Oil Exporters in �earch of an External Anchor, European Central Bank, Working Paper Series, 958.
Hasan M, alogeel H. (2008), Understanding the Inflationary Process in the GCC Region: The Case of Saudi arabia and Kuwait, 2008; IMF Working Paper, august.
Kandil M., Morsy H. (2009), Determinant of Inflation in GCC, IMF Working Paper, april.
Khan M.S. (2008), The GCC Monetar� Union - Choice of Exchange Rate Regime, IMF, august.
Institute of Banking Studies del Kuwait (2009), Economic and Financial data base for Bankers, Research Unit.
International Monetary Fund (2009), annual Report on Exchange arrangements and Exchange Restrictions (aREaER).
International Monetary Fund, IMF Countr� Report��International Monetary Fund, Regional Outlook: Middle East and
Central Asia��Jen S., Bindelli l. (2008), A 70:15:15 Currenc� Basket Numeraire for the
GCC, The Tree of liberty, 25.ljung G. M., Box G. (�978), On a Measure of a Lack of Fit in Time �eries
Models, Biometrika 65,. 297-303. McKinnon R. I (2002), After the crisis the East Asian dollar standard
resurrected: An interpretation of high-frequenc� exchange rate pegging, Stanford University.
Ogawa E. (2006), The Chinese Yuan after the Chinese Exchange Rate ��stem Reform, China and World Economy �4, 39–57 Widening Deviation among East Asian Currencies, RIETI Discussion Paper Series, �5.
Ohno K. (�999), Exchange Rate Management in Developing Asia,
Marzovilla O��, Mele M�� G�� & L�� E�� R�� Vol�� 14 No 1 (2010), 19-48

48
Working Paper No. �, asian Development Bank Institute Reuters (2009), Ku�ait lets Markets Guess over Peg �ith Dinar Fall, 29.
Reuters (2009), Ku�ait lets Markets Guess over Peg �ith Dinar Fall, 29.
Rosmy J.l. and others (2007), On the Road to Monetar� Union – Do Arab Gulf Cooperation Council Economies React in he �ame Wa� to United �tates’ Monetar� Polic� �hocks?, MPRa Paper ��6�0.
Saidi N., Scacciavillani F., Prasad a., ali F. (2008), The Exchange Rate Regime of the GCC Monetar� Union , Economic Note, 3, Dubai International Financial Centre.
Saidi N., Scacciavillani F., Prasad a., ali F. (2009), Inflation in the GCC: an Anal�sis of the Causes and Implications for Monetar� Polic�, Economic Note, 5, Dubai International Financial Centre.
Shah a., Zeileis a., Patnaik I. (2005), What is the Ne� Chinese Currenc� Regime?, Report 23, Department of Statistics and Mathematics, Wirtschaftsuniversit at Wien, Research Report Series.
Woertz E. (2008), Impact of the U� Financial Crisis on GCC Countries, GRC Report, Gulf Research Center, October.
Woertz E., Pradhan S., Biberovic N., Koch C. (2008), Food Inflation in the GCC Countries, GRC Report, Gulf Research Center, May.
Yamazaki K. (2006), Inside the Currenc� Basket, Columbia University and Mitsubishi UFJ Trust and Banking, December.
From dollar peg to basket peg: the experience of Ku�ait������

49
G. & L. E. R., Vol. 14 No. 1, 2010
� Science Department - Università degli Studi “G. d’Annunzio” Chieti-Pescara, Viale Pindaro, 42 65127, Pescara, Inter-university Masters corse in Economics and Management in Fashion, Penne and Pescara, Online University Torrevecchia Teatina (CH), Italy.e-mail: [email protected]
Abstract
The internationalization of retail distribution constitutes one of the most significant phenomenon in the world economy today. The cloth-ing and fashion sector certainly provides a concrete example that is emblematic of this trend.
The products in this sector are the best example of the post-mod-ern concept of goods, because internationalisation is inherent in these products and because fashion, as an aspect of cultural, is a force to be reckoned with in understanding globalisation. In fact the clothes are the material basis of fashion, while fashion itself is a cultural system of meanings.
From the earliest days of industrial production there has been an increasingly widening gap between the market value of a product and its use value and perhaps the product which is most emblematic of this gap is the ‘fashion’ product.
For this reason fashion meets the prerequisites for being studied as a symbolic cultural product and can be considered as the non-material emblem of modern commodity science.
The factors which have encouraged the internationalisation of cloth-ing products are: the existence of a trans-national segment of consum-ers who have similar characteristics; the homogeneity of models of acquisition and consumption on the global level; the need to enlarge national markets towards similar external markets in order to guarantee
Mario Giaccio1
ThE INTERNATIONALISATION OF RETAIL BuSINESSES:ThE EMBLEMATIC FAShION CLOThING SECTOR

50
an adequate sales potential; the opportunity to exploit the economy of replication.
It is possible to distinguish four categories of international retailer of fashion products: Product Specialist Fashion Retailers; Fashion Design Retailers; General Merchandise Retailers; General Fashion Retailers.
The various distribution chains for clothing are: the Continental Leaders; the World Wide �pecialists; the Quasi-global Pla�er and the Global Pla�ers.
Some example of international companies in the clothing industry are taken in consideration: Benetton Group and Zara (Global players); Hennes & Mauritz (Nearly-global player); Brioni (World-wide specialist).
JEL CLassifiCation: F23; L22; L67
KEywords: Internationalisation of retail, fashion clothing, World Wide Specialist, Brioni
1. Introduction
The classical theories on internationalization business were devel-oped during the post-war period, particularly by observing the behavior of United State multinational companies who are the prototypes for businesses engaged in strategies of internationalisation.
The process evolves step by step, because there are factors which can hinder or favor penetration into foreign markets, such as: language, more or less permissive laws, political situation, the phase of industrial development, standards of education and level of culture, lifestyle (tra-ditional, modern) and so on. In some cases cultural difference can be a competitive advantage for the image of the products in question (for example Made in Ital�).
In production companies the course followed in the internationaliza-tion phase is generally similar: at first a large scale sales organization is formed, with branches abroad, then, because of customs duties, high transport costs, difficulties in coordinating transoceanic shipment and the lower cost of local labor, the first production plants are built abroad.
The internationalisation of retail businesses������

5�
Once the integration between production and distribution has been ac-complished, the problem regarding raw material supply is also solved locally, with lower prices and faster deliveries.
In the distribution companies the phenomenon involves not only the retailing of specialised products but also of non-specialised products. The retailing of specialised products involves notably the electronics and the house goods sectors, but the most significant involvement in this trend is to be seen in the clothing sector and, in particular, in the evolution of Fashion Brand Names and the situation of the Designer Fashion Retailer.
The internationalization of retail distribution constitutes one of the most significant phenomenon in the world economy today (aiello 2005). This field occurred later than in the industrial sector, but its evolution has been very rapid and has been synthesised as follows (alexander, �997):
�) �880-�945: Some american and European businesses open retail stores in the major cities of these two continents; these stores sell luxury goods that are aimed at cosmopolitan clients and expatri-ates of that period;
2) �846-�960: The techniques and methods of retail distribution, particularly those of the supermarket, that were developed in the United States are brought to Europe;
3) �96�-�974: European distributors make significant investments both in Europe and in the United States;
4) �975-�989: after an initial slow down due to the economic crisis brought about by the increase in the price of oil, the investments made in Europe and the U.S. are renewed ; the Japanese begin to invest in the sector in Europe and in North america;
5) �990-�999: in this phase there is a growth in retail businesses in the European Union , in the countries party to the NaFTa (Canada, United States and Mexico) and in the emerging markets of eastern Europe and asia.
The extension of internationalization determines a new situation. In addition to its economic aspects, globalization also involves social and cultural factors which often lead to a homogeneity of lifestyle in which individuals behave like “universal customers”. The opposite
Giaccio M�� G�� & L�� E�� R�� Vol�� 14 No 1 (2010), 49-90

52
can also be true: economic effects can be caused by social and cultural events. a “global product” is sold all over the world without (or with a limited) modification.
Viewed from this perspective, the fashion clothing product is em-blematic of both globalization’s economic effects as well as its socio-cultural factors.
2. The internationalisation of products
The internationalization of retail involves not only the retailing of specialised products but also of non-specialised products. The retailing of specialised products involves notably the electronics and the house goods sectors, but the most significant involvement in this trend is to be seen in the clothing sector and, in particular, in the evolution of Fashion Brand Names and the situation of the Designer Fashion Retailer.
One important aspect to consider is the evolution of consumer habits. Changes in consumer preferences are motivated by socio-economic and demographic factors and are conditioned by elements that are sometimes general but can also be specific to particular countries. The variables involved are: age, range of income, employment rate of women, level of education, life style, etc.
One very interesting hypothesis maintains that the behaviour of con-sumers can be divided into two extremes: on one extreme consumers are oriented towards routine purchases for goods which they perceive to be ordinary (in this case they look for satisfactory quality at a com-petitive price); on the other extreme consumers are oriented towards purchases, which are becoming more and more personalised, of goods for which there is a high level of emotional involvement, as is the case with clothing. The acceleration of the process of internationalisation of retail operations is linked to the need to be competitive, a need that leads businesses to look for opportunities for growth outside of their markets of origin. Often this growth becomes a question of necessity and not a matter of choice.
The method used for entry into foreign markets is one of the most important aspects in the process of internationalisation. The advantages
The internationalisation of retail businesses������
53
and disadvantages associated with the possible choices are mainly linked to competitive conditions in the business’s own home market; to the position of the brand name and the forms of distribution to be used; to the target market. Market entry methods can be summed up in the following five points (Treadgold �990; lorenzoni and Mararesi 200�; Horvarth �994; Dawson �994):
�) a company’s opening retail stores of its own abroad is one of the most important and widespread methods for entering foreign markets. Entry into the new market can take place with a limited expenditure of resources and if difficulties arise it is possible to withdraw from the market in a short time. Moreover, the company retain complete control over the business and any possible future developments.
2) Growth through an external line generally occurs through the ac-quisition of retailers already present in the local market . The principle advantage of this method of entry is the speed with which a company establishes its presence in the foreign country. If this expansion is carried out in a developed country, it is possible to gain a share of the market that would not have been possible through simple exportation. In addi-tion there is the opportunity to have stores in places where it would not otherwise be possible. This method is preferred by big businesses.
3) The acquisition of a minority share in a business already present in the foreign market is method of entry that is of a temporary nature. It is an expediency that serves to acquire knowledge of the market with a minimum of risk.
4) Franchising is one of the most widespread methods for interna-tionalising in the retail sector especially for businesses that are not very big. This method allows for the rapid setting up of a broad network of retail distributors at a low cost. Within this network the international retailer assumes the role of franchisor, consents to the use of his identity and shares his knowledge of distribution. The local retailer contributes the use of his store and his experience of the local market.
Giaccio M�� G�� & L�� E�� R�� Vol�� 14 No 1 (2010), 49-90

54
5) a business can chose to enter into a foreign market by stipulating an agreement with a partner to use their network of distribution. Such an agreement could provide for the rental of product display space or for the concession of whole retail stores or other distribution points. It is also possible to create a new corporation together with partners ( joint venture)��The principle advantage of agreements of this type is that they guarantee rapid and direct access to an already existing distribu-tion network without having to make important investments. It is also possible to set up mixed networks of distribution, for example, some retail stores that are owned and others that are held under a franchis-ing agreement.
Some of the reasons that spur businesses towards internationalisa-tion of retail are:
(a) The saturation of the market of origin: this is one of the most important factors that push retailers towards other markets, when there is no possibility of an increase in demand in the domestic market or no available sites at which to open new stores. This can happen both with products of mass consumption as well as niche products (Santoprete and Giaccio 2003).
(B) The presence of excessive regulation that impedes development in one’s own country. For example, in Italy law n. 426 of �97� blocked the growth of national retailers who were then unable to become large enough for overseas expansion; at the same time this law created a barrier for foreign businesses that wanted to enter the Italian market. However, when the law was changed, overseas competitors were able to enter the Italian market by acquiring market shares in companies or even whole Italian companies.
(C) Economic and demographic factors: the evolution of pro-capita income and expenditures, and therefore, of the dimension of the internal demand; changes in consumer behaviour; changes in the composition of age groups, etc.
The internationalisation of retail businesses������

55
Many authors use the so-called ‘eclectic Paradigm of Dunning’ to explain the motivations that push companies towards internationali-sation of distribution. according to this paradigm internationalisation of a company is opportune only if advantages linked to three interde-pendent variables are present: ownership, localising and internalizing (Dunning 2000).
The factors which attract a retailer towards internationalisation can be summarised as follows:
a) a company’s brand image is the basis for its strategy of differen-tiation in its market of origin. Brand names, which have acquired more and more importance in all commercial sectors, have become, in the fashion sector, a deciding factor (Wigley, Moore and Birt-whistle 2005). The brand name becomes the vehicle for informing buyers about where the product was made and this is an important aspect of what the retailer is offering. The image of the country of origin is for Italian fashion retailers, as well as for others, a strong point that can be exploited.
b) The knowledge of distribution techniques that has been acquired in the market of origin favours internationalisation, particularly as regards entering the new market through franchising since in this method of entry distribution know-how is an integral part of the agreement with the local partner.
c) The amount of demand present in the new foreign market is an-other factor.
d) another element is the absence or limited presence of restrictive regulations in the foreign market. For example, the U.S. market attracts European retailers, not only because of the size of the demand, but also because of legislation which is open to foreign investment and even limits the growth of local retailers through anti-trust laws2.
2 An example of a contrasting situation , i.e. one where difficulty in entering a new market depended on restrictive regulations, would be that of Benetton. Present in the Chinese market since 1991 Be-netton has encountered serious obstacle to expansion due to the country’s protectionist policy. When Benetton first arrived in China the law prohibited foreign companies from opening retail stores of their own. Only in 2004 did the Shanghai Foreign Economic & Trade Commission grant its permission to Benetton to open and directly manage, without intermediaries, their own retail stores
Giaccio M�� G�� & L�� E�� R�� Vol�� 14 No 1 (2010), 49-90
56
e) Geographical vicinity and cultural affinity are also factors that can favour the introduction of products , which in other contexts, might seem too different to be accepted.
Companies can be distinguished on the basis of the different strate-gies they adopt in their international investments:
1) Global companies have a high level of specialisation in their meth-ods of distribution and they are present in many countries. Some of these are based on large scale formats and on the presence of commercial brand name (for example, aldi, Ikea) or industrial brand names. Others are based on small scale formats or concept stores (for example, Benetton, Body Shop).
2) International multiform enterprises are characterised by their presence in many countries with formats of varying size and as-sortment. Depending on the specific requirements of the market in which they are working they may be involved in the food sector or a sector which does not include food.
3. Motives for focusing on the clothing-fashion sector
The clothing and fashion sector certainly provides a concrete example that is emblematic of the trend towards internationalisation3.
Why the choice of this sector? Because the products in this sector
are the best example of the post-modern concept of goods, because internationalisation is inherent in these products and because fashion, as an aspect of cultural, is a force to be reckoned with in understand-ing globalisation. In fact, semiologist Roland Barthes has observed that clothes are the material basis of fashion, while fashion itself is a cultural system of meanings (Barthes �970). In other words, clothing is a material product while fashion is a product of culture.
although there is a close connection between clothing and concepts of fashion, it is clear that not all clothing can be considered as part of 3 In Sartor Resartus (1833-1834) Thomas Carlyle wrote: “I am going to write about.... Silliness: I’m going to talk about clothes. God help me!”. In Carlyle’s day in scholartly circles clothes were discus-sed only for purposes of criticising and condemning their excessive frilliness, which was thought to be immoral.
The internationalisation of retail businesses������

57
the basis for a system of meaning and not all clothing comes under the heading of ‘fashion’. The term ‘fashion’ clearly denotes a more restricted field than that of ‘clothing’. Moreover, it is a well-known fact that there are a series of phenomena that have nothing to do with clothing but which are nonetheless part of ‘fashion’. The term ‘fashion, in this sense, has a broader range of meaning than the term ‘clothing’4.
Definitions for these words that specify the precise characteristics that distinguish them should be found. although there is much litera-ture on this subject , there seem to be no convincing statement of which properties characterise each one. One provisional or working definition proposed by Svendsen (2006) is: an object is fashion if, and only if, it functions as an element of social distinction and is part of a system in which it will be substituted relatively rapidly with something new”5. Examples can be made of what we do and do not consider fashion , but it is not possible to formulate a definition that contains all of the neces-sary and sufficient conditions.
In modern culture goods, knowledge and technology are among the things which dominate Man. all goods have a cultural component and if it is this component that prevails then it is the “cultural” aspects of that product that are on sale, and not its “material” aspects.
Once separated from its function a product is merely a symbol, and the most common reason for which we have always consumed symbols is to provide ourselves with an identity6.4 The Dictionnaire de la mode au XXe states that the French word mode, which means a collective style of dress, first appeared in 1482. It comes from the Latin modus. The English word fashion comes from the Latin facio or factio that in Old French became fazon and later façon and then the English fashion that means both ‘to make’ and ‘to form’, that is, to make in a particular form. By 1489 the word had assumed the meaning of “conventional usage” as regards clothing or lifestyle particularly in reference to the styles to be observed in the higher spheres of society. The current and predominant meaning of fashion appeared at the beginning of the XVIth century as “a special manner of tailoring clothing”.5 A determination must still be made as to which elements are ‘socially distinctive’ and what exactly constitutes ‘something new’.6 The example proposed by Cappelletti is apt here: Des Carte has new clothes made to wear to the Philo-sophy lesson he is going to give to Queen Christina of Sweden. By doing so he demonstrates something that did not exist before: the clothes of the philosopher have to cede their place to the clothes of the teacher. “His natural aspect is a mask until his corporality has been analysed, understood and symbolised … the person hides his nudity in order to negate himself as man-in-nature and to affirm himself ( and to appear as) man of culture…Fashion becomes a mediation between the body that hides itself and the body that displays itself to the view of others, between the natural body and the humanised body, or the body dressed in clothes that becomes appearance, the fashion chosen by him to show himself. Man is a mask waiting to rediscover himself in order to show ‘the man inside’ (Il Sè, Cappelletti 2003).
Giaccio M�� G�� & L�� E�� R�� Vol�� 14 No 1 (2010), 49-90
58
The post-modern consumer projects an ideal pleasure onto new prod-ucts because old ones have lst their power to enchant (Campbell �989). Simmel remarks that clothing should adapt to the person instead it is the person who has to adapt himself to the clothes (Simmel �998, 2003). While the traditional consumer thought of consumption as a means to an end, the post-modern consumer sees it as an end in itself.
In the fashion system the article of clothing is the imaginary object that we desire, what we actually wear is the real garment7. It is difficult to say that a garment with the brand name Gucci has a different or higher value with respect to a garment with the brand name Zara, even though the former costs ten times more, the difference is not functional but symbolic. Its trade value is completely disconnected from its use value since a Gucci dress is the expression of an ‘artificial’ need and its symbolic value amply exceeds its use value. One does not buy simply goods but rather what they represent8.
Goods then must first be transformed into signs before they can be-come objects of consumption; the brand name makes the object ‘real.’ Goods become more and more invested with prefabricated symbolic meaning which causes a certain reaction on the part of consumers.
From the earliest days of industrial production there has been an increasingly widening gap between the value in exchange of a product and its value in use and perhaps the product which is most emblematic of this gap is the ‘fashion’ product.
For this reason fashion meets the prerequisites for being studied as a symbolic cultural product and can be considered as the non-material emblem of modern commodity science.
The principle of fashion is o provoke a continuous acceleration and to make an object superfluous as quickly as possible in order to put a new product on the market in its place: clothing becomes worn out, quality 7 In the world of fashion there are always two contrasting objectives: on the one hand a person is made to seem unique and on the other hand he is shown to belong to a group. Wearing a garment means being a walking paradox since it expresses both individuality and conformity.8 The idea that the most important part of a product is not the object itself, but rather the ‘metaproduct’, is not new. The earliest shopping centres that date back to the middle of the 1800s were conceived as places in which the experience of buying was fundamental. It was for this reason that art exhibits and music concerts were held in salons specifically reserved for these purposes within the centres. The Selfridge department stores, which opened in London in 1909, were advertised in terms that carefully avoided direct mention of anything as trivial as goods. The emphasis was completely on the ‘experience of luxury’.
The internationalisation of retail businesses������

59
clothing lasts a lot longer, but the symbolic value is consumed more and more rapidly. “Novelty is a value that is bought. The novel in fashion seems to have, in our society, a well-defined anthropological function which depends of its ambiguity: it is at the same time unpredictable and systematic; regular and unknown” (Barthes �970)9.
Put in the simplest terms possible: the main problem of the post-in-dustrial business is not in satisfying the needs of consumers but rather in creating new needs.
Passing now to the second point: are clothing and fashion universal products and, as such, intrinsically open to internationalisation? Is this phenomenon limited to the West or is it universal?
adopting a general definition and keeping in mind the observa-tions made in very different societies, Cannon (�998) maintains that “even though the processes of emulation and differentiation of fashion are more apparent, in the rapid changes that characterise the systems of industrial production, the same processes can be observed in most cultures […] and in its general definition as agent of change of style, fashion appears to be universal.”
It follows then that the concept of fashion can be effectively applied to both industrialised and non-industrialised , as well as to Western and non-Western, cultures.
Fashion as an institutionalised system first appeared in France in the middle of the �9th century even though as a cultural practice it was already present during the reign of louise XIV. Colbert (�6�9-�683) ma-nipulated fashion to make French products more desirable in the eyes of the elite class of European consumers (Mukerji �997).
at one time fashion trends came from a centralised system that had its origins in Paris. This system has now been replaced by groups of designers from various countries who create styles for consumers in a globalised market (Crane �999). Fashion now comes from a plurality of sources and is spread in different ways in different consumer groups; studying its diffusion, in fact, is now more difficult because the creation of fashion is increasingly decentralised.
9 Fashion is the result of the acceptance of certain cultural values that remain open to relatively rapid change. Consumers imagine they are buying those added values when they are buying the article of designer clothing.
Giaccio M�� G�� & L�� E�� R�� Vol�� 14 No 1 (2010), 49-90

60
In the past new designs were presented to the client with a sample of the fabric or the completed article was displayed on a wooden man-nequin (Diehl �976)�0. after �850 mannequins began to be made with cardboard and were sent all over Europe, and even to Russia; they were considered indispensable elements in the distribution of the latest French fashions. The popularity of the doll-mannequin lasted up until the end of the �800s when they were gradually substituted with French figurines, and then with fashion magazines and finally with fashion shows.
The important English designer Charles Worth, who worked in Paris in the �800s, had the idea of using his wife Marie as a model for his collection: from then on he began using models in fashion shows to present his collection to his clients. By the beginning of the �900s the use of live models to present fashion creations to private clients and to the international press was already a consolidated practice, both in-side the atelier as well as at special gala parties and other cosmopolitan gatherings��. The industry relied on the growing number of publications dedicated to fashion and to new fashion trends. Specialised magazines, which reached a broad audience of international readers, carried stories about the best of the Paris collections (Mendes �999).
By the beginning of the 20th century a uniform, homogeneous mar-ket with mass production of similar goods was in expansion all over Europe, and fashion, which had once been the symbol of luxury , was now affordable by everyone. Producers accelerated the speed of turnover and when a new fashion appeared anyone who had sufficient taste and resources, including the previously excluded social classes, were able to acquire the new fashion and use it as a means to social affirmation.
“The consumption of cultural goods, such as fashionable clothing, has taken on an increasingly important role in the construction of personal identity, while the satisfaction of material needs and the emulation of superior classes are now of secondary importance.” (Crane 2004) Imitat-ing haute couture “is no longer fashionable”.
�0 In this regard it is interesting to note that as early as 1391 Charles VI of France sent the Queen of England life-size dolls dressed in the latest fashion, in clothes that had been custom made for the Queen herself.�� In 1911 the Chambre Sindacale de la Couture Parisienne was founded and it became responsible for setting the rules that regulated fashion shows, advertising and reproduction of designs. For example, photographs and sketches were prohibited.
The internationalisation of retail businesses������
6�
There are now a multiplicity of sources of fashion on an international level (london, New York, Milan, Tokyo, Sidney and others) and there is a growing number of designers of the younger generation all over the world who come from an urban culture and who are creating a variety of ‘street styles’. For example, young Japanese designers take their inspira-tion from the streets of Tokyo and they are very popular among adoles-cents who are trying to construct a group identity (Kawamura 2006).
In modern society the styles of fashion are offered in different forms to different social classes so that the new trends can reach nearly every level of consumer, regardless of geographic area in which he lives. Blumer (�969) used the expression fashion s�stem to analyse the work-ings of fashion as a social mechanism. The fashion system is a complex mechanism that facilitates controlled change in a mass society that is no longer able to furnish an identity that is stable and clearly identifiable, or to maintain order through rigid social customs (Davis �993; König �976). When a style comes to be called a fashion, advertising and the press confer prestige and social value on it, constructing its desirability and encouraging consumers in all the world to accept it. Under a system of mass production fashion has become democratic and globalised , and no longer has a precise cultural classification�2.
The appearance of avant-garde designers from a wide variety of ethnic backgrounds, has been considered as the beginning of postmod-ernism and a further step towards an authentic internationalisation. The broadened competition, both geographic and in terms of goods offered, has led businesses to search for new markets to enter and to concentrate their skills on these new markets.
Fashion is one of the sectors in which this phenomenon has had its greatest impact, so much so that it is possible to say that this industry has truly undergone a globalisation.
In analysing the process of internationalisation of a particular produc-tion sector, the factors influenced by consumer behaviour and by the structure of the distribution network must be taken into consideration (Bartlett �989). One such factor in the clothing sector is the globalisation �2 In democratic societies, in the absence of royal or noble families, film stars, popular singers and even politicians and their families have become fashion icons. The creations of designers are sure to receive attention when they are worn by celebrities. This is an instance in which producers and consumers collaborate in maintaining the ideology of fashion.
Giaccio M�� G�� & L�� E�� R�� Vol�� 14 No 1 (2010), 49-90

62
of demand: there is, in fact, a progressive homogenisation of tastes and trends in fashion on the international level that has made it necessary for the various brand name products to adapt to commercial distribution on a global scale. This homogenisation of trends is taking place both in the luxury sector as well as in the medium range product sector.
Businesses that deal in luxury brands introduce themselves into the international market, stocking their stores in all of the countries in which they are present with similar assortments of their products; they are careful to project the right image, they make substantial investments in advertising and they open flagship stores in all of the fashion capitals. The general fashion retailer (who deals in medium range products) rep-licates the distribution system it uses in its home country when it goes abroad. The standardised range of goods are in response to consumer demand and they are easily transferred among the various markets. In addition, these products have the advantage of economy of scale.
The product sold in clothing chains is conceived of in such a way as to meet the tastes of a broad range of consumers; it is made to be a truly universal product. For example, the design and the styling of these products are based on studies carried out to determine the trends expressed all over the world by consumers in the medium range seg-ment. Even the data obtained in retail stores is analysed to improve the assortment of products, etc.
It is possible to sell the same product sold in the market of origin abroad: the product (already planned for the national market) is simply transferred abroad without any modifications (this is done by businesses who are in the initial phase of internationalisation).
It is possible to sell new products which have been developed from the outset for sale in a number of countries. a ‘standard’ product is manufactured and then adapted to the specificities of various countries, without making any modifications (Mosca 2005).
4. Processes of internationalisation of the retail clothing-fashion sector
Developments in the clothing sector are more and more conditioned by the tendency to focus strategy on distribution. Sometimes internationalisa-tion is the only possible solution to stagnation in the original markets.
The internationalisation of retail businesses������
63
Historically, clothing has been considered as belonging to that cat-egory of goods for which consumer behaviour is conditioned by brand name (Fornari 2000). Recently the consumer’s attention has moved away from the brand name of a product towards the brand name of a store. Practically speaking the brand name retains its central importance as the distinguishing element that communicates stylistic and emotional attributes, but the seller must characterise the product , the retail store where it is sold and the communication (aiello and Donvito 2005).
In the fashion business the ability to compete in the long term depends on the capacity to keep value of the offer stable, while continually offer-ing the products anew in innovated forms. In this way the life cycle is determined by the succession of life cycles of the individual products (or individual seasons) (Prandelli and Saviolo �996).
The phenomenon of internationalisation in the distribution of fashion industry products started to become substantial about 40 years ago. Hollander (�970) points out that some of the most successful networks of overseas distribution were those of designers and atelier themselves who positioned their retail stores in the most prestigious streets of the capitals that symbolised Western wealth (New York, london and Paris) targeting the segment of the market that had the clients with the very highest incomes.
Generally, businesses in the fashion industry internationalise their production first and then their distribution.
It is possible to distinguish four categories of international retailer of fashion products (Moore and Fernie 2004):
�) Product �pecialist Fashion Retailers are businesses specialised in one particular type of product , for example: for children, for men, for women, for sport, and so on; they usually have small retail stores that are located in areas of great flux, such as city centres, shop-ping centres and airports, etc.
2) Fashion Design Retailers are businesses connected with the figure of the designer or with a stylistic identity which is easily recognis-able. These businesses present their own collections at seasonal fashion shows in the fashion capitals (Milan, Paris, london, New York); they have their own network of distribution with their own brand name (the designer’s name or another name that is associ-
Giaccio M�� G�� & L�� E�� R�� Vol�� 14 No 1 (2010), 49-90

64
ated with their business) and they are present in stores owned and operated by others in at least two other countries.
3) General Merchandise Retailers sell fashion products, but also other consumer goods, identifiable by a brand name, as well as a low cost line of goods. The latter are routine purchase products that have a low per unit cost and few distinguishing features (handbags, shoes, belts, etc.) and are not distinguishable by a recognisable brand name. These satisfy the basic needs of low income buyers or buyers who have little interest in buying these particular types of products.
4) General Fashion Retailers offer a wide assortment of fashion prod-ucts, including accessories, that are aimed at specific segments of demand or at the average consumer.
The process of internationalisation has been encouraged by the transformation of many businesses into corporations that are listed on the Stock Exchange, for example, the sale of stock in Tommy Hilfiger, Gucci, Donna Karan (all initially run by families). Becoming public corporations greatly changed the nature of these businesses.
an interesting element in the recent evolution of the Fashion Design Retailer is the separation of collections and of brand names according to the segment of client being targeted: haute couture, read�-to-�ear and diffusion�� The haute couture collections have the essential objective of creating images; the read� to �ear collections are made for multi-brand distribution in the producers own retail stores; the diffusion collections have their own brand name and a volume of production that is greater than the other two types and they are aimed at middle or middle-high income consumers.
Generally the entry of the Fashion Design Retailer in a foreign market takes place in four phases:
�) The launching of the haute couture and read� to �ear collections in the capital or largest city of the foreign country, in department stores, followed by the distribution of the read� to �ear to whole-salers and retailers of the major cities of the country.
2) The opening of flagship stores for the sale of the haute couture and read� to �ear collections in the capital or largest city
The internationalisation of retail businesses������

65
3) The opening of flagship stores for the sale of the diffusion collection in the capital or largest city, followed by the sale in other important cities through wholesalers.
4) The opening of a diffusion store that sells directly to the public, or of franchises in the principle cities of the country.
These phases first appeared in the 80s and 90s in many of the busi-nesses that today dominate the international market. There are also businesses that initiate the process of internationalisation simply by opening some retail stores. This is the method usually undertaken by small businesses and by designers who are not well known.
One interesting aspect of this market is ‘fast fashion’ which developed in response to changes in consumer buying habits. This phenomenon regards most often young female consumers and it has been particularly important in Europe where the market share for this group in 2005 was �8% in Spain, �2% in Great Britain and 8% in France but less than �% in the United States (Moore and Fernie 2004).
a more rapid distribution process now allows for a very fast replen-ishment in the assortment of the collection of clothes available in retail stores. Consumers are now oriented to more frequent visits to retail stores and their purchases are less and less programmed, and more and more on impulse: each time they visit the retail store they hope to find something new. This means that a limited number of each article is produced and that these must be sold in a short period of time�3.
Fast fashion products must be available in stores soon after a new fashion trend begins and after the most well known designers have begun spreading the trend. These products usually have a low price, but in order to insure that consumers buy them it is necessary that they have the perception of a continuous innovation of the goods on sale. Producers release new collections at shortened intervals and the tradi-tional seasonal subdivisions (autumn/winter) (spring/summer) have little meaning: the life cycle is reduced to a few weeks. For example, in companies who aim at the younger segment of consumers, like Zara, Hennes & Mauritz and Top Shop the replenishment of assortment can
�3 This practice spurs consumers to buy since they know the article may be gone on their next visit to the store.
Giaccio M�� G�� & L�� E�� R�� Vol�� 14 No 1 (2010), 49-90

66
take place weekly and the development of new products does not take more than four weeks.
The company must make the best use of the brand name identity, the fashion content of the product, advertising, product assortment and the product displays in retail stores.
The most frequently used methods for entering a foreign market are: �) franchising 2) opening one’s own stores 3) joint venture (Sani 2006).
�) In the clothing sector the most frequently used method is com-mercial franchising which allows for a rapid international expansion with a reduced expenditure of capital. It is one of the most widespread forms of partnership that is used in this sector (�7% of the total number of contracts in all activities) because it permits companies to take a mid-dle position between complete ownership and independent relations on the market. With this method it is possible to adopt a standardised and repetitive sales system no matter what the market.
Commercial franchising is the preferred solution of small clothing companies that have limited resources of their own to invest but who nonetheless want to enter into retailing through a vertical semi-integra-tion. For large distribution organisations franchising is, instead, a tool to be used in the transitory phase of penetrating the market, which will then be substituted by wholly owned retail sales operations.
The franchisee benefits from the franchisor’s experience, notoriety, and reputation for reliability; he can take advantage of large scale economy savings in central operations, buying and marketing. Moreover, the franchisee reduces his own entrepreneurial risk and can avail himself of the franchisor’s training and technical assistance. This system, therefore, affords substantial savings in costs of production and distribution which, in turn, make it possible for the franchisee to lower the sale price.
The effectiveness of franchising as a means of penetrating a market can be seen from the following episode that occurred in a shopping centre:
a franchise store selling goods of medium-high quality, with offers aimed at different age groups of consumers that varied in life style and buying power was opened near a boutique in a clear breach of the landlord’s contractual agreement to observe the limitations on use to which the store could be put.
The internationalisation of retail businesses������

67
The goods sold in both the store and the boutique were articles of clothing in the medium to high range of young women’s designer fashion – the goods in the boutique, however, tended more towards the high level. The prices set by the two stores were considerably dif-ferent and since the goods were essentially similar in their merceologi-cal characteristics, the boutique experienced a loss of clientele to the franchise store.
an examination of the daily receipts ledger for the year 2003 and the sales flowchart for the same period show that the boutique suffered an average sales loss of 8% per month (see Figure �). The financial damages due to loss of earnings, calculated by applying the loss suffered in 2003 to the duration of the entire contract, adjusting that figure for inflation, were in the amount of € 30,32�.
2) Company owned stores allow for a greater control over the busi-ness. The relations between production and distribution are closer and it is easier to optimise stock by continuous replenishment of assortment.
Giaccio M�� G�� & L�� E�� R�� Vol�� 14 No 1 (2010), 49-90

68
The traditional practice of ordering goods far in advance of the season when they are to be sold (basing the order on predictions made on past sales) is obsolete; continuously replenishing a share of the assortment through the “fast collection” tends to lead to “production on request”.
3) another device which is a middle course between franchising and company owned stores is the joint venture, which consists of an agree-ment between two companies to create a third, independent company for the purposes of engaging in entrepreneurial activity. The joint venture is used, for example, in countries where cultural differences necessitate collaboration with a local referent, when the large quantity of demand requires management by a local importer (for example, in the Japanese market), when there are considerable regulatory obstacles to be overcome in opening company owned stores (as was the case up until a short time ago in China).
The various distribution chains for clothing differ from each other greatly. These differences have been pointed out in the classification proposed by Calori et al (Calori, atamer and Nunes 2000; Sani 2006) (Table � below).
The first column lists Continental Leaders who aim at a limited, well-defined segment of the market, offering a wide range of products. Their
The internationalisation of retail businesses������
69
frame of reference is principally continental, for example, Marks & Spencer (British) and C & a (Dutch) operate in the European market.
The second column describes World Wide �pecialists , companies that are distinguished by their presence in the international market and by their targeting of a limited segment of the market with the objective of specialising in a particular sector, for example, Brioni).
The third and fourth columns show the characteristics of interna-tional clothing chains whose brand names have long been consolidated at the global level, which is indicative of standardisation (global fashion retailer). Elements which these two configurations have in common are: vast international networks of retail stores, global supply chains that replicate the same concept of sales, from the standardisation of assortment to the style of the product and the price levels, irregardless of the geographic locations of the stores. The two configurations differ as regards geographic extension and international presence; while the global pla�ers have a world-wide presence , the quasi-global pla�ers are principally concentrated in Europe and in the United States. Their exten-sion is not capillary and often they are present in only a few markets, often at a distance from each other, but they have a high number of stores. Their objective is to produce articles of clothing that attract the middle segment of the market in each country.
In conclusion, it is possible to note that, as regards the international configurations, the clothing sector presents great diversity which is not easily classifiable within the definitions of theoretic models (Sani 2006), as is clear from information summarised in Table 2.
The companies mentioned above, as well as Etam (French), C & a (Dutch), Mango (Spanish) and Next (English) all have in common that they are characterised by the speed of their response to the market, and for this reason are referred to as “fast food fashion”. The type of cloth-ing produced and sold by these companies is called “casual wear” and the market targeted includes the highest possible number of potential clients (i.e., of different ages, genders, income levels, fashion conscious-ness and tendency to consume). Within the context of their chains these companies can specialise, for example, in men’s wear, women’s wear, children’s clothing, young fashion, sports clothes, etc. (Sani 2006).
Generally the store name coincides with the brand name (important
Giaccio M�� G�� & L�� E�� R�� Vol�� 14 No 1 (2010), 49-90

70
element of the image) as is the case with, for example, Benetton and Zara. Others, like H & M have one store name that sells products with �6 different brand names for articles that vary in style and for the market at which they are targeted.
as regards the merchandise, two different types are sold:- the basic type: this collection is standardised and is not very differ-
ent from that of the preceding seasons;- the fashion type: this collection reflects the latest in fashion
trends.The prices are aimed at two types of markets:- the mass market in which the client chooses a product on the basis
of price (preferably low) and does not take other aspects, such as fashion and quality, into consideration;
- the selective market in which prices are higher and in which there is a higher level of quality.
The internationalisation of retail businesses������
7�
5. Quasi global players and global players: some examples
The global enterprises first expanded into countries that were close to their own country both geographically and culturally, and then they expanded into other more distant markets�4. Even after internationalisa-tion has begun the majority of these companies continue to sell the high-est percentage of their products in their country of origin. For example, even though Inditex is present in 56 different countries it sells 45.5% of its products in Spain and Benetton which is present in �20 different countries sells 27% in Italy.
Companies that distribute their products internationally aim at a “global clientele” which perceives itself as similar in spite of geographic boundaries. Products are not adapted to each individual local culture, store names and brand names do not undergo changes from one coun-try to another and even the advertising campaigns are of a general character.
The trend of market demand towards the middle-low range charac-terised by low prices and low quality has led to a change in the structure of the market. The traditional pyramid form – with the low , medium and high levels tapering into a point, has now been replaced by an hour glass form which is oriented towards two levels, one high and one low, separated by a narrow middle area.
The biggest companies tend towards intensive internationalisation through capillary expansion that aims at spreading the company name and making it well known.
luxury goods producers adopt an extensive approach by entering into more and more countries and locating their stores in city centres.
an analysis of clothing chain stores has shown that the advantages of direct management of mega-stores are superior to those from third party management of small stores.
all of them, except for Benetton, manage their own stores to get the most advantage out of the contact with the client�5.
�4 For example, in their initial phase of internationalisation Italian companies aimed at the European market, then at that of the United States and Japan, and then at emerging markets, like China and Russia.�5 However, even Benetton, that had always preferred the franchising formula, is now changing its distribution structure over to stores of its own.
Giaccio M�� G�� & L�� E�� R�� Vol�� 14 No 1 (2010), 49-90

72
hennes & Mauritz (H&M) The Swedish company H&M was founded in �947 by Elring Persson when its first retail store for women’s clothing was opened with the name Hennes (For Her) in Vasteras , �50 km from Stockholm (aiello 2005).
Its process of internationalisation began with the opening of its first retail store in nearby Norway in �964, and then successively with its entry into the Danish market in �967.
In �968 the company acquired a business, called Mauritz Widfross, that sold men’s clothing and hunting equipment in Stockholm. Follow-ing this acquisition the brand name became Hennes and Mauritz and the company then specialised in clothing for men and women, and later on, for children.
H&M became a public company trading on the stock exchange in �974 and was then able to raise the resources necessary for further growth on the international market.
Of particular importance was its entry into the UK market in �976 with the opening of three retail stores. The UK was to become H&M’s third largest market.
The company entered the German market in �980.The H&M chain entered the US market in 2000 with its first retail
store on Fifth avenue in New York, followed by other stores on the east coast, then in Chicago and finally on the west coast, beginning in San Francisco. In four years 75 stores were opened. The company expanded further in western Europe and then in some eastern countries and then did further expansion in north america (including Canada).
By the end of 2004 H&M was present in 20 countries with over �,000 retail stores and with a gross income of about 6.6 billion euros. The data regarding its internationalisation are as follows: in �997 it took in 76% of its gross receipts in foreign markets, by 2004 that figure had risen to 9�%. Its principle market is Germany (28%) then Scandinavia (20%) and from the other western European countries (45%), from North america (6%), and from Eastern Europe (�%)
The distribution network of H&M is comprised exclusively of stores that are owned and directly operated by the company without the use of franchising or other types of agreements.
There are essentially two types of stores:
The internationalisation of retail businesses������

73
- the full range store where all of the lines of clothing are sold, including accessories, underwear and cosmetics for men, women, teenagers and children;
- the concept store, located in the most attractive areas of the city, they offer products that compliment those offered in the full range store and are aimed at a specific segment of clients, for example, H&M Man is for men and Beaut�box offers underwear, accessories and cosmetics.
The retail stores are located in the main streets where competitors in
the sector are also located. The company postpones opening a new store until a site becomes available in one of the best locations.
Together with the H&M brand name, the slogan Fashion and qualit� at the best price constitutes a part of the H&M offer. It places the emphasis on fashion at a particularly competitive price. In fact, H&M distributes between 500 to 600 thousand articles a year at an average price of from �2 to �3 euros, and it can, therefore, be considered the largest retailer of low cost clothing in Europe.
The emphasis on innovating the offer spurs the company to continu-ous refurbishment and even remodelling of its retail stores in order to “always surprise the consumer with something new”, and there is a continuous flow, a daily replenishment of the stock in the retail stores. The fashion product of H&M is comparable to perishable goods that have a shelf life of a few days.
H&M offers three levels of products for each of the market seg-ments targeted: Men, women, teenagers, children. High fashion prod-ucts (which are actually typical fast fashion items) mirror the latest in fashion trends, have an extremely rapid production time and are produced in limited quantity. Three weeks pass from design to avail-ability in the retail store.
The largest segment of its production is that of basic fashion which is based on classic fashion themes is produced in large quantities and has a design to retail cycle of up to six months. The intermediate level is that of current fashion which accounts for a large part of the innovative offer that characterises the seasonal collection.
Giaccio M�� G�� & L�� E�� R�� Vol�� 14 No 1 (2010), 49-90
74
Once the new collection has been designed�6 H&M manufactures abroad using hundreds of independent suppliers who are coordinated by 22 offices that are located all over the world (one office is in Milan) who are each responsible for a specific geographic area.
In conclusion, Hennes & Mauritz uses a single brand name, has developed a strategy for competing in the so-called fast fashion sector, it participates directly in the design of its collections and it exerts and exclusive and direct control over its network of distribution. Its mer-chandise is produced outside of Sweden.
H&M’s choices are different from those of its principle competitors. In fact, Benetton developed through franchising, Zara (the most im-portant brand name of the Spanish group, Inditex) produces part of its merchandise itself and has a number of different store names and Gap has a number of brand names and a mixed distribution network.
zara: is an international chain of clothing stores that belong to the Spanish group Inditex (Industria de Diseño Textil S.a.) which owns other brand names such as Massimo Dutti, Pull and Bear, Bershka, Stradivarius, Oysho and Kiddy’s Class, and, at the same time manu-factures its own specialty lines for women, men, children and the home (Zara Home).
It was founded in �975 in la Coruña, Spain and currently has 899 stores in 62 countries throughout the world. It has 507 stores in Spain, ��3 in France, 80 in Italy, 74 in Portugal, 62 in Germany, 58 in the United Kingdom, 50 in Greece, 47 in Mexico, 33 in Japan. It is interesting to note that in some cases the “country of origin” factor can have a favourable effect. For example, in some latin american countries, like Mexico and Venezuela, a Zara product is perceived as being for a high level con-sumer, while in Spain the same product is perceived as something for middle level consumers�7 (Sani 2006). In august of 2005 Zara appeared for the first time on the list of the �00 major brand names in the world. It was 77th on the list according to Business Weeks annual classification, �6 H&M designs all of its collections at a single location in Stockholm called the Buying and Design Department.�7 Generally speaking, products can be perceived in the same way as in the country of origin, or they may be seen more favourably than local products and be requested by high level consumers more often than local products. It can also happen that the product is perceived as unsatisfactory for the needs of the local market. All three of these situations can occur in the product distribution of large clothing chain stores.
The internationalisation of retail businesses������

75
and in March of 2006 it had surpassed the sales of one of its major com-petitors, Hennes and Mauritz.
Some of the particularities that characterise Zara are: the short time it takes to design and produce new products (two to three weeks), the continuous up-dating of its lines in response to data on sales, produc-tion carried out exclusively in Spain and the fact that it does not do advertising campaigns. Retail operations take place in stores that are owned by the company itself, that are strategically located and whose window and interior displays are created with great care.
The integration of these activities allows the company to respond quickly to market demand. Clearly, only a company that has integrated activities from the production to the commercialisation stage is able to respond quickly to market demand. Zara has adopted just such a policy: it has internalised its production (it owns 2� factories) as well as its sup-ply (half of the fabric it uses is supplied by a company that it owns).
One of the most notable differences between these two European gi-ants of fast fashion is that Inditex can count on its own national market as a base from which to extend throughout the continent, while H&M, given the small dimension of the Swedish market, had to create a base in nearby Germany from which to extend its retail operations.
In addition, the companies’ capacity to respond quickly to the market is an important aspect of competition. The company that has the quickest response or lead time is Zara. It takes Zara only two weeks from creation of a product to having the product on sale in its stores. This speed has become a yardstick for measuring a clothing company’s capacity for in-novation. H&M takes three weeks, but it has a production system which is different from that of Zara. Other companies maintain a programmed production approach and show little interest in ready-to-wear clothing. For example, Gap has maintained a basic style with minor changes in response to market trends and a lead time of 9 months (Sani 2006).
6. Benetton and the internationalisation of Italian clothing producers
Today the Benetton Group is present in �20 countries in the world and it has a consolidated Italian identity that is reflected in the brand names United Colours of Benetton (casual), �isle� (glamour), Pla�life (american
Giaccio M�� G�� & L�� E�� R�� Vol�� 14 No 1 (2010), 49-90

76
collegiate style). The commercial distribution network has over 6,200 stores and generates total sales proceeds of over 2 million euros.
Benetton, like Zara, has chosen to own and manage its own produc-tion sites because of its strong ties to its territory of origin. Both compa-nies have production operations that are concentrated in their countries of origin and that constitute truly local production systems, having a strong reliance relying on a strong contribution from small and medium sized businesses that are specialised in phases of production: cutting of fabric, assembly and sewing.
Benetton has a network of subcontractors in Castrette, near Treviso (Cre-stanello �999), and it exploits the know how and the skills of Italian weavers and tailors to export products abroad that have a global brand name but, nonetheless, are still very much in the tradition of Made in Ital���
Zara has its production centre in Galizia; it exploits the domestic network in order to reduce the time required to restock its stores and it concentrates its production phase, thereby reducing production and distribution times so that its products meet market expectations as to reduced waiting time. Hennes & Mauritz and Gap, in contrast, design and sell but do not produce their merchandise – their production is outsourced to other countries.
The global brand name of Benetton is United Colours of Benetton, which is one of the most well-known brands in the world.
Every season the women’s, men’s and children’s collections propose a ‘total look’ that is suited to everyday activities: from work to leisure time, in the city or in the great outdoors. The label Benetton Bab� was created for the new line of products designed for the prenatal, infancy and early childhood phase - up to 5 years of age. The Benetton brand is present in many other product sectors: accessories, clothing, sun glasses, perfume, products for the home and for children, etc.
another extension of the brand name is Undercolours of Benetton which offers a line of underwear, pyjamas, accessories for women, men and children and a collection of beach wear. The broad range of basic colours used in these collections is enriched each season in response to the latest fashion trends.
The label of the Benetton Group which is most carefully attuned to the avante-garde of fashion is �isle� which offers a collection that
p1’ Cp1 tr
The internationalisation of retail businesses������

77
is the product of a refined and careful selection of design and fabric. It relies on advertising campaigns with a strong emotional impact to create its image. an extension of this brand is �isle� Young , the line for children between 8 and �2 which has been given a strong connotation of fashion.
The sports clothes line goes under the brand name Pla�life�� Its col-lections are a blending together of traditional american collegiate and exclusive sporting circle styles.
Generally speaking, in Italy internationalisation of distribution is seen principally in businesses that eventually branch out and open their own retail operations. The industrialisation of the clothing sector in Italy took place in the �950s. In the period prior to the Second World War there were about thirty clothing manufacturers of medium dimension (employing a total of 500 workers) all located in the industrial triangle. after the war a broad range of production operations came into life, mostly of medium or medium-high quality level.
The first push towards internationalisation was triggered by the dra-matic economic and financial situation in which the partly government owned clothing manufactures found themselves ( ENI Group: lanerossi; lebole, etc. GEPI Group: abruzzo, Geoconf, San Remo, etc.).
These companies were showing sales proceeds per employee that were not only lower than the average in the sector but were actually too low to cover even the cost of the labour (Pent Fornengo, �978).
Direct government intervention in this sector began in �962 when ENI acquired the lanerossi Group (which included lebole) , an acquisition that was justified as creating a possible advantage of vertical integration, in the early phase, with synthetic fibre producers and, at a later phase, with the acquisition in �965 by lebole of 28 stores for retail distribution�8. Since government participation had produced negative effects, many companies had to give up production and in the �970s the majority of the medium-large companies began to seek a greater flexibility and competitiveness by following these two directions:
�8 The 1971 Industrial Census furnished some interesting information about this sector so characterised by notable changes : The Finanziario Tessile Group was the major national producer of men’s clothing (13.5%) followed by Marzotto, Lebole, Lubim, San Remo, Corneliani and Abital. In the women’s clothing sector the Tessile Miroglio Group was in first place (10%) , followed by the Finaziario Tessile Group and then Marzotto.
Giaccio M�� G�� & L�� E�� R�� Vol�� 14 No 1 (2010), 49-90

78
- outsourcing of production to foreign countries where costs of labour were lower. One of the most well known examples is that of SOCaM that decided to focus on the production of articles of men’s cloth-ing of average quality and to have the clothing produced almost exclusively in Romania and then imported to Italy.
- outsourcing of production to other companies in Italy who pro-duced on commission, transforming the manufacturer into a com-mercial business; this approach became common in the casual wear and sportswear sectors, where the work was given to other companies who worked a facon because of the great variability of fashion and the impact of seasonality. This approach did not prove to be suitable for luxury articles.
It should be noted here that historically the first form of interna-tionalisation of an Italian company in the textile business was that of Lani��cio Rossi, a business, it should also be remembered, that was the biggest national industrial complex of that period. according to histo-rian lucio avagliano (�98�), it was an extraordinary factory run by an equally extraordinary entrepreneur. The lanificio became a corporation and between �873 and �898 it had an evident monopolistic position in the market. The company was able to compete with all of the large foreign companies in spite of its inferior business organisation. In this period lanerossi founded two export businesses in latin america, one in Buenos aires and another in Valparaiso. later on it founded another in Bulgaria for the supply of cloth for military uniforms. In �878 in managed to sell its products in Constantinople which had usually used Viennese wholesalers previously.
7. world-wide specialist: the case of Brioni
The story of Brioni has already been told by many (Giorgetti �995; Chenoune �998; Merlo 2003; Sargiacomo 2008). The fashion show or-ganised in �95� by the Marquis Giovanbattista Giorgini at the Grand Hotel in Florence, signalled the emancipation of Italian fashion from the influence of the French. The show consisted “exclusively of Italian tailored-made ‘creations’ and it had been scheduled to take place right
The internationalisation of retail businesses������

79
after the French fashion shows in order to induce the international buy-ers (mostly americans) to extend their travels in Europe to Florence” (Merlo 2003). Prior to this event the Italian fashion designers each held their own fashion shows in their own atelier��
In addition to the traditional women’s fashion designers, the men’s fashion sector was also represented by Brioni, Saraceni, Duetti and Tor-nato who all had their places of production in Rome. It was a revolution-ary event since no man had ever before modelled clothes on a catwalk.
another show of high fashion men’s clothing was held the year after in the Sala Bianca of the Pitti Palace. This event acclaimed the definitive success of Brioni not only in Italy but also at the international level. “all of the clothes at first surprised the public, who were not used to this explosion of inspiration and colours, but they then received the consensus and applause of everyone, particularly the american buy-ers” (Vergani �992).
In �945 the well-known tailor Nazareno Fonticoli�9 and his friend Ga-etano Savini, who managed sales and public relations, opened a tailor’s shop in Rome in Via Barberini and called it atelier Brioni. There was a workshop in which the designs were elaborated and then produced as well as a store for the direct sale of the products to a high level of international clients.
The name of the new business was chosen after a careful search for a word that was synonymous with luxury and elegance. The final choice, Brioni, is the name of a small island off the coast of Istria that was a fa-vourite holiday gathering place of the European nobility and the wealthy middle class who would meet there for elite sports activities like golf, horseback riding and polo, in the �920s and �930s. a polo player, an image that evokes a style that is dynamic, elegant and refined, became the logo of the business. Within a few years that logo became famous all over the world. Brioni received a great deal of recognition in the fashion world, some important examples of which are the following:
In �952, during the third annual Italian High Fashion �ho� in New York, the prestigious department store “B. altman & Co.” dedicated an entire window of its 5th avenue store to evening wear by Brioni.
�9 In his Il Mezzogiorno Operosa, Storia dell’industria in Abruzzo, Donzelli Editore, Roma, 2008,p. 402, Costantino Felice defines Foticoli as a ‘myth’ in the world of fashion.
Giaccio M�� G�� & L�� E�� R�� Vol�� 14 No 1 (2010), 49-90

80
In �954 when Brioni held its first fashion show in New York, followed by shows in the other major american cities, Life magazine proclaimed them to be the new “Dior of men’s fashion”. The Ne� York Times observed that they had created a “new look for men” and the Boston Herald called them the leaders of a “second Italian Renaissance”. In May of �957 To�n & Countr� wrote : “today there is a name, a tailor, whose influence has changed the direction of Men’s fashion: the Roman tailor’s Brioni , is the house of haute couture for men”.
In �959 Fonticoli and Savini founded Brioni Roman �t�le in their native city of Penne, a short distance from Pescara. In that same year Brioni received the Caswell Massey award for excellence in the creation of formal and sports wear and accessories for men (Chenoune �998). The great craftsmanship of the abruzzo tradition of tailoring was called “the Made in Italy that is most highly praised throughout the world” by the american magazine Gentleman’s Quarterl� and in the same article Naza-reno Fonticoli was acclaimed as “the tailor who, more than any other, is responsible for having introduced Italian fashion to the americans”.
More recently, Brioni received the European Fashion Diamond at the Düsseldorf Fashion Fair.
The Luxur� Brand �tatus Index of 2007, compiled by the luxury In-stitute, an independent organisation with headquarters in New York, classified Brioni as the best luxury brand for men’s fashion in the world. Giorgio armani and Ermenegildo Zegna shared second place and Fer-ragamo was in third place.
In the worldwide classification of luxury brands, compiled by the magazine Milano Finanza in January of 2009, the Brioni brand name was chosen as the best brand in men’s fashion. Other brands listed in this classification include Rolls-Royce for automobiles, Van Cleff & arpels for jewellery and Hermes for leather goods, Guerlain for perfumes, Krüg for Champagne and Valentino for women’s fashion.
The origins of the abruzzo tradition of tailoring, and in particular, the tradition in Penne, go back to the distant past. The tradition, in fact, has its roots in the nineteenth century20. By the �920s the tradition had developed and matured and in addition to the tailors’ in Penne many
20 An Evening and Sunday School for Arts and Crafts was instituted in Penne by a ministerial decree on February 14, 1887.
The internationalisation of retail businesses������

8�
tailors, who had learned their craft in abruzzo, were opened workshops in Rome, Milan, and even in Paris (Vergani 2004).
an indication of the marked vocation of the people of abruzzo for the craft of tailoring as well as that of embroidery, goes back even further to the early religious communities where these crafts were practised. They were part of a cultural and historical context which is of great importance to the collective memory of the community (Pinna vetustissima, the capital of the Vestini)2�. It was in the atmosphere of a Renaissance workshop, where craftsmen were both the creators and producers of quality, that the business philosophy of Brioni Roman Style was developed, enabling the business to become an example of a tailor’s atelier organised in line with industrial criteria: the production of a suit is subdivided into 220 stages of work, 5,000 to �2,000 stitches are hand sewn on every jacket (all the buttonholes, for example, are finished by hand), at least 80 different ironing procedures are done and it takes at least 22 hours to complete production of a suit, without using automated means (less than half the time it takes a tailor working on his own to make a whole suit)22.
The number of custom made articles produced per year is �5,000 while the number of ready-to -wear articles is 60,00023.
The Brioni atelier is in a niche position in the traditional high fashion sector; its products are aimed at a very high level of consumer and it has an “intrinsic capacity to penetrate markets due to the quality of the product”24.
Obviously, the price is also the very highest price for a man’s suit, but in this context the price is only of secondary importance since the competition is based on the image, the quality, the materials used, the service offered (which is very highly personalised) , the timely delivery and the services offered both before and after the sale. The basic ready-to-wear suit costs between $4,000 and $6,000, while the custom made suits cost up to $20,000. In comparison, a suit produced by the fashion house Emporio armani costs in the range of $�,300. 2� The importance of this activity is confirmed by the presence in the church of the Annunziata in Penne of an 18th century painting of Saint Omobono, the patron saint of tailors.22 Nothing of this kind exists in Italy. The idea was to reproduce a large craftsman’s workshop in an industrial plant, to create products not in a factory but in an integrated community of workers.23 The tailors who work for Brioni come from the Nazarano Fonticoli School of Tailoring, founded in 1980 by Lucio Marcotullio, who was for many years the managing director of the business.24 These are the words of the former managing director, Lucio Marcotullio.
Giaccio M�� G�� & L�� E�� R�� Vol�� 14 No 1 (2010), 49-90

82
The Brioni collection is presented twice a year, in January and in June, normally at the Pitti Palace or in the company’s own stores, or sometimes in the context of special events dedicated to Brioni in the luxury fashion capitals of the world. The Brioni organisation manages every phase of the product’s life - from creation of the collection to the production and distribution of the products.
Most of the production takes place in the headquarters in Penne but the adoption of a strategy of production diversification has led to the open-ing of eight new production sites, all closely connected to the main site in Penne and all of which share the same product image philosophy which includes never making use of external collaborators. The design and finance aspects of the business, instead, are managed in the offices in Rome and Milan. The company has internationalised its commercial operations. The network of retail stores, present in the main cities and resorts of the most developed countries, is managed directly by the company itself.
In 2000 Roman Fashion S.r.l. was incorporated for the production and commercialisation of women’s clothing. This entry into a new sector met with considerable approval from the world market, particularly in asia, and the sales of women’s clothing rose to �5% of the total sales, offering great promise for further development in the future.
From its very beginning Brioni has had its own retail stores: after its very first store in Via Barberini, in �982 the company opened its first mono-brand store in New York, and its third store in Florence, near Palazzo dell’arte di lana.
From the �990s onward the Company has been expanding on the international level, mainly utilising indirect channels of sale and distri-bution agreements with high profile department stores, such as Marcus (USa), Bergdoff Goodman (USa), Harrods (london), KaDeWe (Berlino), to name a few of the most important. This choice of strategy has allowed Brioni to enter various international markets without creating heavy burdens on the general management.
Even though Brioni is a small company, its current retail network has expanded to a global level and includes 420 retail sales sites, 80 of which are located in the United States in the principle cities in all of the States. Most of these stores are extremely elegant boutiques that carry a number of different brands.
The internationalisation of retail businesses������

83
The group’s market is based mainly outside of the EU (65%), preva-lently in the United States, followed by the EU market (�9%) and then the Italian market (�6%).
The group owns and manages 90% of the retail stores where its prod-ucts are sold, the remaining stores are run under franchise agreements.
Some of the retail stores that are controlled directly by the group are listed below in Figures 2 and 3.
Brioni benefits from its close-knit worldwide sales network, in which corporations (for example, Brioni R.S. Japan Co. lTD) deal with overseas markets and retail companies (for example Brioni Retailer in america) deal with the direct retail operations.
The sales network is an articulated structure of brand name retail stores and sales representatives present in every part of the world; it consists of:
- Flagship stores, i.e. stores which carry high line luxury products, present in cities like Rome, Florence, Milan; New York, Beverly Hills, Paris, london, Prague and Tokyo;
- Top resort stores, i.e. stores that are seasonal and present in the most exclusive vacation resorts in the world, for example, in Capri, portofino, Porto Cervo, Malaga, aspen, etc.
The relations between the retails and Corporates are established by the head office with an eye to implementing a unified sales policy but also leaving each individual sales unit autonomy to act on its own.
Giaccio M�� G�� & L�� E�� R�� Vol�� 14 No 1 (2010), 49-90

84
The internationalisation of retail businesses������

85
an interesting particularity emerged from our observation of Brioni’s strategy for internationalisation towards the East. as can be seen from the map below, it retraces, at least in part, the ancient silk road. Its stores, in fact, are located in a sequence that goes from Dubai to abu Dhabi in the arab Emirates, Baku in azerbaijan, almety in Kazakhstan, Bombay and New Delhi in India, Kuala lumpur in Malaysia, Jakarta in Indonesia, Hong Kong, Macao and Beijing in China and Seoul in South Korea.
Giaccio M�� G�� & L�� E�� R�� Vol�� 14 No 1 (2010), 49-90

86
8. Conclusion
It is possible to affirm that within the large chains of distribution in the clothing sector there are many differences in relation to the numbers and types of activities that have been internalised and that are managed autonomously. There are companies like H&M and The Gap that only engage in activities connected with the logistics and distribution (be-sides design management) and they outsource the production activity and get their supplies from external companies. There are other com-panies that engage in the design and production activities themselves but do not own most of the retail stores that sell their products, which are instead, in franchising (for example, Benetton). There are still other companies, like Zara, who exemplify the notion of integrated retailers: they own their own production plants, they own their own retail stores and they control up to �00% of the capital of the companies who are their major suppliers.
The internationalisation of retail businesses������
87
It is, consequently, difficult to identify clear tendencies in international configurations, apart from that of global management, which consists of global networks for supply, production and distribution.
The factors which have encouraged the internationalisation of cloth-ing products have been:
- the existence of a trans-national segment of consumers who have similar characteristics;
- the homogeneity of models of acquisition and consumption on the global level;
- the need to enlarge national markets towards similar external mar-kets in order to guarantee an adequate sales potential;
- the opportunity to exploit the economy of distribution (of replica-tion).
If globalisation means mobility of people, goods and symbols across frontiers thanks to the disappearance of the structures and confines that once existed, in the world of fashion. Western clothing no longer unequivocally defines current trends or fashion and fashion systems are becoming more and more globalised and decentralised.
It is possible to affirm then that the internationalisation of the retail clothing business is a feature that is ingrained in the business itself, and that this sector contains within itself both the material elements neces-sary for internationalisation as well as the fashion culture required for globalisation.
Giaccio M�� G�� & L�� E�� R�� Vol�� 14 No 1 (2010), 49-90

88
References
aiello G. (2005), L’internazionalizzazione delle imprese al dettaglio, Franco angeli, Milano.
aiello G., Donvito R. (2005), Comunicazione integrata nell’abbigliamento: strategie di marca e ruolo del punto di vendita nella distribuzione specializzata statunitense, Convegno Internazionale “le tendenze del Marketing in Europa”, Ecole Supérieure de Commerce de Paris ESCP-EaP, Parigi 2�-22 Gennaio.
alexander N. (�997), International Retailing, Blackwell Science, london.avagliano l. (�98�), “Un imprenditore e una fabbrica fuori dal comune:
Alessandro Rossi e il lani��cio di �chio”, in L’industrializzazione in Italia (1861-1900) a cura di Mori G., Il Mulino, Bologna.
Barthes R. (�970), �istema della moda�� La moda nei giornali femminili: un’analisi strutturale, Einaudi, Torino.
Bartlett C. a., Ghoshal S. (�989), Managing across Borders, Harvard Business School Press, Boston.
Blumer H. (�969), Fashion: from Class Differentiation to Collective �elec-tion, The Sociological Quarterly, �0 (3), 275-29�.
Calori R., atamer T., Nunes P. (2000), The d�namic of international competition, Sage, london.
Campbell C. (�989), The Romantic Ethic and the �pirit of Modern Con-sumerism, Blackwell, Oxford.
Cannon a. (�998), The Cultural and Historical Contexts of Fashion, in Niessen s. Bryden a. (a cura di), Consuming Fashion: Adorning the Tran-sational Bod�, Oxford, Berg, 23-38.
Cappelletti V. (2003), “La moda come intersezione di paradigmi”, Global & local Economic Review, VI, 23-35.
Chenoune F. (�998), Brioni, nella collana “Memorie della Moda”, Octavo Franco Cantini Ed., Firenze.
Chenoune F. (�998), Brioni�� Universe of Fashion, The Vendome Press, XXX.
Crane D. (�999), Diffusion Models and Fashion: A Reassessment, The annals of the academy of Political and Social Science, 566 (��), �3-24.
Crane D. (2004), Questioni di moda: classe, genere e identità nell’abbiglia-mento, Franco angeli, Milano.
The internationalisation of retail businesses������

89
Crestanello P. (�999), L’industria veneta dell’abbigliamento, Franco angeli, Milano.
Davis F. (�993), Fashion, Culture and Identit�, The University of Chicago Press., Trad. it. Moda, cultura, identità, linguaggio, Bologna, Baskerville.
Dawson J.a. (�994), “The internationalisation of retailing operation”The internationalisation of retailing operation”, J. Marketing Management, �0 (4).
Diehl M.E. (�976), Ho� to Produce a Fashon �ho�, Farchild Publica-tion, New York.
Dunning J.H. (2000), “The ecletic paradigma as an envelope for eco-nomic and business theories of MNE activit�”, International Business Review, 9.
Felice C. (2008), Il Mezzogiorno Operoso�� �toria dell’industria in Abruzzo, Donzelli Editore, Roma.
Fornari D. (2000), Rivoluzione commerciale & trade marketing, Egea, Milano.
Giorgetti C. (�995), Brioni�� Cinquant’anni di stile, Octavo Franco Can-tini Ed., Firenze.
Hollander S. (�970), Multinational Retailing, Michigan State University, East lancing, Michigan.
Horvath E. (�994), “Le strategie di internazionalizzazione delle imprese di distribuzione”, Sinergie, �2 (33).
Kawamura Y. (2006), Fashionolog��� An Introduction to Fashion �tudies, Trad. it.: La moda, Il Mulino, Bologna.
König R. (�976), Il potere della moda, liguori, Napoli. lorenzoni G., Manaresi a. (200�), “I processi di internazionalizzazione
dell’impresa minore: l’internazionalizzazione attraverso i punti di vendita”, Sinergie, �9 (�3).
Mendes V., De la Haye a. (�999), 20th Centur� Fashion, Thames & Hudson, london.
Merlo E. (2003), Moda Italiana�� �toria di un’industria dall’Ottocento ad oggi, Ed. Marsilio, Venezia.Marsilio, Venezia.
Moore C.M., Fernie J. (2004), Perspective in international retailing, a cura di Bruce, Moore, Birtwistle, International Retail Marketing: A Case �tud� Approach, Elsevier Butterworth Heinemann, Oxford.
Mosca F. (2005), Le strategie di distribuzione ad elevato valore simbolico, Giappichelli Editore, Torino.
Giaccio M�� G�� & L�� E�� R�� Vol�� 14 No 1 (2010), 49-90

90
Mukerji C. (�997), Territorial Ambitions and the Gardens of Versailles, Cambridge University Press, Cambridge.
Pent Fornengo G. (�978), L’industria italiana dell’abbigliamento, Il Mu-lino, Bologna.
Prandelli E., Saviolo S. (�996), “Verso il prodotto relazionale�� Alcune evi-denze del settore dell’abbigliamento giovane”, Economia & Management, 6.
Sani a. (2006), �trategie di internazionalizzazione e grande distribuzione nel settore dell’abbigliamento, Firenze University Press, Firenze.
Santoprete G., Giaccio M. (2003), “Niche-produced food commodities”, J. Commodity Science, 42 (III), ��9-�46.
Sargiacomo M. (2008), “Institutional pressures and isomorphic change in a high-fashion compan�: the case of Brioni Roman �t�le, 1945-89”, account-ing, Business & Financial History, �8 (2), 2�5-24�.
Simmel G. (�998), La moda, Mondadori, Milano.Simmel G. (2003), Filoso��a del denaro, UTET, Roma. Svendsen l. H. (2006), Filoso��a della Moda, Ugo Guanda Editore,
Parma.Treadgold a. (�990), “The Developing International of Retailing”, Intern.
J. Retail & Distribut. Management, �8 (2).Vergani G. (�992), La �ala Bianca: nascita della moda italiana, Electa
Ed., Milano.Vergani G. (2004), �arti d’Abruzzo�� Le botteghe di ieri e di oggi protagoniste
del vestire maschile, Skira, Milano.Wigley S.M., Moore C.M., Birtwistle G. (2005), “Product and brand��
Critical success factors in the internationalisation of a fashion retailer”, Inter-nat. J. of Retail & Distribution Management, 33 (7).
The internationalisation of retail businesses������
9�
G. & L. E. R., Vol. 14 No. 1, 2010
* Political Sciences Faculty, “Roma Tre” University; Italian Society of Economists (S.I.E.); Royal Economic Society (R.E.S.); inter-Departmental Research Centre of Economy of the Institutions (C.R.E.I.).e-mail: [email protected]; fax: 0039 0657335282; tel.: 0039 3316876907.The Author thanks Prof. Gian Cesare Romagnoli for the advices received in the course of this resear-ch. However, the opinions expressed in this essay - as well as any errors - are to be attributed only to me.� See: Myrdal G.K., The Political Element in the Development of Economic Theory, Routledge & Kegan, London, 1953, p. VIII.
«[…] the fact of believing in a corpus of scienti��c kno�ledge acquired independentl� of an� judgement of values is, as I consider it to be, a naïve
empiricism�� […] questions are an expression of our interest in matters of the �orld, the� are in essence assessments»1��
G. K. Myrdal (�898-�987)
Abstract
“Wagner’s La�” is the ��rst model of public expenditure in the histor� of public ��nance�� The aim of this article is to assess its empirical evidence in Ital� for the period 1960-2008�� After a brief introduction, an essential surve� of the economic literature on this issue is offered, before evaluating the speci��cations of “Wagner’s La�” due either to Ram or Koop & Poirier�� Wagner’s original speci��cation is also evaluated�� A fe� notes on the expenditure polic� in Ital� conclude the paper��
JEL CLassifiCation: E60; H50; H60.
KEywords: public expenditure; Wagner’s Law; structural reforms; Italian public finance.
Cosimo Magazzino1
“wAGNER’S LAw” IN ITALy:EMPIRICAL EVIDENCE FROM 1960 TO 2008

92
1. Introduction
The purpose of this essay is to assess “Wagner’s law”, one of the first and best known models of the dynamics of public spending. In his opinion the incidence of the latter on national income is set to increase over time. as far as the Italian case is concerned2 , this occurred from the beginning of the Sixties (when “first centre-left” governments started) up to 20083. The data used is taken from the aMECO database of the European Commission4.
a synthesis of the literature that, over the years, has taken shape on the model initially proposed by a. H. Wagner at the end of the �9th cen-tury is followed by an overview of different econometric specifications of “Wagner’s law” and a discussion on the various methods used by scholars in their empirical analyses are discussed.
Subsequently, we have assessed these relationships with a differ-ent specification that could isolate the price effect, considering such independent variables as the real GDP calculated at market prices and market prices GDP deflator.
The results of the estimates regarding policy changes are commented with methodological caution, derived from the “error theory” (Romagnoli, 2005), in order to select those appropriate for the requalification and the reduction of Italian public spending, in line with the conclusions of the Libro Verde sulla spesa pubblica and (with the findings) of a number of researchers (Ministero dell’Economia e delle Finanze, 2007). However, we are unable to comment on the inevitable and irreducible presence of value judgments in the modelling of the theory.
2. wagner’s society model
as the Nitti (�972), Musgrave (�969), and Rostow (�97�) models, also Wagner’s model too may be included among the “society models”.
We owe to adolf H. Wagner - a German economist of the second half of the �9th century (a “socialist of the chair”) - the first theory on the in-
2 For an analysis of different models, applied to other databases, see Magazzino C. (2008).3 The econometric software used is STATA 11. See web address: http://www.stata.com/.4 See: http://ec.europa.eu/economy_finance/db_indicators/db_indicators8646_en.htm.
“Wagner’s la� in Ital�: empirical evidence from 1960 to 2008
93
crease of public expenditure (Wagner, �883, �9�2; Chrystal and alt, �979; Jackson, �979). This theory proposed by Wagner is a “society theory” that therefore makes the growth of public expenditure dependent upon the structural evolution of society (De Rosa, 2005). He examined the existence of a desirable limit to the size of the public sector, determining that a limit was in fact not possible. In his opinion, the development of spending is determined, essentially, by the increase of national income. an increase of this variable generates a more than proportional expan-sion of the public sector. It follows that what Wagner defined as “the law of increasing expansion of the public sector” (Wagner, �9�2), arguing, in his final analysis, that the value of financial pressure would increase.
at the core of Wagner’s thesis is, predominantly, the interaction exist-ing between the growth of the public sector and that of private activi-ties. With the increase of economic development, exchanges intensify among operators and the network of relationships becomes more and more complicated and controversial. all this can be addressed through legislation and arrangement of new and heftier controls. Moreover, since the processes of industrialization and urbanization create external diseconomies – such as the congestion effect or the deterioration of the environment –, the public sector has been called to find a remedy to these challenges (Wagner, �883).
In contrast, satisfaction of higher needs would be the explanation for the growth of social services. Insofar as the elasticity of such common consumptions with regard to income results to be superior to the unit. aa continuous expansion of social services is easily foreseeable and, since and, since citizens are ready towards financing such services with increasing shares of their resources, it would be senseless to set limits to these consump-tions (Brosio, �987; Mastromatteo, �984; Michas, �975; Franco, �993). Consequently, there is a limit to public sector growth. By that, a planned level of public expenditure (and a consequent determinate relationship between these and the national income) beyond which the community would not agree to give up increasing shares for private spending. Having reached this point, public spending should become fixed on a proportionally constant share of the general economic activity. It is possible, therefore, to highlight two distinct periods of development of expenditure. The first is distinguished by progressive growth, in which
Magazzino C�� G�� & L�� E�� R�� Vol�� 14 No 1 (2010), 91-115

94
the percentage variation of public expenditure turns out to be greater than the percentage variation of the aggregate income. While the second period is distinguished by proportional growth, when the percentage variation of public expenditure turns out to be equal to the percentage variation of the aggregate income (Sobbrio, �999; Dominick, 2002).
From a methodological point of view, the empirical evidence concern-ing the relationship between public income and expenditure is based on the assessment of the elasticity of expenditure to income. Only if such elasticity is superior to the unit and the coefficient sign is positive, could we then come to the conclusion that the link between the two variables exists and it is consistent with Wagner’s hypothesis (Fossati, �98�, �999; Diba, �982; Jackson, �980; Hadjimatheou, �976).
However, in the Wagnerian analysis an explicit reference to political mechanisms of decision was missing (Brosio, 2003). as a “socialist”, Wagner made reference to the “organicistic theory of the State”. The State interprets the will of citizens, it is not a mere reflection of its single con-stituent units. It takes decisions pursuing an interest that by definition is general, as it results specifically from State will. Here, the implications of “holism” are evident, with the consequent rejection of “ethic individual-ism” as well as of the “methodological” one (acocella, �999).
3. A review of the results obtained
The model proposed by Wagner has had a great influence in litera-ture (Wagner, �883, �9�2). although it has been long the fulcrum of the theoretical elaborations on determinants on public expenditure, with the passing of time it has also been subjected to an empirical assessment by different thinkers. The results obtained are contradictory, since with the changing of countries and the temporal intervals considered, the data-set used and of the methods applied, they lead us to conclude sometimes in favour of the existence of “Wagner’s law”, and sometimes against it.
The elasticity of public spending concerning aggregate income has been calculated by Giarda (�988) to be equal to 0,63, whereas Bella and Quintieri (�989) calculated it to be equal to 0,8�. according to these scholars, it can be claimed that during the period �960-�985 the income growth determined around 40% of expenditure increase in real terms
“Wagner’s la� in Ital�: empirical evidence from 1960 to 2008

95
(that is the 2,95% per year on 7,4%). In any case, both the estimates agree in considering that public spending does not involve superior goods.
Koop and Poirier (�995) examine Wagner’s hypothesis in terms of a long-term elasticity of the per capita government expenditure, ln(G/POP), with regard to per capita income, ln(GDP/POP), using a bivariate error-correction mechanism, corresponding to a co-integrated mecha-nism. Of 86 countries considered, only in one-third of them is Wagner’s hypothesis supported by data. The two scholars conclude that their calculations are in clear contrast with “Wagner’s law”.
Ram (�986a, �986b, �987) tests the relationship, still in terms of elas-ticity, between the share of public general expenditure, ln(G/Y), and the per capita GDP, ln(PCY), by breaking the analysis down into two parts (time-series and cross-section). The analyses on the historical series (carried out in ��5 countries, in relation to the period �950-�980) show, on the one hand, the great difference of the estimates for the different countries. as the author points out, «[…] �e could sa� that �e could obtain almost whatever other estimation for the government share elasticit� �ith regard to the per-capita GDP, or for the elasticit� of the public expenditure �ith regard to aggregate GDP al PIL b� selecting an “appropriate” countr� or group of countries» (Ram �987, p. �97).
On the other hand, the differences between the various groups of countries seem to be modest or low; the average elasticity of the groups sometimes does differ according to countries analyzed, but it does so in a minor way (except for asia). In particular, values systematically or clearly lower for the most developed countries do not seem to appear. Finally, the ratio between results in line and in contrast to Wagner’s hy-pothesis ends up to be, approximately, 3:2. Of the ��5 countries included in the study, 4� have an elasticity inferior to the unit; in the other 75 cases, the relationship is significant at the level of 5% in 54 of these.
In the cross-section estimates, the period of reference is divided into 3 sub-periods: �950-�960, �96�-�970 and �97�-�980. Moreover, the sam-ple is broken down into two sub-samples: D.C. (Developed Countries) and l.D.C. (less Developed Countries). The results seem to reject the starting hypothesis: the elasticity of the expenditure share concerning the per capita GDP is negative in most cases, and the negative sign is significant in the full sample as well as in the sub-sample l.D.C. also,
Magazzino C�� G�� & L�� E�� R�� Vol�� 14 No 1 (2010), 91-115

96
the elasticity of the government expenditure concerning the GDP is inferior to the unit in many cases.
Musgrave (�969) reaffirmed how the most plausible formulation of Wagner’s model is in terms of a positive correlation between the share of public expenditure on domestic product and per capita income; in addition, he found that the cross-section evidence for high-income coun-tries does not confirm Wagner’s hypothesis. However, the analysis of historical series shows favourable evidence in at least 60% of case.
Musgrave (�969), Hinrichs (�965) and Gandhi (�97�), working sepa-rately, reached the conclusion that cross-section analyses that include both developed and under-developed countries as well as more back-ward countries support Wagner’s hypothesis, while samples formed only by from less developed countries do not support this.
Singh and Sahni (�984), studying the causality link between public expenditure and national income for India during the period �950-�98�, found that the effect of the growth of public expenditure on that of na-tional income is relatively low if compared to its effect on the growthrelatively low if compared to its effect on the growth of expenditure income. The conclusions they reach are that public. The conclusions they reach are that public expenditure and national income are linked by a causal mechanism of feedback; but that the empirical evidence suggests that such a causality relationship is neither of a Wagnerian nor a Keynesian type.
Kelley (�976) suggested how “Wagner’s law” must be modified in order to incorporate the relevant effects of demographic changes. This would result from the complex interaction of economic and demographic changes that do not necessarily require an increase of the public sphere and of state activity.
Ferris and West (�996) discovered that empirical evidence is unfa-vourable to “Wagner’s law”, using data referring to the post second world-war period.
Henrekson (�993) noted how the crux of “Wagner’s law” originates from regressions to levels, invoking the “causality test” of Granger and Newbold (�974) in support of theses of erroneous inferences when variables are not steady. Indeed, he shown how income and the share of public expenditure on national product, - even if correlated - are not cointegrated, demonstrating this through the Swedish case in an empirical verification on data in historical series from �86� to �990.
“Wagner’s la� in Ital�: empirical evidence from 1960 to 2008
97
In this way, they reached the conclusion that correlations reported by other researchers are of “spurious” nature.
On the contrary Oxley (�994), analyzing data on Great Britain from �870 to �9�3, found evidence in favour of “Wagner’s law”, which resists and satisfies the causality test of Granger.
Easterly and Rebelo (�993) find strong evidence in favour of “Wag-ner’s law” in the cross-section analysis relating to ��5 countries (in the period �970-�988) as well as in the historical one concerning 26 countries (from �870 to �988). The correlation between per capita in-come and dimensions of public spending is often found, in both kinds of econometric analyses.
Stein, Talvi and Grisanti (�998), by comparing the countries of latin america to those of OECD, showed that the role of the public opera-tor is more extensive in the richest countries. In other words, those countries with a greater aggregate income tend to have wider public apparatus.
While Shelton (2007), using a cross-country panel regressed various measures of public expenditure on a vector of explanatory variables through the “random effects method”. He underlined how the richest countries tend to have populations with a higher average age which would push them to spend more in the area of social security and of other forms of protection and public assistance. Besides calculating the fraction of the population above 65 years old, it should be emphasized that countries with a greater national income would tend to have less plethoric and larger state machines – which constitutes the complete opposite to what “Wagner’s law” suggests. In short, it would be the health and social expenditure that would “lead” the relationship be-tween public expenditure and per capita income, that otherwise would not increase jointly. another determinant of “Wagner’s law” would be the “taxation technology”, that is, the expansion of the public opera-tor would be made easier by the state skilfulness in increasing the tax revenue, which in turn depends on the tax system and its simplicity and efficiency.
Finally, Magazzino (2008, 2009a, 2009b, 2009c) studied the linkages between public expenditure at a disaggregate level and GDP for Italy. Empirical evidence suggests that only for gross public investment
Magazzino C�� G�� & L�� E�� R�� Vol�� 14 No 1 (2010), 91-115

98
expenditure the hypothesis is satisfied. Instead, Granger-causality exhibits unclear results: the direction of causality from public spend-ing to aggregate income is observed for these categories of public ex-penditure: final consumption, public wages, gross public investment, and contribution to production.
4. Estimates for Italy
The estimation methods used in this work are the following: OlS Robust (Ordinar� Least �quares), FGlS (Feasible Generalized Least �quares) (Prais and Winsten, �954; Cochrane and Orcutt, �949), aRIMaX Robust (AutoRegressive Integrated Moving Average �ith Exogenous Variables), GaRCH (General AutoRegressive Conditional Heteroskedaticit�)5, and FMM (Finite Mixture Model) (Rabe-Hesketh and Skrondal, 2005; Rabe-Hesketh, Pickles and Skrondal, 2004)6. Moreover, also mixed models have been used.
The data used in this work has been drawn from the aMECO data-set of the European Commission (E.C.), that can be freely consulted on the web7. aMECO is a macroeconomic database revised monthly by the Directorate General for Economic and Financial affairs. It is an essential instrument for all analyses and reports of the ECOFIN. Its advertising is free aimed at strengthening the transparency and precision of studies for which it is intended. Data can be found here for the E.U.-27, the Eu-roarea, the countries proposed as candidates for entry into the Euroarea and other countries forming part of the O.E.C.D.8
The empirical evidence concerning “Wagner’s law” has produced, therefore, contrasting results: some researchers have not found any sys-tematic relationship between the share of public spending and per capita domestic product (lall, �969; lotz and Mors, �970). While, others have found a strong positive relationship between the two variables (Martin and lewis, �956; Williamson, �96�; Thorn, �967; Gupta, �967).
5 For an in-depth analysis of the model employed see, among others: Lütkepohl (2005); Di Fonzo and Lisi (2005); Bee Dagum (2002); Gallo and Pacini (2002); Engle (1995).6 See also website address: http://www.gllamm.org/models.html.7 See: http://ec.europa.eu/economy_finance/db_indicators/db_indicators8646_en.htm.8 This concerns studies of the United States of America, Japan, Canada, Switzerland, Norway, Island, Mexico, South Korea, Australia and New Zealand.
“Wagner’s la� in Ital�: empirical evidence from 1960 to 2008
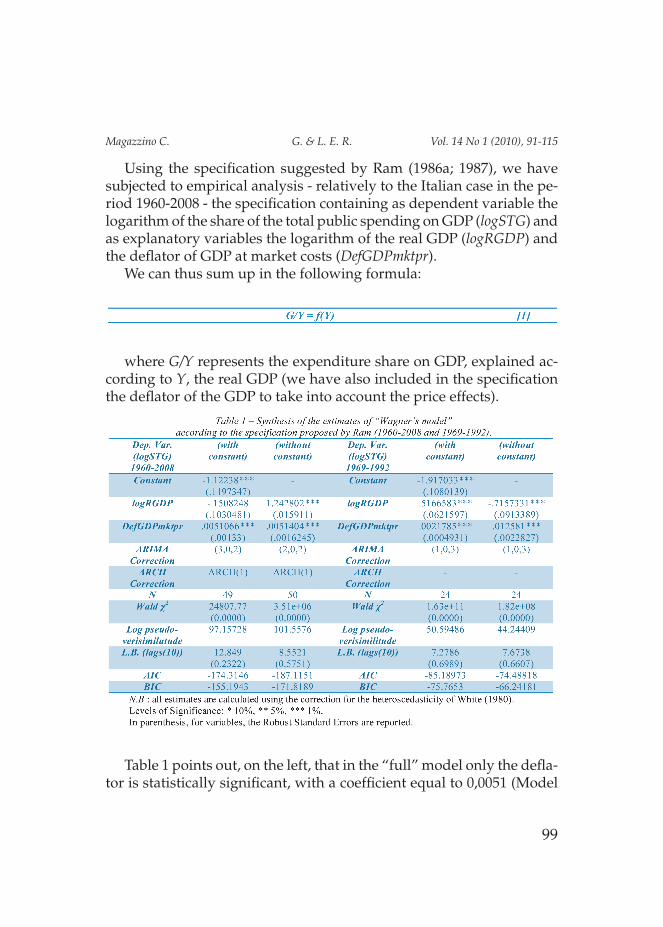
99
Using the specification suggested by Ram (�986a; �987), we have subjected to empirical analysis - relatively to the Italian case in the pe-riod �960-2008 - the specification containing as dependent variable the logarithm of the share of the total public spending on GDP (log�TG) and as explanatory variables the logarithm of the real GDP (logRGDP) and the deflator of GDP at market costs (DefGDPmktpr).
We can thus sum up in the following formula:
where G/Y represents the expenditure share on GDP, explained ac-cording to Y, the real GDP (we have also included in the specification the deflator of the GDP to take into account the price effects).
Table � points out, on the left, that in the “full” model only the defla-tor is statistically significant, with a coefficient equal to 0,005� (Model
Magazzino C�� G�� & L�� E�� R�� Vol�� 14 No 1 (2010), 91-115

�00
�); if we consider only the real income as an independent variable, it is not significant, and it assumes the negative sign in contrast with the theoretical hypotheses (Model 2); finally, in Model 3 the GDP deflator is the only explanatory variable and is not statistically significant. On the right side of the table we have taken into account the sub-period �969-�992, that is the period of absence of exactness in the management of politics of balance: in this case we find and empirical evidence favour-able to the law, since the real GDP is statistically significant and has the sign (positive) expected. Therefore, using the specification proposed by Ram, there is empirical contradictory evidence concerning “Wagner’s law” in the Italian case.
Using the specification suggested by Koop and Poirier (�995), we have estimated the model containing as dependent variable the logarithm of the per capita public expenditure (logTPE/Pop) and as explanatory variables the logarithm of the real per capita GDP (logRGDP/Pop) and market prices GDP deflator (DefGDPmktpr).
In formula we have:
where G/Pop represents the per capita public expenditure, explained as a function of the per capita GDP, Y/Pop (also in this case we have included in the specification GDP deflator in order to take into account the costs effects).
“Wagner’s la� in Ital�: empirical evidence from 1960 to 2008

�0�
Table 2 on its left side highlights that in the “full” model the real per capita income does not result to be statistically significant, with a coef-ficient equal to 0,4098 (Model �); if we consider only the real per capita income as independent variable, it is significant, but with a negative sign in contrast with the theoretical hypotheses (Model 2); finally, in Model 3 the GDP deflator is the only explanatory variable, and it is strongly significant. On the right we can see how, instead, the real expenditure is explained by the real per capita GDP as well as from the GDP deflator. In particular, the coefficient of the real aggregate production has the positive sign expected and is >� (�,0�23). In conclusion, even using a specification proposed by Koop and Poirier, there is empirical contradic-tory evidence on “Wagner’s law” in the Italian case.
Now we present a further specification of “Wagner’s law”, centred on its original formulation. It takes as explanatory variable the level of the nominal aggregate income (GDP), while the dependent variable is constituted by the total public expenditure at levels (TPE).
Magazzino C�� G�� & L�� E�� R�� Vol�� 14 No 1 (2010), 91-115

�02
as we can see from the left section of Table 3, the explanatory variable is statistically significant and its coefficient is <�. Excluding the constant from the model, the results do not change appreciably. It is important to underline that in both specifications, the correlogram shows how the residuals do not follow the “White Noise” process. applying the FGlS method, the coefficient of the aggregate production measured in monetary terms remains lower than the unitary value but statistically significant (whether the intercept is included or excluded). The preci-sion of adaptation is very high while the value of �� is close to the unit�� is close to the unit is close to the unit (0,79 in both cases). Finally, also in these two last cases, we note that the residuals do not follow a WN process.
Now we present a further specification of “Wagner’s model”. The explanatory variables are represented by the logarithm of the real aggregate income (logRGDP) and by market prices GDP deflator (DefGDPmktpr), while the dependent variable is the total public expenditure (logTPE).
“Wagner’s la� in Ital�: empirical evidence from 1960 to 2008

�03
as we can note from Table 4, with reference to the specification with expenditure in nominal terms (on the left), in the “full” model both explanatory variables are statistically significant, with a coefficient for logRGDP equal to �,8623 (Model �); however, if we use exclusively this variable as regressor, it is not significant, and it assumes a negative sign in contrast to the theoretical hypotheses (Model 2); finally, in Model 3, GDP deflator is the only explanatory variable and it is statistically significant. This calls into question the validity of “Wagner’s law” in the Italian case, relatively to the period �960-2008. Considering the expenditure in real terms (on the right), we can note that there are no significant differences with regard to the previous case: both explana-tory variables turn out to be statistically significant and assume the sign expected (positive); the increase (in absolute value) of the constant (that passes from -0,3050 to -�,5203) however must be noted.
Breaking down this time-frame into sub-periods but maintaining this specification, we can note how in the sub-period �970-2008, the law finds favourable empirical evidence both when the dependent variable is expressed in nominal terms and when it is expressed in real terms. Instead, in the sub-period �970-�992, “Wagner’s law” seems to be confirmed by data only when the dependent variable is expressed
Magazzino C�� G�� & L�� E�� R�� Vol�� 14 No 1 (2010), 91-115

�04
in real terms but not when it is instead expressed in nominal terms. In the sub-period �992-2008, “Wagner’s law” finds favourable empirical evidence when the dependent variable is expressed in nominal terms but not in real terms.
Finally, we present the estimate of “Wagner’s law” according to the Finite Mixture Model (F��M��M.). “Mix models” are used to describe the distribution of statistic variables within populations composed of a number of heterogenic groups. In the application contexts, one of the simplest hypothesis is to assume that data refer to statistical units independent of each other. However, this assumption is implausible in territorial analyses where a discriminating effect is precisely the latent effect of the environment. In order to include this latent effect, the clas-sical statistical models are modified by inserting an element of interac-tion among statistical units located in nearby territorial areas. We will use such categories of models to highlight any structural breaks in the series of the variables, also in order to study the possible constancy of parameters along the whole period of observation (Conway and Deb, 2005; Mclachlan G.J. and Peel, 2000; Deb and Trivedi, �997; Titterington, Smith and Makow, �985).
“Wagner’s la� in Ital�: empirical evidence from 1960 to 2008
�05
as is clearly shown by data, the model identifies three components or year groupings (�960-�970, �97�-�992 and �993-2006). For all three components the real GDP is statistically significant, but only for the first one is the expected sign (positive) assumed. Moreover, it is to be noted the extreme variability of the coefficient for the real GDP in the differ-ent groups (�,6644, -4,7833 and -0,9668 respectively). On the contrary, GDP deflator has a coefficient very similar in the three cases, between 0,0� and 0,05. Therefore, the “structural breaks” identified according to “Wagner’s law” would have in correspondence of the years �97� (break of the balances of public finance; collapse of Bretton Woods system; strengthening of the Welfare State and reflections of the ’“hot autumn”) and �993 (crash of the S.M.E.; “Tangentopoli”; “Maastricht Treaty”).
Nevertheless, we must underline how the diagnostic analysis car-ried out demonstrates contradictory evidence with regard to “Wagner’s model”. Such model turns out to be, for all temporal intervals considered, mis-specified, affected by heteroscedasticity, a positive serial correlation in the residuals and by conditional autoregressive heteroscedasticity, although being the aggregate production often statistically significant and with the sign (positive) expected.
5. Conclusions
In a conclusion, we can say that the analyses carried out do not fully confirm the validity of “Wagner’s law”, with regard to the Italian case for the period �960-2008; in fact, regressing the total public expenditure on the real GDP and on market prices GDP deflator, we find empirical evidence favourable to the Wagnerian hypothesis; using the specifica-tion suggested by Ram (with the same explanatory variables but with the expenditure share on GDP as variable answer) we have contradic-tory empirical evidence on “Wagner’s law”; and we arrive at the same conclusions if we use a different specification of the model, proposed by Koop and Poirier, having as dependent variable the per capita public spending and as explanatory variables the per capita GDP and the GDP deflator. The key point, that is often concealed in literature, is the in-completeness of Wagner’s original specification, who claimed to explain the trend of public spending through a single covariate (the aggregate
Magazzino C�� G�� & L�� E�� R�� Vol�� 14 No 1 (2010), 91-115
�06
production). That is why the inadequacy of the model emerges clearly, provided that the diagnostic tests are carefully analyzed, from different points of view: it turns out to be affected by an absence of relevant ex-planatory variables, a strong positive serial correlation in the residuals, heteroscedasticity, and disturbances of aRCH(p) type.
Besides “Wagner’s law”, there are other sources of pressure on spending: the difficult overcoming of the criterion of the “incremental budget” based on the concept of “historical spending” (on the basis of “Wildavsky’s model”) (Wildavsky, �975), that prevents an effective “spending review” from being carried out and the start up of a more efficient criterion of a “zero based budget”, devoid of a “historical memory” (Magazzino, 2009a; 2009b); the expansion of the demand for public services which is increasingly onerous, the aim of which is to meet the ever more complex needs with the increase of development (on the basis of “Wagner’s model”); moreover, on the basis of “armey’s curve”, it has been shown how the expenditure share that maximizes the Italian economic growth is equal to 23%, greatly lower than the value that it takes on today (49%) (Kapur, �995; World Bank, �994a, �994b, �995; P.U.M.a.-O.E.C.D., �997; Heald, �997; Engel et al��, �998; Irwin et al��, �998; la Sina and Majone, 2000).
This should push the Italian legislator to a wide program of requalifi-cation and reform of public expenditure, having as its aim the revisiting of the Italian welfare model, the revision of the mechanisms of public revenue, a wide plan of liberalization and privatization, the reform of justice (by improving the efficiency of the judicial apparatus and decreas-ing the average length of trials), of pensions (increasing the retirement age for all workers, and bringing the female one in line with the male one; reducing the replacement rate; re-modulating the system of benefits and eligibility, by limiting or cutting them, and that of contributions, by widening them; eliminating whatever part is divided within the system and replacing it with those at full capitalization; introducing a multi-pillar system, of which one is public, another private yet compulsory, and a third one private and voluntary; in addition, the development of pension funds would help the growth of financial markets, which in turn would encourage the formation of savings and the accumulation of capital, by promoting, in the final analysis, the growth of the economy),
“Wagner’s la� in Ital�: empirical evidence from 1960 to 2008
�07
of the labour market (increasing labour flexibility and mobility; intro-ducing a mechanism of compulsory insurance with minimum cover), of fiscal and tax system (by simplifying and streamlining them and, if necessary, introducing a flat tax), of health system (introducing a man-datory insurance for basic services and against serious or rare illnesses; extending the systems of prevention and vaccination; strengthening quality and cost controls, by increasing their incentives; introducing performance contracts for physicians), of the Public administration (strengthening the transparency and the efficiency of the bureaucracy), of the University and of the Research (introducing international stand-ards in the assessment of academic careers; avoiding the “brain drain” phenomenon; increasing the net contributions of University research-ers; avoiding the proliferation of Universities; expanding the system of scholarships for equity reasons; realizing an easy terms credit system for the third-level education; eliminating the sub-financing and the overcrowding of university institutes), of the school (enacting a vouch-ers system), of work contracts, the fiscal federalism, electoral laws for the various levels of government that remove the hyper-fragmentation of the Italian political system – will be certainly able to contribute to re-qualifying spending, emptying many chapters of unproductive ex-penditure to fill those of expenditure susceptible to exercising greater effects on the economic activity of the country (Petrini, 2005; Faini et al�� 2006; alesina and Giavazzi, 2006; alvi, 2006; aa. VV., 2007; Ciocca, 2007; Reviglio, 2007; Ministero dell’Economia e delle Finanze and Com-Ministero dell’Economia e delle Finanze and Com-missione Tecnica per la Finanza Pubblica, 2007; De Ioanna and Goretti, De Ioanna and Goretti, 2008). For this purpose, serious qualitative balance policies as well as reasoned qualitative deficit manoeuvre would be desirable (on the basis of the alternative methods of financing of the public deficit and of the economic cycle), that would go hand in hand with the quantitative ones (Marzano, 2006). The mid-term objective to be achieved should be the return to the primary surplus – the principal measure for the reduction of the national debt/gross product ratio (Romagnoli, 2008) – in addition to a sustained and sustainable development.
Furthermore, it is also necessary to dwell on many asymmetries concerning public spending that hurt private citizens, pointed out by the “Public Choice School” and by the “Scuola Italiana di Scienza delle
Magazzino C�� G�� & L�� E�� R�� Vol�� 14 No 1 (2010), 91-115

�08
Finanze”: the opposition between concentrated benefits and costs which are instead spread; between visible advantages and invisible costs (made so by mechanisms of “fiscal illusion” – that hides the cost of deficit financing through the issue of bonds of public debt – and that of the “financial illusion” – that hides the inflationary cost (via seignorage, and therefore with creation of monetary means) of the financing of the public deficit (Kydland and Prescott, �99�; Persson and Tabellini, �996, �999, 2000).
Moreover, the search for consent and the maximization of votes, lead “of course” to the expansion of deficit and public debt: in order to increase the probability of (re)election, policy-makers find it much more desirable to increase expenditure (in order to win the votes of specific electoral constituencies) instead of cutting them; as such, it is undoubt-edly easier to operate fiscal cuttings as opposed to a worsening in tax. This could lead to the adoption of “constitutional rules” – in collusion with the “New Constitutional Economics” – that could limit the discre-tion of the political class, directing the measures adopted by the latter more and more towards general interests of the community (Buchanan and Tullock, �962; Tullock, �976; Brennan and Buchanan, �980, �985). For this reason, important requirements for the efficiency of expenditure plans and the control of public deficit have been identified in balance procedures that could, one the one hand, strengthen incentives to cau-one the one hand, strengthen incentives to cau-tious fiscal policies and, on the other, set rules and limits to expansive policies (alesina and Perotti, �995; Milesi-Ferretti, �996)..
On account of this we could reconsider the idea suggested by Forte in the Eighties that is to link the actual public spending to the dynamic of prices (linking them to inflation rate), while those in public invest-ments and fiscal incomes would be linked to the growth rate of aggregate production: the result would be a progressive reduction of the balance deficit (Forte and Peacock, �985).
Finally, it must be taken into due account how a reduction of expendi-ture would favour the contextual decrease of the fiscal pressure without worsening the condition of public accounts; in other words, it would allow the balancing of the budget, if fiscal cuts were more contained than those applied to expenditure.
Concluding the Meeting of the “Società Italiana di Economia Pub-
“Wagner’s la� in Ital�: empirical evidence from 1960 to 2008

�09
blica” (Conference of the Italian Society of Public Economics) in �978, Sergio Steve recalled: «public expenditure can appropriatel� gro� on condi-tion that the communit� is �illing to pa� its cost��[…] ever�one agrees that public expenditure on the �hole is too great, consent on this is eas�, but no one agrees on the ��rst public expenditure that needs to be cut» (Steve, �978)��
Magazzino C�� G�� & L�� E�� R�� Vol�� 14 No 1 (2010), 91-115
��0
References
aa. VV. (2007), Riforme�� We �ill, Marsilio, Venezia.acocella N. (�999), Fondamenti di politica economica, Carocci, Roma.alesina a., Giavazzi F. (2006), Goodb�e Europa�� Cronache di un declino
economico e politico, Rizzoli, Milano.alesina a., Perotti R. (�995), Political Econom� of Budget De��cits,
I.M.F. Staff Papers, 42(�), �-3�.alvi G. (2006), Una repubblica fondata sulle rendite�� Come sono cambiati
il lavoro e la ricchezza degli italiani, Mondadori, Milano.Bee Dagum E. (2002), Analisi delle serie storiche: modellistica, previsione
e scomposizione, Springer-Verlag, Milano.Bella M., Quintieri B. (�989), Crescita in disequilibrio ed espansione del
settore pubblico, in “Rivista Internazionale di Scienze Sociali”, 2, �79-200.Brennan G., Buchanan J. M. (�985), The Reason of Rules�� Constitutional
Political Econom�, Cambridge University Press, Cambridge.Brennan G., Buchanan J.M. (�980), The Po�er to Tax�� Anal�ticalAnal�tical
Foundations of a Fiscal Constitution, Cambridge University Press, Cambridge.
Brosio G. (�987), (edited by), La spesa pubblicaspesa pubblica, Giuffrè, Milano.Brosio G. (2003), Economia e ��nanza pubblica, Carocci, Roma.Buchanan J.M., Tullock G. (�962), The Calculus of Consent�� LogicalLogical
Foundations of Constitutional Democrac�, ann arbor, The University of Michigan Press.
Chrystal a., alt J. (�979), Endogenous Government Behaviour: Wagner’s La� or Götterdämmerung?, in Cook S.T., Jackson P.M. (edited by), Current Issues in Fiscal Polic�, Martin Robertson, Oxford, �27-�37.
Ciocca P. (2007), Ricchi per sempre? Una storia economica d’Italia (1796-2005), Bollati Boringhieri, Torino.
Conway K., Deb P. (2005), Is Prenatal Care Reall� Ineffective? Or, is the ‘Devil’ in the Distribution?, Journal of Health Economics, 24, 489-5�3.
Cochrane D., Orcutt G.H. (�949), Application of least-squares regression to relationship containing auto correlated error terms, Journal of the american Statistical association, 44, 32-6�.
Deb P., Trivedi P.K. (�997), Demand for Medical Care b� the Elderl�: A Finite Mixture Approach, Journal of applied Econometrics, �2, 3�3-326.
“Wagner’s la� in Ital�: empirical evidence from 1960 to 2008

���
De Ioanna P., Goretti C. (2008), La decisione di bilancio in Italia, il Mulino, Bologna.
De Rosa F. (2005), Compendio di Economia e Finanza Pubblica, Simone, Napoli.
Diba B. (�982), A Note on Public �ector Gro�th: a Real Perspective, Public Finance, 37, ��4-��9.
Di Fonzo T., lisi F. (2005), �erie storiche economiche, Carocci, RomaDominick M. (2002), A critical appraisal of the theories of governmenties of government
expenditure gro�th, University of Stellenbosch, South africa.Easterly W., Rebelo S. (�993), Fiscal Polic� and Economic Gro�th: an
Empirical Investigation, in Journal of Monetary Economics, 32, 4�7-458.Engel E., Fisher R., Galetovic a. (�998), Infrastructure Franchising and
Government Guarantees, X Regional Seminar on Fiscal Policy, CEPal, Chile, January.
Engle R.F. (�995), (edited by), ARCH�� �elected Readings, Oxford University Press, Oxford.
Faini R., Giannini S., Gros D., Pisauro G., Kostoris F. (2006), I conti a rischio�� La vulnerabilità della ��nanza pubblica italianaLa vulnerabilità della ��nanza pubblica italiana, il Mulino, Bologna.
Ferris J. S., West E.G. (�996), Testing Theories of Real Government �ize: U�� ��� Experience, Southern Economic Journal, 62(3), 537-553.
Forte F., Peacock a.T. (edited by) (�985), Public Expenditure and Government Gro�th, Basil Blackwell, Oxford.
Fossati a. (�98�), La spesa pubblica in Italia dal 1951 al 1980, Rivista di Diritto Finanziario e Scienza delle Finanze, 3, Xl, 322-375.
Fossati a. (�999), Economia pubblica�� Elementi per un’analisi economica dell’intervento pubblico, Franco angeli, Milano.
Franco D. (�993), L’espansione della spesa pubblica in Italia, il Mulino, Bologna.
Gallo G.M., Pacini B. (2002), Metodi quantitativi per i mercati ��nanziari, Carocci, Roma.
Gandhi V.P. (�97�), Wagner’s La� of Public Expenditure: Do Recent Cross-�ection �tudies Con��rm It?, Public Finance, 26, 44-56.
Giarda P.D. (�988), Una interpretazione della crescita della spesa pubblica in Italia: 1952-1987, Rivista Bancaria, XlIV, ��-�2.
Granger C.W.J., Newbold P. (�974), �purious Regressions in Econometrics, Journal of Econometrics, 2(�), ���-�20.
Magazzino C�� G�� & L�� E�� R�� Vol�� 14 No 1 (2010), 91-115

��2
Gupta S. P. (�967), Public Expenditure and Economic Gro�th: A Time-�eries Anal�sis, Public Finance, 423-46�.
Hadjimatheou G. (�976), On the Empirical Evidence on Government Expenditure Development, Public Finance, 3�, �44-�48.
Heald D. (�997), Privatel� Financed Capital in Public �ervices, The Man-chester School of Economic and Social Studies, 65(5), 568-598.
Henrekson M. (�993), Wagner’s La� - A �purious Relationship?, Public Finance, 48(2), 406-4�5.
Hinrichs H.H. (�965), Determinants of Government Revenue �hares among Less-Developed Countries, Economic Journal, 75, 546-556.
Irwin T., Klein M., Perry G., Thobani M. (�998), Managing Contingent Capabilities in Infrastructure Privatization, X Regional Seminar on Fiscal Policy, CEPal, Chile, January.
Jackson P. (�980), The Gro�th of the Relative �ize of the Public �ector, in Currie D., Peters W., Contemporar� Economics Anal�sis, II, 329-354,II, 329-354, 329-354, Croom Helm, london.
Kapur a. (�995), Airport Infrastructure�� The Emerging Role of the Private �ector, World Bank Technical Paper, 3�3, W.B.
Kelley a.C. (�976), Demographic Change and the �ize of the Government �ector, Southern Economic Journal, 3(2), �056-�066.
Kydland F.E., Prescott E.C. (�99�), The Econometrics of the General Equilibrium Approach to Business C�cles, Scandinavian Journal of Economics, 93, �6�-�78.
Koop G., Poirier D.J. (�995),., Poirier D.J. (�995), An Empirical Investigation of Wagner’s H�pothesis b� Using a Model Occurrence Frame�ork, Journal of the Royal Statistical Society, Series a, �58(�), �23-�4�.
lall S. (�969), A Note on Government Expenditures in Developing Countries, Economic Journal, 79(3�4), 4�3-4�7.
la Spina a., Majone G. (2000), Lo �tato regolatore, il Mulino, Bologna.lotz J.R., Morss E.R. (�970), A Theor� of Tax Level Determinants for
Developing Countries, Economic Development and Cultural Change, �8(3), pp. 328-34�.
lütkepohl H. (2005), Ne� Introduction to Multiple Time �eries Anal�sis, Springer-Verlag, Milano.
Mclachlan G.J., Peel D. (2000), Finite Mixture Models, John Wiley, New York.
“Wagner’s la� in Ital�: empirical evidence from 1960 to 2008

��3
Magazzino C. (2008), Modelli interpretativi della dinamica della spesa pubblica e “curva di Arme�”: il caso italiano, 1862-2001, Notizie di Politeia, XXIV, 92, 45-60.
Magazzino C. (2009a), �tima della spesa pubblica italiana secondo i modelli di Musgrave e Rosto� e di O’Connor, Il Risparmio Review, 3, 59-84.
Magazzino C. (2009b), �pesa pubblica disaggregata e “Legge di Wagner”, Economia, Impresa e Mercati Finanziari, 3, 7-3�.
Magazzino C. (2009c), “Legge di Wagner” e spesa pubblica disaggregata: un approccio VAR, Economia Pubblica, 3-4.
Martin a. M., lewis W. a. (�956), Patterns of Public Revenue and Expenditure, The Manchester School of Economics and Social Studies, September, 203-244.
Marzano a. (2006), Politica macroeconomica, U.T.E.T., Torino.Mastromatteo G. (�984), La legge del Wagner e lo sviluppo della spesa
pubblica, Rivista di Diritto Finanziario e Scienza delle Finanze.Michas N. (�975), Wagner’s La� of Public Expenditure: What is the
Appropriate Measurement for a Valid Test?, Public Finance, 30(�), 77-85.Milesi-Ferretti G. (�996), Fiscal Rules and the Budget Process, I.M.F.
Working Paper, 96/60, International Monetary Fund.Ministero dell’Economia e delle Finanze and Commissione
Tecnica per la Finanza Pubblica (2007), Libro verde sulla spesa pubblica, typewritten, Rome.
Musgrave R.a. (�969), Fiscal ��stems, Yale University Press, New Haven.
Musgrave R.a., Peacock a.T. (�967), Classics in the Theor� of Public Finance, Macmillan, london.
Nitti F.S. (�972), La scienza delle ��nanze, in Forte F. (edited by), Edizione Nazionale delle Opere di Nitti, laterza, Bari.
Oxley l. (�994), Cointegration, Causalit�, and Wagner’s La�: A Test for Britain 1870-1913, Scottish Journal of Political Economy, 4�(3), 286-298.
Persson T., Tabellini G. (�990), Macroeconomic Polic�, Credibilit� and Politics, Harwood academic Publishers, london.
Persson T., Tabellini G. (�999),on T., Tabellini G. (�999), The �ize and �cope of Government: Comparative Politics �ith Rational Politicians, European Economic Review, 43, 699-735.
Magazzino C�� G�� & L�� E�� R�� Vol�� 14 No 1 (2010), 91-115

��4
Persson T., Tabellini G. (2000), Political Economics�� Explaining EconomicExplaining Economic Polic�, M.I.T. Press, Cambridge-london.
Petrini R. (2005), L’imbroglio ��scale, laterza, Roma-Bari.Prais S.J., Winsten C.B. (�954), Trend estimators and serial correlation,
Cowles Commission Discussion Paper, 383, Chicago.P.U.M.a. – O.E.C.D. (�997), Contracting Out Government �ervices:
Best Practice Guidelines and Case �tudies, O.E.C.D. Occasional Paper, 20.Rabe-Hesketh S., Skrondal a. (2005), Multilevel and Longitudinal
Modeling using �tata, College Station, Stata Press, TX.Rabe-Hesketh S., Pickles a., Skrondal S. (2004), Generalized multilevel
structural equation modeling, Psychometrika, 69, �67-�90.Ram R. (�986a), Comparing Evidence on Wagner’s H�pothesis from
Conventional and ‘Real’ Data, Economic letters, 20, 259-262.Ram R. (�986b), Causalit� bet�een Income and Government Expenditure:
A Broad International Perspective, Public Finance, 4�, 393-4�3.Ram R. (�987), Wagner’s H�pothesis in Time-�eries and Cross-�ection
Perspectives: Evidence from “Real” Data for 115 Countries, The Review of Economics and Statistics, 69(2), �94-204.
Reviglio F. (2006), Per restare in Europa, U.T.E.T., Torino.Reviglio F. (2007), La spesa pubblica, Marsilio, Venezia.Romagnoli G.C. (2005), L’errore nelle scelte di macroeconomia, Rivista
della Scuola Superiore dell’Economia e delle Finanze, �2, 96-�5�.Romagnoli G. C. (2008), La Legge ��nanziaria 2008 tra esigenze di
risanamento ed esigenze del governo, in Trupiano G. (edited by), La Legge ��nanziaria 2008, aracne, Roma, 45-68.
Rostow W.W. (�97�), Politics and the �tages of Gro�th, Cambridge University Press, Cambridge.
Shelton C.a. (2007), The �ize and Composition of Government Expenditure, Wesleyan Economic Working Papers, 2.
Singh B., Sahni B. S. (�984), Causalit� Bet�een Public Expenditure and National Income, The Review of Economics and Statistics, 66(4), 630-644.
Sobbrio G. (�9992), Economia del settore pubblico, Giuffrè, Milano.Stein E., Talvi E., Grisanti a. (�998), Institutional arrangements and ��scal
performance: the Latin American experience, Inter-american Development Bank, Office of the Chief Economist, Working Paper, 367, February.
“Wagner’s la� in Ital�: empirical evidence from 1960 to 2008

��5
Steve S. (�978), Conclusioni, in Gerelli E., Reviglio F. (�978), (edited by), Per una politica della spesa pubblica in Italia, Francoangeli, Milano, 223-23�.
Tanzi V., Schuknecht l. (2007), La spesa pubblica nel XX secolo�� Una prospettiva globale, Firenze University Press, Firenze.
Thorn R.S. (�967), The Evolution of Public Finances During Economic Development, The Manchester School of Economics and Social Studies, �9-53.
Titterington D.M., Smith a.F.M., Makow U.E. (�985), �tatistical Anal�sis of Finite Mixture Distributions, John Wiley, New York.
Tullock G. (�976), The Vote Motive, Institute of Economic affairs, london.
Wagner a.H. (�883), Finanz�issenschaft, leipzig, cited in Musgrave R.a., Peacock a.T. (�967).
Wagner a.H. (�9�2), Les fondements de l’économie politique, Girard & Brière, Paris, III.
Wildavsky a. (�975), The Politics of Budgetar� Process, little Brown.Williamson J. G. (�96�), Public Expenditure and Revenue: An
International Comparison, The Manchester School of Economics and Social Studies, January, 43-56.
White H. (�980), A heteroskedasticit�-consistent covariance matrix estimator and a direct test for heteroschedasticit�, Econometrica, 48, 8�7-838.
World Bank (�994a), Averting the Old Age Crisis: Policies to Protect the Old and Promote Gro�th, Oxford University Press, W.B., New York.
World Bank (�994b), World Development Report, Oxford University Press, W.B., New York.
World Bank (�995), Bureaucrats in Business: The Economics and Politics of Government O�nership, Oxford University Press, W.B., New York.
Magazzino C�� G�� & L�� E�� R�� Vol�� 14 No 1 (2010), 91-115

��6

��7
G. & L. E. R., Vol. 14 No. 1, 2010
* Department of Quantitative Methods and Economic Theory, University of Chieti-Pescara, Viale Pindaro 42, Pescara 65127, Italy, Tel.: +39 085 453 7583; fax: +39 085 453 7980; [email protected].♣ Department of Quantitative Methods and Economic Theory, University of Chieti-Pescara, Viale Pindaro 42, Pescara 65127, Italy, Tel.: +39 085 453 7583; fax: +39 085 453 7980; [email protected].✚ Department of Quantitative Methods and Economic Theory, University of Chieti-Pescara, Viale Pindaro 42, Pescara 65127, Italy, Tel.: +39 085 453 7583; fax: +39 085 453 7980; [email protected].
AbstractThis paper is aimed to explore the issue of e-learning adoption
among European small and medium enterprises (SMEs). By performing a regression analysis, valuable insights are provided into the pattern of investments in corporate e-learning made by European SMEs and the potential connection between the percentage of firms implementing electronically-aided learning and economic performance. a cluster analysis is then performed in an effort to identify differences and similarities in e-learning diffusion within Europe.
JEL CLassifiCation: O�0; O40; O52; O57.
KEywords: Economics of Education and Training; Knowledge Economy; Small and Medium Enterprises; Corporate E-Learning; Economic Performance.
1. E-learning as a means for vocational training in SMEs and a driver for competitiveness: an overview
at the European Council held in lisbon in March 2000, the European Union set itself a new strategic goal for the next decade: “to become the most competitive, dynamic and knowledge-based economy in the world capable of sustainable economic growth with more and better
Edgardo Bucciarelli* - Nicola Mattoscio♣ - Domenico Scamuffa✚
E-LEARNING DIFFuSION AMONG EuROPEAN SMEs ANDITS RELATIONShIP wITh ECONOMIC PERFORMANCE
��8
jobs and greater social cohesion” (EU-Council, 2000). The need for delivering such an ambitious programme arises due to the profound changes occurring in the economic and social life of society, resulting from the challenges brought about by market globalization and the new knowledge-based economy. In advanced economies, this emerging scenario is grounded on rapid knowledge creation and the ease of its access, which ultimately engender efficiency, quality and equity (Foray, 2000). No wonder, then, that investment in education and training has become the mainstay for securing competitiveness in global markets and the primary fuel for economic growth. This is particularly true for the case of small and medium enterprises, for knowledge may play a major role in helping tackle competition and gain qualitative advantages.
at the European level, significant attention has been directed towards the role of vocational education and training (VET), which consists in learning programmes aiming to equip people with skills and competences to be used in the labour market. The importance of VET activities for individuals, firms and society as a whole, is nowadays widely recognized and perceived as a key element for lifelong learning (EU-Commission, 2008).
By solely focusing on firms, it is possible to narrow down the scope of analysis of education and training processes to continuing vocational training (CVT), which ranges from short vocational training courses to accelerated and lifelong training courses. CVT usually includes either internal courses designed and managed by the enterprise itself, or external courses developed by a network of enterprises or social partners, at local or regional level. Firms are increasingly investing in continuing vocational training, which is conceived as an engine for innovation and a means for increasing labour force productivity.
In such a respect, a central role is played by the ability of individuals and firms to use information and communication technologies (ICT). The tight connection between education and training and information technology has opened the door to the birth and development of e-learning.
E-learning is a typology of interactive distance learning based on electronic media (the Internet, intranets, satellite broadcast, etc.) for
E-Learning diffusion among european �MEs and its relationship������
��9
managing and delivering education and training services. The use of electronically-aided learning is spreading worldwide in the training and development industry to such a pace that it has been heralded as the “e-learning Revolution” (Sloman, 2002). The knowledge delivered via network technology has become strictly intertwined with the provision of staff training in organizations, whose main goal is to develop the talent and skills of company employees. These technology-based training solutions are changing the way corporations deliver training in nearly all segments of the business process. In this respect, e-learning enables businesses to remove distances (by distributing training to multiple locations easily and conveniently), to lower expenses, to facilitate training access of a large number of workers, to simplify complex processes such as information overload and to make the organization more flexible (Welsh et al��, 2003).
From a purely economic perspective, Castillo-Merino and Sjöberg (2008) address e-learning within the general context of the role of human capital and ICTs in explaining differences in earnings, productivity levels and economic growth. In this connection, economic literature situates the diffusion and productive use of ICTs (to which e-learning has to be placed in) at the base of growth estimates for many countries (Brynjolfsson and Yang, �997; Jorgenson et al��, 2005; Jorgenson, 2009). In particular, if the existence of complementarities between technical and organizational change and skilled labour input do explain productivity gains at the industry level, e-learning could act as a driving force for productivity increases.
In addition, e-learning, by improving education and training, can bring considerable benefits both for individuals and society as a whole. From the point of view of the individual, human capital theory predicts that an increase in an individual’s level of educational attainment positively affects its productivity in the labour market, which is the basic explanatory variable for wage differentials (Mincer, �974; Cipollone, �995). Other individual benefits gained by higher levels of education, directly related and complementary to wages, are higher participation rates in the labour market and a lower probability of being unemployed (de la Fuente and Ciccone 2003). In a macro-economic context, differences in growth rates across countries are assumed to be
Bucciarelli E�� - Mattoscio N�� - �camuffa D�� G�� & L�� E�� R�� Vol�� 14 No 1 (2010), 117-133

�20
considerably due to differences in human capital levels and its rates of accumulation (lucas, �988; Romer, �990). In this light, e-learning may impact positively on growth, by improving labour force skills and thus helping drive technical change, besides supporting new technology adoption and diffusion.
Turning to the specific benefits of e-learning for firms, education via network technology should in principle appeal to all companies of any size and sector, especially to small and medium-sized enterprises interested in increasing productivity or boosting efficiency in a cost-effective way (Sambrook, 2003; Roffe, 2004). This notwithstanding, whereas we can observe an increased use and impact of e-learning in large companies, the uptake of technology-based training solutions in SMEs is very slow and does not meet initial hopes and expectations (atwell, 2003). Other recent studies (Hamburg et al��, 2005; Beer et al��, 2006) seem to confirm these findings, showing a limited use of e-learning in small firms and mostly with reference to activities of rather poor quality. an interview survey carried out by Chang (2003) suggests that workers in large organizations mostly prefer electronically-aided learning, while workers of SMEs exhibit a preference for traditional vocational training or face-to-face learning. These results may actually be explained by a number of potential drawbacks and barriers met by SMEs when embarking on e-learning implementations: first, the fear that learning activities not directly involving teachers may be less effective than traditional forms of education (Welsh et al��, 2003); second, the start-up and maintenance costs associated with e-learning systems (Garrot et al��, 2008); third, the lack of the necessary learning culture, expertise and accompanying infrastructures for using electronically-aided learning (admiraal and lockhorst, 2009); finally, the modelling of commercial e-learning software on the requirements of large companies or higher education (atwell, 2003; Hamburg and Engert, 2007). additionally, with respect to European SMEs, two further critical flaws have been identified, concerning the lack of integrated support services for SMEs - particularly in the field of education and training - and the need to strengthen cooperation with other firms, training providers and public bodies (Hamburg et al��, 2007).
E-Learning diffusion among european �MEs and its relationship������
�2�
2. The diffusion of e-learning among European SMEs
The main objective of the present work is to identify a possible correlation between the percentage of European firms using e-learning for staff training and the gross domestic product (GDP) per capita��relative to the country under investigation. In such a respect, we collect the annual data provided by Eurostat (20�0) concerning the percentage of small and medium enterprises (SMEs) - i.e. those firms employing a number of workers comprised between �0 and 249 units - which adopt e-learning systems for training and education of their employees. The limited time period (2003-2008) covered by the data represents a constraint, but some useful insights may be still gained from the analysis carried out.
The paper is structured by first providing a descriptive analysis concerning the adoption of e-learning among European SMEs. It thenIt then turns to an analysis of dependence and a cluster analysis considering GDP and e-learning penetration among European small and medium-sized enterprises. Results are presented and discussed in the next Results are presented and discussed in the nextResults are presented and discussed in the next section. Descriptive statistics are first discussed before carrying out Descriptive statistics are first discussed before carrying out formal econometric tests to correct for the lack of information concerning some countries and avoid mistakes regarding data replacement. We compare countries on the extent to which their businesses use online channels for staff training. For every year in the time frame specified, Table � shows the number of countries with available data and the lowest and highest percentage of SMEs using e-learning systems every year in Europe. In addition, other summary statistics such as mean and standard deviation are reported in the table.
� Gross domestic product (GDP) is defined as the value of all goods and services produced less the value of any goods or services used in their creation. The volume index of GDP per capita in Pur-chasing Power Standards (PPS) is expressed in relation to the European Union (EU-27) average set equal to 100.
Bucciarelli E�� - Mattoscio N�� - �camuffa D�� G�� & L�� E�� R�� Vol�� 14 No 1 (2010), 117-133

�22
as indicated in Table �, the average percentage of European SMEs making use of e-learning tools has increased by �2% since 2003. Though representing a positive growing trend, recent statistics highlight that, in the best cases, only one out of two SMEs have invested in web-based solutions for staff training purposes. The variability of the phenomenon through the time span examined is quite high, thus suggesting a not uniform diffusion of corporate e-learning among European countries.
This last remark is further confirmed by Figure �, which presents the distribution of European countries by rate of e-learning adoption among SMEs in 2008. The percentages of small and medium-sized enterprises using e-learning systems vary greatly across Europe. In most countries, corporate e-learning is actually implemented by less than 30% of the SMEs, while only in lithuania this percentage exceeds 50%.
E-Learning diffusion among european �MEs and its relationship������

�23
Table 2 reports the minimum and maximum values (the percent-age of adoption - followed by the year in parentheses) of corporate e-learning penetration scored by the EU countries through the time span specified.
Bucciarelli E�� - Mattoscio N�� - �camuffa D�� G�� & L�� E�� R�� Vol�� 14 No 1 (2010), 117-133

�24
By and large, Italy, Hungary, Germany and the Netherlands have the lowest achievements in e-learning diffusion, with only a fifth of SMEs adopting web-based solutions for staff training. Presumably, the Presumably, thePresumably, the disappointing performance of these prosperous countries is due to their preference for traditional face-to-face education. This is the case for This is the case forThis is the case for Italy especially, where, in spite of the incentives for e-learning diffusion in private and public corporations, education and training systems seem to be still reluctant to the implementation of electronically-aided learning solutions. On the contrary, the high percentages (approaching On the contrary, the high percentages (approachingOn the contrary, the high percentages (approaching 50%) shown by Greece, lithuania, Cyprus and Malta represent a clear indicator of how largely corporate e-learning is used in less advanced European economies. arguably, this comes as a consequence of the growing number of foreign firms investing in these countries in the last few years, owing to the low costs of labour force and raw materials.
These newly-formed companies have mostly implemented e-learning solutions for vocational training because of their cost-saving techniques able to enhance performance, innovation and commitment of their employees in a rapid and effective manner.
3. E-learning, SMEs and economic performance: an empirical investigation
Based on the evidence outlined above, further investigations are made by using an analysis of dependence and a correlation test. a linear regression is carried out to estimate the relationship between GDP per capita (independent variable) and the percentage of SMEs using e-learning tools (dependent variable). The summarizing table of the main outcomes is reported below.
E-Learning diffusion among european �MEs and its relationship������

�25
Table 3 highlights the scarce model’s goodness-of-fit to the observed data, being R-squared estimates rather low. In all six years, the positive sign of the regression coefficients implies a direct linear relation between GDP and percentages of e-learning diffusion among SMEs. The correlation values present the same trend, thus indicating that both variables increase together. In addition, the results of the T-statistics test are significant only for 2004 and 2007, and, as a consequence, the value of β is not significant for 2003, 2005, 2006 and 2008.
Besides this, the percentage change of GDP per capita is included in a subsequent analysis. This is calculated by applying a logarithmic transformation, which has the effect of removing non-stationarity in the mean when used in conjunction with differencing. The percentage change in GDP from period to period is thus approximately represented by:
log gdpt – log gdpt-1 = log (�)
Bucciarelli E�� - Mattoscio N�� - �camuffa D�� G�� & L�� E�� R�� Vol�� 14 No 1 (2010), 117-133

�26
Table 4 provides a summary of the main results for the logarithmic regression. It must be mentioned that the R-squared is relatively lowIt must be mentioned that the R-squared is relatively lowR-squared is relatively low is relatively low in this regression, too. The β coefficients show positive values, thus implying a direct relationship between the two variables under scrutiny. Furthermore, the T-statistics values are significant only for 2004 and 2007. In order to find the best-fit model to the data, the linear regression estimates - resulting from the log transformation – are compared with the results of other modelling functions (quadratic, cubic, compound, exponential, etc.). The results concerning the best models obtained for every year from 2003 to 2008 are reported in Table 5.
E-Learning diffusion among european �MEs and its relationship������

�27
In the above table, the entry “dependent” refers to the dependent variable (percentage of companies implementing e-learning tools for vocational training), while the entry “method” concerns the model best fitting to the data. “Sigf” expresses the alpha error level (p-value) associated with the result of the Fisher statistics (shortened as “F” in the table). as indicated in table 5, the cubic function yields the best fitting to the data in every year of the time span considered. Figure 2 and Figure 3 present the results of all the estimated modelling functions respectively referred to 2003 and 2008.
Bucciarelli E�� - Mattoscio N�� - �camuffa D�� G�� & L�� E�� R�� Vol�� 14 No 1 (2010), 117-133
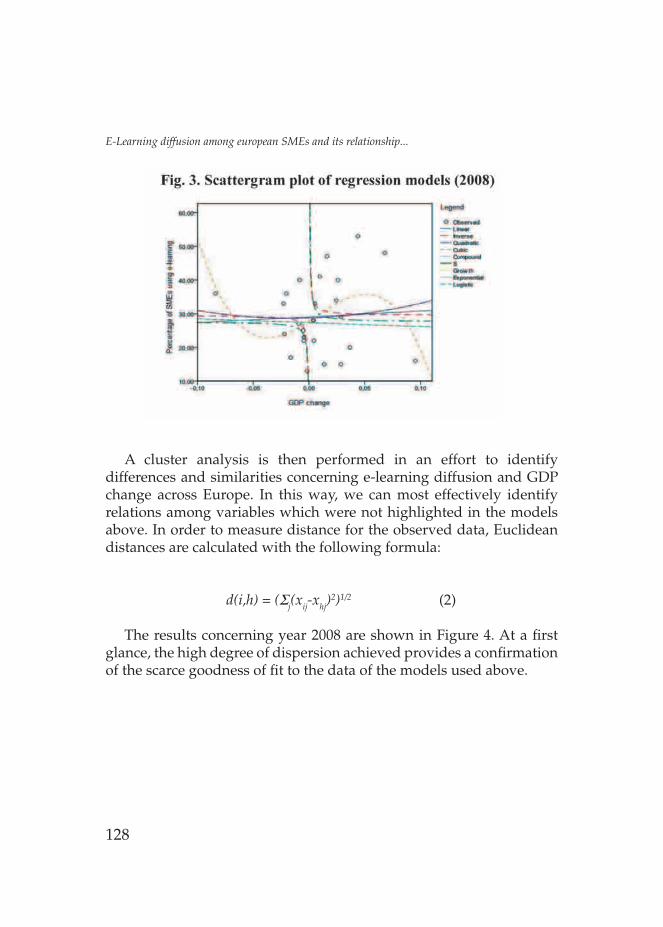
�28
a cluster analysis is then performed in an effort to identify differences and similarities concerning e-learning diffusion and GDP change across Europe. In this way, we can most effectively identify relations among variables which were not highlighted in the models above. In order to measure distance for the observed data, Euclidean distances are calculated with the following formula:
d(i,h) = (Σj(xij-xhj)2)1/2 (2)
The results concerning year 2008 are shown in Figure 4. at a first glance, the high degree of dispersion achieved provides a confirmation of the scarce goodness of fit to the data of the models used above.
E-Learning diffusion among european �MEs and its relationship������
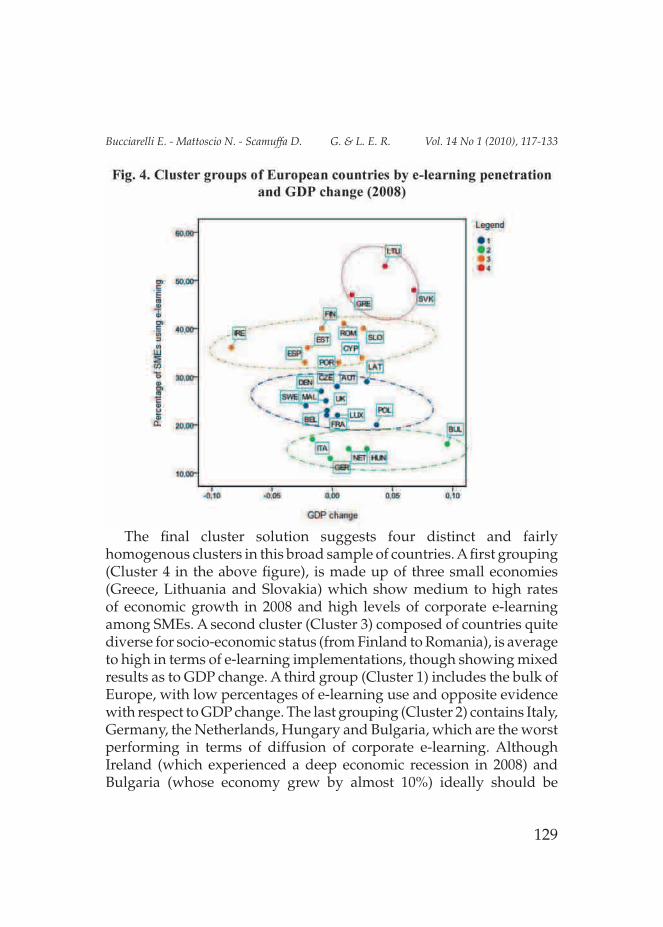
�29
The final cluster solution suggests four distinct and fairly homogenous clusters in this broad sample of countries. a first grouping (Cluster 4 in the above figure), is made up of three small economies (Greece, lithuania and Slovakia) which show medium to high rates of economic growth in 2008 and high levels of corporate e-learning among SMEs. a second cluster (Cluster 3) composed of countries quite diverse for socio-economic status (from Finland to Romania), is average to high in terms of e-learning implementations, though showing mixed results as to GDP change. a third group (Cluster �) includes the bulk of Europe, with low percentages of e-learning use and opposite evidence with respect to GDP change. The last grouping (Cluster 2) contains Italy, Germany, the Netherlands, Hungary and Bulgaria, which are the worst performing in terms of diffusion of corporate e-learning. although Ireland (which experienced a deep economic recession in 2008) and Bulgaria (whose economy grew by almost �0%) ideally should be
Bucciarelli E�� - Mattoscio N�� - �camuffa D�� G�� & L�� E�� R�� Vol�� 14 No 1 (2010), 117-133

�30
considered as outliers, both countries are included in a grouping in order to better highlight their performance in terms of e-learning use.
4. Conclusive remarks
The paper was mainly intended to evaluate the diffusion of e-learning activities among European SMEs and its relationship with the economic performance of EU countries. By and large, regression results showed a scarce goodness-of-fit of the model to the observed data. This notwithstanding, both the linear function and the logarithmic transformation indicated a direct relationship between GDP per capita and corporate e-learning penetration, expressed as percentage of European SMEs using e-learning for staff training purposes. By a comparison with the estimates of other modelling functions, the cubic function proved to be the best fitting to the data in every year of the time span specified. a cluster analysis was finally performed in an effort to identify differences and similarities in e-learning diffusion within Europe: results indicated an uneven distribution of countries within clusters with no uniform socio-economic or geographical connection.
E-Learning diffusion among european �MEs and its relationship������
�3�
References
admiraal W., lockhorst D. (2009), E-Learning in �mall and Medium-sized Enterprises across Europe, International Small Business Journal, 27(6), 743-767.
attwell G. (2003), The challenge of e-learning in small enterprises: Issues of polic� and practice in Europe, Cedefop Panorama series, 82, Office for Official Publications of the European Communities, luxembourg.
attwell G., Dirckinck-Holmfeld l., Fabian P., Kárpáti a., littig P. (2003), E-learning in Europe – Results and Recommendations, Impuls 0�0, Bonn.
Beer D., Busse T., Hamburg I., Mill U., Paul H. (2006), E-learning in European �MEs: observations, anal�ses & forecasting, Waxmann, Münster.
Brynjolfsson E., Yang S. (�997), Information Technolog� and Productivit�: A Revie� of the Literature, Working Paper Series 202, MIT Center for Coordination Science.
Castillo-Merino D., Sjöberg M. (2008), A Theoretical Frame�ork for the Economics of E-learning, in “The Economics of E-learning”, Revista de Universidad y Sociedad del Conocimiento, 5(�), 2-��, available at http://redalyc.uaemex.mx/redalyc/pdf/780/780��2030�0.pdf[accessed: 03/05/20�0].
Chang V. (2003), The role and effectiveness of e-learning: ke� issues in an industrial context, paper for the United Nations IS World Forum and 2002: “The role and effectiveness of e-learning”, MPhil thesis.
Cipollone P. (�995), Education and Earnings, in: Carnoy M. (ed.), International Encyclopedia of Economics of Education, Pergamon, Oxford, �45-�49.
de la Fuente a., Ciccone a. (2003), Human Capital in a Global and Kno�ledge-Based Econom�: Part II: Assessment at the EU Countr� Level, EU-Commission, Directorate-General for Employment and Social affairs, Brussels.
EU-Commission (2008), Progress to�ards the Lisbon objectives in Education and Training, Brussels, at http://ec.europa.eu/education/lifelong-learning-policy/doc�522_en.htm [accessed: 03/05/20�0].
Bucciarelli E�� - Mattoscio N�� - �camuffa D�� G�� & L�� E�� R�� Vol�� 14 No 1 (2010), 117-133

�32
EU-Council (2000), Presidenc� Conclusions, lisbon, 23/24 March 2000.EUROSTaT (20�0), Percentage of enterprise using e-learning applications
for training and education of emplo�ees, available at http://epp.eurostat.ec.europa.eu/portal/page/portal/product_details/dataset?p_product_code=ISOC_PI_E3 [accessed: 03/05/20�0]._code=ISOC_PI_E3 [accessed: 03/05/20�0].code=ISOC_PI_E3 [accessed: 03/05/20�0].
Foray D. (2000), L’économie de la connaissance, la Découverte, Paris.Garrot T., Psillaki M., Rochhia S. (2008), Describing E-learning
Development in European Higher Education Institutions Using a Balanced �corecard, in “The Economics of E-learning”, Revista de Universidad y Sociedad del Conocimiento, 5(�), 7�-83, available at http://www.uoc.edu/rusc/5/�/dt/eng/garrot_psillaki_rochhia.pdf [accessed: 03/05/20�0].
Hamburg I., lindecke C., Terstriep J. (2005), E-learning - a chance for small and medium sized enterprises, available at http://eleed.campussource.de/archive/2/239/ [accessed: 03/05/20�0].
Hamburg I., Engert S. (2007), Competenc� based training in �MEs: the role of e-learning and e-competence, in Proceedings of the 6th IaSTED International Conference “Web-based Education”, March �4-�6, 2007, Chamonix, France. anaheim: acta Press, 2007, �89-�93.
Hamburg I., Engert S., Thij H.T. (2007), �MEs, E-Learning and Communities of Practice, 8-th European Conference E-COMM-lINE 2007, Bucharest, September 20/ 2� 2007.
Jorgenson D.W., Ho M.S., Stiroh K.J. (2005), Productivit�, Information Technolog� and the American Gro�th Resurgence, MIT Press, Cambridge and london.
Jorgenson D.W., (2009), The Economics of Productivit�, International library of Critical Writings in Economics, Vol. 236. Elgar.
lucas R.E. (�988), On the Mechanics of Economic Development, Journal of Monetary Economics, 22, 3-42.
Mincer J. (�974), �chooling, Experience and Earnings, Columbia University Press, New York.
Roffe I. (2004), E-learning for �MEs: Competition and Dimensions of Perceived Value, Journal of European Industrial Training, 28(5), 440-455.
Romer P.M. (�990), Endogenous Technical Change, Journal of Political Economy, 98(5), 7�-�02.
E-Learning diffusion among european �MEs and its relationship������

�33
Sambrook S. (2003), E-learning in small organizations, Education + Training, 45(8/9), 506-�6.
Sloman M. (2002), The E-Learning revolution: Ho� technolog� is driving a ne� training paradigm, american Management association, New York.
Welsh E.T., Wanberg C.R., Brown K.G., Simmering M.J. (2003), E-learning: emerging uses, empirical results and future directions, International Journal of Training & Development, 7(4), 245–258.
Bucciarelli E�� - Mattoscio N�� - �camuffa D�� G�� & L�� E�� R�� Vol�� 14 No 1 (2010), 117-133

�34

�35

�36
Finito di stamparenel mese di Settembre 2010
dalla Litografia Brandolini - Sambucetoper le Edizioni TRACCEVia Eugenia Ravasco, 54
65123 PESCARATel. 085/76658www.tracce.org