global business environment - universidade nova de...
TRANSCRIPT

Global Business Environment
Di�erences and Scale
Francesco Franco
Nova SBE
April 23, 2014
Francesco Franco Global Business Environment 1/21

International Trade
Trade Model
Mixture of:• The Ricardian model. Production possibilities are determined
by the alloca- tion of a single resource, labor, between sectors.This model conveys the essential idea of comparativeadvantage but does not allow us to talk about the distributionof income.
• The specific factors model. This model includes multiplefactors of production, but some are specific to the sectors inwhich they are employed. It also captures the short-runconsequences of trade on the distribution of income.
• The Heckscher-Ohlin model. Di�erences in resources drivetrade patterns. This model also captures the long-runconsequences of trade on the distribution of income.
Francesco Franco Global Business Environment 2/21

International Trade
Trade Model
In spite of the di�erences in their details, our models share anumber of features:
1 The productive capacity of an economy can be summarized byits production possibility frontier, and di�erences in thesefrontiers give rise to trade.
2 Production possibilities determine a country’s relative supplyschedule.
3 World equilibrium is determined by world relative demand anda world relative supply schedule that lies between the nationalrelative supply schedules
Francesco Franco Global Business Environment 3/21

International Trade
Trade Model
A model with all these ingredents can be used to establish1 how changes in the terms of trade and economic growth a�ect
the welfare of nations engaged in international trade.2 Understand the e�ects of tari�s and subsidies on trade
patterns and the wel- are of trading nations and on thedistribution of income within countries.
Francesco Franco Global Business Environment 4/21
International Trade
Trade Model
CHAPTER 6 The Standard Trade Model 113
Foodproduction, QF
Clothproduction, QC
Isovalue linesQ
TT
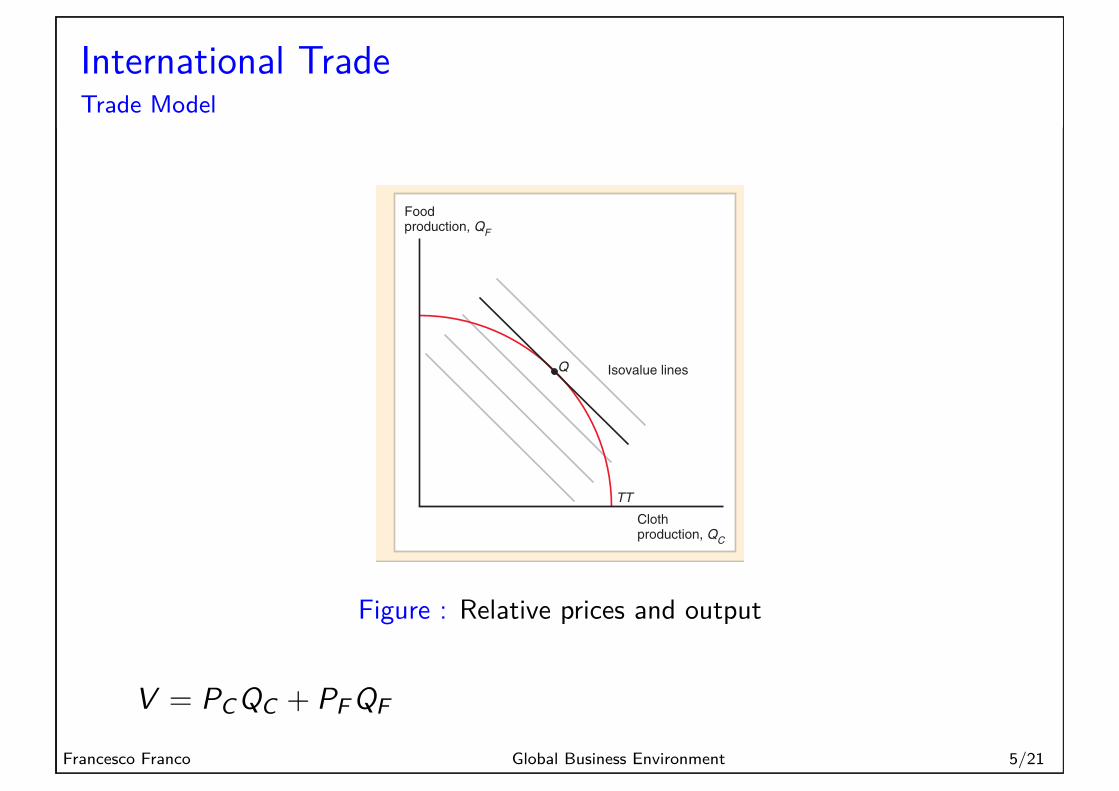
Figure 6-1Relative Prices Determine theEconomy’s Output
An economy whose productionpossibility frontier is TT will pro-duce at Q, which is on the highestpossible isovalue line.
maximize the value of its output where QC is the quantity of cloth pro-duced and QF is the quantity of food produced.
We can indicate the market value of output by drawing a number of isovalue lines—thatis, lines along which the value of output is constant. Each of these lines is defined by anequation of the form or, by rearranging, where V is the value of output. The higher V is, the farther out an isovalue line lies; thus iso-value lines farther from the origin correspond to higher values of output. The slope of anisovalue line is In Figure 6-1, the highest value of output is achieved by producingat point Q, where TT is just tangent to an isovalue line.
Now suppose that were to rise (cloth becomes more valuable relative to food).Then the isovalue lines would be steeper than before. In Figure 6-2a the highest isovalue linethe economy could reach before the change in is shown as ; the highest line afterthe price change is the point at which the economy produces shifts from to Thus, as we might expect, a rise in the relative price of cloth leads the economy to producemore cloth and less food. The relative supply of cloth will therefore rise when the relativeprice of cloth rises. This relationship between relative prices and relative production isreflected in the economy’s relative supply curve shown in Figure 6-2b.
Relative Prices and DemandFigure 6-3 shows the relationship among production, consumption, and trade in the stan-dard model. As we pointed out in Chapter 5, the value of an economy’s consumptionequals the value of its production:
where and are the consumption of cloth and food, respectively. The equation abovesays that production and consumption must lie on the same isovalue line.
The economy’s choice of a point on the isovalue line depends on the tastes of itsconsumers. For our standard model, we assume that the economy’s consumption
DFDC
PCQC + PFQF = PCDC + PFDF = V,
Q2.Q1VV2,VV1PC /PF
PC /PF
-PC/PF.
QF = V/PF - 1PC /PF2QC,PCQC + PFQF = V,
PCQC + PFQF,Figure : Relative prices and output
V = PCQC + PF QF
Francesco Franco Global Business Environment 5/21

International Trade
Trade Model
114 PART ONE International Trade Theory
Foodproduction, QF
Clothproduction, QC
Q1Q1
F
Q2F
Q1C Q2
C
TT
Q2
VV 2(PC /PF)2
VV 1(PC /PF)1
(a) (b)
Relativequantity ofcloth, QC /QF
Relative priceof cloth, PC /PF
(PC /PF)2
(Q1C /Q1
F) (Q 2C /Q2
F)
(PC /PF)1
2
1
RS
Figure 6-2How an Increase in the Relative Price of Cloth Affects Relative Supply
In panel (a), the isovalue lines become steeper when the relative price of cloth rises from (PC /PF)1 to (PC/PF)2
(shown by the rotation from VV1 to VV2). As a result, the economy produces more cloth and less food and theequilibrium output shifts from Q1 to Q2 Panel (b) shows the relative supply curve associated with the produc-tion possibilities frontier TT. The rise from (PC /PF)1 to (PC /PF)2 leads to an increase in the relative production ofcloth from QC
1/QF1 to QC
2 /QF2.
decisions may be represented as if they were based on the tastes of a single representativeindividual.2
The tastes of an individual can be represented graphically by a series of indifferencecurves. An indifference curve traces a set of combinations of cloth (C) and food (F) con-sumption that leave the individual equally well off. As illustrated in Figure 6-3, indiffer-ence curves have three properties:
1. They are downward sloping: If an individual is offered less food (F), then to be madeequally well off, she must be given more cloth (C).
2. The farther up and to the right an indifference curve lies, the higher the level of welfareto which it corresponds: An individual will prefer having more of both goods to less.
3. Each indifference curve gets flatter as we move to the right (they are bowed-out to theorigin): The more C and the less F an individual consumes, the more valuable a unit ofF is at the margin compared with a unit of C, so more C will have to be provided tocompensate for any further reduction in F.
2There are several sets of circumstances that can justify this assumption. One is that all individuals have the sametastes and the same share of all resources. Another is that the government redistributes income so as to maximizeits view of overall social welfare. Essentially, the assumption requires that effects of changing income distribu-tion on demand not be too important.
Figure : Relative prices and output
Francesco Franco Global Business Environment 6/21

International Trade
Trade Model
Demand: PCDC + PF DF = VCHAPTER 6 The Standard Trade Model 115
Quantityof food, QF
Quantityof cloth, QC
Indifference curves
Q
TT
D
Clothexports
Foodimports
Isovalue line
Figure 6-3Production, Consumption, andTrade in the Standard Model
The economy produces at point Q, where the productionpossibility frontier is tangent to the highest possible isovalueline. It consumes at point D,where that isovalue line is tangentto the highest possible indifferencecurve. The economy producesmore cloth than it consumes and therefore exports cloth; correspondingly, it consumes more food than it produces and therefore imports food.
As you can see in Figure 6-3, the economy will choose to consume at the point on theisovalue line that yields the highest possible welfare. This point is where the isovalue lineis tangent to the highest reachable indifference curve, shown here as point D. Notice thatat this point, the economy exports cloth (the quantity of cloth produced exceeds the quan-tity of cloth consumed) and imports food.
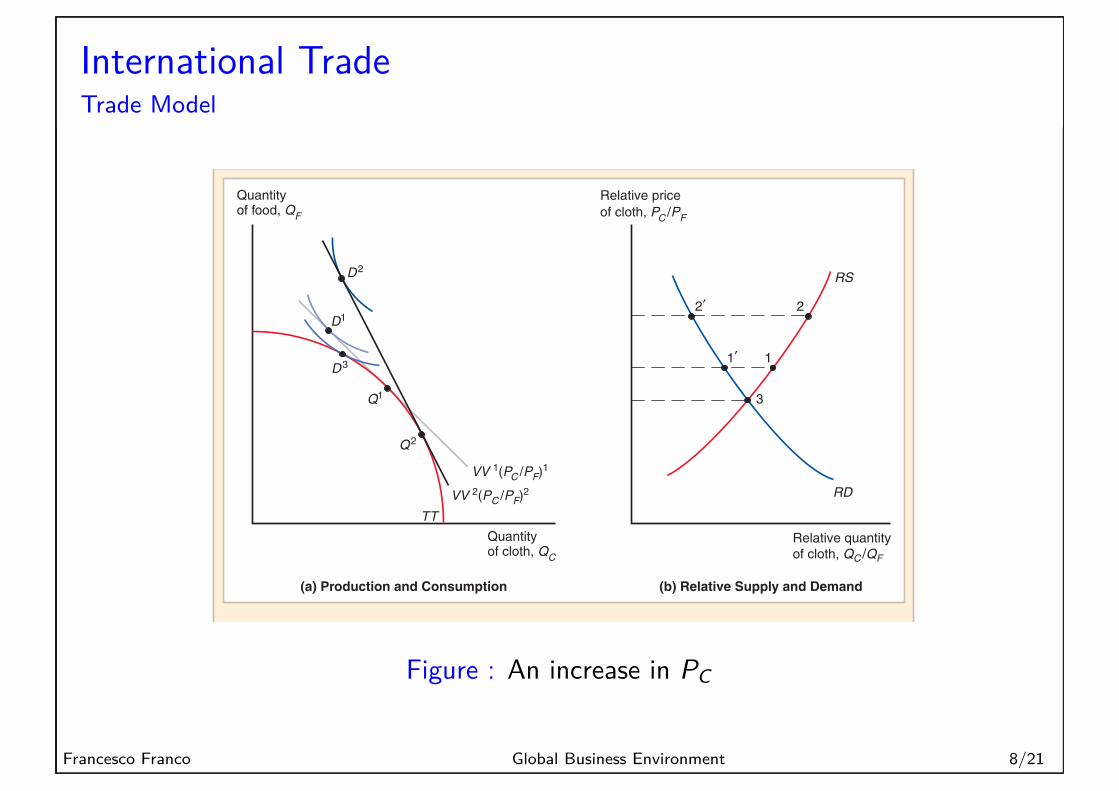
Now consider what happens when increases. Panel (a) in Figure 6-4 shows theeffects. First, the economy produces more C and less F, shifting production from to .This shifts, from to the isovalue line on which consumption must lie. The econ-omy’s consumption choice therefore also shifts, from to
The move from to reflects two effects of the rise in First, the economy hasmoved to a higher indifference curve, meaning that it is better off. The reason is that thiseconomy is an exporter of cloth. When the relative price of cloth rises, the economy cantrade a given amount of cloth for a larger amount of food imports. Thus the higher relativeprice of its export good represents an advantage. Second, the change in relative pricesleads to a shift along the indifference curve, toward food and away from cloth (since clothis now relatively more expensive).
These two effects are familiar from basic economic theory. The rise in welfare is anincome effect; the shift in consumption at any given level of welfare is a substitution effect.The income effect tends to increase consumption of both goods, while the substitutioneffect acts to make the economy consume less C and more F.
Panel (b) in Figure 6-4 shows the relative supply and demand curves associated with theproduction possibilities frontier and the indifference curves.3 The graph shows how the in-crease in the relative price of cloth induces an increase in the relative production of cloth(move from point 1 to 2) as well as a decrease in the relative consumption of cloth (move from
PC /PF.D2D1D2.D1
VV2,VV1,Q2Q1
PC /PF
3For general preferences, the relative demand curve will depend on the country’s total income. We assumethroughout this chapter that the relative demand curve is independent of income. This is the case for a widelyused type of preferences called homothetic preferences.
Figure : production and consumption
Francesco Franco Global Business Environment 7/21
International Trade
Trade Model116 PART ONE International Trade Theory
Quantityof food, QF
Quantityof cloth, QC
TT
Q1
Q2
D1
D3
VV 1(PC /PF)1
D2
VV 2(PC /PF)2
(a) Production and Consumption (b) Relative Supply and Demand
Relative priceof cloth, PC /PF
3
1
2
1!
2!
RD
RS
Relative quantityof cloth, QC /QF
Figure 6-4
Effects of a Rise in the Relative Price of Cloth and Gains from Trade
In panel (a), the slope of the isovalue lines is equal to minus the relative price of cloth, . As a result, whenthat relative price rises, all isovalue lines become steeper. In particular, the maximum-value line rotates from
to Production shifts from to and consumption shifts from to If the economy cannottrade, then it produces and consumes at point Panel (b) shows the effects of the rise in the relative price ofcloth on relative production (move from 1 to 2) and relative demand (move from to . If the economycannot trade, then it consumes and produces at point 3.
2¿1¿D3.
D2.D1Q2Q1VV2.VV1
PC/PF
point to ). This change in relative consumption captures the substitution effect of theprice change. If the income effect of the price change were large enough, then consump-tion levels of both goods could rise ( and both increase); but the substitution effectof demand dictates that the relative consumption of cloth, decrease. If the econ-omy cannot trade, then it consumes and produces at point 3 (associated with the relativeprice .
The Welfare Effect of Changes in the Terms of TradeWhen increases, a country that initially exports cloth is made better off, as illustrated bythe movement from to in panel (a) of Figure 6-4. Conversely, if were to decline, thecountry would be made worse off; for example, consumption might move back from to
If the country were initially an exporter of food instead of cloth, the direction of thiseffect would be reversed. An increase in would mean a fall in and the countrywould be worse off: The relative price of the good it exports (food) would drop. We coverall these cases by defining the terms of trade as the price of the good a country initiallyexports divided by the price of the good it initially imports. The general statement, then, isthat a rise in the terms of trade increases a country’s welfare, while a decline in the termsof trade reduces its welfare.
PC /PF,PC /PF
D1.D2PC /PFD2D1
PC /PF
(PC /PF)32 DC /DF,DFDC
2¿1¿
Figure : An increase in PC
Francesco Franco Global Business Environment 8/21

International Trade
Trade Model
118 PART ONE International Trade Theory
1
RD
RS *
RS WORLD
RS
Relative priceof cloth, PC /PF
(PC /PF)1
Relative quantity
of cloth, (QC /QF )
(a) Relative Supply and Demand
Home Foreign
Q*
D *
D *
Q *
D *Q *
F
F
C C
VV 1(PC /PF )1
Q
D
DC QC
DF
QF
Home’sfoodimports
Home’sclothexports
Quantityof cloth, QC
Quantityof food, QF
VV 1(PC /PF )1
Foreign’sfoodexports
Foreign’sclothimports
Quantityof cloth, QC
Quantityof food, QF
(b) Production, Consumption, and Trade
Figure 6-5Equilibrium Relative Price with Trade and Associated Trade Flows
Panel (a) shows the relative supply of cloth in Home (RS), in Foreign (RS*), and for the world. Home and Foreign have the same relative demand, which is also the relative demand for the world. The equilibrium relative price is determined by the intersection of the world relative supply and demand curves.Panel (b) shows the associated equilibrium trade flows between Home and Foreign. At the equilibriumrelative price , Home’s exports of cloth equals Foreign’s imports of cloth; and Home’s imports of food equals Foreign’s exports of food.
1PC >PF211PC>PF21
Figure : 2 countries equilibrium
Francesco Franco Global Business Environment 9/21

Trade model
Bias growth
Bias growth:• technological progress in one sector expands output in that
sector• increase in a country supply of a factor of production
Francesco Franco Global Business Environment 10/21

Trade model
Bias growth
• Export-biased growth tends to worsen a growing country’sterms of trade, to the benefit of the rest of the world
• import-biased growth tends to improve a growing country’sterms of trade at the rest of the world’s expense
• immiserizing growth in the developing World• Import tari�s an export subsidies (maybe for distributional
and protection but ultimately a�ect terms of trade)
Francesco Franco Global Business Environment 11/21

Tari�s and Export Subsidies
E�ects
• The distinctive feature of tari�s and export subsidies is thatthey create a di�erence between prices at which goods aretraded on the world market and prices at which those goodscan be purchased within a country.
• The direct e�ect of a tari� is to make imported goods moreexpensive inside a country than they are outside the country.
• An export subsidy gives producers an incentive to export
Francesco Franco Global Business Environment 12/21

Tari�s and Export Subsidies
E�ects for a big country or trading block
Figure : E�ects pf a Fodd Tari� on the Terms of Trade
Francesco Franco Global Business Environment 13/21
Scale and Scope
1 international trade often occurs from increasing returns toscale (instead of di�erences)
2 Understand the di�erences between internal and externaleconomies of scale
3 sources of external economies4 roles of external economies and knowledge spillovers in
shaping comparative advantage and international tradepatterns.
Francesco Franco Global Business Environment 14/21

Scale and Scope
• External economies of scale occur when the cost per unitdepends on the size of the industry but not necessarily on thesize of any one firm
• Internal economies of scale occur when the cost per unitdepends on the size of an individual firm but not necessarilyon that of the industry
Francesco Franco Global Business Environment 15/21

Scale and Scope
External economies
Marshall, industrial districts:
• the ability of a cluster to support specialized suppliers• the way that a geographically concentrated industry allows
labor market pooling• and the way that a geographically concentrated industry helps
foster knowledge spillovers.
Francesco Franco Global Business Environment 16/21

Scale and Scope
External economies: forward-falling supply curve
CHAPTER 7 External Economies of Scale and the International Location of Production 143
P1
Q1
1
D
AC
Quantity of widgetsproduced, demanded
Price, cost (per widget)
Figure 7-1External Economies and MarketEquilibrium
When there are externaleconomies of scale, the averagecost of producing a good falls asthe quantity produced rises. Givencompetition among many produc-ers, the downward-sloping averagecost curve AC can be interpretedas a forward-falling supply curve.As in ordinary supply-and-demandanalysis, market equilibrium is atpoint 1, where the supply curveintersects the demand curve, D.The equilibrium level of output isQ1, the equilibrium price P1.
While the details of external economies in practice are often quite subtle and complex(as the example of Silicon Valley shows), it can be useful to abstract from the details andrepresent external economies simply by assuming that the larger the industry, the lower theindustry’s costs. If we ignore international trade for the moment, then market equilibriumcan be represented with a supply-and-demand diagram like Figure 7-1, which illustratesthe market for widgets. In an ordinary picture of market equilibrium, the demand curve isdownward sloping, while the supply curve is upward sloping. In the presence of externaleconomies of scale, however, there is a forward-falling supply curve: the larger theindustry’s output, the lower the price at which firms are willing to sell, because theiraverage cost of production falls as industry output rises.
In the absence of international trade, the unusual slope of the supply curve in Figure 7-1doesn’t seem to matter much. As in a conventional supply-and-demand analysis, the equi-librium price, P1, and output, Q1, are determined by the intersection of the demand curveand the supply curve. As we’ll see next, however, external economies of scale make a hugedifference to our view of the causes and effects of international trade.
External Economies and International TradeExternal economies drive a lot of trade both within and between countries. For example,New York exports financial services to the rest of the United States, largely because exter-nal economies in the investment industry have led to a concentration of financial firms inManhattan. Similarly, Britain exports financial services to the rest of Europe, largelybecause those same external economies have led to a concentration of financial firms inLondon. But what are the implications of this kind of trade? We’ll look first at the effectsof trade on output and prices; then at the determinants of the pattern of trade; and finally atthe effects of trade on welfare.
External Economies, Output, and PricesImagine, for a moment, that we live in a world in which it is impossible to trade buttonsacross national borders. Assume, also, that there are just two countries in this world,
Figure : External economies
Francesco Franco Global Business Environment 17/21

Scale and Scope
External economies
• Lock in e�ects• Dynamic increasing returns• Interregional trade
Francesco Franco Global Business Environment 18/21
Scale and Scope
External economies
146 PART ONE International Trade Theory
“locked in” by external economies of scale even after the circumstances that created theinitial advantage are no longer relevant. The financial centers in London and New York areclear examples. London became Europe’s dominant financial center in the 19th century,when Britain was the world’s leading economy and the center of a world-spanning empire.It has retained that role even though the empire is long gone and modern Britain is only amiddle-sized economic power. New York became America’s financial center thanks to theErie Canal, which made it the nation’s leading port. It has retained that role even thoughthe canal currently is used mainly by recreational boats.
Often sheer accident plays a key role in creating an industrial concentration.Geographers like to tell the tale of how a tufted bedspread, crafted as a wedding gift by a19th-century teenager, gave rise to the cluster of carpet manufacturers around Dalton,Georgia. Silicon Valley’s existence may owe a lot to the fact that a couple of Stanfordgraduates named Hewlett and Packard decided to start a business in a garage in that area.Bangalore might not be what it is today if vagaries of local politics had not led TexasInstruments to choose, back in 1984, to locate an investment project there rather than inanother Indian city.
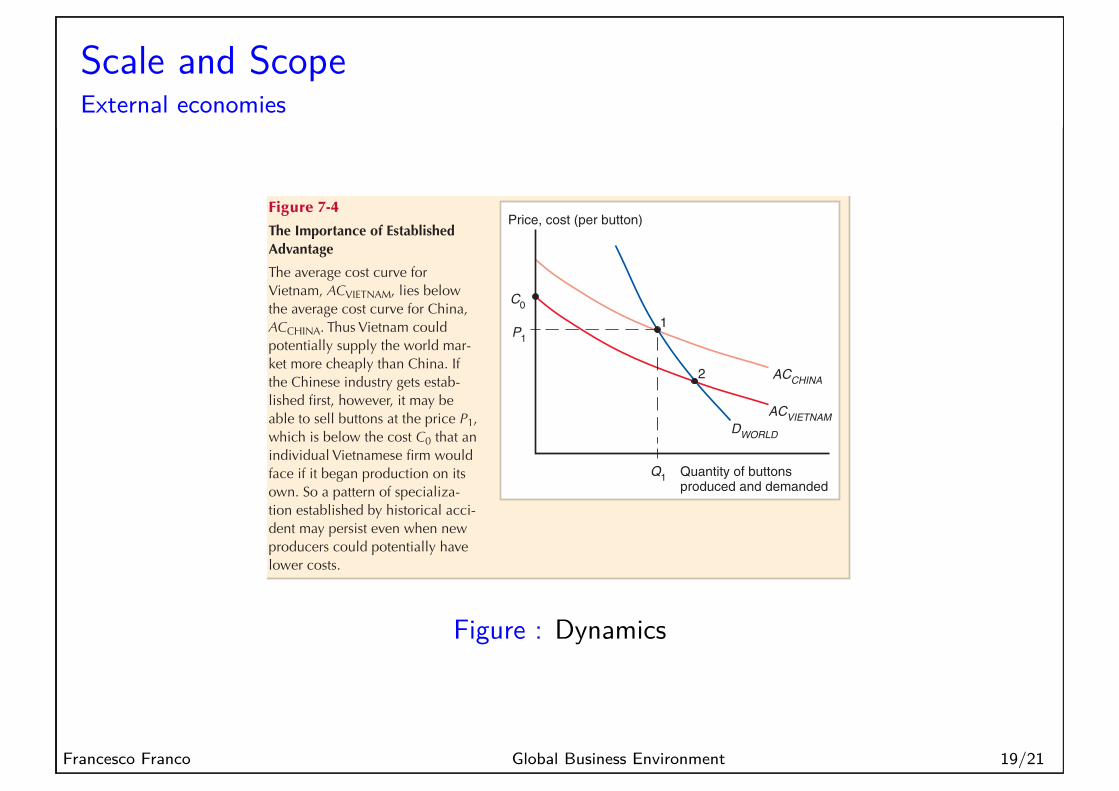
One consequence of the role of history in determining industrial location is that indus-tries aren’t always located in the “right” place: Once a country has established an advantagein an industry, it may retain that advantage even if some other country could potentiallyproduce the goods more cheaply.
Figure 7-4, which shows the cost of producing buttons as a function of the number ofbuttons produced annually, illustrates this point. Two countries are shown: China andVietnam. The Chinese cost of producing a button is shown as ACCHINA, the Vietnamesecost as ACVIETNAM. DWORLD represents the world demand for buttons, which we assumecan be satisfied either by China or by Vietnam.
Suppose that the economies of scale in button production are entirely external to firms,and that since there are no economies of scale at the level of the firm, the button industryin each country consists of many small, perfectly competitive firms. Competition thereforedrives the price of buttons down to its average cost.
Price, cost (per button)
C0
P1
Q1
1
2
DWORLD
ACCHINA
ACVIETNAM
Quantity of buttonsproduced and demanded
Figure 7-4The Importance of EstablishedAdvantage
The average cost curve forVietnam, ACVIETNAM, lies belowthe average cost curve for China,ACCHINA. Thus Vietnam couldpotentially supply the world mar-ket more cheaply than China. Ifthe Chinese industry gets estab-lished first, however, it may beable to sell buttons at the price ,which is below the cost that anindividual Vietnamese firm wouldface if it began production on itsown. So a pattern of specializa-tion established by historical acci-dent may persist even when newproducers could potentially havelower costs.
C0
P1
Figure : Dynamics
Francesco Franco Global Business Environment 19/21
Scale and Scope
External economies
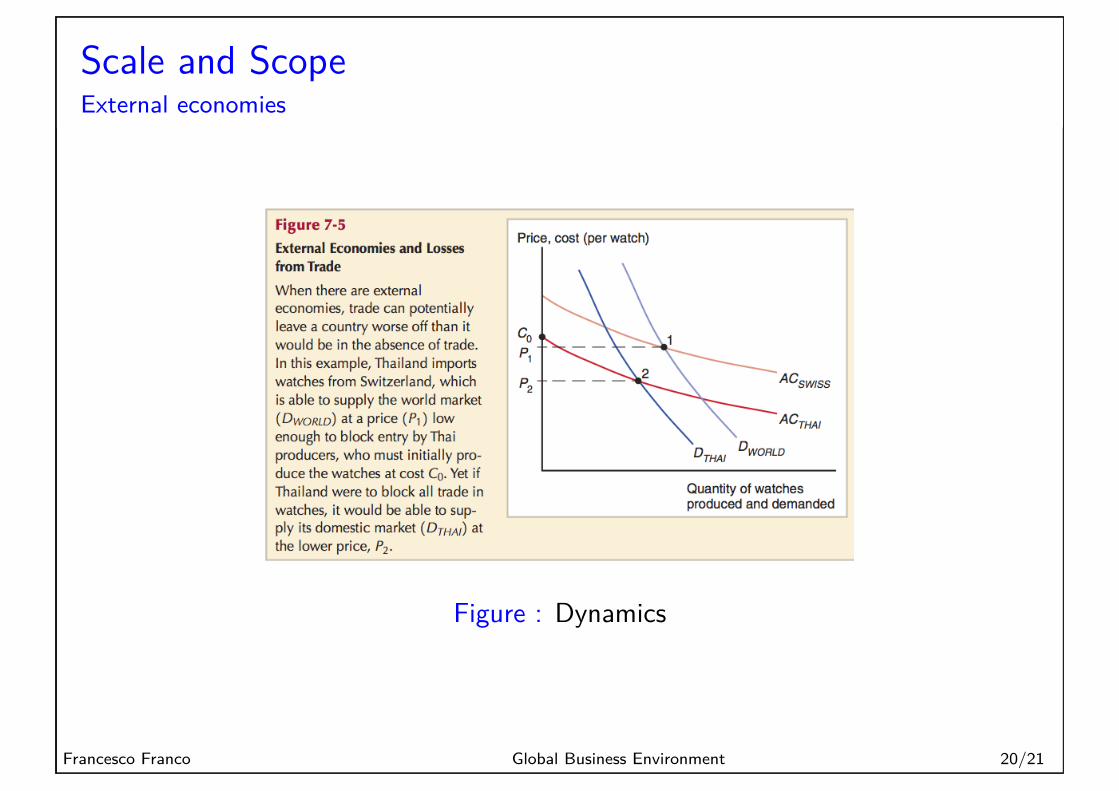
Figure : Dynamics
Francesco Franco Global Business Environment 20/21

Readings
*Krugman, Obstfeld and Melitz, chapter 6-7*Elhanan Helpman, Understanding Global Trade, HarvardUniversity Press 2011 chap 4
Francesco Franco Global Business Environment 21/21