global development finance 2001 building coalitions for effective development finance
TRANSCRIPT

Global Development Finance 2001
Building Coalitions for Effective Development Finance

The context
• Global uncertainties in the short-term- deceleration of growth- emerging market crises- heightened interaction between financial markets and
real economy• Strong medium-term prospects
- technology- policy flexibility- greater commitment to global challenges

This presentation covers
• The macro outlook• Private capital flows
- Trends- Implications for developing country growth
• Concessional resource transfers- Trends and effectiveness- Debt relief- International public goods

Macro outlook
• Sharp slowdown
• Early recovery
• Important risks

Sharp slowdown in world GDP growth(percent change)
0
1
2
3
4
5
6
1997 1998 1999 2000 2001 2002 2003
Source: World Bank data and projections.
Developing
Industrial
World

Cycle should be short-lived
• Interest rate reductions
• Anticipation of tax cut in U.S. and Europe
• Technology helps shorten inventory cycle
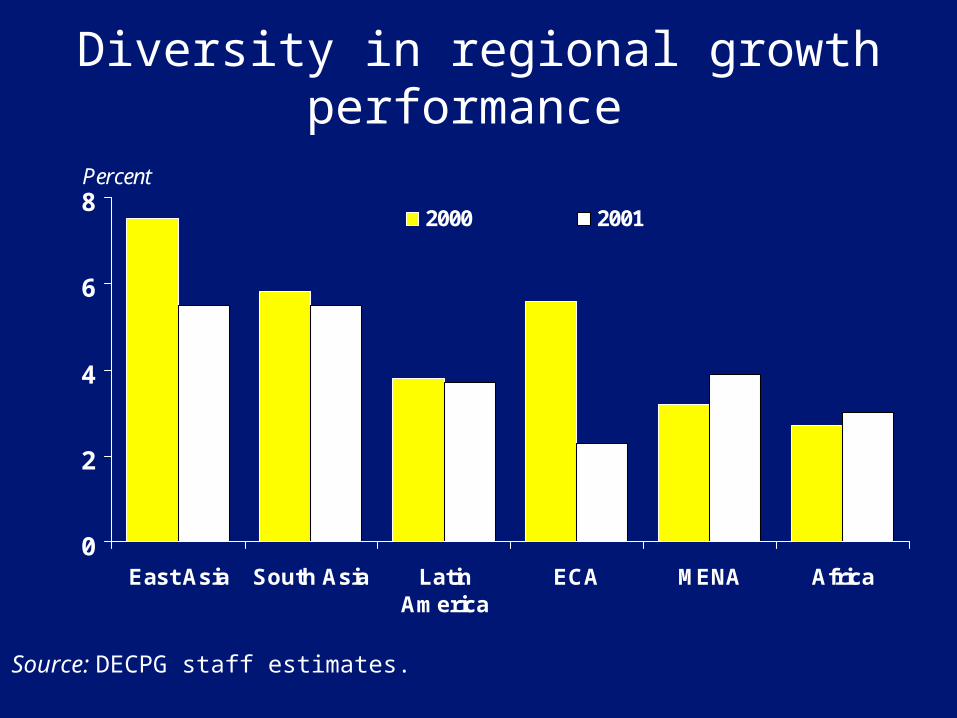
Diversity in regional growth performance
0
2
4
6
8
East Asia South Asia LatinAmerica
ECA MENA Africa
2000 2001
Percent
Source: DECPG staff estimates.
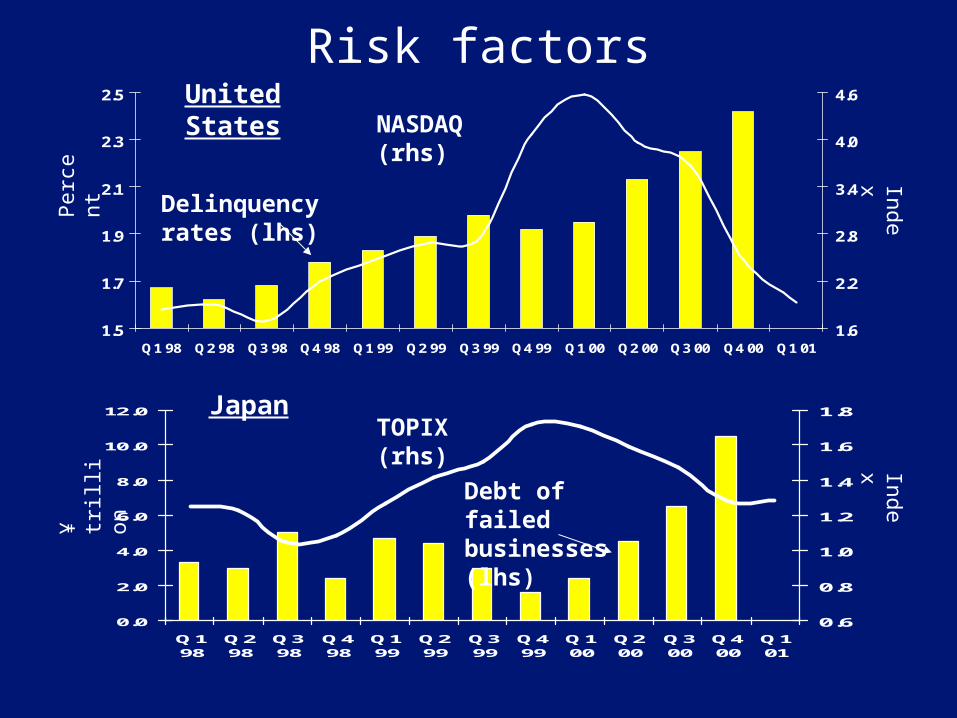
1.5
1.7
1.9
2.1
2.3
2.5
Q1 98 Q2 98 Q3 98 Q4 98 Q1 99 Q2 99 Q3 99 Q4 99 Q1 00 Q2 00 Q3 00 Q4 00 Q1 011.6
2.2
2.8
3.4
4.0
4.6
0.0
2.0
4.0
6.0
8.0
10.0
12.0
Q198
Q298
Q398
Q498
Q199
Q299
Q399
Q499
Q100
Q200
Q300
Q400
Q101
0.6
0.8
1.0
1.2
1.4
1.6
1.8
Per
cent
Index¥
tril
lion
Delinquency rates (lhs)
NASDAQ (rhs)
TOPIX (rhs)
Debt of failed businesses (lhs)
United States
Japan
Risk factorsIndex

Trends in capital flows
• Capital flows down relative to GDP
• Developing countries improve creditworthiness
• But lose share of global flows

0
5
10
15
1990 1991 1992 1993 1994 1995 1996 1997 1998 1999 2000
Per
cent
Russia BrazilCrises
Private capital flows/ Recipients’ exports
Private capital flows/Recipients’ GDP
Private capital flows in relation to
GDP and trade
ThailandMexico
Note: Private capital flows are net of amortization.

Reduced external vulnerability
a. Short-term debt and total debt are as of September 2000.Source: Bank for International Settlements, Global Development Finance Country Tables and sources cited therein, IMF International Financial Statistics and World Bank staff estimates.
Region and indicator (ratio) 1996 1997 1998 1999 2000a
All developing countries
Short-term debt to total debt 54.3 52.2 46.9 45.3 46.5
Reserves to short-term debt 138.4 130.8 164.2 184.2 204.3
East Asia and Pacific
Short-term debt to total debt 61.1 53.4 45.2 43.1 44.3
Reserves to short-term debt 127.0 126.7 233.2 325.3 377.9
Latin America and Caribbean
Short-term debt to total debt 52.4 53.2 49.4 46.8 47.1
Reserves to short-term debt 116.4 106.4 104.4 105.3 104.4

Developing countries lose share in international FDI
0
200
400
600
800
1000
1200
1991
1992
1993
1994
1995
1996
1997
1998
1999
2000
1991
1992
1993
1994
1995
1996
1997
1998
1999
Global Developing countries Top 10 LDCs
FDI Mergers and acquisitions
Note: Top 10 refers to the developing countries with the largest FDI (or M&A) flows.

Private flows and growth
• Private capital flows reinforce growth
• Volatility has high costs
• No “race to the bottom”

Capital flows to GDP ratio (percent)
0
1
2
3
4
5
6
7
1970 1972 1974 1976 1978 1980 1982 1984 1986 1988 1990 1992 1994 1996 1998
Top 10*
Middle income
Low income
* Refers to the ten developing countries with the largest net capital flows.Note: Capital flows are net of amortization.

Growing divergence between middle and low income
countries(annual GDP growth rates)
0
1
2
3
4
5
6
7
1970s 1980s 1990s
Low Income Middle Income Top 10*
* Refers to the ten developing countries with the largest net capital flows.

-6
-4
-2
0
2
4
6
8
-3 -2 -1 0 1 2 3 4
Volatility
Per
cap
ita
grow
th r
ate,
un
exp
lain
ed
par
t
percent
Capital flows volatility reduces growth
Note: The regression line controls for other determinants of growth

Pollution levels have fallen, while FDI has increased: Sao Paulo State,
Brazil
0
1
2
3
4
5
6
7
1985 1986 1987 1988 1989 1990 1991 1992 1993 1994 1995 1996 1997
FD
I (1
998
US
$ b
illi
ons)
0
20
40
60
80
100
120
140
160
Par
ticu
late
air
pol
luti
on (
SP
M+
ug/
m3)
Pollution index (rhs)
FDI (lhs)
FDI

More aid and more effective aid
• Slight rise in aid flows since 1997
• Better policy performance
• Better aid allocation

Aid has risen modestly since 1997
35.0
37.5
40.0
42.5
45.0
47.5
50.0
0.20
0.22
0.24
0.26
0.28
0.30
0.32
0.34
0.36US$ billion % of donor GNP
Aid as a percentage of donor GNP (rhs)
Aid in US$ billions (lhs)*
* Net of technical cooperation grants.

Improved policy performanceover the 1990s
0
1
2
3
4
5
IDA onlycountries
Low incomecountries excl.
IDA
Lower middleincome countries
Upper middleincome countries
1991 1999
Index (1-6)
Source: DECPG staff estimates.

Poor performers received less aid
Highpolicy
Middlepolicy
Lowpolicy
Lowest third
Middle third
Top third0
0.1
0.2
0.3
Aid
/GD
P
Developing countryincome groups
Countryperformance
Source: OECD and World Bank.
Between 1992 and 1994, on average, poor performers received more aid than better performers...
Lowpolicy
Middlepolicy
Highpolicy
Lowest third
Middle third
Top third0
0.1
0.2
0.3
Aid
/GD
P
Developing countryincome groups
Countryperformance
...In 1998 poor performers are receiving less aid than better performers.

The increasing coordination challenge
0
5
10
15
20
1960s 1970s 1980s 1990s
Num
ber o
f don
ors
Note: The Theil index in Panel C is a statistical measure of the extent of concentration of aidby sector. Higher values of the index indicate that aid is spread over a greater number of sectors.Source: OECD Development Assistance Committee.
0.7
0.8
0.9
1
1.1
Thei
l's in
dex
0
10
20
30
40
50
60
70
80
90
100
Num
ber o
f rec
ipie
nt c
ount
ries

The Heavily Indebted Poor Countries initiative
• A new start: quicker pace, more relief
• Tie to policy reform: key for success.
• Eventual cost of initiative: $28.6 billion (net
present value).

The declining HIPC debt burden
0
5
10
15
20
25
1998 1999 2000 2001-05
Debt service/exportsDebt service/fiscal revenue
percent
Note: Ratios for 1998 and 1999 are debt service paid to exports or revenue: ratios for 2000 onwards are debt service due after HIPC assistance to exports or revenue. Data refers to the22 HIPCs that reached decision points by end-December.Source: Country authorities and World Bank/IMF staff estimates.

International public goods
• $5 billion a year of aid flows
• Growing trend
• But incentives more important than
finance

Growing share of development assistance to international public
goods
0
5
10
15
20
1970s 1980s Early 1990s Late 1990s
Per
cen
t of
tot
al O
DA
0
10000
20000
30000
40000
50000
US
$ m
illio
n
Core expenditure (lhs) Complementary expenditure (lhs) Total Aid expenditure (rhs)

Principles for public goods
• Complementarity
• Leverage
• Incentives for responsible action

The agenda
• Investment climate
• Volatility safeguards
• More aid: better performers & the poor
• More donor specialization & coordination
• High leverage in public goods provision
• IFIs: specialization, subsidiarity, convening
role.