global downstream petroleum outlook - opec · title: microsoft powerpoint - claude mandil author:...
TRANSCRIPT

Copyright IEA
Global Downstream Global Downstream Petroleum OutlookPetroleum Outlook
Claude Claude MandilMandilExecutive DirectorExecutive Director
International Energy AgencyInternational Energy Agency
33rdrd OPEC International Seminar OPEC International Seminar Vienna, 12 September 2006Vienna, 12 September 2006

Copyright IEA
Spare Refinery Capacity Has TightenedSpare Refinery Capacity Has Tightened
40
45
50
55
60
65
70
75
80
85
90
1971
1973
1975
1977
1979
1981
1983
1985
1987
1989
1991
1993
1995
1997
1999
2001
2003
2005
mb/
d
60%
65%
70%
75%
80%
85%
90%
95%
100%
Refin
ery
utili
zatio
n ra
te
Consumption Global Refining Capacity Refinery utilization rate
Alongside strong economic growth and concerns in the upstream, the downward trend in oil refining spare capacity has pushed oil prices to current high levels

Copyright IEA
Will downstream constraints alleviate ?

Copyright IEA
MediumMedium--term Oil Demand Outlookterm Oil Demand Outlook
Oil demand is on track to reach around 94 mb/d in 2011. Non-OECD regions will account for over three-quarters of the increase
-500
0
500
1,000
1,500
2,000
2,500
1995 2000 2005 2010
kb/d
OECD Non-OECD

Copyright IEA
Ongoing Ongoing DieselisationDieselisation of the Vehicle Fleetof the Vehicle Fleet
Demand for transport fuels will drive oil demand globally. In Europe and Asia dieselisation of the vehicle fleet will gather pace, clearly
impacting inter-regional trade.
Share of Diesel-Fuelled Passenger Vehicles 2005 vs. 2011
0% 10% 20% 30% 40% 50% 60% 70%
France
Germany
Italy
Netherlands
Portugal
Spain
United Kingdom
Western Europe
2005
2011
Copyright IEA
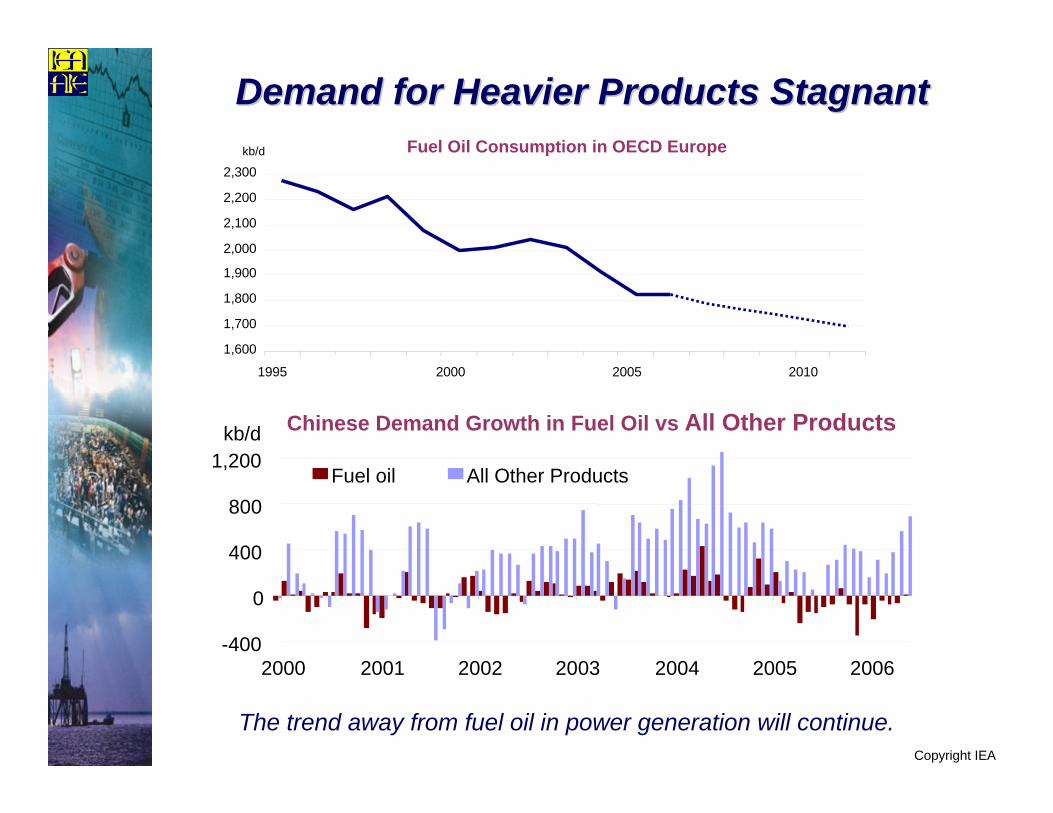
Demand for Heavier Products StagnantDemand for Heavier Products Stagnant
The trend away from fuel oil in power generation will continue.
Chinese Demand Growth in Fuel Oil vs All Other Products
-400
0
400
800
1,200
2000 2001 2002 2003 2004 2005 2006
kb/d
Fuel oil All Other Products
Fuel Oil Consumption in OECD Europe
1995 2000 2005 2010
1,600
1,700
1,800
1,900
2,000
2,100
2,200
2,300kb/d
Copyright IEA
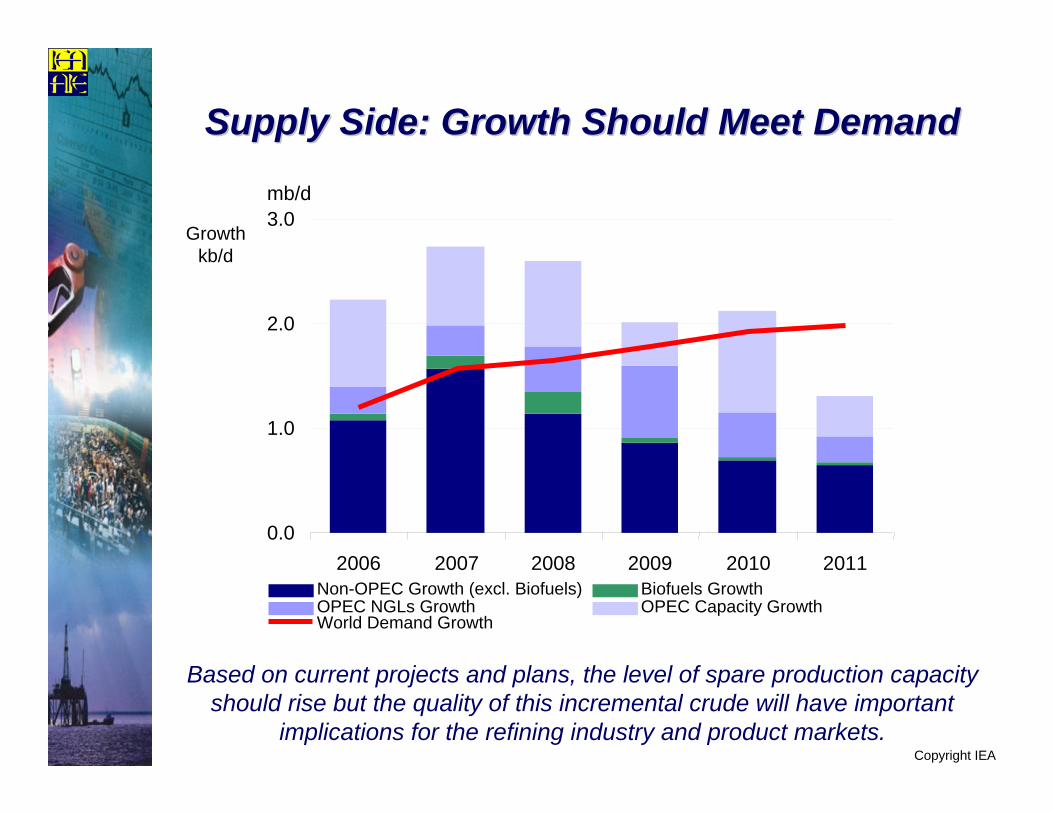
Supply Side: Growth Should Meet DemandSupply Side: Growth Should Meet Demand
Growthkb/d
0.0
1.0
2.0
3.0
2006 2007 2008 2009 2010 2011
mb/d
Non-OPEC Growth (excl. Biofuels) Biofuels GrowthOPEC NGLs Growth OPEC Capacity GrowthWorld Demand Growth
Based on current projects and plans, the level of spare production capacity should rise but the quality of this incremental crude will have important
implications for the refining industry and product markets.

Copyright IEA
Will Refining Capacity Remain a Will Refining Capacity Remain a Constraint ?Constraint ?
0
1
2
3
4
2006 2007 2008 2009 2010 2011
(mb/d)
Demand Growth Incremental Capacity
?
Growth in refining capacity is set to trail that of oil demand till 2009 and then improve. The bulk of new capacity will be in the Middle East and
Asia.
Copyright IEA
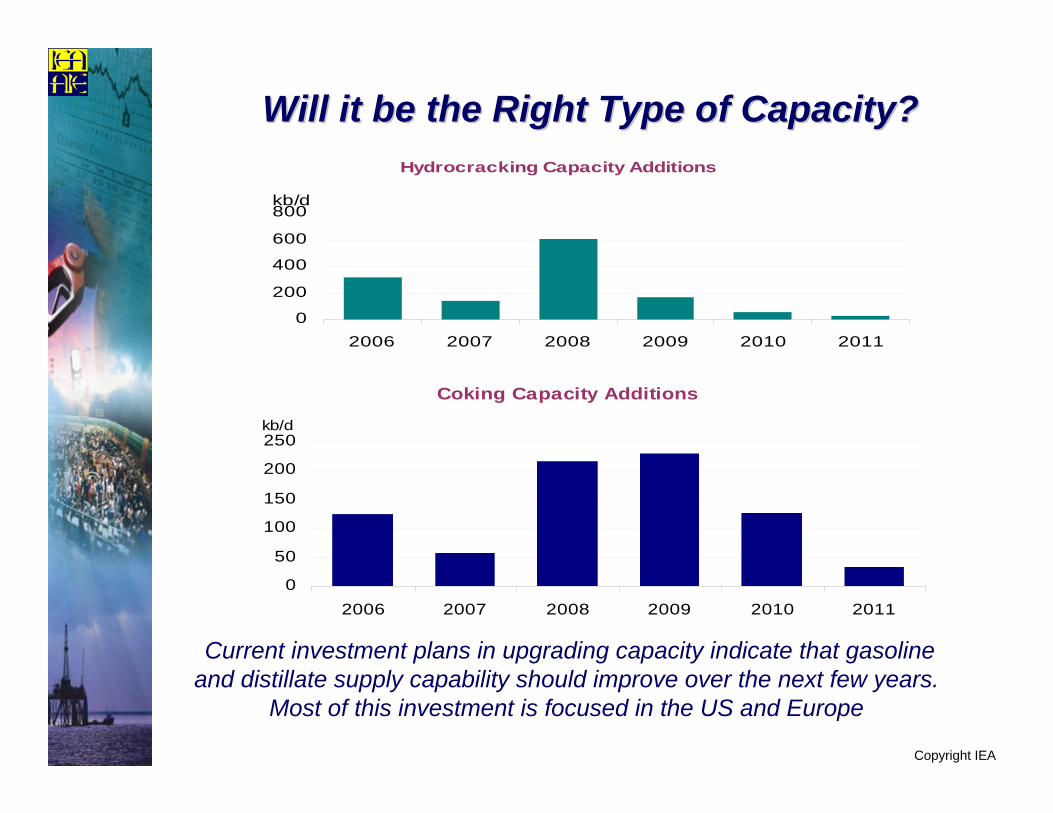
Hydrocracking Capacity Additions
0
200
400
600
800
2006 2007 2008 2009 2010 2011
kb/d
Coking Capacity Additions
0
50
100
150
200
250
2006 2007 2008 2009 2010 2011
kb/d
Will it be the Right Type of Capacity? Will it be the Right Type of Capacity?
Current investment plans in upgrading capacity indicate that gasoline and distillate supply capability should improve over the next few years.
Most of this investment is focused in the US and Europe

Copyright IEA
LongerLonger--term: Increased Role For Refining term: Increased Role For Refining in Major Producing Countriesin Major Producing Countries
Based on announced projects and plans, MENA refining capacity is set to rise from 9 mb/d now to around 15 mb/d in 2020
0
1
2
3
4
5
2006-2010 2011-2020
Incr
emen
tal C
apci
ty (
mb/
d)
Saudi Arabia Iran KuwaitIraq Algeria Other Middle EastOther North Africa

Copyright IEA
Strategic Issues for the Refining SectorStrategic Issues for the Refining Sector
• “Boutique" fuel standards vs. deteriorating crude quality
• The competitive threat of biofuels
• Long-term environmental sustainability

Copyright IEA
Ongoing Tightening of Fuel SpecificationsOngoing Tightening of Fuel Specifications
1
10
100
1000D
iese
l Sul
phur
Con
tent
(p
pm)
US EU 25 JAPAN CHINA
2003 2004 2005 2006 2007 2008 2009
Meeting increasingly stringent fuel quality specifications as crude qualitydeteriorates will require ongoing investment. Global harmonization of
standards would be an effective trade enabler.

Copyright IEA
World Biofuel ProductionWorld Biofuel Production
World Fuel Ethanol and Biodiesel Production
0
200
400
600
800
1000
1200
1400
2000 2002 2004 2006 2008 2010
kb/dBiodiesel -WorldEUAustraliaThailandPhilippinesIndiaChinaVenezuelaColombiaPeruCentral AmericaCanadaUSA Brazil
Source: F.O. Licht, IEA estimates
Based on announced projects and plans, biofuels production could grow from 700 kb/d in 2006 to at least 1.2 mb/d in 2011. A marginal but rapidly
growing competitor to the refining sector.

Copyright IEA
“We will act with resolve and urgency to meet our
shared multiple objectives of reducing greenhouse gas
emissions, improving the global environment, enhancing
energy security and cutting air pollution in conjunction
with our vigorous efforts to reduce poverty“
-- from “G8 Gleneagles Communiqué”
“We will move forward with timely implementation of the
Gleneagles Plan of Action. We have instructed our relevant ministers
to continue the Dialogue on Climate Change, Clean Energy and Sustainable
Development and report its outcomes to the G8 Summit in 2008”
-- from “G8 St. Petersburg Communiqué”
Copyright IEA
• Medium-term trends point to an improvement in the level and type of spare refining capacity
• Nonetheless, there remains an ongoing need to:– Maintain downstream investment, particularly in upgrading capacity – Improve public awareness of the need for new refineries– Ensure new fuel quality specifications are warranted on environmental grounds and do
not unduly restrict trade
• In the longer-term, refiners will need to continue to adapt to policies introduced in response to environmental, economic and energy security concerns aimed at:
– Increasing energy efficiency– Reducing demand growth in the transport sector– Promoting development and deployment of new technology
• Given this uncertainty governments must provide refiners with regulatory certainty
• The major producing countries will play an increased role in refined product markets
– Thus the need for enhanced producer-consumer dialogue on downstream issues
Key Messages

Copyright IEA
ANNEX SLIDES
Copyright IEA
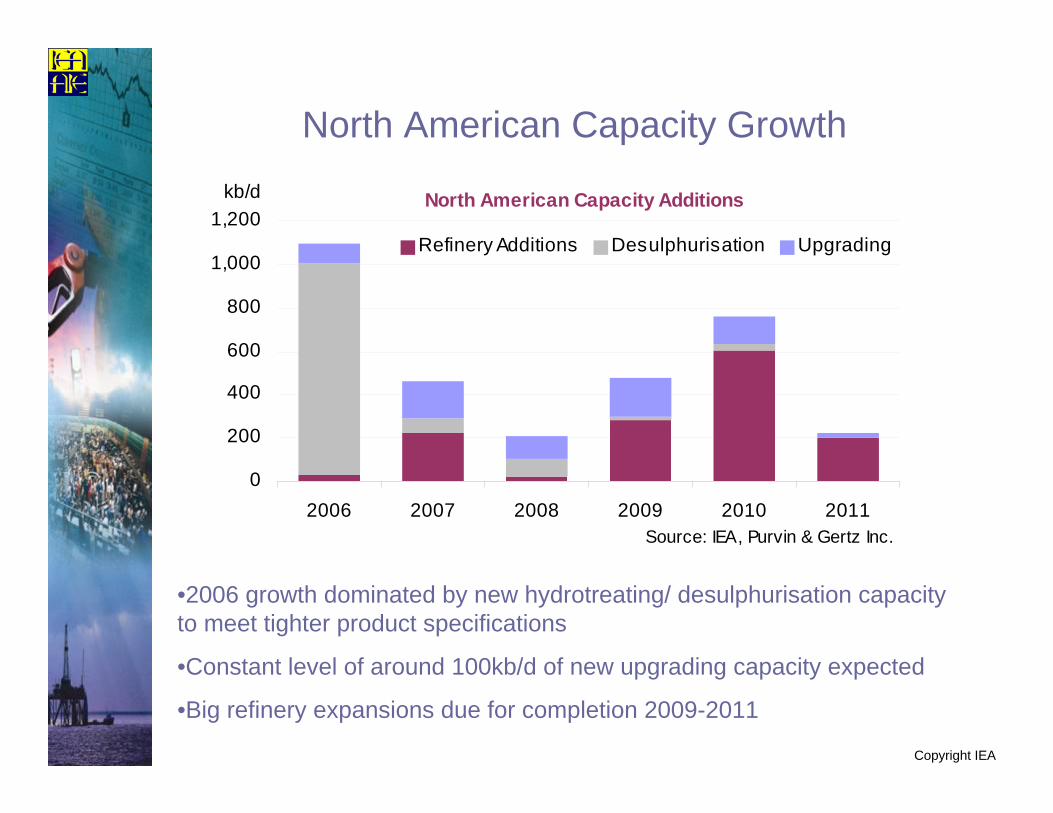
North American Capacity Growth
•2006 growth dominated by new hydrotreating/ desulphurisation capacity to meet tighter product specifications
•Constant level of around 100kb/d of new upgrading capacity expected
•Big refinery expansions due for completion 2009-2011
North American Capacity Additions
0
200
400
600
800
1,000
1,200
2006 2007 2008 2009 2010 2011
kb/d
Refinery Additions Desulphurisation Upgrading
Source: IEA, Purvin & Gertz Inc.
Copyright IEA
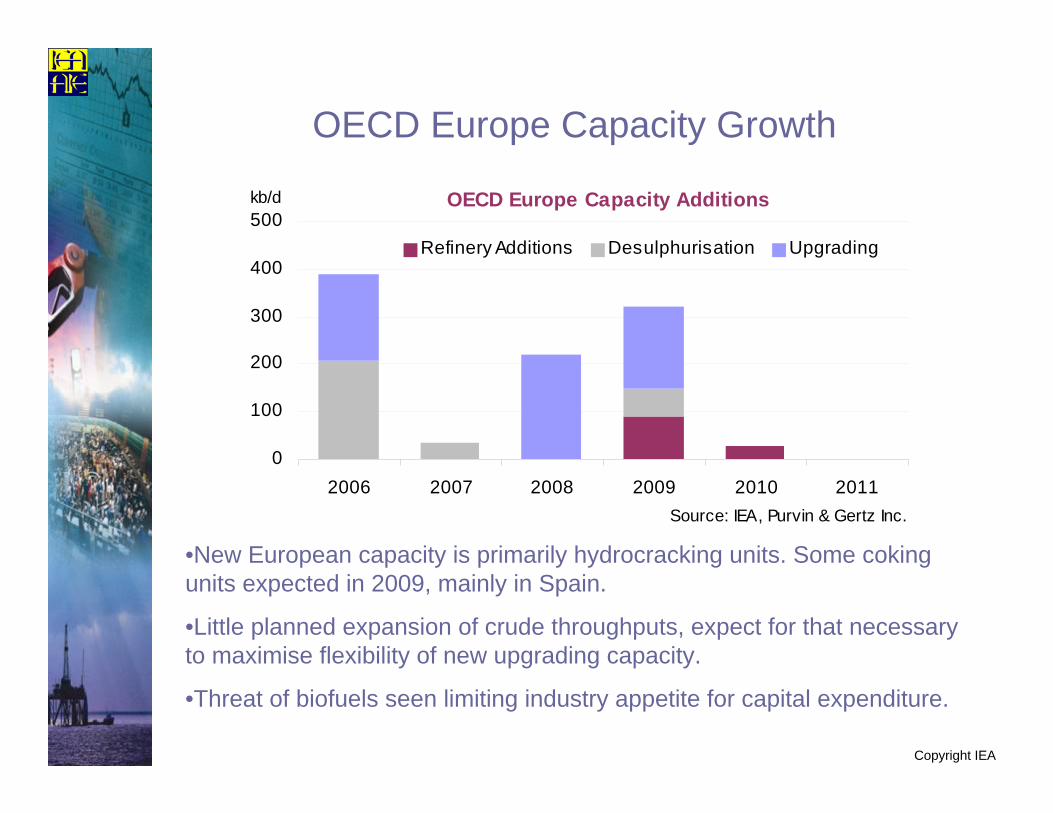
OECD Europe Capacity Growth
•New European capacity is primarily hydrocracking units. Some coking units expected in 2009, mainly in Spain.
•Little planned expansion of crude throughputs, expect for that necessary to maximise flexibility of new upgrading capacity.
•Threat of biofuels seen limiting industry appetite for capital expenditure.
OECD Europe Capacity Additions
0
100
200
300
400
500
2006 2007 2008 2009 2010 2011
kb/d
Refinery Additions Desulphurisation Upgrading
Source: IEA, Purvin & Gertz Inc.
Copyright IEA
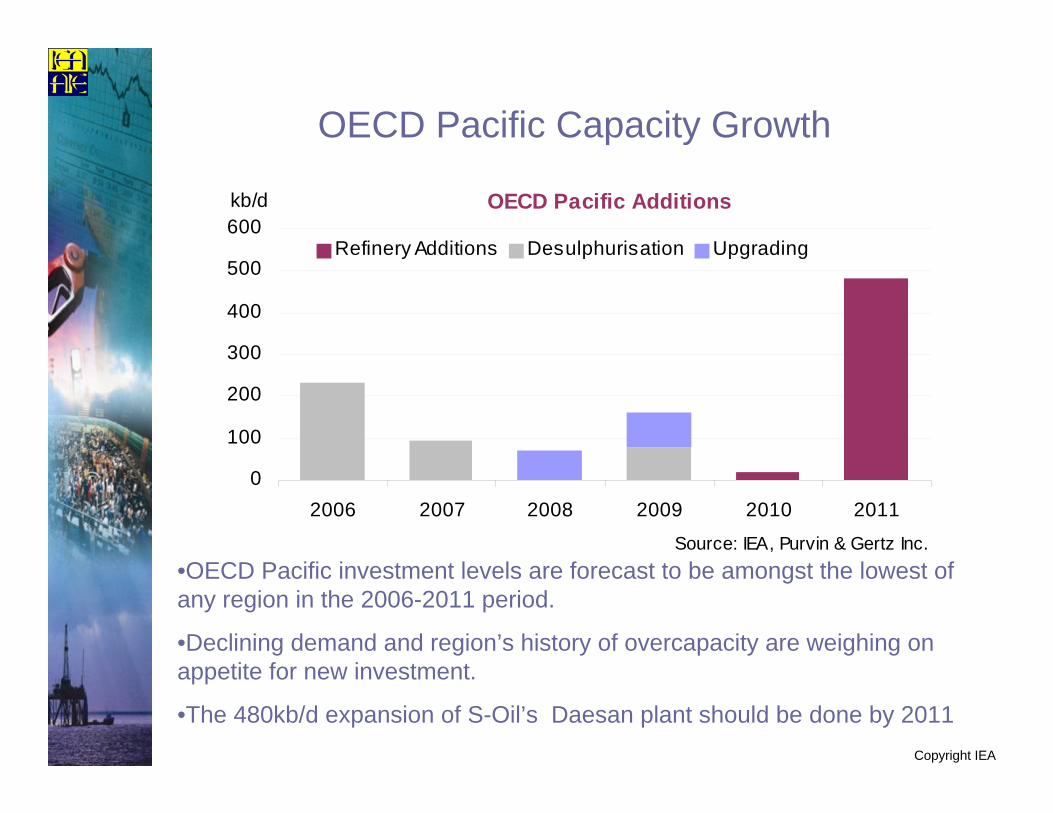
OECD Pacific Capacity Growth
•OECD Pacific investment levels are forecast to be amongst the lowest of any region in the 2006-2011 period.
•Declining demand and region’s history of overcapacity are weighing on appetite for new investment.
•The 480kb/d expansion of S-Oil’s Daesan plant should be done by 2011
OECD Pacific Additions
0
100
200
300
400
500
600
2006 2007 2008 2009 2010 2011
kb/d
Refinery Additions Desulphurisation Upgrading
Source: IEA, Purvin & Gertz Inc.

Copyright IEA
Middle East Capacity Growth
•Significant investment in new capacity will add 2.6mb/d by 2011. Several world-class refineries are expected to start in 2010-2011
•Saudi Arabia, Kuwait, Qatar and the UAE will account for most of the growth.
Middle East Capacity Additions
0
200
400
600800
1,000
1,200
1,400
2006 2007 2008 2009 2010 2011
kb/d Refinery Additions Desulphurisation Upgrading
Source: IEA, Purvin & Gertz Inc.

Copyright IEA
Chinese Capacity Growth
•Chinese capacity growth of 2.5mb/d is driven by Sinopec/ PetroChina
•New refinery additions dominate the growth but additional investment in upgrading and hydrotreating capacity should improve China’s ability to handle more sour, heavy crude
Chinese Capacity Additions
0
200
400
600
800
2006 2007 2008 2009 2010 2011
kb/d
Refinery Additions Desulphurisation Upgrading
Source: IEA, Purvin & Gertz Inc.

Copyright IEA
Other Asia Capacity Growth
•Growth of 2.1mb/d in other Asia is driven by India, which accounts for 1.66mb/d or roughly 80% of the total.
•New refinery expansions include the 600kb/d Jamnagar project which we conservatively forecast will be fully on-stream in 2010.
Other Asia Capacity Additions
0
200
400
600
800
2006 2007 2008 2009 2010 2011
kb/dRefinery Additions Desulphurisation Upgrading
Source: IEA, Purvin & Gertz Inc.