global economic prospects - world banksiteresources.worldbank.org/intgep2010/resources/... ·...
TRANSCRIPT
Global Economic Prospects Fiscal Headwinds and Recovery
Regional appendix: Latin America and the Caribbean
Summer 2010

© 2010 The International Bank for Reconstruction and Development / The World Bank
1818 H Street NW
Washington DC 20433
Telephone: 202-473-1000
Internet: www.worldbank.org
E-mail: [email protected]
All rights reserved
1 2 3 4 13 12 11 10
This volume is a product of the staff of the International Bank for Reconstruction and
Development / The World Bank. The findings, interpretations, and conclusions expressed in this
volume do not necessarily reflect the views of the Executive Directors of The World Bank or the
governments they represent. The World Bank does not guarantee the accuracy of the data
included in this work. The boundaries, colors, denominations, and other information shown on
any map in this work do not imply any judgement on the part of The World Bank concerning the
legal status of any territory or the endorsement or acceptance of such boundaries.
Rights and Permissions
The material in this publication is copyrighted. Copying and/or transmitting portions or all of this
work without permission may be a violation of applicable law. The International Bank for
Reconstruction and Development / The World Bank encourages dissemination of its work and
will normally grant permission to reproduce portions of the work promptly.
For permission to photocopy or reprint any part of this work, please send a request with complete
information to the Copyright Clearance Center Inc., 222 Rosewood Drive, Danvers, MA 01923,
USA; telephone: 978-750-8400; fax: 978-750-4470; Internet: www.copyright.com.
All other queries on rights and licenses, including subsidiary rights, should be addressed to the
Office of the Publisher, The World Bank, 1818 H Street NW, Washington, DC 20433, USA.
fax: 202-522-2422; e-mail: [email protected].

Global Economic Prospects Summer 2010 : Regional Annex
15
Latin American and the Caribbean
Recent developments
Countries in Latin America and Caribbean
entered a strong cyclical rebound during the
second half of 2009, benefitting from a robust
rebound in external demand, renewed capital
inflows, higher commodity prices, the turn in the
inventory cycle, and a boost to domestic demand
from substantial monetary and fiscal stimulus.
GDP in the region, after contracting by 2.3
percent in 2009, is projected to expand by 4.5,
4.1 and 4.2 percent over 2010 - 2012, slightly
below the average 5 percent recorded during the
boom period.
Financial conditions improved noticeably.
International capital flows to the region after
declining sharply in the first half of 2009, picked
up in the second half of that year and into 2010.
Overall, bond, bank and equity flows to Latin
American fell by 24.8 percent in 2009 to $130.3
billion. Reflecting gains already made, net
private inflows are expected to pick up to about
$156 billion in 2010, still some 6.2 percent lower
than in 2008 and 33 percent lower than in 2007
(Figure B3.1 and Table B3.1).
Economic activity in the region began
rebounding sharply in the second half of 2009,
with industrial production growing at a 10
percent annualized rate during the fourth quarter.
The pace remained relatively robust in the first
quarter at 6.5 percent, stepping down marginally
in selected economies. Excluding Chile from the
regional aggregate, industrial production
expanded at 9 percent the first quarter of this
year (Figure B3.2). In Chile, following the
earthquake, industrial production declined by 30
percent in the first quarter.
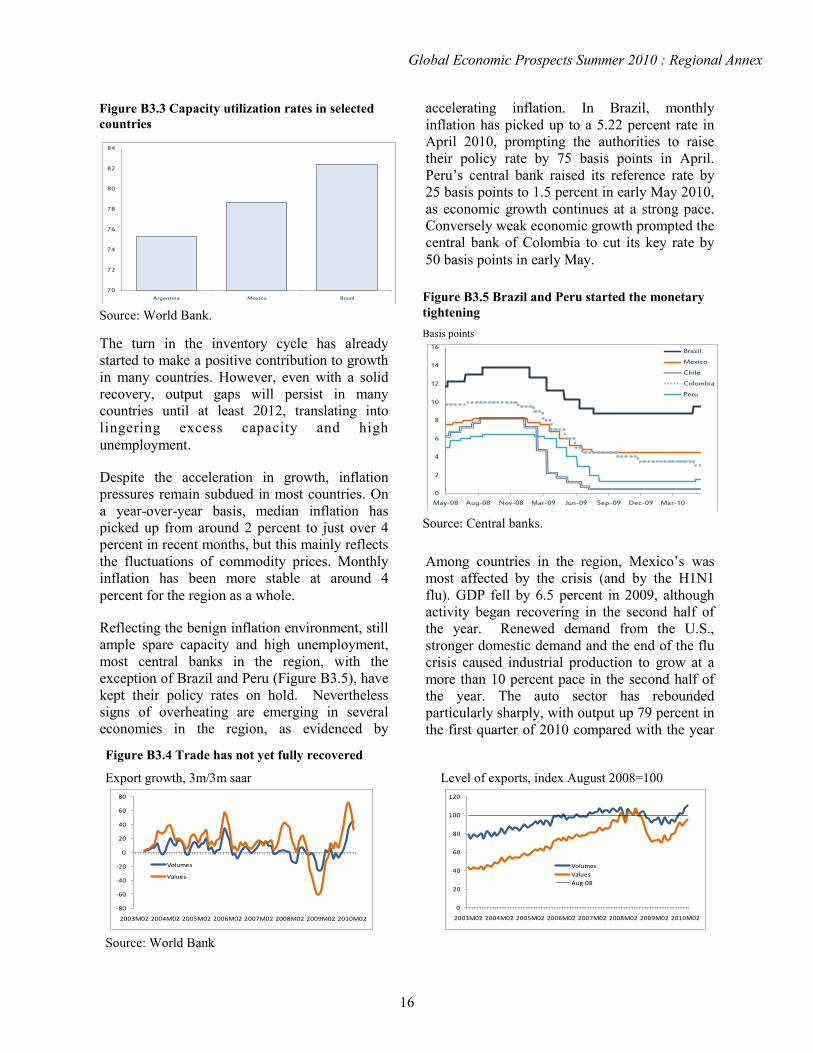
Despite the sharp bounce back in growth rates,
industrial production in the region remains
nearly 4 percent below its pre-crisis peak level.
Compared with the level of activity that would
have been expected had the crisis not intervened
there is even more slack, with 10 percent or
more in output gap4 in 3 of the 10 countries for
which monthly industrial production data is
available (Figure B3.3). The output gap also has
its reflection in labor markets. At its trough,
unemployment in the region had increased by 2
million, but has since declined by 1 million.
The recovery in regional industrial production
was due to both domestic demand and a global
recovery in trade. After falling sharply, both the
volume and value of regional exports have been
rebounding at rapid rates (Figure B3.4).
Nevertheless, the volume of exports is now only
10 percent higher than its August 2008 level and
because of lower commodity prices, the value of
trade remains 4.5 percent below its earlier peak.
Figure B3.1 Financial flows to Latin America and
Caribbean dropped markedly in 2009
Billion USD
Source: World Bank.
-50
0
50
100
150
200
250
300
350
2002 2003 2004 2005 2006 2007 2008 2009
Workers' remittances
Net debt flows
Net portfolio equity inflows
Net FDI inflows
Figure B3.2 Industrial production is slowing in
Latin America and the Caribbean
percent, 3m/3m saar
Source: World Bank
-60
-50
-40
-30
-20
-10
0
10
20
30
Jan-07 Jan-08 Jan-09 Jan-10
Brazil Argentina
Mexico Venezuela
Chile (earthquake effect)
Global Economic Prospects Summer 2010 : Regional Annex
16
The turn in the inventory cycle has already
started to make a positive contribution to growth
in many countries. However, even with a solid
recovery, output gaps will persist in many
countries until at least 2012, translating into
lingering excess capacity and high
unemployment.
Despite the acceleration in growth, inflation
pressures remain subdued in most countries. On
a year-over-year basis, median inflation has
picked up from around 2 percent to just over 4
percent in recent months, but this mainly reflects
the fluctuations of commodity prices. Monthly
inflation has been more stable at around 4
percent for the region as a whole.
Reflecting the benign inflation environment, still
ample spare capacity and high unemployment,
most central banks in the region, with the
exception of Brazil and Peru (Figure B3.5), have
kept their policy rates on hold. Nevertheless
signs of overheating are emerging in several
economies in the region, as evidenced by
accelerating inflation. In Brazil, monthly
inflation has picked up to a 5.22 percent rate in
April 2010, prompting the authorities to raise
their policy rate by 75 basis points in April.
Peru‘s central bank raised its reference rate by
25 basis points to 1.5 percent in early May 2010,
as economic growth continues at a strong pace.
Conversely weak economic growth prompted the
central bank of Colombia to cut its key rate by
50 basis points in early May.
Among countries in the region, Mexico‘s was
most affected by the crisis (and by the H1N1
flu). GDP fell by 6.5 percent in 2009, although
activity began recovering in the second half of
the year. Renewed demand from the U.S.,
stronger domestic demand and the end of the flu
crisis caused industrial production to grow at a
more than 10 percent pace in the second half of
the year. The auto sector has rebounded
particularly sharply, with output up 79 percent in
the first quarter of 2010 compared with the year
Figure B3.3 Capacity utilization rates in selected
countries
Source: World Bank.
70
72
74
76
78
80
82
84
Argentina Mexico Brazil
Figure B3.4 Trade has not yet fully recovered
Export growth, 3m/3m saar Level of exports, index August 2008=100
Source: World Bank
-80
-60
-40
-20
0
20
40
60
80
2003M02 2004M02 2005M02 2006M02 2007M02 2008M02 2009M02 2010M02
Volumes
Values
0
20
40
60
80
100
120
2003M02 2004M02 2005M02 2006M02 2007M02 2008M02 2009M02 2010M02
Volumes
Values
Aug-08
Figure B3.5 Brazil and Peru started the monetary
tightening
Basis points
Source: Central banks.
0
2
4
6
8
10
12
14
16
May-08 Aug-08 Nov-08 Mar-09 Jun-09 Sep-09 Dec-09 Mar-10
Brazil
Mexico
Chile
Colombia
Peru

Global Economic Prospects Summer 2010 : Regional Annex
17
before. Stronger industrial activity, up 5.4
percent year-on-year, fueled by strong external
demand, boosted GDP growth to 4.3 percent
year-on-year in the first quarter. While prospects
are better, unemployment in the United States
remains high (especially among the low-skilled
migrant population) and labor market conditions
weak. As a result, tourism and remittances,
which were down 15 percent in the first quarter
of 2010 from a year earlier, are projected to
remain weak – putting pressure both on foreign
currency earnings and the incomes of the poor.
Brazil managed to navigate the crisis relatively
well, with GDP declining by only 0.2 percent in
2009, in part because expansionary
macroeconomic policies were able to boost
domestic demand, contributing to rapid declines
in spare capacity (see above) and tighter labor
markets. Private consumption started the year
strongly, with retail sales volumes up an
impressive 14.7 percent year-on-year by March
up from 5 percent growth a year earlier.
However, rapid expansion in domestic demand
contributed to a buildup of inflationary pressures
that has prompted the monetary authorities to
start tightening policy (see Figure B3.5). Fiscal
policy has also moved to a tightening phase, the
IPI tax rebate has been partially called back and
reserve requirements were raised. Furthermore
the government has announced a modest R$7.8
billion (less than 0.3% of GDP) cut in 2010
budgeted discretionary expenditures, but there
are no indications yet that the large expansionary
impulse of public bank credit will be withdrawn.
The recession was relatively short-lived in Chile,
with GDP bouncing back at an annualized 6
percent in the second half of 2009, as stronger
domestic demand supported the manufacturing
and trade sectors. Overall, the economy
contracted 1.5 percent in the year, with falling
inventories subtracting 2.4 percentage points
from GDP. As noted the earthquake in February
has cut sharply into activity in the first quarter,
and it is unclear how quickly the economy will
bounce back. Prior to the earthquake, the
recovery remained strong with retail sales and
labor market developments pointing to a strong
economic rebound in 2010, boosted by
significant monetary stimulus. Reconstruction
efforts are expected to offset this negative effect,
such that growth for the remainder of the year
should be relatively robust.
Table B3.1 Net capital flows to Latin America and the Caribbean region
$ billions
Source: World Bank. Note: e = estimate; f = forecast.
2003 2004 2005 2006 2007 2008 2009e 2010f 2011f 2012f
Financial flows:
Net private and official inflows 62.2 57.2 84.6 70.0 232.3 173.2 130.3
Net private inflows (equity+debt) 57.4 67.3 115.8 90.1 233.1 166.5 115.4 156.2 160.1 171.8
..Net private inflows (% GDP) 3.0 3.1 4.4 2.9 6.4 4.0 3.0 3.5 3.2 3.3
Net equity inflows 46.5 65.1 84.1 83.3 139.0 115.3 108.9
..Net FDI inflows 43.2 65.7 71.9 72.1 109.4 125.0 70.8
..Net portfolio equity inflows 3.3 -0.6 12.2 11.3 29.6 -9.7 38.1
Net debt flows 15.7 -7.9 0.5 -13.3 93.3 57.9 21.4
..Official creditors 4.8 -10.1 -31.2 -20.1 -0.8 6.7 14.9
....World Bank -0.4 -1.0 -0.7 -3.4 -0.1 2.4 6.6
....IMF 5.6 -6.3 -27.6 -12.1 0.0 0.0 0.4
....Other official -0.4 -2.8 -2.9 -4.6 -0.7 4.3 7.9
..Private creditors 10.9 2.2 31.7 6.8 94.1 51.2 6.5
....Net M-L term debt flows 9.1 -0.8 16.0 3.6 46.9 47.8 16.1
......Bonds 11.0 -0.7 15.6 -16.5 8.6 -4.0 33.6
......Banks -1.4 0.0 0.6 20.6 38.3 51.3 -16.5
......Other private -0.5 -0.1 -0.2 -0.5 0.0 0.5 -1.0
....Net short-term debt flows 1.8 3.0 15.7 3.2 47.2 3.4 -9.6
Balancing item -35.7 -53.2 -84.3 -59.1 -105.5 -95.8 -81.2
Change in reserves (- = increase) -35.6 -25.4 -34.4 -55.5 -137.8 -45.2 -28.3
Memorandum items
Workers' remittances 36.6 43.3 50.1 59.0 63.0 64.0 57.0 60.0 64.0

Global Economic Prospects Summer 2010 : Regional Annex
18
In both Colombia and Peru, growth decelerated
significantly below potential on account of much
weaker domestic demand, a marked drawdown
in inventories, and, in the case of Colombia,
weak net export performance. Colombia‘s
exports rebounded in recent months, despite
continued loss of market share to Venezuela,
while revived investor confidence and stronger
commodity prices led to a 24 percent year-on-
year surge in FDI in the first quarter of 2010.
Venezuela experienced one of the sharpest
recessions in the region, contracting 3.3 percent
in 2009, with endemic high inflation, power
shortages and electricity rationing, restricted
access to foreign currency, and an unfriendly
policy mix towards the private sector, delaying
and weakening the recovery. Domestic demand
contracted sharply, down a dramatic 7.9 percent
in 2009, triggering a 20 percent contraction in
imports, helping net exports to contribute a
positive 4.6 percentage points to growth (even as
exports declined 6.6 percent). The economy
continues to contract in the first quarter of 2010,
down 5.8 percent (year-on-year) as both the oil
and non-oil sectors contracted by about 5
percent. To revive the economy, the government
devalued the official exchange rate, and
introduced a two tier exchange rate system, with
the rate set at 2.6 and 4.3 bolivars against the
USD from 2.147 in January 2010, as capital
flight intensified (FDI outflows amounted to
$3.1 billion in 2009). However the currency
continued to depreciate on the unregulated
markets reaching record 8.05 bolivars per USD
by early May.
Growth in the Caribbean slowed to 2 percent
while the Central American region, excluding
Mexico contracted by 0.5 percent in 2009, as
trade, tourism, FDI, and remittances were
affected by recession in their main economic
partners, in particular the United States and
Spain. Large decline in imports, on weak private
consumption and a plunge in investment, helped
limit the negative impact of lower exports from
the region. High unemployment domestically
together with lower remittances, played a pivotal
role in weakening private consumption.
Furthermore the impact of the expansionary
fiscal policy implemented by countries in the
region was more muted than in other developing
countries. On the supply side, unfavorable
weather conditions took a toll on agricultural
output in Central America, while construction
activity had also slowed markedly, undermining
growth in selected Central American economies.
Stagnant tourist sectors in many countries in the
Caribbean and Central America weakened the
contribution of the service sector to growth.
Major infrastructure projects linked to the
expansion of the Panama Canal helped Panama
avoid recession in 2009 despite the global
downturn in trade. In the Caribbean, Jamaica
experienced one of the deepest recessions, with
output down an estimated 2.7 percent in 2009,
mainly on account of a sharp compression in
export volumes, and a 9 percent decline in
remittances. In the Dominican Republic, weak
bank lending, relatively low fiscal spending and
revenues, high unemployment, and low exports,
tourism receipts and remittances limited growth
to 3.5 percent in 2009.
Medium-term outlook
After contracting 2.3 percent in 2009, output in
the region is forecasted to expand by 4.5 percent
in 2010, and by nearly 4.2 percent per annum
over the 2011-2012 period, slightly below the
average recorded in the boom period (Table
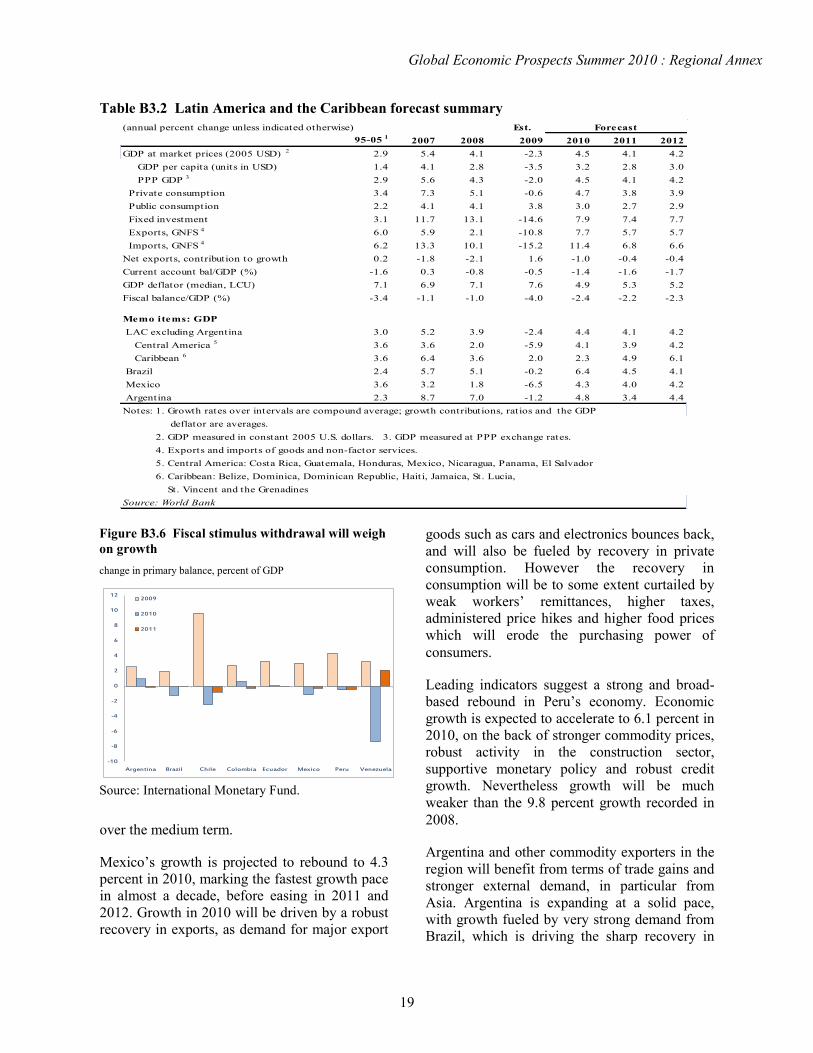
B3.2). Private consumption is expected to
rebound after contracting last year, supported by
the lagged effects of expansionary
macroeconomic policies, while the contribution
to growth from government spending will
weaken as policy stimuli are being withdrawn
(Figure B3.6) — even as 2010 is an election year
in many countries in the region. Stronger
demand should fuel a cyclical rebound in fixed
investment, but investment levels will remain
below pre-crisis levels over the forecast horizon
due to excess capacity.
Reflecting the gains already made, growth in
Brazil is expected to be particularly robust this
year, accelerating to 6.4 percent in 2010 on
account of strong commodity demand as well as
the lagged effects of expansionary demand
management policies but growth should slow
Global Economic Prospects Summer 2010 : Regional Annex
19
over the medium term.
Mexico‘s growth is projected to rebound to 4.3
percent in 2010, marking the fastest growth pace
in almost a decade, before easing in 2011 and
2012. Growth in 2010 will be driven by a robust
recovery in exports, as demand for major export
goods such as cars and electronics bounces back,
and will also be fueled by recovery in private
consumption. However the recovery in
consumption will be to some extent curtailed by
weak workers‘ remittances, higher taxes,
administered price hikes and higher food prices
which will erode the purchasing power of
consumers.
Leading indicators suggest a strong and broad-
based rebound in Peru‘s economy. Economic
growth is expected to accelerate to 6.1 percent in
2010, on the back of stronger commodity prices,
robust activity in the construction sector,
supportive monetary policy and robust credit
growth. Nevertheless growth will be much
weaker than the 9.8 percent growth recorded in
2008.
Argentina and other commodity exporters in the
region will benefit from terms of trade gains and
stronger external demand, in particular from
Asia. Argentina is expanding at a solid pace,
with growth fueled by very strong demand from
Brazil, which is driving the sharp recovery in
Est.
95-05 1
2007 2008 2009 2010 2011 2012
GDP at market prices (2005 USD) 2 2.9 5.4 4.1 -2.3 4.5 4.1 4.2
GDP per capita (units in USD) 1.4 4.1 2.8 -3.5 3.2 2.8 3.0
PPP GDP 3 2.9 5.6 4.3 -2.0 4.5 4.1 4.2
Private consumption 3.4 7.3 5.1 -0.6 4.7 3.8 3.9
Public consumption 2.2 4.1 4.1 3.8 3.0 2.7 2.9
Fixed investment 3.1 11.7 13.1 -14.6 7.9 7.4 7.7
Exports, GNFS 4 6.0 5.9 2.1 -10.8 7.7 5.7 5.7
Imports, GNFS 4 6.2 13.3 10.1 -15.2 11.4 6.8 6.6
Net exports, contribution to growth 0.2 -1.8 -2.1 1.6 -1.0 -0.4 -0.4
Current account bal/GDP (%) -1.6 0.3 -0.8 -0.5 -1.4 -1.6 -1.7
GDP deflator (median, LCU) 7.1 6.9 7.1 7.6 4.9 5.3 5.2
Fiscal balance/GDP (%) -3.4 -1.1 -1.0 -4.0 -2.4 -2.2 -2.3
Memo items: GDP
LAC excluding Argentina 3.0 5.2 3.9 -2.4 4.4 4.1 4.2
Central America 5
3.6 3.6 2.0 -5.9 4.1 3.9 4.2
Caribbean 6
3.6 6.4 3.6 2.0 2.3 4.9 6.1
Brazil 2.4 5.7 5.1 -0.2 6.4 4.5 4.1
Mexico 3.6 3.2 1.8 -6.5 4.3 4.0 4.2
Argentina 2.3 8.7 7.0 -1.2 4.8 3.4 4.4
deflator are averages.
4. Exports and imports of goods and non-factor services.
Source: World Bank
Notes: 1. Growth rates over intervals are compound average; growth contributions, ratios and the GDP
2. GDP measured in constant 2005 U.S. dollars. 3. GDP measured at PPP exchange rates.
(annual percent change unless indicated otherwise) Forecast
St. Vincent and the Grenadines
5. Central America: Costa Rica, Guatemala, Honduras, Mexico, Nicaragua, Panama, El Salvador
6. Caribbean: Belize, Dominica, Dominican Republic, Haiti, Jamaica, St. Lucia,
Table B3.2 Latin America and the Caribbean forecast summary
Figure B3.6 Fiscal stimulus withdrawal will weigh
on growth
change in primary balance, percent of GDP
Source: International Monetary Fund.
-10
-8
-6
-4
-2
0
2
4
6
8
10
12
Argentina Brazil Chile Colombia Ecuador Mexico Peru Venezuela
2009
2010
2011

Global Economic Prospects Summer 2010 : Regional Annex
20
Argentina‘s industrial sector, as well as by lax
monetary and fiscal policies. The normalization
of agricultural production after the 2008/09
drought will also support growth.
Growth in Chile will be weaker than previously
anticipated as a result of the massive earthquake
that hit the country in February 2010. In the near
term the disruptive impact of the earthquake on
economic activities will outweigh the positive
growth impact of the reconstruction efforts, with
growth in the first and second quarters estimated
to be 3 and 2 percentage points lower than
initially expected. However, from the second
half of 2010 onwards, the positive growth impact
of the massive reconstruction activity should
predominate and growth should register 4.2
percent for the year as a whole, compared to the
4.7 percent projected before the earthquake.
Growth will continue to accelerate over the
forecast horizon, as reconstruction efforts raise
productive capacity. Potential GDP has been
negatively affected given the extent of
destruction to the productive capacity, in
particular of the industrial base. According to
central bank estimates there was a loss of 3
percent of net capital stock, which implies a
negative potential GDP impact of between 1 and
1.5 percent.
In Colombia, the growth recovery will be more
subdued (Table B3.3), on account of a weaker
fiscal impulse and trade difficulties related to
loss of market share in Venezuela. Growth
should accelerate moderately to 2.8 percent in
2010, before accelerating further towards
potential growth into 2012. But the acceleration
in growth remains dependent on macroeconomic
stimulus.
Notwithstanding a strong cyclical rebound in the
region, Venezuela‘s economy will continue to
contract in 2010, the only economy in the region
besides Haiti to contract this year, as the non-
commodity tradable sectors continue to suffer
from an overvalued exchange rate, unproductive
investment and low productivity in non-tradables
while potential output continues to suffer from
private sector underinvestment. Although the
large devaluation of the currency in January
2010 has increased fiscal space and will ensure a
continuation of the lax fiscal policy, the long(er)
term growth impact is diminished by surging
inflation and declining economy wide
productivity. Furthermore, supply bottlenecks,
energy and water supply disruptions,
decelerating credit growth, and the (largely)
unfriendly policy mix will continue to
undermine growth over the forecast horizon,
with growth forecast to contract 2.9 percent in
2010, before returning to modest growth 1.4
percent in 2011. With investment falling 12.4
percent in 2009 the country‘s capital stock is
now significantly lower, with negative
implications for potential GDP and long term
growth.
Growth in the Caribbean economies will be
hindered by high unemployment and weak
private consumption in the United States and
other high-income countries that will affect
demand for tourism services, and weaken and
delay the recovery in remittances. Higher
commodity prices will affect growth in
commodity-importing countries in the region.
Growth in Dominican Republic will benefit from
the U.S. rebound, stronger external demand and
rising investment, while government
consumption will be supported by rising
revenues and multilateral support. In Jamaica the
recovery will remain anemic, with austerity
measures, still-weak domestic demand, and
alumina output well below potential
undermining the recovery. High government
borrowing on the domestic markets will crowd
out the private sector, undermining the recovery
further. Haiti‘s economy is projected to recover
over the forecast horizon, after contracting a
dramatic 8.5 percent in 2010 due to the
earthquake, boosted by reconstruction efforts
financed mostly by aid flows. Excluding Haiti,
growth in the Caribbean region will accelerate
modestly to 3.2 percent in 2010, from 2 percent
in 2009.
Central American economies (excluding
Mexico) will also lag in the recovery on weak
workers‘ remittances from the United States,
with economic growth projected at 2.7 percent in
2010. In these economies the scope for recovery

Global Economic Prospects Summer 2010 : Regional Annex
21
is also constrained by limited fiscal space to
implement counter-cyclical policies. A recovery
in agricultural and manufacturing exports will be
supportive of growth in many economies in the
region, as will growth in the service sector,
particularly back-office services. Improved
weather conditions and improved market access
to export markets like the EU, and selected
Asian markets will give a welcome boost to
agricultural exports in countries like Guatemala,
Nicaragua and Costa Rica. Meanwhile
manufactured goods exports will benefit from
stronger demand in the United States and in
Central America. In Panama growth will
accelerate, fueled by continued enlargement of
the Panama Canal, which will bolster the
contribution to growth from the construction and
service sectors.
As policy makers in the region begin tightening
monetary policy and interest rates rise, some
currencies will see appreciation pressures, which
could adversely affect external competitiveness.
Furthermore higher capital inflows in response
to higher interest rate differentials could lead to
excess credit expansion, complicating
policymakers‘ task of combating inflation, which
is already rising in some of the advanced
emerging economies.
Beyond 2010, growth in the region will likely
slow as the impact of the policy stimulus is
waning, while the inventory cycle‘s contribution
to growth turns negative and financial conditions
remain tight. Furthermore slower (quarterly)
growth in the United States in the second half of
the year, and lingering high unemployment will
undermine growth in Mexico, Central America
and the Caribbean, through trade, investment,
remittances and tourism linkages.
Risks
The possibility of a disruptive resolution of the
real or perceived lack of fiscal sustainability of a
number of high-income European (EU-5)
countries remains a significant risk for countries
in Latin America. Financial linkages with some
of these countries are extensive, with banks in
the EU-5 countries having been an important
source of capital for public and private sectors in
Latin America ($320bn or 8% of GDP). Spanish
banks own over 25% of bank capital in Mexico,
Chile, and Peru. To date, these banks have relied
mostly on local deposits rather than cross-border
flows for funding, which has proven to be a
source of resilience rather than weakness during
the global financial crisis.5 So far there have
been no significant hikes in credit default swaps
(CDS) for country sovereigns rated similarly as
heavily indebted European countries (Colombia,
Panama), and their CDS are much lower for the
same rating. Should a full-scale crisis emerge in
Europe, growth in Latin American and the
Caribbean could slow by 1.7 percent and output
to could be more than 4 percent lower in 2012.
In these circumstances, countries should place a
priority on ensuring that their domestic fiscal
houses are in order, both to ensure that markets
do not perceive them as lacking fiscal discipline
(something that has not happened as yet), but
also to ensure that they are in a position to react
counter-cyclically if needed.
Alternatively poor economic performance in
Europe if the sovereign debt crisis unfolds could
result in increased capital flows to successful
Latin American economies. This would put
additional pressure on currencies to appreciate,
hurting external competitiveness, and could lead
to imposition of capital controls that may have
longer term negative consequences for the
financial systems.
Outside of this major risk, the remaining risks
for the region are largely balanced, with the most
important downside risk relating to the strength
of the global recovery, and in particular the
turnaround in high-income (notably the U.S.)
countries. For tourism dependent economies the
main downside risk is that of a sluggish recovery
in labor markets and incomes in high-income
countries which will delay the recovery in
tourism revenues.
Among upside risks, the lagged effects of very
accommodative macroeconomic policies and
delays in withdrawing these stimuli could lead to
even stronger growth, and in some cases
overheating of economies. For commodity

Global Economic Prospects Summer 2010 : Regional Annex
22
exporting countries, a stronger-than-expected
global cyclical bounce back would translate into
even larger terms of trade gains and much
stronger external demand adding to the tenor of
the recovery. In such a scenario the risks to
inflation are on the upside, complicating
macroeconomic management.
Strong capital inflows could also pose additional
policy challenges for selected countries in the
region, that could lead to further currency
appreciation and reintroduction of capital
controls.
Est.
95-05 1
2007 2008 2009 2010 2011 2012
Argentina
Real GDP at market prices 2.3 8.7 7.0 -1.2 4.8 3.4 4.4
Current account bal/GDP (%) -0.2 2.8 2.4 2.6 2.4 1.9 1.4
Belize
Real GDP at market prices 5.6 1.2 3.8 -1.0 1.7 2.3 3.9
Current account bal/GDP (%) -12.1 -4.1 -11.2 -7.2 -8.5 -8.1 -7.4
Bolivia
Real GDP at market prices 3.8 0.0 6.1 3.3 4.2 4.1 4.2
Current account bal/GDP (%) -3.0 12.1 11.6 3.4 3.3 3.3 3.4
Brazil
Real GDP at market prices 2.4 5.7 5.1 -0.2 6.4 4.5 4.1
Current account bal/GDP (%) -2.0 0.1 -1.7 -1.6 -2.9 -2.9 -3.0
Chile
Real GDP at market prices 4.2 4.6 3.7 -1.5 4.2 5.6 5.4
Current account bal/GDP (%) -1.5 4.4 -1.5 2.6 -1.1 -1.5 -2.4
Colombia
Real GDP at market prices 2.4 7.5 2.4 0.4 2.8 3.7 4.2
Current account bal/GDP (%) -2.2 -2.8 -2.8 -1.8 -2.6 -2.1 -2.5
Costa Rica
Real GDP at market prices 4.5 7.9 2.8 -1.1 3.8 4.2 4.4
Current account bal/GDP (%) -4.0 -6.3 -9.2 -2.1 -3.9 -3.8 -3.3
Dominica
Real GDP at market prices 1.4 5.4 3.2 1.1 1.9 3.0 3.3
Current account bal/GDP (%) -19.4 -25.0 -32.3 -32.4 -28.8 -27.2 -25.7
Dominican Republic
Real GDP at market prices 5.2 8.5 5.3 3.5 4.0 5.3 6.7
Current account bal/GDP (%) -0.8 -5.3 -9.7 -4.9 -6.0 -5.2 -4.7
Ecuador
Real GDP at market prices 3.2 2.5 7.2 0.4 2.2 2.3 2.6
Current account bal/GDP (%) -1.4 3.6 2.3 -1.1 -0.4 -1.2 -2.1
El Salvador
Real GDP at market prices 2.7 4.7 2.5 -3.5 1.2 2.5 3.3
Current account bal/GDP (%) -2.5 -6.0 -7.6 -1.6 -2.7 -2.8 -3.4
Guatemala
Real GDP at market prices 3.5 6.3 3.3 0.6 2.0 2.8 3.5
Current account bal/GDP (%) -4.9 -5.2 -4.5 -0.6 -3.1 -3.8 -4.1
Guyana
Real GDP at market prices 1.7 7.0 2.0 3.1 3.5 3.8 4.2
Current account bal/GDP (%) -9.4 -11.1 -13.2 -8.4 -10.9 -9.9 -8.0
Honduras
Real GDP at market prices 3.8 6.3 4.0 -1.9 2.1 2.8 4.0
Current account bal/GDP (%) -6.7 -10.4 -13.2 -3.2 -5.8 -5.9 -6.1
Haiti
Real GDP at market prices 0.9 3.4 1.3 2.9 -8.5 9.6 9.1
Current account bal/GDP (%) -3.7 -5.6 -10.2 -4.8 -9.5 -6.6 -6.4
Jamaica
Real GDP at market prices 0.8 1.4 -0.9 -2.7 0.3 2.2 3.0
Current account bal/GDP (%) -5.5 -15.6 -20.0 -7.8 -9.3 -7.8 -7.2
(annual percent change unless indicated otherwise) Forecast
Table B3.3 Latin America and the Caribbean country forecasts

Global Economic Prospects Summer 2010 : Regional Annex
23
Est.
95-05 1
2007 2008 2009 2010 2011 2012
Mexico
Real GDP at market prices 3.6 3.2 1.8 -6.5 4.3 4.0 4.2
Current account bal/GDP (%) -1.9 -0.8 -1.5 -0.6 -0.9 -1.2 -1.4
Nicaragua
Real GDP at market prices 4.1 3.1 2.8 -1.5 1.7 2.3 3.6
Current account bal/GDP (%) -20.2 -17.7 -23.8 -13.0 -18.1 -16.9 -17.3
Panama
Real GDP at market prices 4.5 11.5 9.2 2.2 4.5 6.1 6.5
Current account bal/GDP (%) -5.3 -7.2 -11.5 -0.5 -8.4 -8.6 -7.2
Peru
Real GDP at market prices 3.3 8.9 9.8 0.9 6.1 5.6 6.2
Current account bal/GDP (%) -3.3 1.4 -3.7 0.2 -0.8 -1.0 -1.9
Paraguay
Real GDP at market prices 1.2 6.8 5.8 -3.8 5.1 4.4 4.7
Current account bal/GDP (%) -1.5 1.4 -2.9 -1.3 -2.3 -1.2 -0.6
St. Lucia
Real GDP at market prices 2.9 1.5 0.7 -5.2 1.1 2.7 3.7
Current account bal/GDP (%) -13.6 -31.4 -31.0 -19.9 -18.1 -17.5 -17.7
St. Vincent and the Grenadines
Real GDP at market prices 4.2 7.7 0.9 -1.1 2.1 3.9 4.2
Current account bal/GDP (%) -18.3 -34.2 -33.8 -29.0 -30.9 -29.3 -26.8
Uruguay
Real GDP at market prices 1.5 7.5 8.5 2.9 4.6 4.1 4.0
Current account bal/GDP (%) -0.9 -0.9 -4.8 0.8 -1.5 -1.4 -1.2
Venezuela, RB
Real GDP at market prices 1.6 8.4 4.8 -3.3 -2.9 1.4 2.7
Current account bal/GDP (%) 7.5 7.9 11.8 2.3 7.0 5.8 4.9
deflator are averages.
World Bank forecasts are frequently updated based on new information and changing (global) circumstances.
Consequently, projections presented here may differ from those contained in other Bank documents,
even if basic assessments of countries’ prospects do not significantly differ at any given moment in time.
Source: World Bank
2. Barbados, Cuba, Grenada, Suriname are not forecast owing to data limitations.
Notes: 1. Growth rates over intervals are compound average; growth contributions, ratios and the GDP
(annual percent change unless indicated otherwise) Forecast