global ex us pe/vc benchmark commentary - · pdf fileglobal ex us pe/vc benchmark commentary...
TRANSCRIPT

Global ex US PE / VC Benchmark CommentaryQuarter Ending September 30, 2015
© 2016 Cambridge Associates LLC
www.CambridgeAssociates.com
OverviewThird quarter 2015 performance saw returns drop into negative terri-tory. The Cambridge Associates LLC Global ex US Developed Markets Private Equity and Venture Capital Index returned -0.6%, and the Cambridge Associates LLC Emerging Markets Private Equity and Venture Capital Index fell to -4.8%. Exchange rates between US dollars and euros were fairly stable, while the dollar strengthened a bit against the UK pound; public equity markets were volatile and down signifi-cantly. In both the public and private indexes, the emerging markets underperformed the developed markets. Both the developed and emerging markets private indexes have beaten the public indexes over the long term.
Performance for the Cambridge Associates LLC Global ex US Developed Markets and Emerging Markets PE/VC indexes is derived from data compiled from institutional quality funds raised between 1986 and 2015. There are nearly 780 funds in the developed markets index and 560 in the emerging markets index. Funds in the global ex US developed markets PE/VC index primarily invest in companies in Europe, but occasionally make investments in US companies as well.
| 2
Third Quarter 2015 Highlights � The developed markets PE/VC index outperformed its comparable
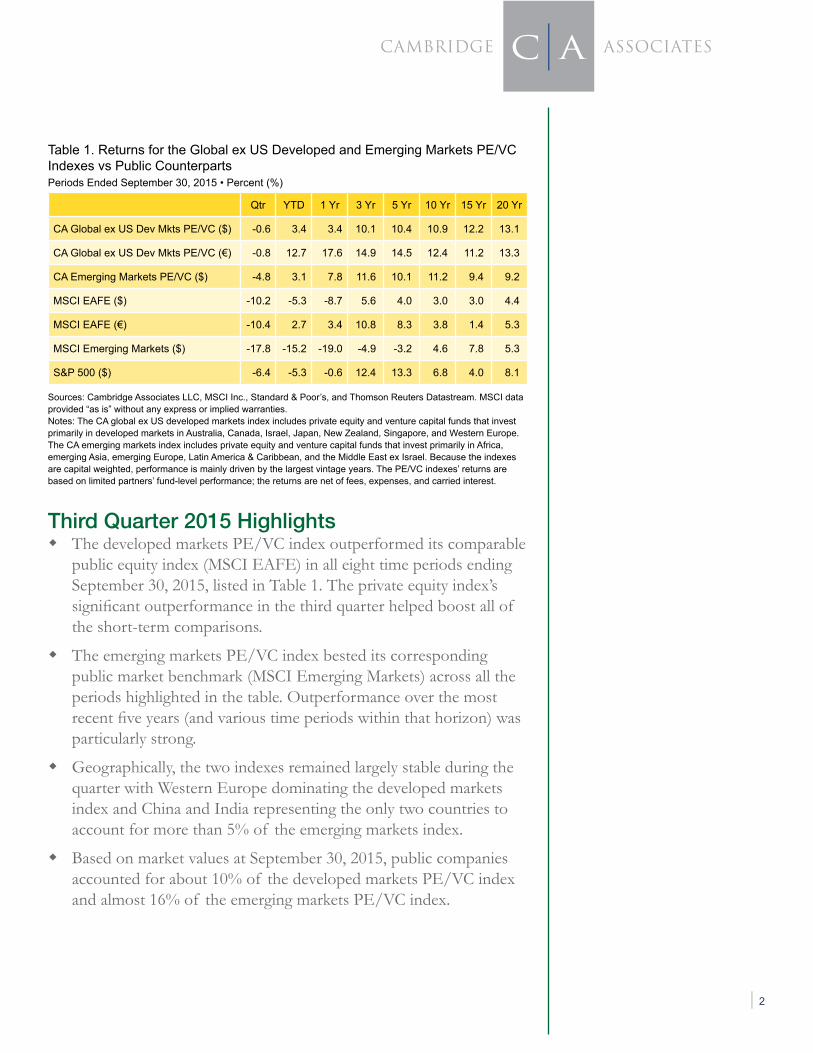
public equity index (MSCI EAFE) in all eight time periods ending September 30, 2015, listed in Table 1. The private equity index’s significant outperformance in the third quarter helped boost all of the short-term comparisons.
� The emerging markets PE/VC index bested its corresponding public market benchmark (MSCI Emerging Markets) across all the periods highlighted in the table. Outperformance over the most recent five years (and various time periods within that horizon) was particularly strong.
� Geographically, the two indexes remained largely stable during the quarter with Western Europe dominating the developed markets index and China and India representing the only two countries to account for more than 5% of the emerging markets index.
� Based on market values at September 30, 2015, public companies accounted for about 10% of the developed markets PE/VC index and almost 16% of the emerging markets PE/VC index.
Qtr YTD 1 Yr 3 Yr 5 Yr 10 Yr 15 Yr 20 Yr
CA Global ex US Dev Mkts PE/VC ($) -0.6 3.4 3.4 10.1 10.4 10.9 12.2 13.1
CA Global ex US Dev Mkts PE/VC (€) -0.8 12.7 17.6 14.9 14.5 12.4 11.2 13.3
CA Emerging Markets PE/VC ($) -4.8 3.1 7.8 11.6 10.1 11.2 9.4 9.2
MSCI EAFE ($) -10.2 -5.3 -8.7 5.6 4.0 3.0 3.0 4.4
MSCI EAFE (€) -10.4 2.7 3.4 10.8 8.3 3.8 1.4 5.3
MSCI Emerging Markets ($) -17.8 -15.2 -19.0 -4.9 -3.2 4.6 7.8 5.3
S&P 500 ($) -6.4 -5.3 -0.6 12.4 13.3 6.8 4.0 8.1
Table 1. Returns for the Global ex US Developed and Emerging Markets PE/VC Indexes vs Public Counterparts Periods Ended September 30, 2015 • Percent (%)
Sources: Cambridge Associates LLC, MSCI Inc., Standard & Poor’s, and Thomson Reuters Datastream. MSCI data provided “as is” without any express or implied warranties. Notes: The CA global ex US developed markets index includes private equity and venture capital funds that invest primarily in developed markets in Australia, Canada, Israel, Japan, New Zealand, Singapore, and Western Europe. The CA emerging markets index includes private equity and venture capital funds that invest primarily in Africa, emerging Asia, emerging Europe, Latin America & Caribbean, and the Middle East ex Israel. Because the indexes are capital weighted, performance is mainly driven by the largest vintage years. The PE/VC indexes’ returns are based on limited partners’ fund-level performance; the returns are net of fees, expenses, and carried interest.
| 3
Global ex US Developed Markets Private Equity and Venture Capital Performance Insights
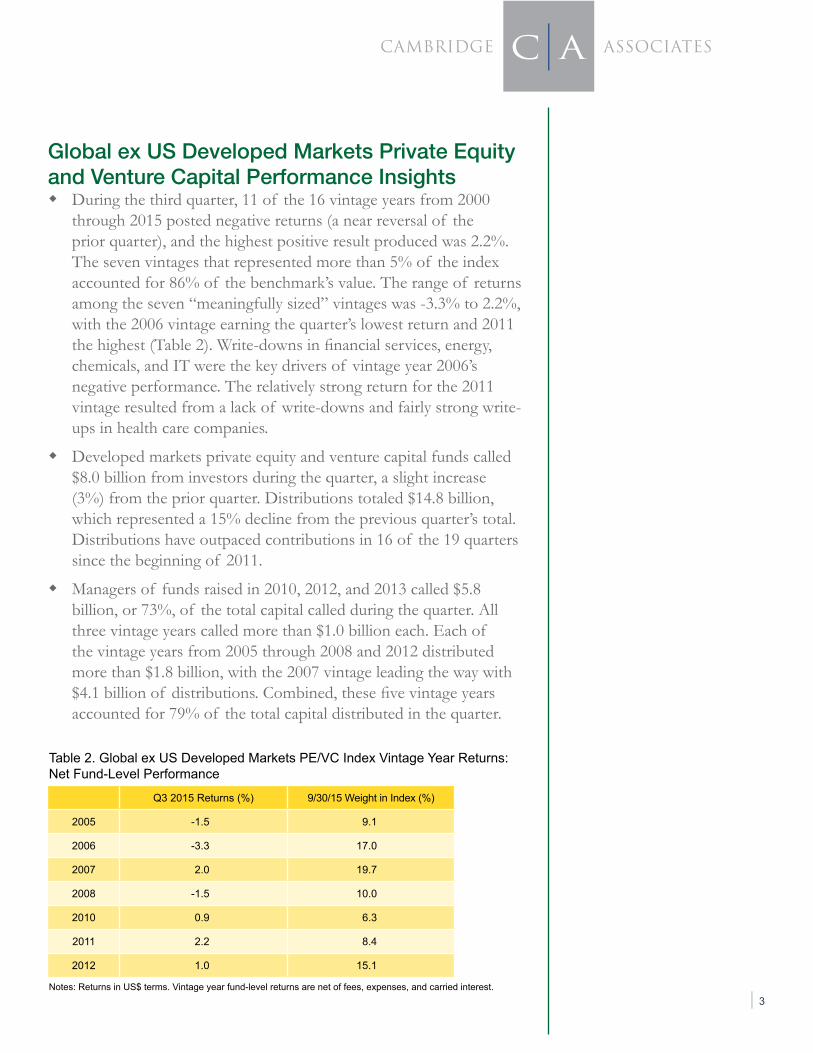
� During the third quarter, 11 of the 16 vintage years from 2000 through 2015 posted negative returns (a near reversal of the prior quarter), and the highest positive result produced was 2.2%. The seven vintages that represented more than 5% of the index accounted for 86% of the benchmark’s value. The range of returns among the seven “meaningfully sized” vintages was -3.3% to 2.2%, with the 2006 vintage earning the quarter’s lowest return and 2011 the highest (Table 2). Write-downs in financial services, energy, chemicals, and IT were the key drivers of vintage year 2006’s negative performance. The relatively strong return for the 2011 vintage resulted from a lack of write-downs and fairly strong write-ups in health care companies.
� Developed markets private equity and venture capital funds called $8.0 billion from investors during the quarter, a slight increase (3%) from the prior quarter. Distributions totaled $14.8 billion, which represented a 15% decline from the previous quarter’s total. Distributions have outpaced contributions in 16 of the 19 quarters since the beginning of 2011.
� Managers of funds raised in 2010, 2012, and 2013 called $5.8 billion, or 73%, of the total capital called during the quarter. All three vintage years called more than $1.0 billion each. Each of the vintage years from 2005 through 2008 and 2012 distributed more than $1.8 billion, with the 2007 vintage leading the way with $4.1 billion of distributions. Combined, these five vintage years accounted for 79% of the total capital distributed in the quarter.
Table 2. Global ex US Developed Markets PE/VC Index Vintage Year Returns: Net Fund-Level Performance
Notes: Returns in US$ terms. Vintage year fund-level returns are net of fees, expenses, and carried interest.
Q3 2015 Returns (%) 9/30/15 Weight in Index (%)
2005 -1.5 9.1
2006 -3.3 17.0
2007 2.0 19.7
2008 -1.5 10.0
2010 0.9 6.3
2011 2.2 8.4
2012 1.0 15.1
| 4
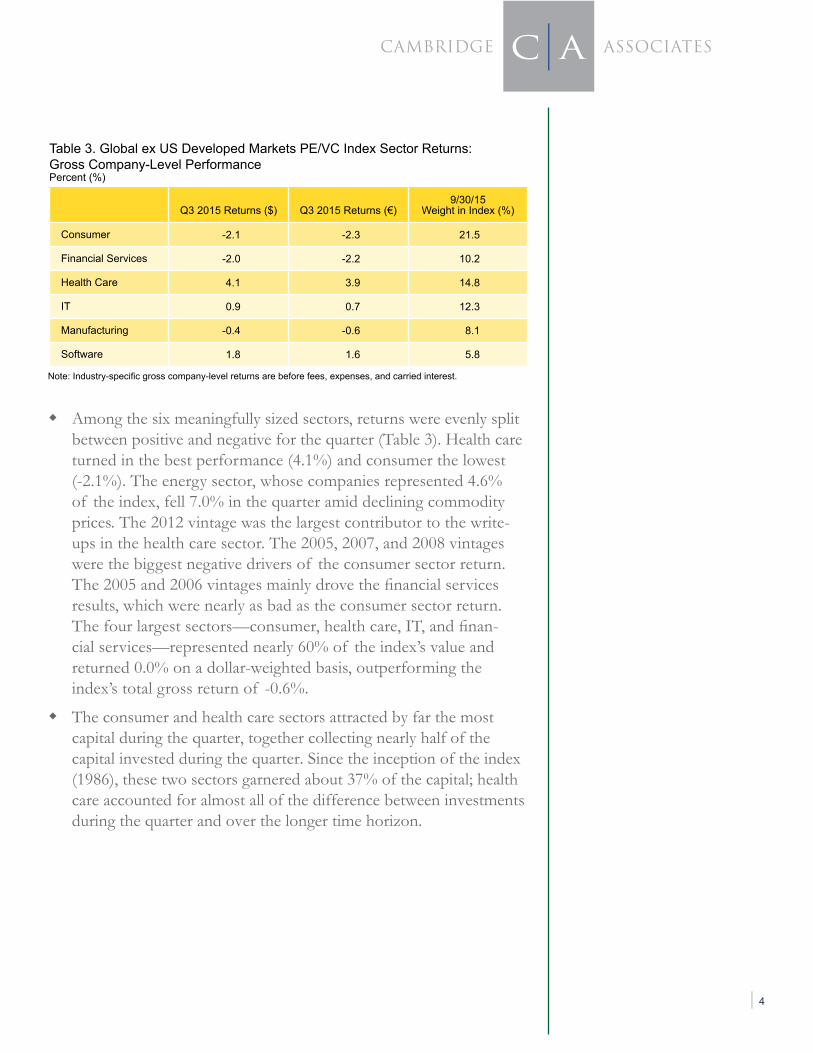
� Among the six meaningfully sized sectors, returns were evenly split between positive and negative for the quarter (Table 3). Health care turned in the best performance (4.1%) and consumer the lowest (-2.1%). The energy sector, whose companies represented 4.6% of the index, fell 7.0% in the quarter amid declining commodity prices. The 2012 vintage was the largest contributor to the write-ups in the health care sector. The 2005, 2007, and 2008 vintages were the biggest negative drivers of the consumer sector return. The 2005 and 2006 vintages mainly drove the financial services results, which were nearly as bad as the consumer sector return. The four largest sectors—consumer, health care, IT, and finan-cial services—represented nearly 60% of the index’s value and returned 0.0% on a dollar-weighted basis, outperforming the index’s total gross return of -0.6%.
� The consumer and health care sectors attracted by far the most capital during the quarter, together collecting nearly half of the capital invested during the quarter. Since the inception of the index (1986), these two sectors garnered about 37% of the capital; health care accounted for almost all of the difference between investments during the quarter and over the longer time horizon.
Q3 2015 Returns ($) Q3 2015 Returns (€)9/30/15
Weight in Index (%)
Consumer -2.1 -2.3 21.5
Financial Services -2.0 -2.2 10.2
Health Care 4.1 3.9 14.8
IT 0.9 0.7 12.3
Manufacturing -0.4 -0.6 8.1
Software 1.8 1.6 5.8
Note: Industry-specific gross company-level returns are before fees, expenses, and carried interest.
Table 3. Global ex US Developed Markets PE/VC Index Sector Returns: Gross Company-Level PerformancePercent (%)

| 5
� Four of the five countries representing the bulk of the index earned positive returns during the third quarter (Table 4). Companies in France and Germany produced the best results for the quarter, while those in the United States earned the lowest among the top five countries. Other countries with negative returns for the quarter included Australia and Canada, which combined represented about 5% of the index.
� Companies in France, Germany, the United States, and the United Kingdom attracted 48% of the capital invested during the quarter, about 9% less than the long-term norm for the various countries; the United Kingdom garnered significantly less than the historical norm.
Table 4. Global ex US Developed Markets PE/VC Index Regional Returns: Gross Company-Level PerformancePercent (%)
Note: Geographic region–specific gross company-level returns are before fees, expenses, and carried interest.
Q3 2015 Returns ($) Q3 2015 Returns (€)9/30/15
Weight in Index (%)
France 2.2 2.0 7.2
Germany 2.0 1.8 9.9
Sweden 1.4 1.2 6.8
United Kingdom 0.1 -0.1 23.5
United States -3.6 -3.8 17.8

| 6
Emerging Markets Private Equity Performance Insights
� In many respects, the third quarter was quite different than its prede-cessor. The number of key vintage years increased to eight, 2005–12, and as a group they represented 91% of the emerging markets index’s value (Table 5). All vintages from 2004 through 2013 earned negative returns for the quarter, ranging from -12.5% to -1.4%, which was the opposite of the second quarter’s results. Among the large vintages, similar to prior quarters, funds raised in 2011 posted the quarter’s best return, although still negative. The 2012 vintage joined the ranks of the meaningfully sized, finally bumping over the 5% index weight threshold. The poor performance of the third quarter was driven by write-downs in nearly all sectors in the index, with significant decreases in consumer, IT, and manufacturing. Funds raised in 2006 suffered the most from the declines of those three sectors. Manufacturing write-downs in 2011 were nearly offset by write-ups in IT, health care, and financial services. The 2005 vintage performed the worst out of the group with all sectors expe-riencing write-downs, most notably in IT, manufacturing, and energy.
� During third quarter 2015, emerging markets private equity and venture capital funds called $3.7 billion from investors. Capital call activity during 2015 was 28% slower than it was for the first nine months of last year. Distributions totaled $4.0 billion, representing a 40% drop from the previous quarter’s total. Distributions during the first nine months of 2015 were about 3% lower than the same period in 2014, which was a record year for contributions and distributions. Since the inception of the index in 1986, quarterly distributions outpaced contributions in only 12% of the quarters.
Q3 2015 Returns (%) 9/30/15 Weight in Index (%)
2005 -12.5 5.5
2006 -7.6 11.0
2007 -4.7 22.6
2008 -4.0 13.0
2009 -5.5 6.2
2010 -4.0 12.0
2011 -1.4 14.8
2012 -5.2 5.7
Table 5. Emerging Markets PE/VC Index Vintage Year Returns: Net Fund-Level Performance
Notes: Returns in US$ terms. Vintage year fund-level returns are net of fees, expenses, and carried interest.

| 7
� Managers of funds raised from 2010 through 2014 called $3.3 billion, or 88% of the total for the quarter; all five vintages each called at least $400 million, led by the 2013 funds that called more than $900 million. On the distributions front, managers of funds raised in 2005–08 and 2010 distributed $3.2 billion, or 79%, of the total. The 2007 funds alone distributed almost $1 billion.
� All six of the meaningfully sized sectors posted negative returns for the quarter (Table 6). Health care earned the best return at -1.1%, while manufacturing earned the lowest return at -11.8% following its strong performance in the second quarter. Consumer, IT, and manufacturing write-downs accounted for 57% of the total valuation change for the quarter. Health care valuations changed the least out of the six meaningfully sized sectors; 2011 vintage write-ups nearly offset the significant write-downs for vintages 2005 and 2008. Write-downs in electronics companies were concentrated in vintages 2006 through 2008.
� On a gross, dollar-weighted basis, the six largest sectors by market value returned -5.0% during the quarter, slightly outperforming the -5.2% return for all companies.
� Financial services, IT, and software companies garnered about 56% of the capital invested during the quarter, with financial services alone attracting 25%. Over the long term, managers in the emerging markets index have allocated almost 75% of their capital to six sectors: consumer, manufacturing, IT, financial services, health care, and media.
Table 6. Emerging Markets PE/VC Index Sector Returns: Gross Company-Level Performance
Notes: Returns in US$ terms. Industry-specific gross company-level returns are before fees, expenses, and carried interest.
Q3 2015 Returns (%) 9/30/15 Weight in Index (%)
Consumer -4.7 21.2
Electronics -4.0 8.6
Financial Services -4.6 9.7
Health Care -1.1 10.6
IT -4.5 16.7
Manufacturing -11.8 9.4
| 8
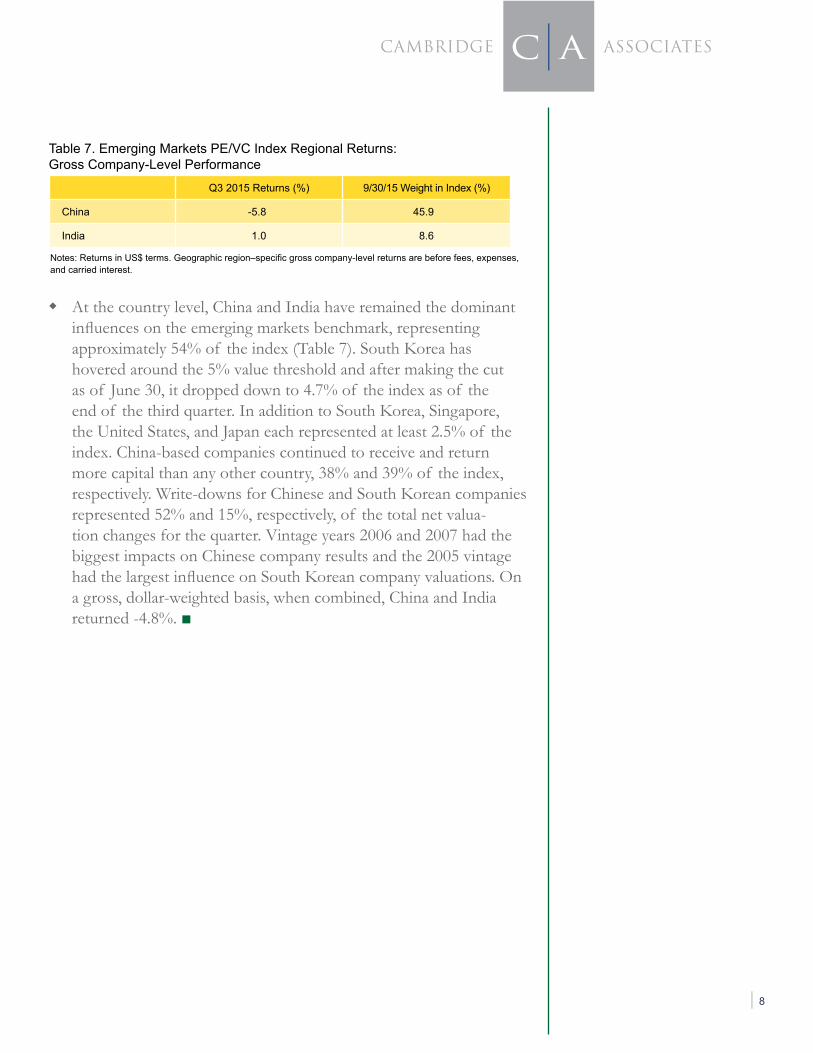
� At the country level, China and India have remained the dominant influences on the emerging markets benchmark, representing approximately 54% of the index (Table 7). South Korea has hovered around the 5% value threshold and after making the cut as of June 30, it dropped down to 4.7% of the index as of the end of the third quarter. In addition to South Korea, Singapore, the United States, and Japan each represented at least 2.5% of the index. China-based companies continued to receive and return more capital than any other country, 38% and 39% of the index, respectively. Write-downs for Chinese and South Korean companies represented 52% and 15%, respectively, of the total net valua-tion changes for the quarter. Vintage years 2006 and 2007 had the biggest impacts on Chinese company results and the 2005 vintage had the largest influence on South Korean company valuations. On a gross, dollar-weighted basis, when combined, China and India returned -4.8%. ■
Table 7. Emerging Markets PE/VC Index Regional Returns: Gross Company-Level Performance
Notes: Returns in US$ terms. Geographic region–specific gross company-level returns are before fees, expenses, and carried interest.
Q3 2015 Returns (%) 9/30/15 Weight in Index (%)
China -5.8 45.9
India 1.0 8.6
| 9
About the Cambridge Associates LLC IndexesCambridge Associates derives its Global ex US Developed Markets Private Equity and Venture Capital Index from the financial information contained in its propri-etary database of global ex US private equity and venture capital funds. As of September 30, 2015, the database comprised 777 global ex US developed markets private equity and venture capital funds formed from 1986 to 2015 with a value of about $258 billion. Ten years ago, as of September 30, 2005, the benchmark index included 386 global ex US developed markets funds, whose value was roughly $81 billion.
Cambridge Associates derives its Emerging Markets Private Equity and Venture Capital Index from the financial information contained in its proprietary database of global ex US private equity and venture capital funds. As of September 30, 2015, the database comprised 560 emerging markets funds formed from 1986 to 2015 with a value of $151 billion. Ten years ago, as of September 30, 2005, the bench-mark index included 229 emerging markets funds, whose value was $15 billion.
The pooled returns represent the net periodic rates of return calculated on the aggregate of all cash flows and market values as reported to Cambridge Associates by the funds’ general partners in their quarterly and annual audited financial reports. These returns are net of management fees, expenses, and performance fees that take the form of a carried interest.
About the Public IndexesThe MSCI EAFE Index is a free float-adjusted market capitalization–weighted index that is designed to measure large- and mid-cap equity performance of developed markets, excluding Canada and the United States. As of February 2016 the MSCI EAFE Index consisted of the following 21 developed markets country indexes: Australia, Austria, Belgium, Denmark, Finland, France, Germany, Hong Kong, Ireland, Israel, Italy, Japan, the Netherlands, New Zealand, Norway, Portugal, Singapore, Spain, Sweden, Switzerland, and the United Kingdom.
The MSCI Emerging Markets Index is a free float-adjusted market capitalization–weighted index that is designed to measure large- and mid-cap equity performance of emerging markets. As of February 2016, the MSCI Emerging Markets Index includes 23 emerging markets country indexes: Brazil, Chile, China, Colombia, Czech Republic, Egypt, Greece, Hungary, India, Indonesia, Korea, Malaysia, Mexico, Peru, the Philippines, Poland, Russia, Qatar, South Africa, Taiwan, Thailand, Turkey, and the United Arab Emirates.
The Standard & Poor’s 500 Composite Stock Price Index is a capitalization-weighted index of 500 stocks intended to be a representative sample of leading companies in leading industries within the US economy. Stocks in the index are chosen for market size, liquidity, and industry group representation.
| 10
Copyright © 2016 by Cambridge Associates LLC. All rights reserved.
This report may not be displayed, reproduced, distributed, transmitted, or used to create derivative works in any form, in whole or in portion, by any means, without written permission from Cambridge Associates LLC (“CA”). Copying of this publication is a violation of US and global copyright laws (e.g., 17 U.S.C. 101 et seq.). Violators of this copyright may be subject to liability for substantial monetary damages. The information and material published in this report is nontransferable. Therefore, recipients may not disclose any information or material derived from this report to third parties, or use information or material from this report, without prior written authorization. This report is provided for informational purposes only. The information presented is not intended to be investment advice. Any references to specific investments are for illustrative purposes only. The information herein does not constitute a personal recommendation or take into account the particular investment objectives, financial situations, or needs of individual clients. This research is not an offer to sell or the solicitation of an offer to buy any security in any jurisdiction. Some of the data contained herein or on which the research is based is current public information that CA considers reliable, but CA does not represent it as accurate or complete, and it should not be relied on as such. Nothing contained in this report should be construed as the provision of tax or legal advice. Past performance is not indicative of future performance. Broad-based securities indexes are unmanaged and are not subject to fees and expenses typically associated with managed accounts or investment funds. Investments cannot be made directly in an index. Any information or opinions provided in this report are as of the date of the report, and CA is under no obligation to update the information or communicate that any updates have been made. Information contained herein may have been provided by third parties, including investment firms providing information on returns and assets under management, and may not have been independently verified.
Cambridge Associates, LLC is a Massachusetts limited liability company with offices in Arlington, VA; Boston, MA; Dallas, TX; and Menlo Park, CA. Cambridge Associates Fiduciary Trust, LLC is a New Hampshire limited liability company chartered to serve as a non-depository trust company, and is a wholly-owned subsidiary of Cambridge Associates, LLC. Cambridge Associates Limited is registered as a limited company in England and Wales No. 06135829 and is authorised and regulated by the Financial Conduct Authority in the conduct of Investment Business. Cambridge Associates Limited, LLC is a Massachusetts limited liability company with a branch office in Sydney, Australia (ARBN 109 366 654). Cambridge Associates Asia Pte Ltd is a Singapore corporation (Registration No. 200101063G). Cambridge Associates Investment Consultancy (Beijing) Ltd is a wholly owned subsidiary of Cambridge Associates, LLC and is registered with the Beijing Administration for Industry and Commerce (Registration No. 110000450174972).