global fuel oil market overview - platts · global fuel oil market overview ... the american shale...
TRANSCRIPT
© 2013 Platts, McGraw Hill Financial. All rights reserved.
Global Fuel Oil Market Overview
Sharmilpal Kaur, Associate Editorial Director June 11, 2013
Global fuel oil market overview: Is the market bottoming out?
• Broad-based oil outlook • Changing crude oil flows – what do shifting
heavy/light crude oil dynamics mean for the residual fuel oil market?
• Shifting refining dynamics globally and how they affect demand and supply fundamentals
• Key emerging concerns in 2013 and beyond
2

New crude trade flows govern markets
3
Source:IEA
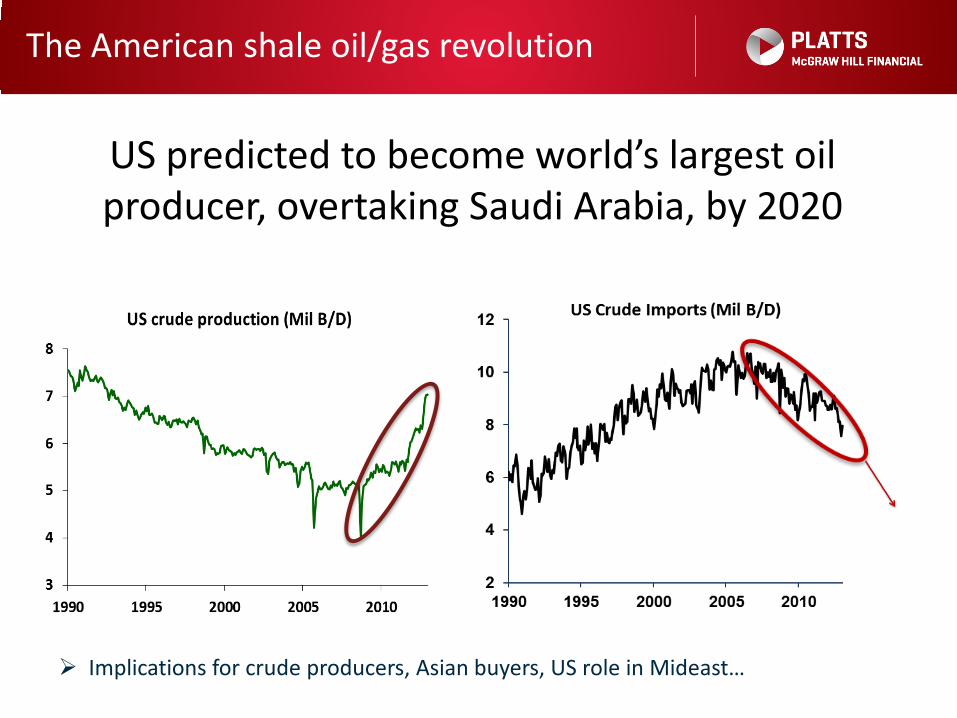
The American shale oil/gas revolution
US predicted to become world’s largest oil producer, overtaking Saudi Arabia, by 2020
Implications for crude producers, Asian buyers, US role in Mideast…
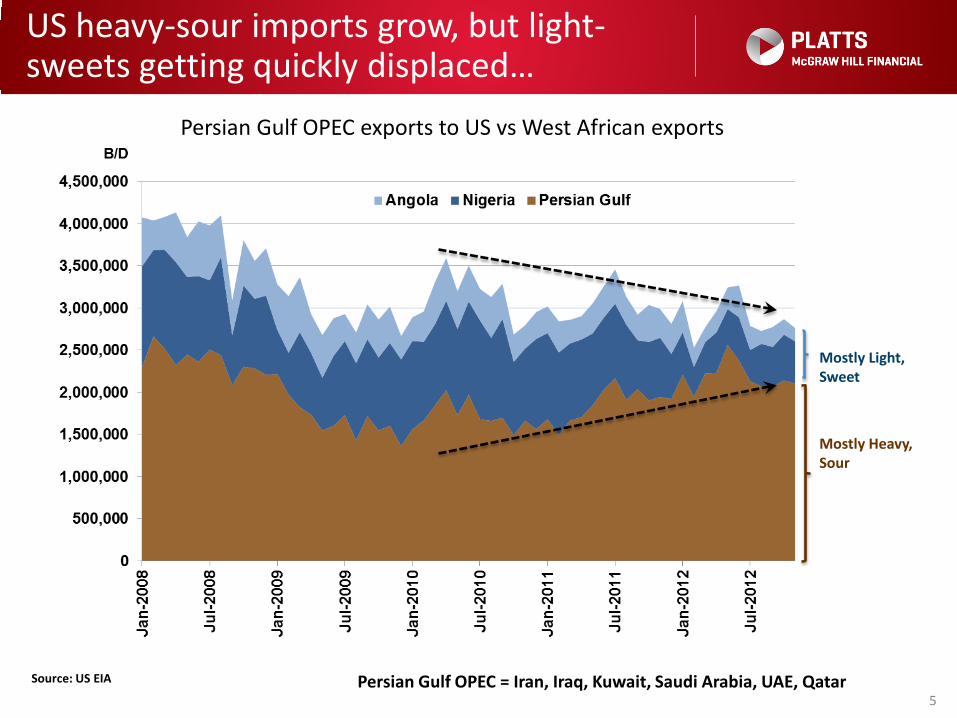
US heavy-sour imports grow, but light-sweets getting quickly displaced…
5
Mostly Heavy, Sour
Mostly Light, Sweet
Persian Gulf OPEC = Iran, Iraq, Kuwait, Saudi Arabia, UAE, Qatar Source: US EIA
Persian Gulf OPEC exports to US vs West African exports
6
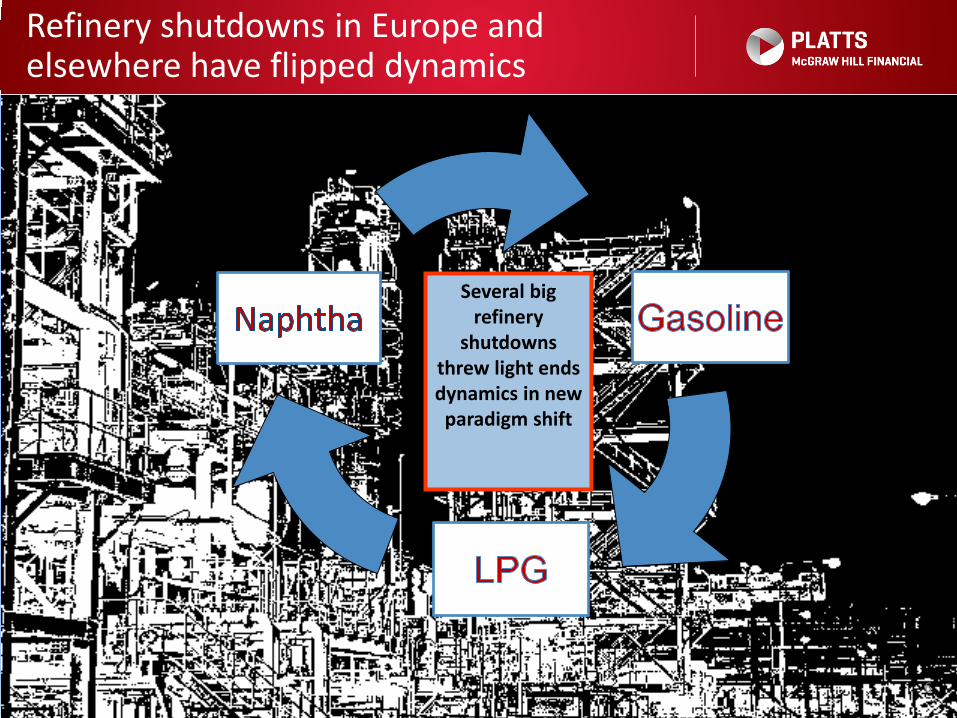
Several big refinery
shutdowns threw light ends dynamics in new
paradigm shift
Refinery shutdowns in Europe and elsewhere have flipped dynamics
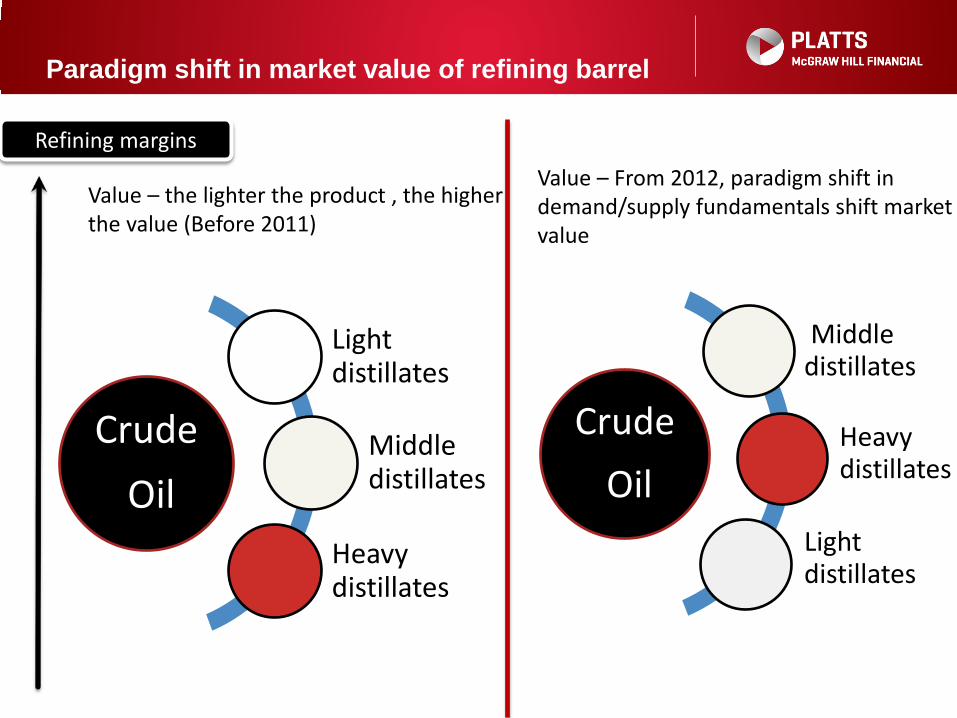
Crude Oil
Light distillates
Middle distillates
Heavy distillates
Value – the lighter the product , the higher the value (Before 2011)
Crude Oil
Middle distillates
Heavy distillates
Light distillates
Value – From 2012, paradigm shift in demand/supply fundamentals shift market value
Paradigm shift in market value of refining barrel
Refining margins

Shifting fundamentals as gasoil demand rises
Light ends
Gasoil
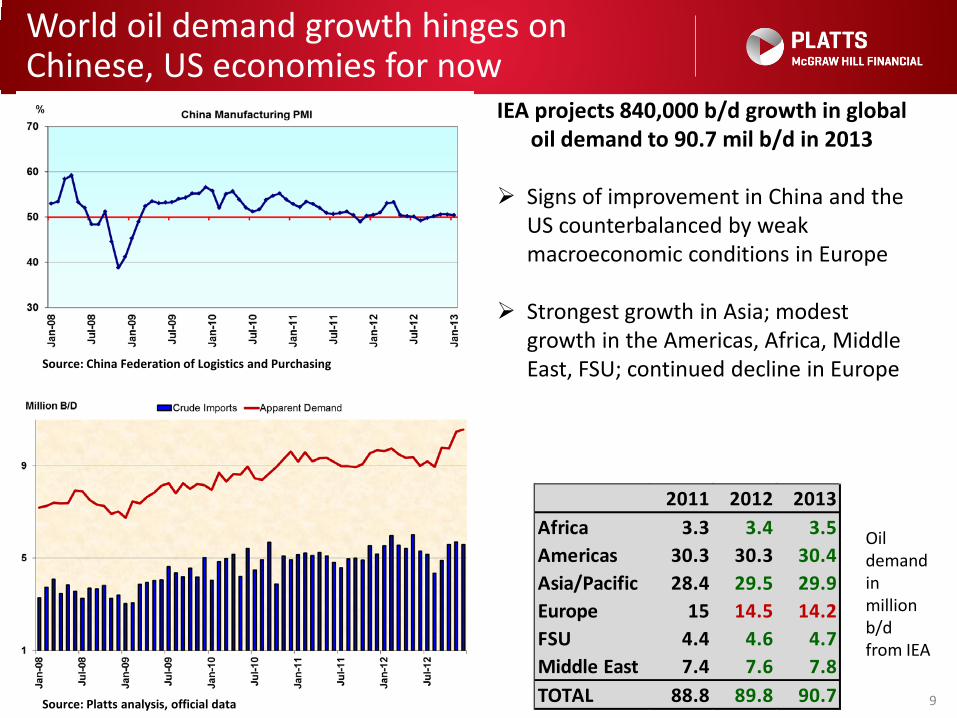
World oil demand growth hinges on Chinese, US economies for now
9
IEA projects 840,000 b/d growth in global oil demand to 90.7 mil b/d in 2013
Signs of improvement in China and the
US counterbalanced by weak macroeconomic conditions in Europe
Strongest growth in Asia; modest growth in the Americas, Africa, Middle East, FSU; continued decline in Europe
Source: China Federation of Logistics and Purchasing
Source: Platts analysis, official data
2011 2012 2013Africa 3.3 3.4 3.5Americas 30.3 30.3 30.4Asia/Pacific 28.4 29.5 29.9Europe 15 14.5 14.2FSU 4.4 4.6 4.7Middle East 7.4 7.6 7.8TOTAL 88.8 89.8 90.7
Oil demand in million b/d from IEA
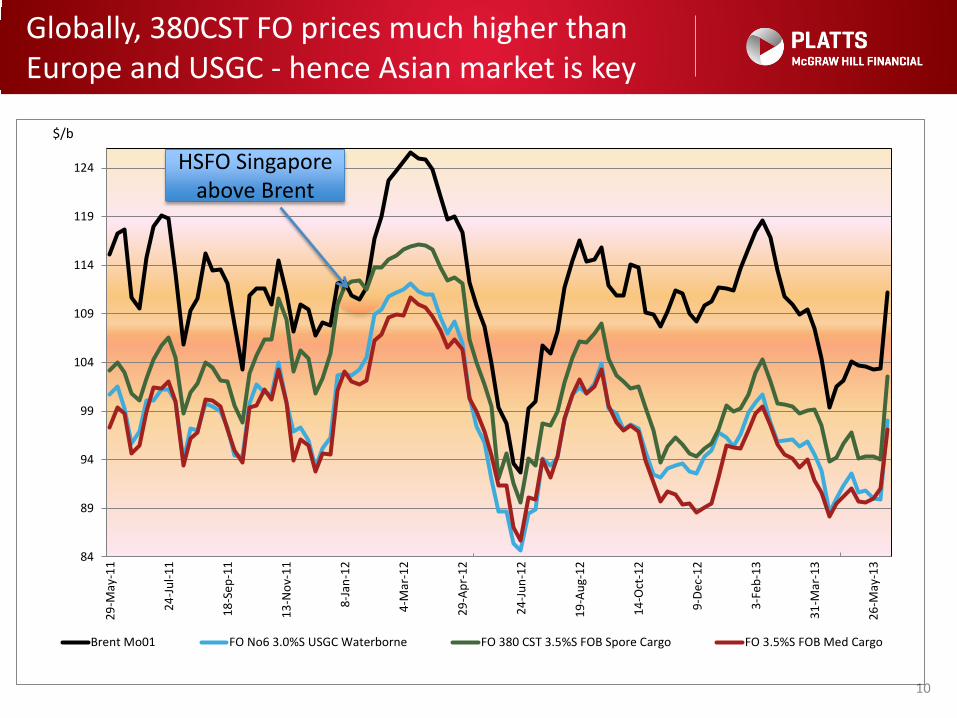
Globally, 380CST FO prices much higher than Europe and USGC - hence Asian market is key
10
84
89
94
99
104
109
114
119
124
29-M
ay-1
1
24-Ju
l-11
18-S
ep-1
1
13-N
ov-1
1
8-Ja
n-12
4-M
ar-1
2
29-A
pr-1
2
24-Ju
n-12
19-A
ug-1
2
14-O
ct-1
2
9-De
c-12
3-Fe
b-13
31-M
ar-1
3
26-M
ay-1
3
Brent Mo01 FO No6 3.0%S USGC Waterborne FO 380 CST 3.5%S FOB Spore Cargo FO 3.5%S FOB Med Cargo
$/b
HSFO Singapore above Brent
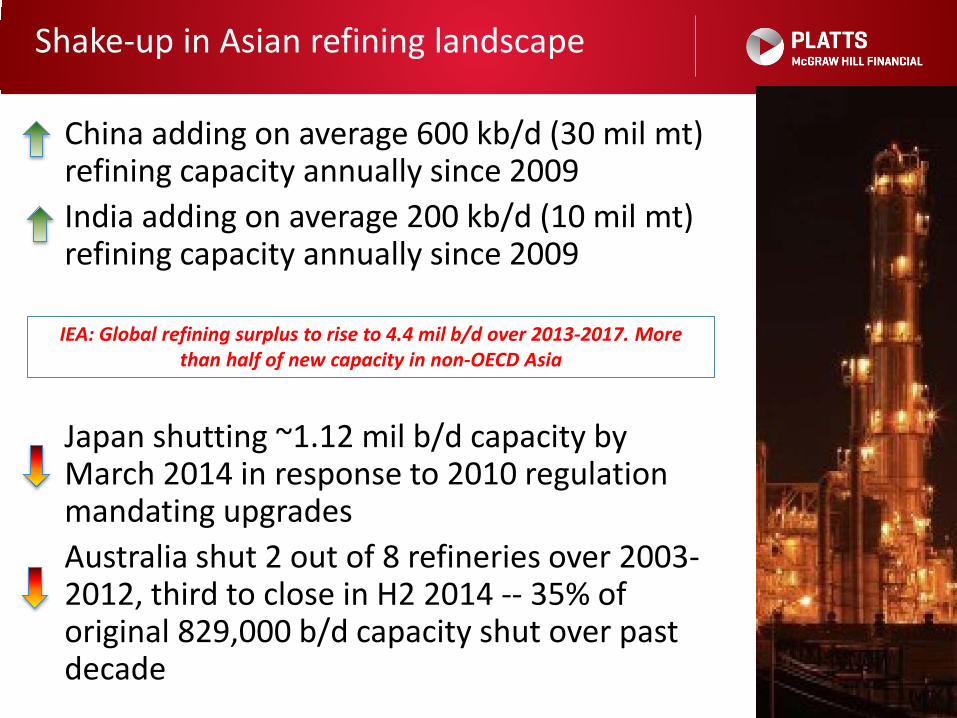
China adding on average 600 kb/d (30 mil mt) refining capacity annually since 2009 India adding on average 200 kb/d (10 mil mt) refining capacity annually since 2009
Japan shutting ~1.12 mil b/d capacity by March 2014 in response to 2010 regulation mandating upgrades Australia shut 2 out of 8 refineries over 2003- 2012, third to close in H2 2014 -- 35% of original 829,000 b/d capacity shut over past decade
11
Shake-up in Asian refining landscape
IEA: Global refining surplus to rise to 4.4 mil b/d over 2013-2017. More than half of new capacity in non-OECD Asia
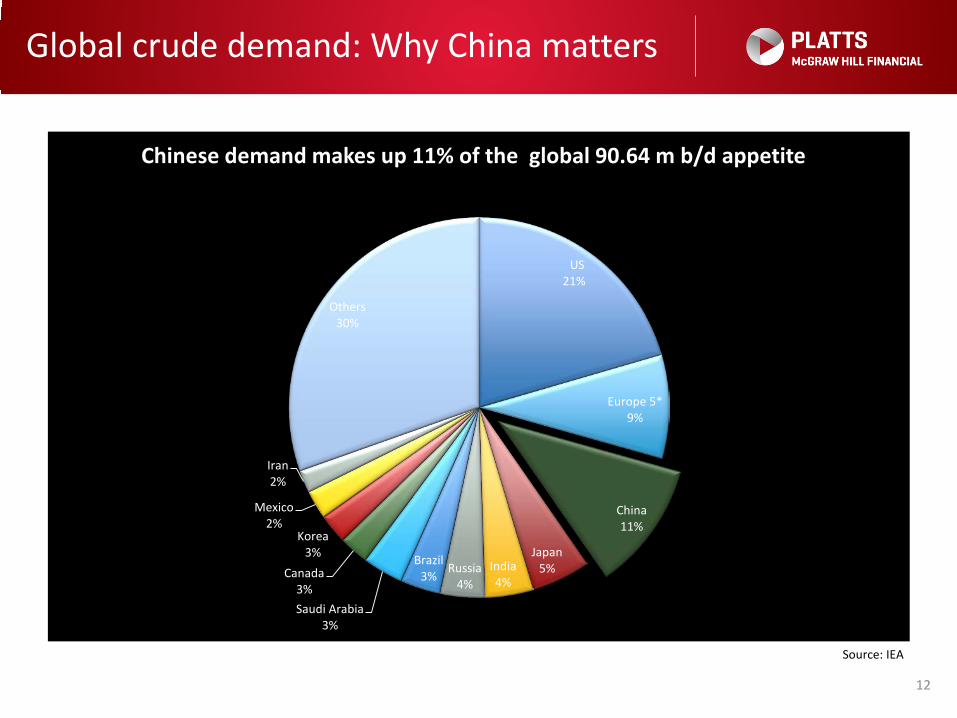
Global crude demand: Why China matters
12
US 21%
Europe 5* 9%
China 11%
Japan 5% India
4% Russia
4%
Brazil 3%
Saudi Arabia 3%
Canada 3%
Korea 3%
Mexico 2%
Iran 2%
Others 30%
Chinese demand makes up 11% of the global 90.64 m b/d appetite
Source: IEA

China has been slightly shifting its crude oil buying patterns
13
Saudi Arabia 20.25%
Angola 14%
Iraq 9%
Russia 9%
Oman 8%
Iran 7%
Venezuela 5%
Kazakhstan 4%
UAE 4%
Kuwait 3%
Other countries 17%
China crude imports Jan-Mar 2013 Jan-Mar 2013 (mt)
Saudi Arabia 13,971,171 Angola 9,705,699 Iraq 6,231,675 Russia 6,011,360 Oman 5,563,428 Iran 5,048,482 Venezuela 3,516,708 Kazakhstan 2,908,518 UAE 2,389,060 Kuwait 2,229,957 Other countries 11,401,510 Total 68,977,568
China is now importing more Latin American grades: Vasconia, Castille Blend, Napo, Oriente, Maya, Mesa 30, Marlim, Escalante, Santa Barbara grades
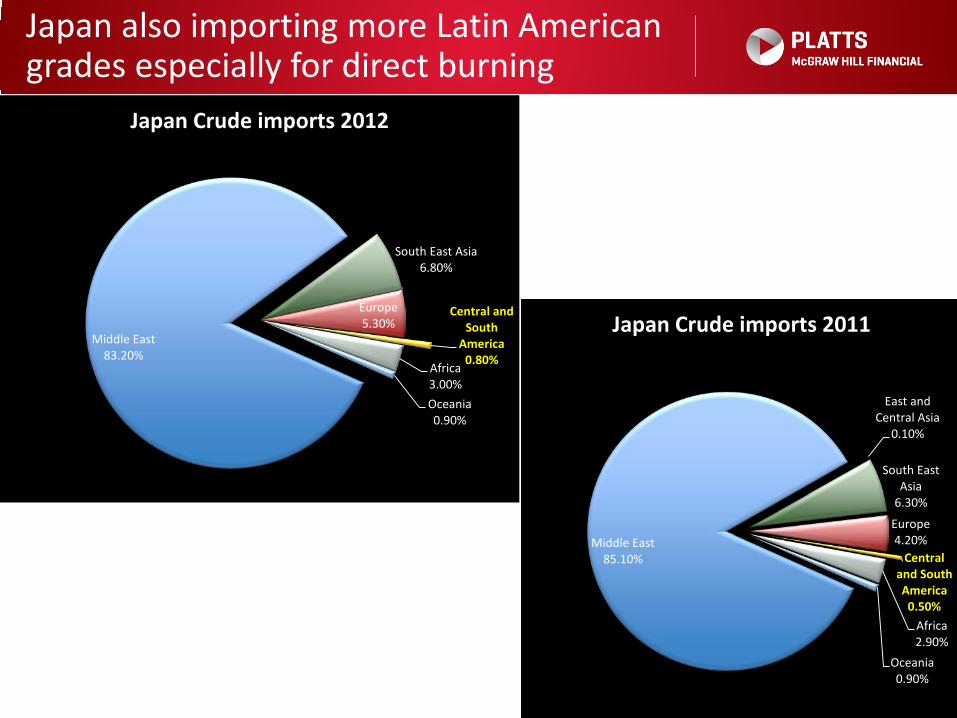
Japan also importing more Latin American grades especially for direct burning
14
Middle East 85.10%
East and Central Asia
0.10%
South East Asia
6.30%
Europe 4.20%
Central and South America
0.50% Africa 2.90%
Oceania 0.90%
Japan Crude imports 2011 Middle East
83.20%
South East Asia 6.80%
Europe 5.30%
Central and South
America 0.80% Africa
3.00% Oceania 0.90%
Japan Crude imports 2012
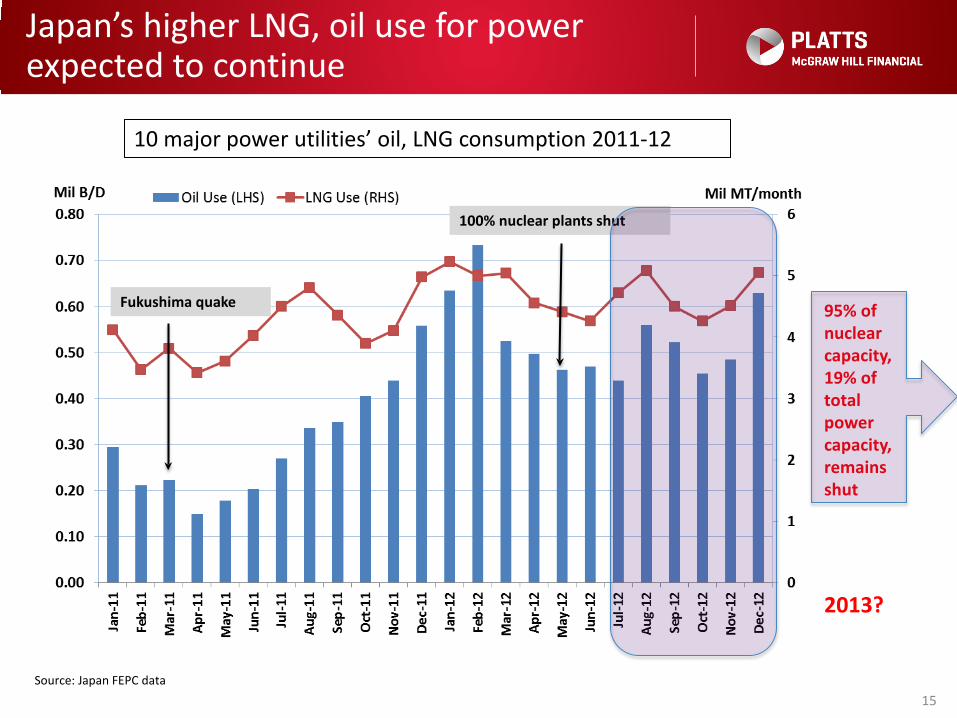
Japan’s higher LNG, oil use for power expected to continue
15
10 major power utilities’ oil, LNG consumption 2011-12
Source: Japan FEPC data
Fukushima quake
100% nuclear plants shut
95% of nuclear capacity, 19% of total power capacity, remains shut
2013?
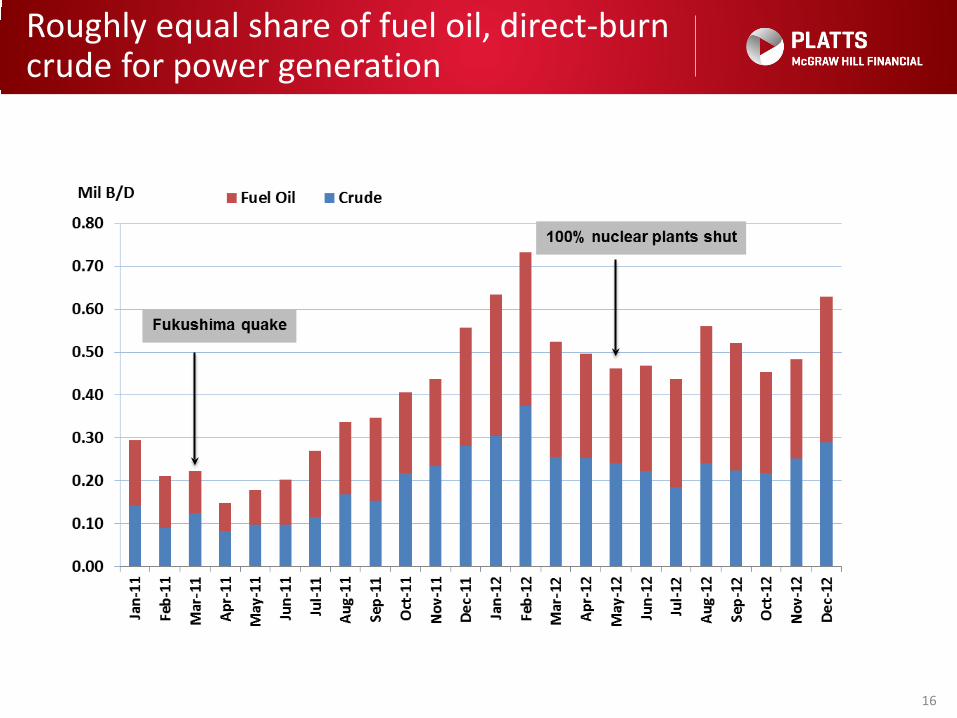
Roughly equal share of fuel oil, direct-burn crude for power generation
16
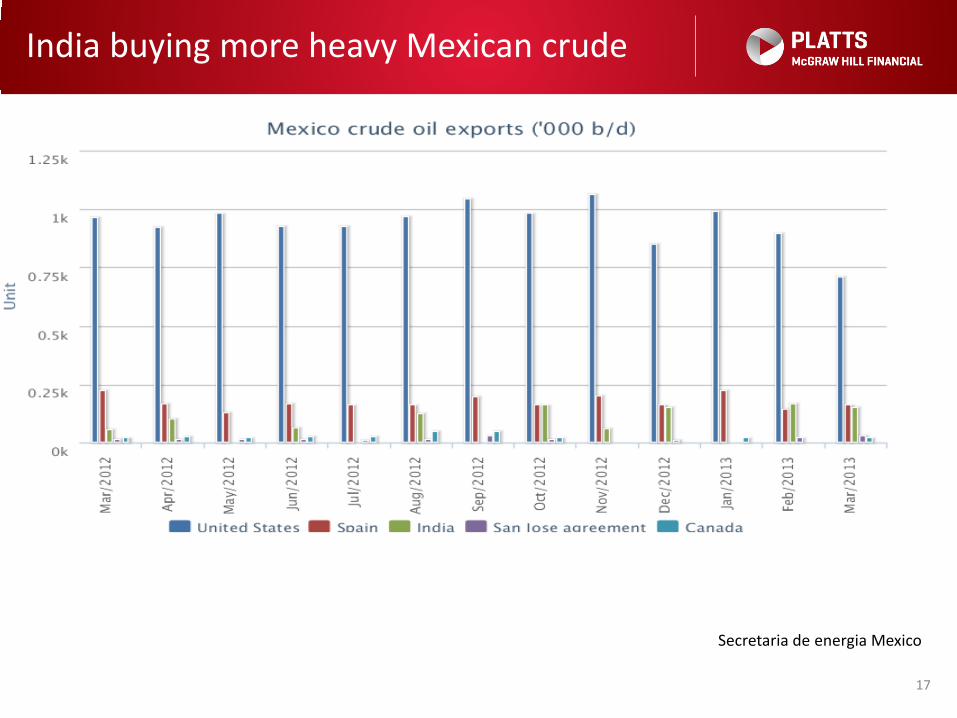
India buying more heavy Mexican crude
Secretaria de energia Mexico
17
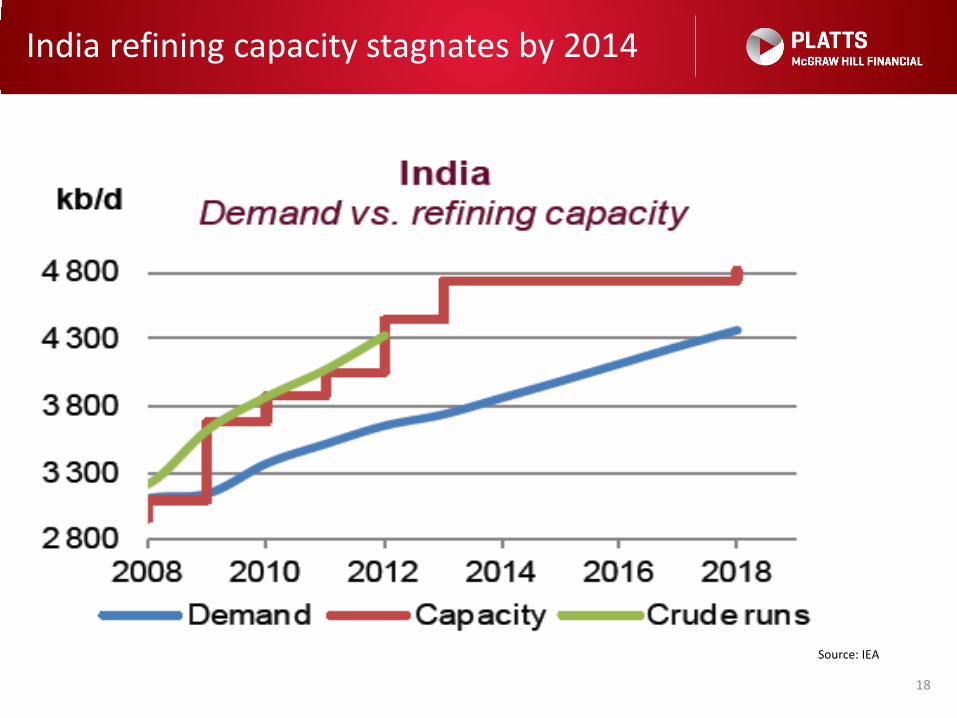
India refining capacity stagnates by 2014
18
Source: IEA
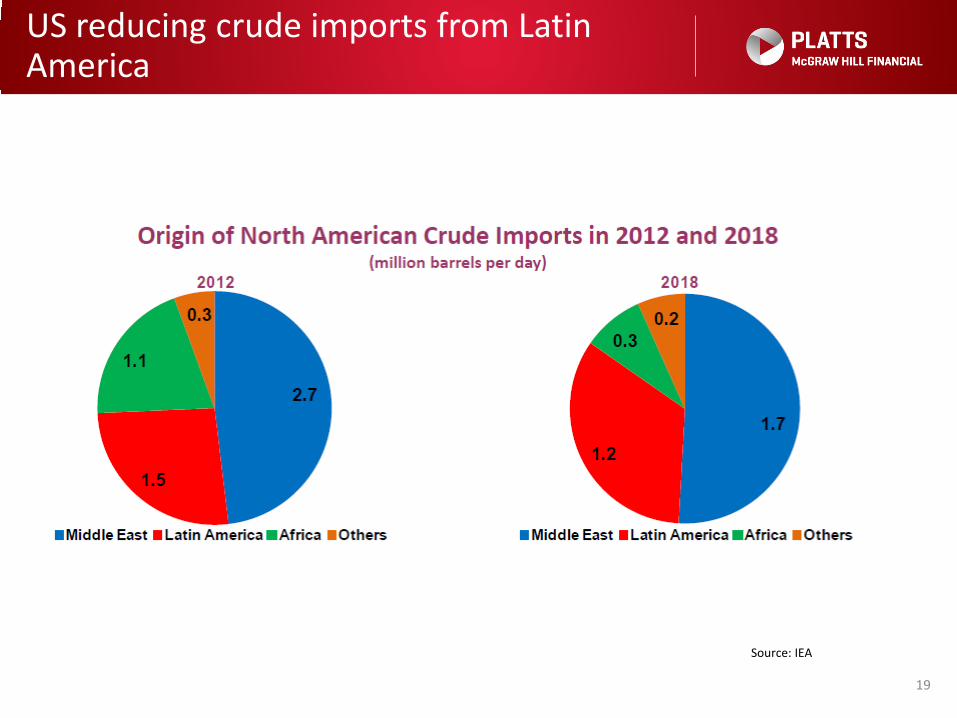
US reducing crude imports from Latin America
19
Source: IEA
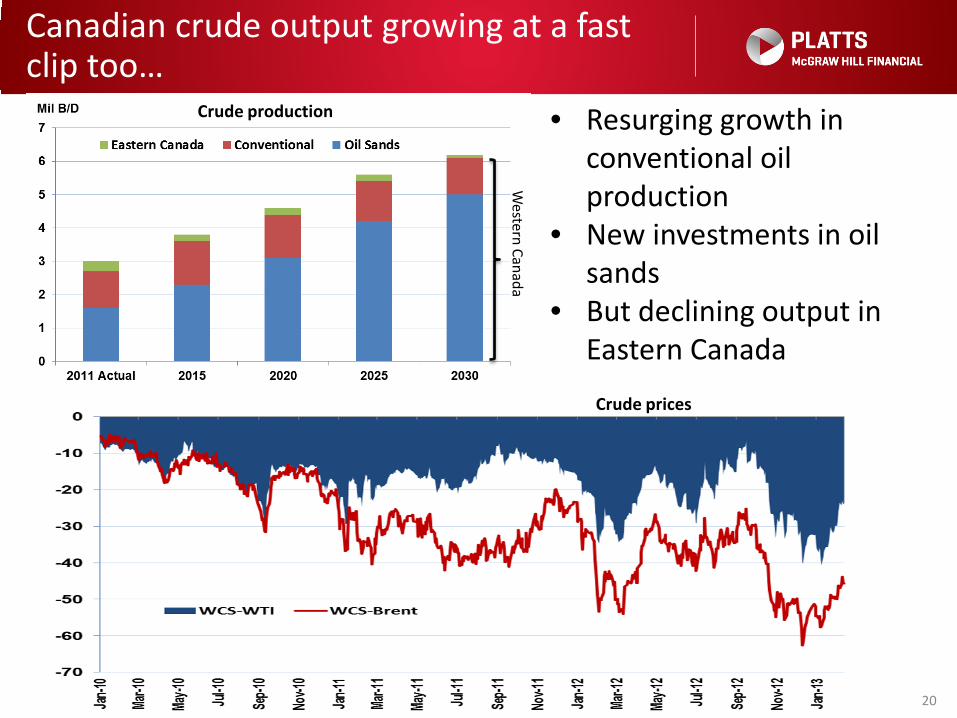
Canadian crude output growing at a fast clip too…
20
Source: Canadian Association of Petroleum Producers
• Resurging growth in conventional oil production
• New investments in oil sands
• But declining output in Eastern Canada
Western Canada
Crude production
Crude prices

Canadian, Colombian exports to US gain in recent years; Mexico and Venezuela down
21
Between 2008-2012: Imports from Canada UP 18% to ~2.9 mil b/d Imports from Colombia UP 118% to ~ 440 kb/d
Imports from Mexico DOWN 21% to ~ 1 mil b/d Imports from Venezuela DOWN 22% to ~ 930 kb/d
Source: EIA
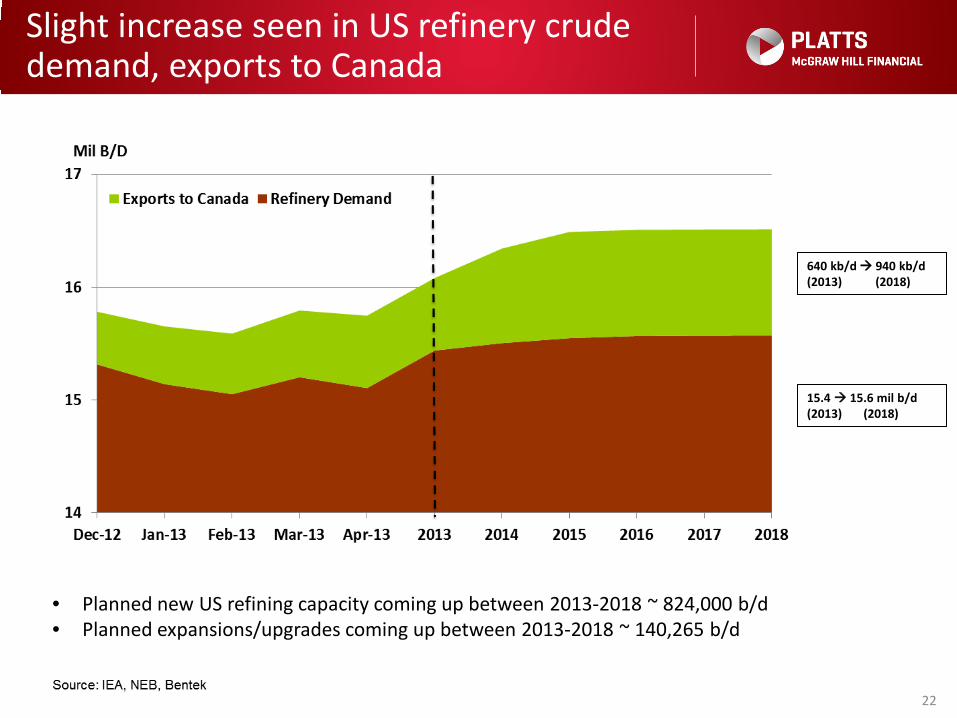
Slight increase seen in US refinery crude demand, exports to Canada
22
15.4 15.6 mil b/d (2013) (2018)
640 kb/d 940 kb/d (2013) (2018)
• Planned new US refining capacity coming up between 2013-2018 ~ 824,000 b/d • Planned expansions/upgrades coming up between 2013-2018 ~ 140,265 b/d
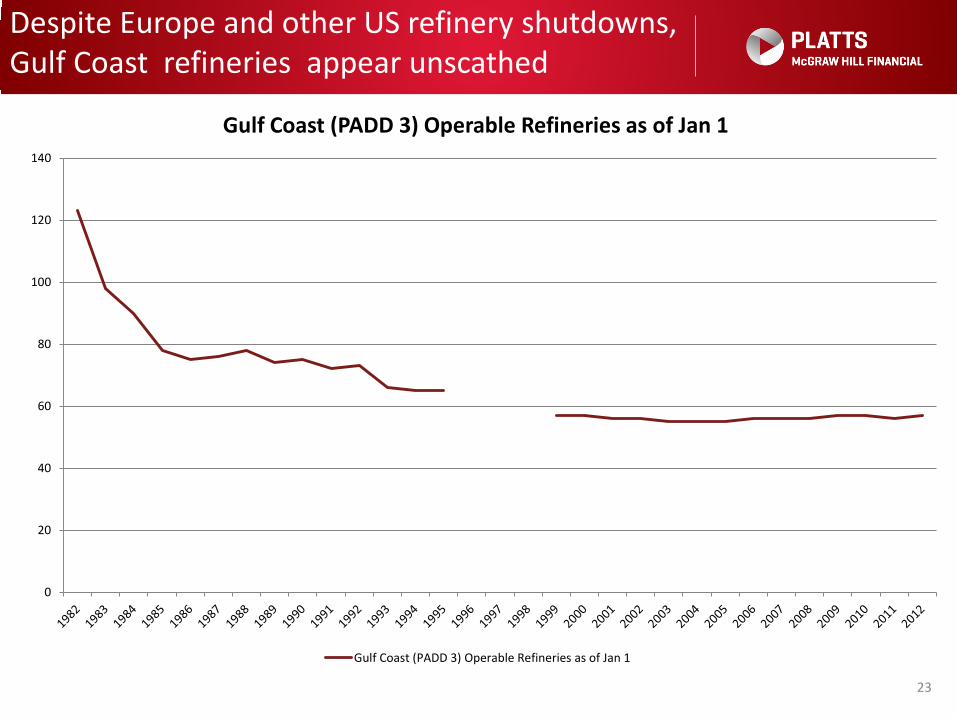
Despite Europe and other US refinery shutdowns, Gulf Coast refineries appear unscathed
23
0
20
40
60
80
100
120
140
Gulf Coast (PADD 3) Operable Refineries as of Jan 1
Gulf Coast (PADD 3) Operable Refineries as of Jan 1
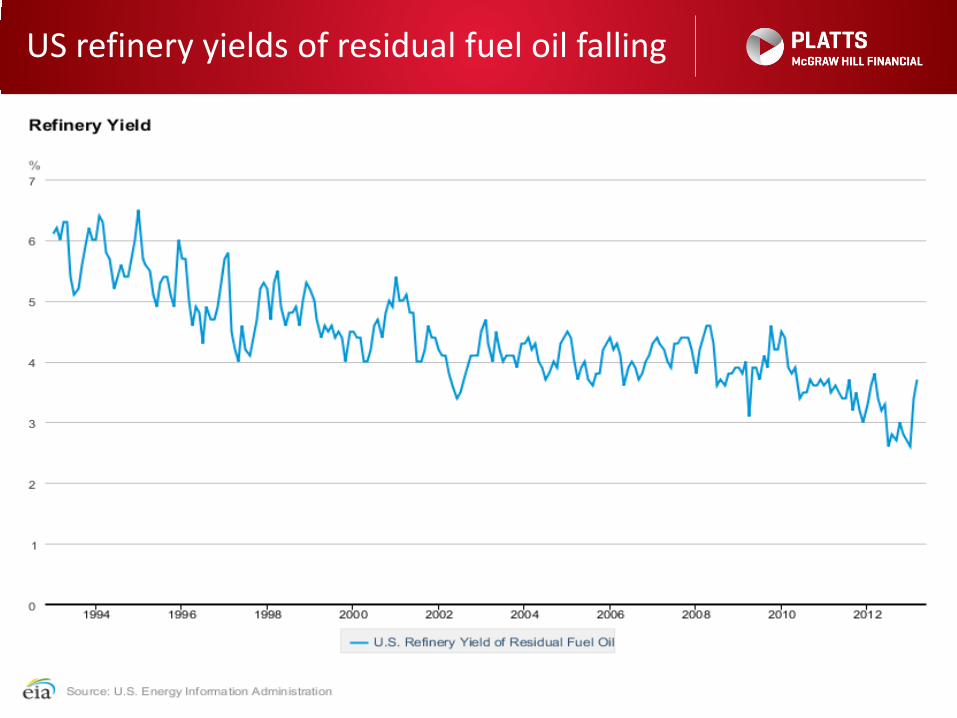
US refinery yields of residual fuel oil falling
24
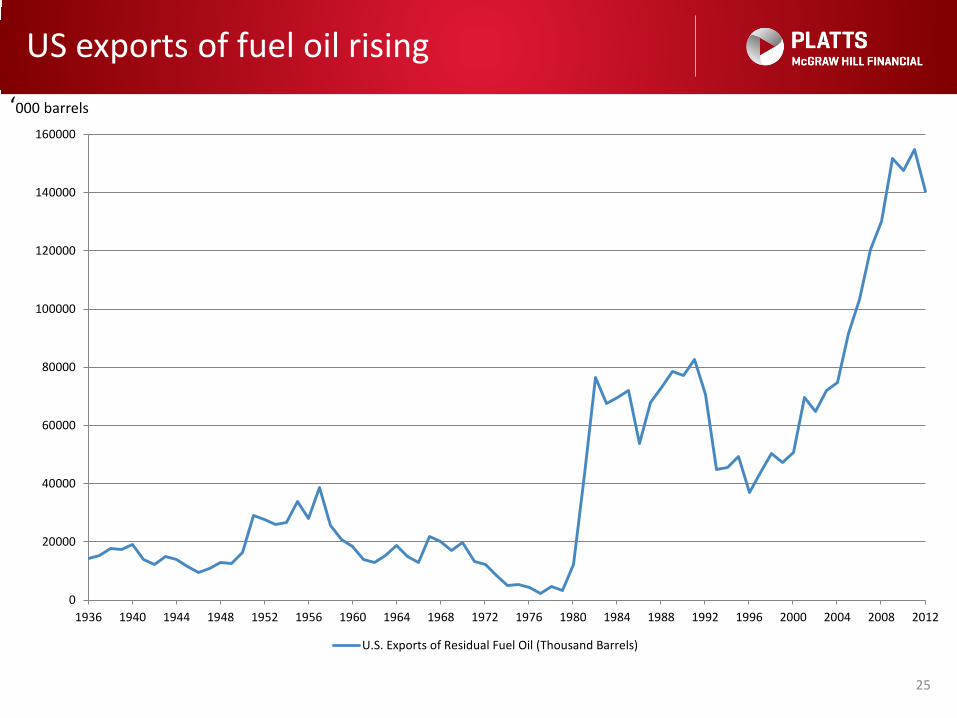
US exports of fuel oil rising
25
0
20000
40000
60000
80000
100000
120000
140000
160000
1936 1940 1944 1948 1952 1956 1960 1964 1968 1972 1976 1980 1984 1988 1992 1996 2000 2004 2008 2012
U.S. Exports of Residual Fuel Oil (Thousand Barrels)
‘000 barrels
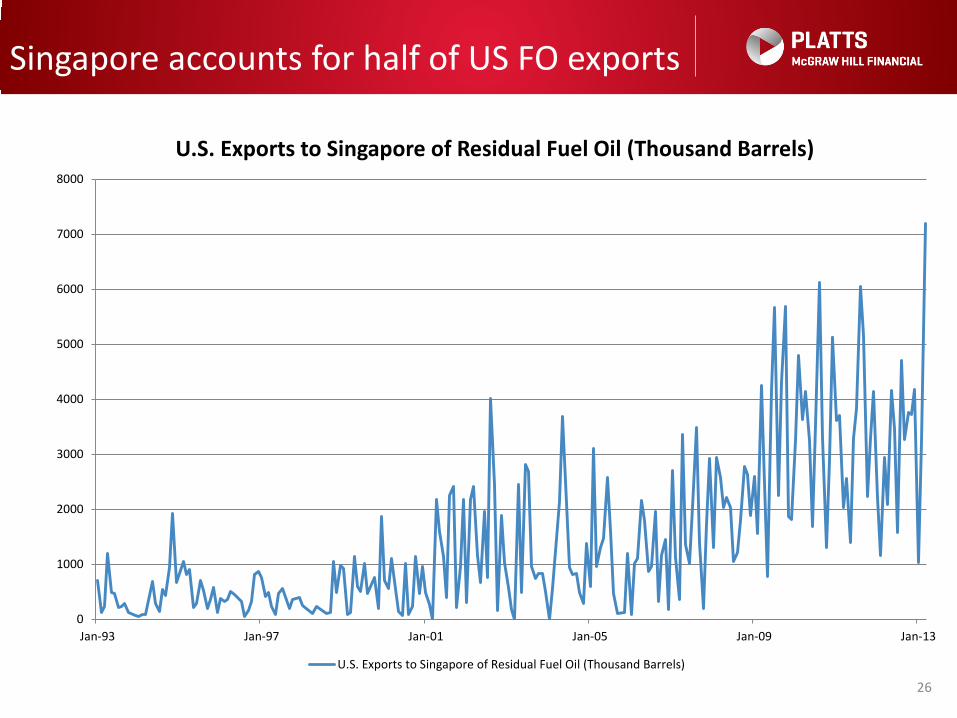
Singapore accounts for half of US FO exports
26
0
1000
2000
3000
4000
5000
6000
7000
8000
Jan-93 Jan-97 Jan-01 Jan-05 Jan-09 Jan-13
U.S. Exports to Singapore of Residual Fuel Oil (Thousand Barrels)
U.S. Exports to Singapore of Residual Fuel Oil (Thousand Barrels)

Tightening sulfur limits – supply concerns
27