global initiative on - unicef · global initiative on ... social and economic background ......
TRANSCRIPT

Global Initiative on
Out-of-School Children
ALL CHILDREN IN SCHOOL BY 2015
ROMANIA COUNTRY STUDY Analysing the situation of out of school children in Romania
December 2012
România

2
Cover image: ©ISE, Romania

3
Contents Acknowledgements ......................................................................................................................................... 4
List of Tables and Figures ............................................................................................................................... 5
LIST OF ACRONYMS ..................................................................................................................................... 6
INTRODUCTION ............................................................................................................................................ 7
Overview of OOSC Initiative ........................................................................................................................ 7
Romania’s context: geographical, social and economic background ............................................................ 7
Economic context ....................................................................................................................................... 9
Structure of the education system and main stakeholders ......................................................................... 11
General introduction to the 5DE in Romania .............................................................................................. 12
Methodology of the national report ............................................................................................................ 13
Chapter 1: Profiles of Excluded Children ....................................................................................................... 17
1.1. Profiles of Children in Dimension 1 ..................................................................................................... 17
1.2.Profiles of OOSC in Dimension 2 ........................................................................................................ 20
1.3. Profiles of OOSC in Dimension 3 ....................................................................................................... 26
1.4.Profiles of Children at Risk in Dimension 4 .......................................................................................... 30
1.5. Profiles of Children at Risk in Dimension 5 ......................................................................................... 33
Chapter II.BARRIERS AND BOTTLENECKS IN RELATION TO THE 5DE .................................................... 37
2.1. Socio-CulturalDemand Side ............................................................................................................... 37
2.2. Economic Demand Side ..................................................................................................................... 43
2.3. Supply Side Barriers .......................................................................................................................... 46
2.4. Policy, Governance, Capacity, Financing............................................................................................ 53
2.5. Analytical summary ............................................................................................................................ 55
Chapter III. POLICIES AND STRATEGIES RELATED TO THE FIVE DIMENSIONS OF EXCLUSION .......... 57
3.1. Supply side – a new policy framework ................................................................................................ 57
3.2. Other relevant on-going supply side policies ....................................................................................... 61
3.2.1. Ensuring Equity and Access to Education and Training ............................................................... 62
3.2.2. Curriculum Modernization ........................................................................................................... 64
3.2.3. Making Early Childhood Education a Public Good ....................................................................... 64
3.3. Demand side educational and social policiesdirectlytargetingexcludedgroups ..................................... 66
3.4. Social protection policies relevant for out of school children and adolescents at risk ........................... 69
3.5. Efficient System Decentralization and Scaling Up Standard Costing per Student ................................ 73
RECOMMENDATIONS ................................................................................................................................. 75
a. General Recommendations ................................................................................................................... 75
b. Specific Recommendations for Identified Categories ............................................................................. 79
ANNEX ......................................................................................................................................................... 85

4
Acknowledgements
This report would have not been possible without the constant involvement and support of UNICEF
Headquarter, Regional Office for CEECIS and Country Office in Romania, the Institute for Educational
Sciences in Romania and all the schools included in School Attendance Initiative in school year 2010-
2011. In particular, the school management of primary and lower secondary schools from Homocea,
Arad, Măcin, Săcele and Reșița had an important role in understanding better the situation of students
at risk of dropping out and the various barriers in relation with school attendance in the case of social
and economic disadvantaged population.
The authors want also to thank the representatives of national authorities, research and civil society
organizations who contributed to the development of this report during all the stages of report
development: Ministry of Education, Research, Youth and Sport – Directorate for Pre-University
Education and LLL, National Institute of Statistics, Ministry of Labor - Child Protection Directorate,
Institute for the Quality of Life, Impreuna Agency, Romani Criss, Center Educatia 2000+ and Center of
Resources and Information for Social Professions.
The report received detailed and valuable comments and suggestions for improvement from UNICEF
Regional Office for CEECIS – Phillipe Testot-Ferry, regional advisor, Errin Tanner, educational
specialist, Frank van Capelle, consultant, the UNESCO Institute for Statistics (UIS) - Sheena Bell and
Friedrich Huebler. Many thanks for the help and for the clarification of many methodological aspects
important for the quality of the report.

5
List of Tables and Figures
Table Page
Table 1 Percentage of pre-primary age children (3-6) in pre-primary or primary education, by gender and other characteristics, 2009/2010
17
Table 2 Children of primary school age who dropped out (%) (2005/2009) 20
Table 3 Highest educational attainment of out-of-school Roma children [2007](%) 24
Table 4 Children with disabilities out of school, by type of handicap, age group, gender and area of residence, 2011
25
Table 5 Number and percentage of children out of school, by age group and gender 26
Table 6 Repetition rate at the primary and lower secondary level of education by grade and area of residence
30
Table 7 Roma children enrolment by age groups and household wealth - 2009 33
Table 8 Schools receiving sanitary authorisation 47
Table 9 Schools with running water 47
Table 10 Access to electricity 48
Table 11 Types of sanitation 48
Table 12 Central heating 49
Table 13 Average PISA Scores 52
Table 14 Summary of students' and schools' socio-economic background and performance
52
Table 15 Key Programmes of the Social Protection System 70
Table 16 Financing of key programmes 71
Figure Page
Figure 1 GDP per capita evolution in Romania, 1989 - 2010 9
Figure 2 Poverty risk in EU member states (% total and working population),2010 10
Figure 3 Total public expenditures in EU as % of GDP (1997 - 2009) 11
Figure 4 Five Dimensions of Exclusion (5DE) 16
Figure 5 Average school enrolment by age group 21
Figure 6 Percentage of primary school age children out of school, by age and gender 22
Figure 7 Percentage of primary school-age children out of school, by wealth index quintile 23
Figure 8 Percentage of primary school age children out of school, poorest and richest quintiles
23
Figure 9 School enrolment by age, level of education and gender (%), 2009/2010 27
Figure 10 Percentage of lower secondary school age children out of school (poorest and richest), 2009
29
Figure 11 Dropout rate at the primary and lower secondary level, by type of residence, 2005-2009
34
Figure 12 Public expenditure on education as percentage of GDP, 2007 55

6
LIST OF ACRONYMS
5DE – Five Dimensions of Exclusion
ANAR – Adjusted net attendance rate
ANER – Adjusted net enrolment rate
ANPC – National Authority for Child Protection
ARACIP – National Agency for Quality Assurance in Pre-University Education
CCD – Teacher Training Centre
CJRAE – Country Centre for Resources and Educational Assistance
CMF – Conceptual and Methodological Framework
ECCE – Early Childhood and Care Education
EFA – Education for All
EU – European Union
GAR – Gross attendance rate
GDP –Gross domestic product
GER –Gross enrolment rate
GPI –Gender parity index
ICCV – Institute for the Quality of Life
ILO – International Labour Organization
INS – National Institute of Statistics
ISCED – International Standard Classification of Education
ISE – Institute of Education Sciences
ISJ – County School Inspectorate
MECTS – Ministry of Education, Research and Youth
MMSSF – Ministry of Labour, Social Protection and Family
MDR – Ministry of Regional Development
NAR – Net attendance rate
NER –Net enrolment rate
NGO –Non-Governmental Organisation
OECD – Organisation for Economic Co-operation and Development
OOSC – Out-of-school children
OOSCI – Out-of-School Children Initiative
PPP –Purchasing power parity
SEN – Special Education Needs
UCW –Understanding Children’s Work
UIS – UNESCO Institute for Statistics
UNDP – United Nations Development Programme
UNESCO – United Nations Educational, Scientific and Cultural Organization
UNICEF – United Nations Children’s Fund
UNPD – United Nations Population Division

7
INTRODUCTION
Overview of OOSC Initiative
Building on a joint report which introduced the typology of out-of-school children and disaggregated
data analysis in 2005, UNICEF and the UNESCO Institute for Statistics (UIS) launched at the beginning
of 2010a Global Initiative on Out-of-School Children in order to stimulate more complex and more
informed and monitored policy responses related to exclusion from education1. The Initiative aims at
working with 26 countries (Bangladesh, Bolivia, Brazil, Cambodia, Colombia, Democratic Republic of
the Congo, Ethiopia, Ghana, India, Indonesia, Kyrgyzstan, Liberia, Mexico, Morocco, Mozambique,
Nigeria, Pakistan, Philippines, Romania, Sri Lanka, North and South Sudan, Timor-Leste, Tajikistan,
Turkey and Zambia) for an in-depth analysis of the situation of out of school children, including the
factors of exclusion from schooling and existing policies focused on enhanced participation.
The UIS (2010)2 estimates that there were 61 million primary school age children and 71 million lower
secondary school age children in the world out of school in 2010 According to a recent joint UIS-Global
Monitoring report factsheet there has been a stagnation in the global number of out-of-school children
in the past 5 years, however, 56 million primary school age children could not be in school in 2015 (EFA
Global Monitoring Report 2011).Global and regional data on trends with out-of-school children show
that whilst the situation has improved over the past decade there is a strong need for a more systematic
approach to address the problem of out-of-school children and guide concrete education sector reforms
in this regard.
Designed to reach a better understanding of existing data, the initiative is particularly important for
researching the situation of the most disadvantaged OOSC. Profiling children out of school is currently
limited to only some characteristics making difficult the task of identifying and addressing the multiple
and overlapping forms of exclusion and disparities that affect them. This multi-dimensionality of
disparities makes it extremely difficult to formulate and adequately support multi-sectoral policies for
countries trying to address the issue.
The Global Initiative is contributing therefore to the development of national studies based on the work
of national teams (consisting of government partners and key decision-makers), as well as to national
capacity strengthening related to the collection and management of education statistics and to policy
analysis and strategy development. The country studies will feed into regional overviews, a global study
and a global conference to leverage resources for equity.
Romania’s context: geographical, social and economic background
Romania is a relatively large country (238,391 km2) located in Eastern Europe, in the Northern part of
the Balkans. The neighbour countries are Hungary (in West), Ukraine and Republic of Moldova (North
and North-East), Serbia (South-West) and Bulgaria (South). According to the official demographic
1UNICEF and UIS, Conceptual And Methodological Framework, March 2011 version.
2 UNESCO Institute for Statistics (UIS), Data Centre, http://stats.uis.unesco.org).

8
statistics, Romania has a population of nearly 22 million inhabitants, with a large majority of Romanian
ethnics (around 90%). Other important minorities are Hungarian (6.6%) and Roma minority (2.5%).
Almost 4 million Romanian citizens are currently working in other European countries, mainly Spain (0.8
million workers estimated) and Italy (0.6 millions). Fertility rate is 1.4, slightly lower than the EU member
states average (1.5.)
After the second-world war, in 1947 Romanian king Mihai I was forced to leave the country by the
Soviet Union's puppet Government, opening almost 50 years of one of the most tyrannical communist
regimes in Eastern Block. Romania become a democratic country after the Revolution sparked in
Timisoara in 16th of December, 1989 and continued in Bucharest in 21st-22nd of December. The
dictator Nicolae Ceausescu was killed together with his wife during the change of regime events after a
summary trial, putting an end to the street fights that killed more than 1000 persons. After communism,
another period of hardships for a large part of the population started, with the difficult process of re-
structuring the economy to the free market rules and adaptation to a Parliamentary democratic regime.
Romania joined NATO in 2004 and become in January 2007 a Member of European Union jointly with
Bulgaria, offering a new perspective for social and economic development.
From an administrative point of view, the country has 263 cities and 2685 villages (comune) being
organised in 41 counties and Bucharest city. The regional level emerged in the public policymaking only
after 1989, when escaping a hyper-centralised system of government and under the influence of the
accession process and regional policies of EU. Eight development regions were defined, partly
following historical regions of Romania (see map below). The main regional development structures in
Romania were created at national and regional level (such as the Regional Development Agency and
Ministry of Regional Development) but in 2011 the Government proposed for public debate a new
administrative organisation model, considering the current one not being effective.

9
A special feature of Romania is the large share of its population living in rural areas (46%), significantly
higher compared with EU average (24%). As we will see, this fact is relevant for our analysis, given the
marked differences in the living conditions but also in the quality of social services provision (including
education) between the two areas of residence.
Economic context
The economic gap between Romania and the other EU Member states is reflected by the high
difference of GDP per capita (currently around 41% of the EU average). Romania needed almost 15
years to reach the same level of GDP as compared with 1989 (Figure 1) and since 2008 the GDP
increase trend has stopped - at the same time as the global economic recession. Forecasts are
indicating 2011 as the year of regaining the positive trend in GDP increase, but strong positive signs of
economic growth are not visible yet.
Figure 1. GDP per capita evolution in Romania, 1989 - 2010 (1989 = 100%)
Source: ICCV, 2011
0
20
40
60
80
100
120
140
19
89
19
90
19
91
19
92
19
93
19
94
19
95
19
96
19
97
19
98
19
99
20
00
20
01
20
02
20
03
20
04
20
05
20
06
20
07
20
08
20
09
20
10
GDP evolution
1989 value

10
There is also a higher inequality in revenues compared with EU average (including Romania): S80/S20
indicator has a value of 5.3 compared with 4.8, while Gini coefficient has a value of 35% compared with
0.30% the EU average (2009 data).
According to EUROSTAT, more than a fifth of population is at risk of poverty (defined as equivalised
income below the threshold of 60% of the national equivalised median income): 22% compared with
16% at EU level. Romaniais ranking second after Lithuania in EU (Fig 2) and prospects of improvement
according to ICCV forecasts are still far in terms of time. Eurostat data are demonstrating that the risk is
affecting also almost a fifth of the working population, indicating that holding a job is not securing
enough earnings for a decent living. The same source indicates that 33% of the population up to 16
years old is at poverty risk while the same indicator for population aged 65 and over is around 20%.
Figure 2.Poverty risk rate in EU Member States (% total and working population), 2010
Source: Eurostat, epp.eurostat.ec.europa.eu
Poverty is affecting specific categories of population, such as different ethnic minorities. The most
disadvantaged is Roma minority, World Bank (2010) indicating that the poverty rate among this minority
reaches 67%. More than 50% of Roma and 60% of Roma communities are living with less than 4.30
USD/day and 21% with less than 2.15 USD/day. Also a large majority of Roma communities (74%) are
confronting with severe revenues challenges and 23% are currently not connected to electricity and/or
running water (ICCV, 2011). As we will detail in the report, the situation is also directly influencing the
school attendance of Roma children.
The percentage of poverty perception is the highest in EU (in 2009 more than 90% of Romanians
declared that they consider the poverty is generalised in Romania - ICCV, 2011). This subjective view
seems to entail that Romania still struggles for finding the means to finance its social policies and its
social assistance measures, with one of the lowest total public expenditures level in EU (Fig. 3).
The negative impact of the economic crisis on public social expenditures is important, education not
being an exception. Moreover, social expenditures are lower than what is required, with an average of
17% of GDP in 2000-2007 (Eurostat, 2008). As a share in public expenditures, social expenditures in
Romania account for 37%, while the EU average is 56.2%.
0.0
5.0
10.0
15.0
20.0
25.0
LV RO BG ES HR LT IT PT PL UK NMS12
EU27
DE FR DK SI HU SK NO CZ
Total population
In-work population

11
Figure 3. Total public expenditures in EU as % of GDP (1997 - 2009)
Source: Eurostat
Despite clear provisions of the national legislation, the public financing of education was constantly
under 4% of GDP. Both pre-university and university levels faced financing difficulties, especially in
what concerns the investment in school infrastructure, modern teaching materials and equipment and
programs of support for categories of risk (i.e. supporting staff for children with disabilities, school
mediators, provision of counselling and guidance services etc.). Current estimations indicate that for
closing the gap compared with the budget allocations for education as GDP percentage requires an
increase of over 25% of these public funds in Romania (ICCV, 2011).
According to World Health Organisation reports, the medical system in Romania is lagging behind other
EU states, with indicators such as infant mortality rate six times higher than Nordic countries. The rural
areas seems to be the most severely affected, INS and UNICEF reports indicating an infant mortality
rate four times higher compared with the urban areas (INS, 2011).
Structure of the education system and main stakeholders
According to the new Law of Education (1/2011) the educational system is divided along two main
levels. As presented in the Annex 2, the pre-university level (învăţământulpreuniversitar) is structured in
the following cycles: early school level (educație ante-preșcolară), kindergarten (grădiniţă or
învăţământulpreşcolar) – composed of three grades (grupamică, grupamijlocie and grupa mare);
primary school (învăţământulprimar) comprises five grades3: the preparatory grade (grupapregătitoare)
3The data for the primary level in this report is not including the preparatory year.
0
10
20
30
40
50
60
70
1997 1998 1999 2000 2001 2002 2003 2004 2005 2006 2007 2008 2009 2010
UE 15
Bulgaria
Hungary
Romania
Sweden
UK

12
and grades I to IV; lower secondary (gimnaziu) - grades V to IX and upper secondary (liceu teoretic,
vocational and tehnologic) - four or five grades (grades X to XII/XIII) with a theoretical, vocational or
technological track (the last one offering students professional qualifications). The majority of children
with special educational needs are integrated in mainstream schools. However, about a third of these
children go to special schools, mainly students with more severe handicap.
The education levels the most important for the Out-of-School Initiative study are ISCED 0, ISCED 1
and ISCED 2, covering the pre-primary, primary and lower secondary levels. Since 2011, when the new
law of education was introduced, the education system structure was changed. However, this report
uses the structure applicable in the reference period (2005-2010), as detailed in the Annex 2 of the
report.
Post-secondary non-tertiary education(învățământpostlicealși de maiștri) – ISCED 4, includes
programmes for technical and foreman positions. Higher education (învățământ superior) is organized
according to the principles of the Bologna process, which aims at the construction of the European
higher education area. It has the following components, corresponding to ISCED 5 and 6: Bachelor
(licenţă) 3 years in most disciplines; Master (masterat) 2 years in most disciplines; doctorate (doctorat)
at least 3 years and continuous training programs (cursuripostuniversitare, formarecontinuă).
According the National Institute of Statistics data, in 2009/10, the total enrolled school population was
4,176,866 students with the following distribution by level of education: pre-school education 666,123
students, primary education 845,679, lower secondary education 873,997, vocational education
115,445, high-school 837,728, post-secondary education (not tertiary) and foremen education 62,575
and higher education 775,319.
As already indicated, according to new regulations, compulsory school includes the primary level
(preparatory year and grades I to IV) and lower secondary (grades V to IX). Private pre-primary,
primary and lower secondary education is available mostly in urban areas and covers only a small
minority of children (INS, 2011).
The official language of instruction is Romanian but, for all levels, in all districts where an ethnic
minority exceeds 10% of the total population, free public schooling is provided in that language. Some
of the classes are taught in that language, and the language and literature of the ethnic group is "the
main language studied", although Romanian remains compulsory. Existing classes for different
linguistic minorities include: Bulgarian, Czech, Croatian, German, Hungarian,Polish, Romani, Russian,
Serbian, Slovakian, Turkish, andUkrainian. According to the provisions of the new law, primary
education in mother tongue is guaranteed to national minorities and for secondary education, classes in
the languages of national minorities are organised upon the request of parents and guardians. Also the
new provisions of the law offer specific support for pupils with special education needs.
General introduction to the 5DE in Romania
The specificity of the Romanian study in relation to the global study is given by the current system of
monitoring the OOSC and also by available data. Moreover, as it will be indicated in the study, most of
the children out of school in Romania had a prior experience of attending school. This situation is
indicated by the rather high enrolment rates in pre-primary and primary level and also by the drop-out

13
rates registered in primary and lower secondary levels. Therefore, the focus of our study is mainly on
dropouts and non-attendance, rather than children who have never gone to school.
Due to the fact that no recent survey data are available on profiles of out of school children, some of the
characteristics were difficult to be in-depth explored (i.e. family-context, school results, individual
characteristics etc.). The recommendation section of our report offers several policy areas for improving
the existing level of information in relation with children that are out of school, in particular for the
categories of students at risk identified. Moreover, our report strongly underlines the need to focus more
on prevention rather than intervention measures, both at national and local level, and also to
bettertarget policies at groups of children at risk.
In particular the national policies should offer an equal importance to attendance and not only to
enrolment data, since there is a huge information gap on the risk factors on assuring a constant
attendance for categories of students at risk.
Methodology of the national report
The methodology of the national report, detailed in the following chapter is closely following the
approach outlined in the Conceptual and Methodological Framework of the OOSCI. The starting point
of data analysis was the National Institute of Statistics (INS) available data on enrolment and drop out
for pre-primary, primary and lower secondary level (period covered being 2005-2009). As detailed in
Annex 3, the INS data is collected through an exhaustive survey in all public and private educational
establishments in Romania. The survey is based on research tools (questionnaires) agreed by the
Ministry of Education and Research and the National Institute of Statistics and it is conducted at the
beginning and the end of the school year. The data are collected from all types of educational
establishments and from all levels of education and by their use are treated as administrative data.
Sample design and data collection coverage is therefore national, macro-regional, regional, county and
town/commune. The data on school population is collected/disaggregated by gender, age, teaching
language, area of residence (urban/rural), level of education, geographic area, type of school (public,
private), grade. For some indicators, other types of disaggregation may be used: i.e. by
specialisations/qualifications, ethnic origin, Romanian students/foreign students, etc.
The main results of the survey are published yearly by the National Institute of Statistics in statistical
reviews such as: Primary and Lower Secondary Education (beginning and end of school year), Upper
Secondary Education, Special Education or in syntheses such as The Education System of Romania,
Yearly Romanian Statistical Book, etc.At request, the National Institute of Statistics database (TEMPO)
can also be accessed.All questionnaires are available in word and excel formats at INS website.
The definition of an out-of-school child used in the INS survey is the following: a child who is of school
age but is not enrolled in any educational or vocational program. The drop-out is defined in this context
as the case when a student enrolled at the beginning of a school year stops attending the classes and
fails to finalise that year. Drop-out rate indicator is calculatedtherefore as the ratio between the school
population enrolled at the beginning of the school year and the number of students enrolled at the end
of the year.

14
However, the schools are reporting data also based on the ”administrative” definition of drop-out,
stating that a student is officially considered as drop-out only when he/she is more than two years older
than the official age corresponding to a specific grade. The lack of clarity and precision in definitions
and insufficient harmonisation/coherence between relevant definitions/regulations lead to
methodological dysfunctions/problems. These comprise the inaccurate/ambiguous definition of
students’ academic status in grade book sections and the lack of harmony/coherence between
definitions and rules on how non-attendance should be documented (drop-out, withdrawal, grade
retention, other situations, etc.) as specified in the Organisation and Operating Rules, in the instructions
on completing specific grade book sections, and in the guidelines for completing school participation
statistical questionnaires (SQs) administered by INS.
Another data source, in relation with the economic background of the students is the Household
Budget Survey (HBS), conducted also by INS. The data are collected each month on a sub-sample of
3,120 households. The sampling unit is the household. Sampling (the smallest administrative area for
which out-of-school population data are statistically accurate) or regional coverage of schools (NUTS-II
level). The periodicity of data is Quarterly and Annually. The data may be disaggregated by gender,
age, area, wealth quintile.
The definition of out-of-school children used in this survey is the following: school-age population with
other occupational status than that of students. The collected, processed and aggregated statistical
data are published and disseminated on a quarterly and yearly basis. The main limitations arising from
the specificity of the HBS questionnaire are the following:
The students who never attended pre-primary education could not be accurately identified; this
situation is due to the fact that in the case of the information regarding the family members’ current
status the answer options in the questionnaire do not include the status enrolled in kindergarten.
For family members who are over 15 years of age, the school enrolment situation cannot be
accurately detected as the data collection tool focuses on their situation on the labour market
(employed/unemployed) and not on their school situation (enrolled/not enrolled in education).
If data included in the OOSC tables was not available (e.g. data on ethnic origin), additional sources
were used where available, including official data provided by the Ministry of Education, Research and
Youth (MECTS) and National Authority for Child Protection (ANPC) or data from relevant thematic
reports conducted on representative samples of population. The years used in this case are different,
In order to better understand the existing data, specific individual semi-structured interviews were
conducted with stakeholders involved in policies relevant of OOSC, both from national, county and
regional level4. In particular the report used the input of decision-makers and experts from MECTS
(Directorate for LLL), ANPC, Institute of Education Sciences (ISE) and INS.
* * *
4 Interviews were conducted with representatives of the county structures of MECTS (Country School
Inspectorates, CJRAE and CCD) from Neamț, Brașov, Caraș-Severin, Arad, Ilfov and București.

15
The current report will explore current challenges and barriers in developing and diversifying
educational opportunities to reintroduce young people who left school prematurely in the system. A
particular attention is given to the new policy developments related to: multiplying the second-chance
programs; implementing Community Lifelong Learning Centres created by the new Law of National
Education; using the opportunities for the assessment and certification of non-formal and informal
learning (i.e. lifelong learning portfolios, access to competence assessment and certification services
etc.) but also other grassroots initiatives aiming at promoting efficient information and access to
continuous training opportunities.
The Report is therefore more than a dynamic picture of the children who dropped out or are at risk of
dropping out, exploring the effectiveness of current policies aiming at ensuring equal opportunities and
facilitating access to quality education and training in school education. Moreover, the analysis is also
focused on the administrative capacity of the institutions that coordinate the national education system
and development of human capital in the education system and on the main existing programs aiming
at ensuring a coherent and modern framework for the functional parameters of the system, including
management capacity, teacher training and appropriate physical and financial resources.
The current research which focuses on children not attending school from primary and lower secondary
level is extremely relevant for the Romanian education system. After more than four years of delays,
revisions and constitutional complaints a new, complex reform is currently implemented at all system
level, following the new Law of Education Act (1/2011): secondary legislation is developed
(methodologies, guidelines, tools), institutional settings are changed, new priorities are set while the
new policy context places a special emphasis on equal chances and access to education and training
of children from groups at risk of social exclusion
At the same time, at European level, Europe 2020 Strategy sets the target for the share of early
leavers in the education and training system under 10% by 2020. Romania set as objective of lowering
the rate of early school leavers in the education and training system to achieve the percentage of
14.8% by 2014, 12.8% by 2017 and 11.3% by 2020. Ensuring equal access to education and training is
one of the most important policy intervention areas indicated by the Ministry of Education, Research,
Youth together with quality assurance and increasing the efficiency of the national education system,
ensuring a fair, stable, predictable and sustainable education system and encouraging lifelong learning.
The Eurydice Report (2011) indicates that the objective depends among others on the favourable
evolution of the economy, with effects on the possibilities of socially and economically disadvantaged
families to support participation in education and also on the capacity of the central and local authorities
to promote relevant policies for children and families at risk. Our analysis aims at offering a useful
review of existing children needs in relation with school attendance, of main challenges hindering
participation to education and effectiveness of policies currently targeting these children.
The understanding of the main dimensions of exclusion was inspired by the Conceptual and
Methodological Framework (CMF) of the OOSC initiative. According to the CMF, there are five main
dimensions of exclusion, including two dimensions that capture the out-of-school population of
primary school age (Dimension 2) and lower secondary school age (Dimension 3). Pre-primary
education is represented by Dimension 1, which highlights children of pre-primary school age who are
not in pre-primary or primary education. The approach includes also Dimensions 4 and 5 that focus on
children who are in school but are at risk of dropping out.

16
The assumption of the global initiative and of the Romanian report is that understanding more about
these groups of children is key for reintegration in the education and training systemand/or for
preventing them from becoming the out-of-school children of tomorrow. Combining the out-of-school
and at-risk dimensions, it is possible to set out specific groups of children who are not participating in
the intended level of education for the intended duration and at the intended age. The Five Dimensions
listed below are displayed in Figure 4.
The Five Dimensions of Exclusion (5DE)
Dimension 1: Children of pre-primary school age who are not in pre-primary or primary school
Dimension 2: Children of primary school age who are not in primary or secondary school
Dimension 3: Children of lower secondary school age who are not in primary or secondary school
Dimension 4: Children who are in primary school but at risk of dropping out
Dimension 5: Children who are in lower secondary school but at risk of dropping out
Figure 4. Five Dimensions of Exclusion (5DE)
Dimension 1 represents a group of children who do not benefit from pre-primary education and who
may therefore not be adequately prepared for primary education, placing them at risk of not entering
into primary education or, if they do enter, at risk of dropping out. Although pre-primary education
programmes may be longer than one year, the 5DE propose a standard approach for all countries by
focusing on pre-primary participation of children in the year preceding the official entrance age into
primary school.
Each of the out-of-school Dimensions 2 and 3 is divided into three mutually exclusive categories
based on previous or future school exposure: children who attended in the past and dropped out,
children who will never enter school, and children who will enter school in the future. This typology of
children out of school is adopted from the 2005 report by UIS and UNICEF. OOSC of primary or lower
secondary age who completed primary education are distinguished from children who did not complete
the full primary cycle before leaving school. These groups of children are identified separately within the
out-of-school Dimensions 2 and 3.
Out of
school
In
school
Primary age children Lower secondary age children
Dimension 4
At risk of
dropping out of
primary school
Dimension 5
At risk of dropping
out of lower
secondary school
Dimension 2
Attended
but
dropped
out
Will never
enter
Will enter
late
Dimension 3
Attended
but
dropped
out
Will never
enter
Will enter
late
Dimension 1
Not in pre-
primary school
Pre-primary
age children
Primary school students Lower secondary school students

17
Children in Dimensions 4 and 5 – those in school but at risk of exclusion from education – are grouped
by the level of education they attend, regardless of their age: primary (Dimension 4) or lower secondary
(Dimension 5). This is different from Dimensions 2 and 3, which group out-of-school children by their
age: primary age (Dimension 2) and lower secondary age (Dimension 3). The framework thus covers
two different types of populations: the population of out-of-school children of school-going age, and the
population of at-risk pupils of any age in primary or lower secondary school.
Chapter 1: Profiles of Excluded Children
1.1. Profiles of Children in Dimension 1
For the reference period of this Report (2005-2009), the share of pre-primary age children (3-6 years
old) out of school accounts for 18-20% of the total number of children of this age over the five-year
period of analysis. The trend, with some variations, is indicating a slight decrease, mainly due to the
increase of school enrolment in rural areas in recent years – Table 1.
Following the Conceptual and Methodological Framework, in the case six years old children in
Dimension 1 - one year younger than Primary entrance age – around 14,000 children are out of school,
based on UIS/INS calculations,in 2009. This accounts for 6.4% of total population of this age, the value
of the indicator placing Romania close to Belarus, Repubilc of Moldova, and Bulgaria from CEE/CIS
countries.
Table 1: Percentage of pre-primary age children (3-6) in pre-primary or primary education, by
gender and other characteristics, 2009/2010
Not enrolled Enrolled in pre-primary school
Enrolled in primary school
Enrolled in either pre-primary or
primary
Male
Urban 16.79 78.98 4.23 83.21
Rural 20.86 74.20 5.12 79.14
Total 18.76 76.58 4.66 81.24
Female
Urban 15.71 79.60 4.69 84.29
Rural 19.19 75.15 5.66 80.81
Total 17.40 77.44 5.16 82.60
Source: INS, 2011
The share of pre-primary age boys (3-6 years)not enrolled in pre-primary or primary education
accounts for approximately 19 -20%, showing a decreasing trend: from 20.36% during the 2005/2006
school year to 18.76% in 2009/2010. For girls, the indicator reaches values of nearly 18% in the first
two years of the period and 17.4% in the last three years. Hence, as indicated in the Table 1 above, the

18
share of pre-primary age children enrolled in pre-primary or primary education for school year
2009/2010 does not show important gender-based differences (GPI =1.02).
The number of children out of school from rural areas is continuing to be higher in comparison with
those from urban areas, both in the case of boys and girls. For example, the indicator value for boys is
3 percentage points higher in urban areas than in rural areas. However, the general trend is a reduction
in these differences: from approximately 7 percentage points in the 2005/2006 school year (16.2% in
urban areas and 23.4% in rural areas) to 4 percentage points in 2009/2010 (16.7% and 20.8%
respectively). The diminution of differences is mainly generated by a drop in the share of children not
attending school in rural areas (from 23.4% to 20.8%), while in urban areas the indicator value is
constantly around 16-17%.
Residential differences are also noticed in girls: for those who live in urban areas, the analysed
indicator accounts for approximately 14-15%, whereas for rural girls it gets to 20-22%. During the
2005/2006 school year, the greatest difference is actually reported – 8.22 percentage points. Still, this
difference takes a significant dive to less than half in the last year of the reference period – 3.48
percentage points, as a direct consequence of the reforms in the early education field, in general, and
in development of rural education, in particular (a clear picture of these policies is presented in the
Chapter 3 of the Report).
The data analysis for the reference period also highlights the fact that the share of pre-primary age
children not attending school, both in the case of boys and of girls, is generally below 20%, with a
decreasing trend in the last years of the reference period. The value of the indicator in question is
higher in rural areas, both in boys and in girls, though showing the same declining trend.
The data indicated by the Household Budget Survey (HBS), indicates a range of differences in relation
with the economic background of the pre-primary age children not attending school. As a general trend,
these differences can be observed in the category of children from the poorest quintile and from the
other categories, ranging between 2 and 6 percentage points. The influence of the resources of the
family remains however to be further researched due to the limitations of HBS methodology5 (see also
Annex 3 of the Report).
Data on Roma children from a recent survey co-ordinated by the NGO RomaniCriss conducted on a
sampleofRoma adults with at least one out of school child (N=985)6 indicates a major gap concerning
the participation at pre-primary education between the total pre-school age population and Roma
minority. The results of the survey published in 20117, based on data collected in December 2009 –
January 2010, highlights the disadvantaged situation Roma children currently face: the specific
5The students who never attended pre-primary education could not be accurately identified; this situation is due to
the fact that in the case of the information regarding the family members’ current status the answer options in the
questionnaire does not include the status enrolled in kindergarten.
6 In the sample were included 56 Roma compact communities from 30 counties (out of existing 41) and Bucharest
city. The size of the sub-samples corresponds to the shares of the population based on 2002 census data.
7 Laura Surdu (coord.), Participare, absenteism şcolar şi experienţa discriminării în cazul romilor din România
[Attendance, absenteesm and the discrimination experience in the case of Roma in Romania], Romani Criss,
UNICEF, Bucharest, 2011.

19
enrolment rates for the pre-school age are ranging between 4% (in the case of 3 years old) and 23%
(in the case of 6 years old).
Table 1b. % Roma children of pre-primary age from families with at least one out-of-school child
enrolled in pre-primary or primary education (%), by age and level (ISCED 0 and 1)
Age Pre-school level (ISCED 0) Primary level (ISCED 1)
3 4.3 (N = 116) 0.0
4 10.1(N = 128) 0.0
5 15.6 (N = 146) 0.0
6 22.9 (N = 118) 5.0 (N = 118)
Source: Romani Criss, 2011
In comparison with the INS data calculated for all children of pre-primary school age (3-6 years old)
enrolled in pre-primary or primary education (Table 1c), we could observe that in the case of children in
Dimension 1 (6 years old) the gap in enrolment is more than 55 p.p. in the case of children in pre-
school level and around 15 p.p. in the case of primary level, indicating a clear disadvantaged situation
of the Roma children.
Table 1c. Children of pre-primary age enrolled in pre-primary or primary education, by age and
level (ISCED 0 and 1)
Age Pre-school level (ISCED 0) Primary level (ISCED 1)
3 61.7 0.0
4 78.9 0.0
5 86.4 0.0
6 79.7 19.2
Source: INS, 2011
Due to the current difficulties in identifying the total number of Roma children we could not accurately
assess the share of children of this minority in the total share of pre-school age children not attending
school. In a comprehensive report of Roma, Fleck and Rughiniș discuss in detail the complex problem
of auto and hetero-identification of Roma population (2008, p.45-51), highlighting the main causes
leading to this challenge8. Nevertheless we could notice that the survey data indicates a worrying
situation, with a huge enrolment gap between the general population and Roma children. Since the lack
of school experience before enrolling in the primary education is one of the main risk factors for
dropping out, this situation calls into attention the need for developing the policies aiming at closing the
gap and offering the Roma children this experience.
8 The study is available at: http://www.anr.gov.ro/docs/Publicatii/Vino_mai_aproape.pdf.

20
The economic and social disadvantage seems to increase even further the risk of children in dimension
1, the main reasons given by the Roma parents in relation with the non-schooling situation of their pre-
school age children are related to the lack of resources (mainly clothes, shoes and food). However,
there are also parents expressing their belief that small children are better off at home and that they
have to take the children with them when migrating for work in another area. Also there are issues
related to the discriminatory attitudes of the majority population or the supply of pre-primary education
(i.e. the distance to kindergarten, lack of transport facilities, insufficient study space etc.).
The same survey indicates that the situation seems to be equally difficult for Roma children living in
rural and in urban areas, while there are no important gender differences. However, the evidence to
support these findings should be further detailed by new research. At the same time, it should be
investigated if the small regional disparities observed in the case of the total pre-school population not
attending school are higher in the case of Roma children.
No official recent data on children with disability of pre-school age not attending kindergarten is
available. An ad-hoc survey of National Authority for Child Protection made within the framework of
documenting this Report, based on county structures reports, indicated that currently there are 3240
children with a disability in the age group 3-6 that are not attending school, out of which 364 have a mild
handicap, 1598 have a medium handicap and 1278 have a severe handicap (ANPC, 2011). This
represents three per cent of the total number of children in the 3-6 age group, but we consider that this
number is under-estimated. In recent years, the trend of decreasing the number of children in special
education schools and enrolment of children with disabilities in mainstream education without sufficient
support increased the risk of non-schooling or drop out (Horga et al, 2009).
1.2. Profiles of OOSC in Dimension 2
The data from UIS and INS sources points out that in 2009 more than 65000 primary age children
(between 7 and 10 years)were not attending school, accounting for 8% of the total number of
children in this age cohort. The categories of children highly affected are the boys (both in rural and
urban areas), children from families with economic disadvantage (from poorest quintile), children of
Roma minority and those with special education needs.
The percentage of children who dropout each year in primary education varies for the overall
population during the reference period of the Report between 1.8% (in 2007/2008) and 1.4% (in the last
2 years of the period). As seen in the data included in Table below, the trend reported in the overall
school population is a rising one in the first three years of the period and a decreasing one in the last
years:
Table 2 Children of primary school age who dropped out (%) (2005/2009)
Male Female Total
2005-2006 1.70 1.30 1.50
2006/2007 1.90 1.50 1.70
2007/2008 2.00 1.50 1.80
2008/2009 1.60 1.30 1.40
2009/2010 1.60 1.30 1.40

21
Source: INS
A constant gender gap may be noticed, in favour of girls: the value of the
Primary dropout rate is 1.6 in case of boys and 1.3 in case of girls. The GPI reaches values between
0.75 and 0.81, with a decreasing trend in the last two years.
Nonetheless, the above-mentioned trends are related to the age falling within the official primary school
age group. Thus, if in the case of 7-year-olds the reported drop in the percentage of children attending
school is of only one percentage point (from nearly 97% to 96% in the last years), for the ages of 8 and
9 years the drop is of 4 percentage points: from 98% to 94%, and from nearly 99% to 95% respectively
(Table 2, Annex).
Figure 5. Average school enrolment rate by age and gender, 2005-2009
Source: INS
The data shows that primary school boys are noticed to show a higher dropout record, while for
the girls of the same age the risk is more related to not attending school at all. Primary school
age population taken as a whole reports a continuous increase in the share of out-of-school children,
which practically doubles during the reference period: from 3.33% to 6.48%. The trend is similar for
both population segments – male and female, however the percentage of dropouts is constantly higher
in boys than in girls (GPI varies between 0.75 and 0.81), despite a gap-decreasing trend in the last two
years.
0.0
10.0
20.0
30.0
40.0
50.0
60.0
70.0
80.0
90.0
100.0
3 4 5 6 7 8 9 10 11 12 13 14 15 16 17 18
Age
Male schoolenrolment 2005 -2009 (%)Female schoolenrolment 2005 -2009 (%)
Oficial age range for Primary education (7-10)
Oficial age range for Lower Secondary education (11-14 )
Oficial age range for Upper Secondary education (15-18)

22
The lack of gender disparities at primary school ages is also highlighted by the indicator adjusted net
enrolment rate (ANER), by gender9. Thus, the GPI for this indicator is 1 in four of the five reference
years; in 2007/2008, the GPI was 1.01 (Table 3, Annex).
As for the trend of indicator values, it is naturally similar to the one reported for the percentage of
children attending school, namely a drop from nearly 97% as recorded in the 2005/2006 school year to
93.52% in 2009/2010 for the overall population, from 96.73% to 93.66% in boys and from 96.60% to
93.38% in girls.
Figure 6. Average school non-enrolment rate by age and gender, 2005-2009
Source: INS
The percentage of primary school age out-of-school children, by age, reaches the highest level at
the age of 7 years. Approximately 5-6% of these children are however enrolled in pre-primary education
although they are older than the official primary school entrance age. As regards the trends in the
indicator values for the overall population, they are highly ascending at almost all primary school ages.
Hence, at the ages of 8, 9 and 10 years, the indicator value triples by the end of the analysed period
9 The age-specific enrolment rate captures the percentage of a given age population that attends school (at any
level). The adjusted net enrolment rate captures the percentage of a certain school age population which attends
the given level or a further level. For example, the primary net enrolment rate is the percentage of primary age
children who are enrolled in primary or secondary. Children of this age in pre-primary are not counted as “enrolled”.
0
2
4
6
8
10
7 8 9 10 7 8 9 10 7 8 9 10 7 8 9 10 7 8 9 10
2005/2006 2006/2007 2007/2008 2008/2009 2009/2010
Male
Female

23
compared to the first year: from nearly 1.5-2% to 5-6%. At the age of 7, although some rise has also
been noticed, it is of nearly 2 percentage points (Table 8, Annex).
The trends reported for the overall population are generally found in the male and female population
segments. For boys, the rise at all ages is slightly stronger than for girls. Hence, in girls the percentage
of primary school age out-of-school children goes up 2-3 times (from roughly 2% to almost 5-6%), while
in boys it rises by 3-5 times (for example, 8-year-old boys show an increase in the Primary out-of-
school rate from 1.06% to almost 6%). At the age of 7, the value of the indicator, both in girls and in
boys, rises by 2 percentage points, the same as in the overall population. The difference is that while
boys show a rise from nearly 9% to 11%, in girls the indicator variations are between 8% and 10%. Still,
the analysis of the out-of-school rate values for the reference period underlines the fact that girls are
more often disadvantaged than boys, as proven by the GPI.
Figure 7. Percentage of primary school-age children out of school, by wealth index quintile
Source: HBS, National Institute of Statistics.
The percentage of out of school children is registering important variations by wealth index quintiles.
According to the Household Budget Survey (HBS) data, the percentage is constantly reducing from the
first quintile (poorest) to the last quintile (richest). This trend is observed for poorest/richest quintile for
the total number of primary school age children (Fig, 7) especially in the case of the years 2005, 2007
and 2009, irrespective of gender or area of residence (urban/rural). However, for other quintiles, there is
only a constant decrease in 2007, while in the case of other years this trend could not be observed.
In the reference period of the report, the differences between the lowest and the highest out of school
children percentage are ranging between 2 and 8 percentage points, as indicated in the chart below.
The HBS data should however be cross-checked as the variation is important from one year to another
and no specific causes could be indicated for explaining it.
0.00
2.00
4.00
6.00
8.00
10.00
12.00
14.00
16.00
18.00
2005 2006 2007 2008 2009
Poorest Second Middle Fourth Richest

24
Figure 8. Percentage of primary school age children out of school, poorest and richest quintile
Source: HBS, National Institute of Statistics.
Important differences could be identified also in the case of school enrolment of primary age children
between the majority population and Roma minority. As indicated by the research of RomaniCriss and
UNICEF presented in the previous chapter of the report, out of 597 children aged at 7-11 years old from
families with at least one child out of school, almost half of them (44,2%) are not attending any school
program.
Another relevant research (Fleck and Rughiniş, 2008) highlights the disadvantaged situation of the
Roma children schooling10. In comparison with non-Roma members of the same communities, the
percentage of children with no school experience in the 7-13 years old group age is two time higher and
in the 14-17 years group age is more than three times higher. Moreover, the percentage of Roma
children not graduating lower secondary education (not completing basic education) is more than 10%
higher than the one of the non-Roma children from the same communities surveyed.
Table 3 Highest educational attainment of out-of-school Roma children [2007](%)
7-13 years old 14-17 years old
Never attended school 14.6 11.0
Primary education not completed 40.2 12.3
Primary education graduated(including special education)
19.7 12.1
Lower secondary education not completed 21.4 28.4
10The methodology of the study is based on a household survey including 2155 persons from communities with a
Roma minority. The study included two samples: one Roma (1070 persons) and one comparative, non-Roma (954
persons) - p.16. There were 3% Roma persons in the non-Roma sample and 3% non-Roma in the Roma sample.
0.00 2.00 4.00 6.00 8.00 10.00 12.00 14.00 16.00 18.00
2005
2006
2007
2008
2009
Poorest
Richest

25
Lower secondary education completed (including special education)
4.0 25,2
Source: Data calculated based on the Table 10-1 of the report Vino mai aproape. Incluziunea şi excluziunea în societatea
românească de az i[Come closer.Inclusion and exclusion in contemporary Romanian society],2008, editors Gabor Fleck and
Cosima Rughiniş, p. 165.
For comparison, as we have seen, in the case of children of Primary level age (7-10) the total
percentage of out of school children is around 8% while in the case of children of lower secondary level
age (11-14) the same indicator has a value of 5.4%.
Children with disabilities represent also an important category in the case of drop out phenomenon in
the primary level. The National Agency for Child Protection data indicates that more than 2700 children
with severe handicap aged of 7-10 years old are not attending school (see for details Table 25, Annex).
In the case of children from the age group 3-14 years, a higher proportion of boys could be observed
(5372 compared with 4084 girls), but further research of the situation of children with special education
needs (SEN) is necessary, especially in the case of those included in the mainstream education, to
understand better the current disparities based on gender, area of residence or type of disability.
Due to the lack of available data, it is not possible to explore the drop-out rate of primary or lower
secondary age children with disabilities by gender, area of residence or wealth quintiles. However, as
could be observed in the table below, according to ANPC administrative data, boys account for 57% of
the total population of children with disabilities out of school (age 3 to 14). Moreover, children with
disabilities from the rural area have a higher share in comparison with the urban area.
Table 4. Children with disabilities out of school, by type of handicap*, age group, gender and
area of residence, 2011
3-6 years
old
7-10
years old
11-14
years old girls boys urban rural total
Mild handicap 364 23 33 193 227 184 236 364
Medium handicap 1490 364 393 1009 1238 1166 1081 1490
Severe handicap 1211 479 521 926 1285 945 1266 1211
Very severe handicap 3805 2454 2369 3734 4894 3761 4867 3805
Total 6870 3320 3316 5862 7644 6056 7450 6870
*As defined in the Law 448/2006 related to the protection and the promotion of rights for disabled persons;
Data source: ANPC

26
1.3. Profiles of OOSC in Dimension 3
According to INS and UIS data, in 2009 there are almost 50,000 children of lower secondary age (11-14
years) out of school, accounting for more than 5% of the total number of children of this age. As
indicated in the Table 4, in recent years the number of children of lower secondary age not attending
school slightly decreased, while the number of children of primary age not in school increased by more
than a half.
Table 5. Number and percentage of children out of school, by age group and gender
Male Female Total
2005/2006 Number Percent Number Percent Number Percent
Primary school age 14843 3.27 14666 3.40 29509 3.33
Lower secondary school age 19330 3.82 18554 3.85 37884 3.84
2006/2007
Primary school age 19467 4.29 19062 4.41 38529 4.35
Lower secondary school age 23868 4.89 23999 5.15 47867 5.02
2007/2008
Primary school age 23938 5.28 24101 5.59 48039 5.43
Lower secondary school age 25635 5.44 26086 5.81 51721 5.62
2008/2009
Primary school age 28090 6.21 27829 6.47 55919 6.34
Lower secondary school age 25431 5.53 24972 5.70 50403 5.64
2009/2010
Primary school age 28220 6.34 27885 6.62 56105 6.48
Lower secondary school age 23882 5.27 24306 5.64 48188 5.45
Source: INS
As in the case of passing from primary to lower secondary level, the end of the eighth grade represents
a challenge for a category of students that are giving up their formal education. Even if the finalisation
of the compulsory education is reached in the tenth grade (corresponding to a theoretical age of 16),
more than 10% of the children are already out of the education system by the age of 14 – see Figure 9
below.
In the case of boys we notice an oscillatory descending trend at the age of 11 (94-98%), relatively
constant trends at the ages of 12 (approximately 99%) and 13 (92-93%), and a decreasing trend at the
age of 14 (from 94% to approximately 90-91%). The indicator values for girls and their trends are as
follows: at 11 and 12, the percentage of children attending school shows an oscillating yet slightly on-
the-rise trend, falling between 95-97% and between 97-99% respectively, while at 13 the trend is rather
constant (92-93%), and at 14 there is a decreasing trend – from over 96% to 91-92%.

27
Fig. 9. School enrolment by age, level of education and gender (%), 2009/2010
Legend:
Calculated based on data from National Institute of Statistics, 2011.
With regard to gender-based differences in the percentage of children attending school, by age, at all
ages and in all the years of the reference period they are generally below 1.5 percentage point (with
some exceptions at certain ages and in certain years) and they are alternately in favour of girls and
boys. Hence, the data make us conclude that gender inequalities are not constantly in favour of one
population segment – male or female. The lack of gender disparities at lower secondary school ages is
in fact also highlighted by the indicator adjusted net enrolment rate (ANER), by gender. Hence, the
GPI for this indicator is 0.99 during the entire reference period of the Report (Table 3, ANNEX).
The trend recorded by the values of this indicator is slightly decreasing in 2006 compared to 2005 (by
one percentage point), reaching a stable point at approximately 90%. The trend is identical in boys
(from 91% to 90%) and in girls (from 92% to 91%).
The percentage of dropouts in the male lower secondary school population segment varies between
1.7% (in 2009/2010) and 2.5% (in 2006/2007 and 2007/2008). As noticed in the data included in Table
5, the trend recorded in the last three years is continuously decreasing, with a drop of 0.8 percentage
points over this period. Moreover, it is noticed that the indicator level is higher than the one reported in
primary school boys.
Upper secondary Lower secondary Primary Pre-primary Not enrolled

28
The percentage of lower secondary school age out-of-school children, by age, for the overall
population, shows rising trends at two of the lower secondary school ages. Hence, at the age of 11,
despite some variations, the lower secondary out-of-school rate goes up from nearly 3% to over 5%,
and at the age of 14 years, where the highest share of out-of-school children is detected, the rise is
from almost 5% to roughly 8-10%.The high percentage of children 14 years old out of school is
explained also by the decrease of the school age from 7 to 6 years old. As a consequence, at 14 years
a part of this population should already be in the upper secondary level. However, a significant
proportion of the children of this age are finalising their studies only by graduating the lower secondary
level and not making the transition to upper secondary. At the ages of 12 and 13 years, the trends are
rising and falling, but unlike 12-year-olds, where the lowest share of out-of-school children is recorded
(between 1 and over 2%), 13-year-olds show a much higher percentage - between 6% and 8% (Table
9, Annex).
The trends recorded in male and female school populations are relatively similar. Lower secondary
school age population taken as a whole reports a rise-and-fall trend in the share of out-of-school
children, alternating between 9% and 10%. Both in boys and in girls, the indicator values rise after the
first year of the period and become relatively stable in the following years. However, the rise is from
nearly 9% to 10% in boys, and from 8% to 9% in girls. At the same time, we notice gender inequalities
related to this indicator, with a GPI between 0.86-0.93.
As in the case of primary level, the percentage of out of school children of lower secondary age is
registering important variations by wealth index quintiles. According to the Household Budget Survey
(HBS) data, the percentage is constantly reducing from the first quintile (poorest) to the last quintile
(richest) and this trend is observed in the total number of lower secondary age children out of school,
and is maintained irrespective of gender, area of residence or region. In the reference period of the
report, the differences between the lowest and the highest out of school children percentage are
varying between 4 and 6 percentage points, 2005 having the largest gap (Fig. 10).
The data indicates that poverty has an important impact on children of primary and lower secondary
school age, and it is expected that the effects of the prolonged economic crisis will increase the out-of-
school rates and dropout rates of children with disadvantaged socio-economic background.
Major differences could be identified also in the case of school enrolment of secondary age children
between the majority population and Roma minority. The research of Romani Criss and UNICEF
indicates that out of 636 children of 12-16 years old, two thirds (64,62%) are in the situation of not
attending school.

29
Figure 10. Percentage of lower secondary school age children out of school (poorest and
richest), 2009
Source: HBS, National Institute of Statistics.
Main reasons indicated in the Romani Criss study related to school drop out for both primary and lower
secondary Roma students are related to economic reasons, absent parents or negative attitude of
family in relation with education, influence of peers or elder brothers, different disabilities or medical
problems, and early marriage. The economic disadvantage of many Roma families isleading to,
according to the study, child labour. Less than a third of parents with at least one child that dropped out
(29,2%) declares that this child is not working at all while more than a half (56,4%) indicate that the
child is working occasionally or frequently in the household and more than a fifth (22,7%) indicate that
the child is working occasionally or frequently outside the family. Unfortunately in Romania the last
survey on child labour was conducted almost 10 years ago and no recent data is available to compare
this situation with the one from majority population.
Children with disabilities of lower secondary age represent another category of concern, having almost
the same share in total as the ones of primary school age. According to the National Agency for Child
Protection, the most affected are children with severe and very severe handicap (Table 25, Annex).
However, as in the case of children dropping out fromprimary school, further research of the situation of
children with SEN is necessary, especially in the case of those included in the mainstream education, to
understand better the current disparities based on gender, area of residence, region/counties, type of
disability and financial situation of the family.
0.00
2.00
4.00
6.00
8.00
10.00
12.00
14.00
16.00
18.00
2005 2006 2007 2008 2009
Poorest Richest

30
1.4.Profiles of Children at Risk in Dimension 4
One indicator which highlights the potential risk of exclusion is the percentage of new entrants to
primary education with no Early Childhood and Care Education (ECCE) experience. In the overall
population, the values of this indicator generally show a decreasing trend, reaching levels between
12.9% in 2005/2006 and 8.9% in 2009/2010 (Table 18, Annex). Based on the gender criterion, the
highest rate of new entrants to primary education with no ECCE experience is noticed in boys both from
urban and rural areas. GPI varies between 0.84 and 0.94 for the overall population, between 0.78 and
0.89 in urban areas, and between 0.91 and 0.95 in rural areas. Taking into account the area of
residence, with the exception of the 2005/2006 school year, the indicator values showed constant
differences to the advantage of rural areas for both male and female population segments. Data also
underline the fact that in general, according to this indicator, the population most at risk are rural area
boys, who in the last four years reported the highest percentage of new entrants to primary education
with no ECCE experience.
Unlike the previous indicator, the 2005-2009 repetition rate for the overall population has generally
followed a continuously rising curve. Hence, for 2nd
grade the indicator rises from 2.3% to 2.7%, for 3rd
grade from 1.2% to 1.8%, and for 4th grade from 1.5% to 1.8% - Table 6. One exception is the first
grade where we observe a decrease from four to almost one per cent, situation influenced by the
provisions related to the fact that repetition in not allowed in the first grade.
Table 6. Repetition rate at the primary and lower secondary level of education by grade and area
of residence
Year Residence Grade
1 2 3 4 5 6 7 8
2005/2006 Urban 2.3 1.5 0.8 1 2.8 2.3 2.8 1.9
Rural 5.5 3 1.4 1.9 3.8 2.6 2.7 2.2
Total 4.0 2.3 1.2 1.5 3.3 2.5 2.7 2.0
2006/2007 Urban 0.7 1.1 1.1 0.8 2.9 2.2 2.4 1.8
Rural 1.1 2.1 1.8 1.5 3.8 2.3 2.4 1.9
Total 0.9 1.6 1.5 1.2 3.3 2.2 2.4 1.8
2007/2008 Urban 0.5 1.7 1.1 1.3 2.6 2.4 2.8 1.8
Rural 0.9 3.5 2.0 2.5 3.3 2.7 3.1 2.1
Total 0.7 2.6 1.5 1.9 3.0 2.5 2.9 2.0
2008/2009 Urban 0.4 1.7 1.1 1.1 3.5 1.9 2.7 1.6
Rural 1.0 3.4 2.2 2.2 4.8 2.3 2.9 1.9
Total 0.7 2.6 1.7 1.7 4.1 2.1 2.8 1.8
2009/2010 Urban 0.5 1.7 1.2 1.1 3.1 2.4 2.2 1.5
Rural 1.2 3.7 2.3 2.4 4.6 3.2 2.6 2.0
Total 0.9 2.7 1.8 1.8 3.8 2.8 2.4 1.7
Source: INS
The above-mentioned trend, especially for 2nd
-4th grades, is mainly influenced by the evolution of the
indicator values in rural population, where repetition rate shows more significant rises (from 3% to 3.7%
- 2nd
grade, from 1.4% to 2.3% - 3rd
grade, and from 1.9% to 2.4% - 4th grade), while in urban areas the
same grades show a relatively constant trend (1.5%-1.7% - 2nd
grade, 0.8%-1.1% - 3rd
grade, and 1%-

31
1.1% 4th grade). In 1
st grade, repetition rate drops substantially in the two population segments, just like
in the case of the overall population, and in the last year of the reference period it gets to less than a
quarter of the first year value.
Residential area differences are noticed not only in relation to repetition rate trends, but also to its
actual values. Thus, in rural areas the indicator reaches double or almost the double value in all four
primary school grades during the reference period.
Grade-to-grade comparisons show that the lowest repetition rate is generally reported in 1st grade (less
than 1% for the entire period, except for 2005/2006, before the regulation not allowing the repetition in
the first year to be passed and applied in the system). The highest rate is observed in 2nd
grade (over
2.5%), due to the fact that often primary teachers only post-pone their decision to make a student
repeat the year.
Looking at areas of residence, we notice the same grade-to-grade trend, with the main difference, as
already mentioned, regarding the quantum of indicator values corresponding to areas of residence.
Unlike the repetition rate, the primary education dropout rate by grade, for the overall population,
reports rise-and-fall values, with a rather decreasing general trend. The dropout rate values for the
years marking the beginning and the end of the reference period are the following: 2nd
grade – 1.4%
and 1.2% respectively (1.7% and 1.6% in 2006/2007 and 2007/2008 respectively); 3rd
grade – 1.2%
and 1.1%, (1.6% in 2006/2007 and in 2007/2008); 4th grade – 1.3% and 1.2% respectively (1.5% and
1.6% in 2006/2007 and 2007/2008). 1st grade indicator values are kept at 2.1-2.2% (Table 20, Annex).
The trends mentioned for the overall school population are also similar to those in urban and rural
population segments. Taking the same criterion into account – the area of residence – we see that the
advantage (which in most cases falls between 0.1-0.3 percentage points) for each of the four grades
goes in some years to rural populations and in other years to urban areas.
The grade-to-grade comparison reveals that the highest dropout rate is reported in 1st grade – over 2%,
while in the other grades the rate reaches +/-1.5%. The same trend is generally noticed in relation to
areas of residence.
The survival rate11
for the cohorts analysed between 2005 and 2010 is 92% - 94% (Table 21, Annex).
The highest value of the indicator is reported at the beginning of the reference period (94.1% - in the
2005/2006 school year), and the lowest in the following year (92.5% - in 2006/2007). The difference
between the highest and the lowest indicator values is 1.6 percentage points. After the 2006/2007
school year where the lowest survival rate was recorded for the cohort attending primary school in the
period 2003 – 2007, there has been a slightly continuously rising trend until the end of the analysed
period, without however reaching the value of the cohort that graduated from primary school in the
2005/2006 school year.
11 The survival rate was calculated as the share of pupils enrolled in the first grade of primary level who reached
the final grade of the lower secondary level in the total number of pupils enrolled in the first grade of primary level in
a given period of time.

32
The survival rate is a relevant indicator for understanding better the categories of students at risk of
dropping out. For example, the analysis of this indicator by gender shows non-significant differences
(0.7 – 1.9 percentage points), constantly to the advantage of girls. The GPI highlights the lack of gender
inequalities, with a value between 1.00-1.02.
The primary education dropout rate for the overall populationis rising and falling, showing a
decreasing trend in the last 2 school years, when it reaches 1.4% (from 1.8% in 2007/2008) - Table 22,
Annex. Similar trends are noticed in urban populations, the lowest values, reported in 2008/2009 and
2009/2010, being of 1.3% and 1.5% respectively (compared to 2.1% in 2006/2007). In rural area, the
trend is relatively constant, the most frequent rate being 1.4%. A cause of the fluctuation from year to
year in the dropout rate by grade and for the overall population could be found in the differences in data
reporting from schools due to inconsistent methodologies, as indicated in the introductory section.
However a more in-depth analysis of this topic is necessary to assess the degree of influence on data
accuracy.
Gender-based analysis also reflects an oscillating evolution of this indicator, with a decreasing trend in
the last two years of the period (1.6%, from 2% in 2007/2008) in the case of boys, while in girls the
rates are kept relatively constant: 1.3-1.5%. We also notice the constant advantage of the female
population throughout the entire period, as proven by the GPI values of 0.75-0.81.
As concerns the indicator values by gender and area of residence, we generally notice that the highest
ones go to urban boys (rates between 1.5% and2.3%), followed by those related to urban girls (1.1%-
1.8%). Nonetheless, this urban/rural disparity does not occur for every year during the reference period.
The GPI for the urban population, with values between 0.72 – 0.81, highlights the fact that urban boys
are more at risk of dropping out than urban girls.
The transition rate from primary to lower secondary education is kept almost constant throughout
the entire reference period (approximately 98%), with one exception in the 2007/2008 school year when
the lowest indicator value was recorded, 97% (Table 24, Annex). Year-to-year variations fall below 1
percentage point.
Unfortunately the data available do not offer us the possibility of understanding better who are the 2%
that fail to make the transition from primary to lower secondary, and also to identify specific risk factors
in relation with the categories identified. The transition rate indicator reports non-significant gender
differences. These differences are below one percentage point and are slightly in favour of boys.
However, for the entire period of time, GPI highlights the lack of gender inequalities, as it falls between
0.99-1.00. No information on area of residence, financial situation of the family or other relevant factors
is available for further risk analysis.
*
* *
The analysis of the indicators that help identify children at risk determined that the primary school age
population segment most at risk with regard to school participation is the one comprising urban area
boys. In their case, we find the highest share of new entrants to primary education with no Early
Childhood and Care Education(ECCE) experience, as taken from the data of the last 4 years, as well as
the highest dropout rate for this educational stage.

33
The statistical analysis indicates rural children of both gendersas another vulnerable category, besides
the students with no ECCE experience. The differences from urban children show up not only in relation
to repetition rate trends (relatively constant in urban areas and on the rise in rural areas), but also in
relation to its actual values: in rural area, the indicator has a much higher value in all four primary
school grades and throughout the entire reference period of the Report.As regards dropout, the GPI
highlights also a significant gap between girls and boys in rural areas (with the second highest dropout
risk), with values falling between 0.72 – 0.81.
Even if not directly indicated by the OOSC data, Roma children are among the most exposed
categories of children to the risk of dropping out due to a complex of causes that will be further explored
in the next chapter. Based on Household Budget Survey results, we have however an estimation of the
out-of-school rates for Roma children, by household wealth, as indicated in the table below:
Table 7 Roma children enrollment by age groups and household wealth - 2009
Total (number) out-of-school (number) out-of-school rates (%)
poorest richest poorest richest poorest richest
7-10 years old 29976 1090 3883 0 12.9 0
11-14 years old 31060 1131 3921 0 12.6 0
Source: HBS, National Institute of Statistics.
Recent relevant research offers enough evidence that poverty, the low level of education of the parents,
the difficulties of children to adapt to school culture and to speak and understand Romanian, the lack of
pre-school education, the involvement in household labour and the insufficient adaptation of teachers to
the needs of Roma students are some of the most important risk factors. In addition, for some Roma
communities, specific traditions like early marriages are clearly opposing school attendance.
The same goes for children with disabilities, especially after the constant reduction of available places
in special schools and the promotion of inclusive education policies promoting education of these
children in mainstream schools. As indicated by several studies (Vrăjmaș 2010, Horga and Jigău 2009)
the children with special education needs are still insufficiently supported and guided in meeting the
objectives of the special curriculum mainly due to supply challenges (i.e. not enough support teachers,
training programs and training materials etc). In this context, the risk of drop out is high, despite the
constant efforts of many families to offer this support to their SEN child based on their own resources.
1.5. Profiles of Children at Risk in Dimension 5
As indicated in the report Methodology, a simple way to analyze the population of children at risk is to
look at the at-risk children of yesterday who recently dropped out of school. Based on the findings of
previous chapters, we already analysed the situation of children who leave school early from the point
of view of age, level of education, gender, area of residence. This section will explore further these
characteristics, taking into account also other relevant indicators such as survival and transition rates.

34
Repeaters are more likely to drop out and this is observable both in the case of primary and lower
secondary education. The lack of performance indicated by poor school results leads to a decrease of
motivation in its own capacity and a lower self-esteem. Often related also with a high absenteeism, the
repetition of the year increases the pressure on the failing student, forced to re-adapt to new colleagues
and often new teachers (especially in primary level).
The 2005-2009 repetition rate for the overall school population enrolled in lower secondary education
shows a relatively constant trend in all the grades of the respective educational stage (except for 5th
grade where a rising trend has been reported in the last years), with some differences as regards the
actual indicator values. Hence, in 6th and 7
th grades, repetition rate is less than 3%, in 8
th grade less
than 2%, while in 5th grade the indicator goes up from nearly 3% to 4% (Table 19, Annex). The indicator
shows relatively different trends for urban and rural populations. Thus, for 5th and 6
th grades, urban
areas show a relatively constant trend (approximately 3% and 2% respectively), whilst in rural areas
(especially in 5th grade) we notice a rising trend of roughly 1 percentage point. In the other two grades
(7th and 8
th), repetition rate drops slightly in urban area and stays rather constant in rural area
(approximately 3% and 2% respectively).
Some residential area differences show up throughout the entire reference period of the Report not only
in relation to repetition rate trends, but also to its actual values. These differences, to the disadvantage
of rural school population, are over one percentage point in the 5th grade and less than 1 percentage
point in the other lower secondary education grades.
Grade-to-grade comparisons show that in general the highest repetition rate is reported in 5th grade due
to the difficult adjustment to secondary education (between 3% and 4%, for the entire reference period
of the Report), and the lowest rate in the 8th grade (2 and less than 2%); in 6
th and 7
th grades the
indicator values are below 3%. With regard to areas of residence, we notice the same grade-to-grade
trend, with the difference that for all the grades and for the entire reference period the indicator values
corresponding to rural area are higher than those related to urban area.
Figure 11. Dropout rate at the primary and lower secondary level, by type of residence, 2005-
2009
1.6
2.1
1.5 1.4
1.5
2.0
2.3
1.9 1.7 1.6
1.4 1.4
1.9
1.5 1.4
2.2
2.3 2.6
2.2
1.8
0.0
0.5
1.0
1.5
2.0
2.5
3.0
2005/2006 2006/2007 2007/2008 2008/2009 2009/2010
%
School year
Urban - primary education
Urban - lower secondaryeducation
Rural - primary education
Rural - lower secondaryeducation

35
The dropout rate for the overall population reports decreasing trends in 6th, 7
th and 8
th grades (from
nearly 2% to less than 1.5%) and a rise-and-fall trend in 5th grade (between 2.5% and 2.8%) - Table 20,
Annex.
The trends mentioned for the overall school population are also similar to those in urban and rural
population segments. Taking the same criterion into account – the area of residence – we see that the
advantage (which falls between 0.2-0.9 percentage points) goes in most cases to urban areas.
The grade-to-grade comparison reveals that the highest dropout rate is reported in 5th grade (2.5% -
2.8%), while in the other grades the rate reaches +/-2%. The same trend is generally noticed in relation
to areas of residence.
In lower secondary education, the survival rate for the studied cohorts reaches 88%-89%. The highest
value is reported in the cohort that graduated in the 2005/2006 school year (89.2%), and the lowest in
the cohort finishing 8th grade in 2008/2009 (87.6%); the difference between the highest and the lowest
values is 1.6 percentage points. The general trend identified during the reference period is a decreasing
one with a slight rise in the last year of the period.
The survival rate reports significant gender differences to the advantage of girls. In the analysed period,
the difference between the male and female survival rate falls between 2.7 and 3.7 percentage points,
with a decreasing trend in the last year. For the first 4 years of the analysed period, the GPI was 1.04,
illustrating the above-mentioned differences, while dropping to 1.03 in the 2009/2010 school year.
Lower secondary education dropout rate for the overall population shows a decreasing trend – from
2.3% in 2006/2007 to 1.7% at the end of the analysed period (Table 23, Annex). The trend is also
similar in urban population, with a drop from 2.3% to 1.6%. In rural areas, although we can talk about a
reduction in the dropout rate, this becomes visible only in the last year of the reference period, when it
reaches 1.8% from 2.6% - the greatest value recorded in 2007/2008. The differences between urban
and rural school populations (between 0.2 and 0.7 percentage points) show up every year during the
analysis in favour of urban children, except for 2006/2007 when urban and rural rates are identical
(2.3%).
The gender-based analysis reflects a decreasing trend in the last two/three years of the period in the
case of boys and girls (from 2.5% to 1.8% in boys and from 2.1% to 1.5% in girls). We also notice the
constant advantage of the female population throughout the entire period, as proven by GPI values
between 0.78-0.90.
Comparing indicator values based on gender and area of residence reveals the fact that these are
similar or even identical during three school years in the case of boys from the two areas – urban and
rural. Nonetheless, as far as the female school population is concerned, we notice the constant
disadvantage of those living in rural areas, with a gap of 0.3 – 0.9 percentage points.
The GPI of the dropout rate from lower secondary education for the rural population, with values
between 0.86 – 0.91 (except for 2009/2010 school year when it was 1), highlights the fact that rural
boys are most at risk of dropping out.

36
Lower to upper secondary education transition rate12
varies during the reference period between
90% and 94%, with the highest values reported by the end of the period. In relation to this transition
rate, gender differences are non-significant. These differences are below 2 percentage points, tending
to drop in the last years, and being in favour of girls. Between 2005 and 2009, GPI varied between 1.00
and 1.02, illustrating the lack of gender inequalities.
*
* *
The analysis of the indicators targeting children at risk spotted out the fact that the lower secondary
student category mostly at risk with regard to school participation is the one comprising rural children.
This is proven both by the repetition rate indicator and by the grade-based dropout rate while in the
case of primary students only repetition rate is representing a high risk for the rural population. Thus, in
the case of the repetition rate, the differences from urban population (more reduced than in the case of
primary school) exceed 1 percentage point in 5th grade and are below 1 percentage point in the other
lower secondary education grades. Moreover, the grade-based dropout rate shows differences between
0.2-0.9 percentage points, being in most cases to the disadvantage of the rural population.
The grade-based dropout rate places rural areas in the same disadvantaged position, as the difference
between urban and rural areas in all the years analysed falls between 0.2 – 0.7 percentage points. A
higher dropout risk is however recorded, unlike in primary school, in the case of boys from rural areas.
The GPI highlights a significant gap between boys and girls in rural areas (with the second highest
dropout risk), with values between 0.86 – 0.91.
The lower secondary education survival rate (which for the overall school population by gender and
throughout the entire reference period is lower than primary education values) also demonstrates the
higher risk for boys with regard to school participation. The gender-based differences between indicator
values fall between 2.7 and 3.7 percentage points, with a declining trend in the last year and a GPI of
1.04 for the examined period.
According to RomaniCriss and UNICEF Study (Surdu, 2011), the higher risk in relation to Roma
children not attending school is also represented by the repetition rate, both for primary and lower
secondary level. For a sample of 417 students from these levels, the average repetition rate was of
1.7%. Also the same study considers failing results and repetition as an important risk factor for drop
out, given the fact that almost half of the students investigated who dropped out (47,6%) were at least
once in the situation of repeating one class, while 38% were twice in this situation and 12% three times.
12
Transition rate to upper secondary is defined as the difference between the number of new entrants in the first
grade of upper secondary education and the number of pupils who were enrolled in the final grade of lower
secondary education in the previous school year, divided by the number of pupils enrolled in the final grade of
lower secondary education in the previous school year, multiplied by 100.

37
Chapter II. BARRIERS AND BOTTLENECKS IN
RELATION TO THE 5DE
This chapter explores the barriers and the dynamics as well as the causal processes of exclusion,
based on the profiles identified in Chapter I and the data on children targeted by our research: out-of-
school children and children at risk of dropping out. The main aim of this section is therefore to offer
details on the main causes of exclusion and main barriers to access, linked with the profiles of the
children in one of the five dimensions of the OOSC methodology. Also, the chapter will point out the
importance of different causes, highlighting the relative weight/impact of one type of barrier in relation to
others, laying thus the foundation for the last chapter of the report.
Both demand side and supply side are researched, while the main aspects considered are socio-
cultural factors and economic ones (demand side) and socio-cultural, educational, policy, governance,
administrative and financing factors (supply side). Specific issues related to the analysed educational
factors include among others: written and taught curriculum, teaching materials, teacher selection and
in-service training, and parent involvement in school activities.
The analysis focuses mainly on four main groups of out-of-school children: Roma minority, children
from rural areas, children from the poorest quintile and children with disabilities. In specific cases, the
causes of exclusion for more detailed profiles are discussed, such as: children with migrant parents,
working children, girls entering early marriage, etc. As the disaggregated data presented in Chapter I
have not been enough for this more detailed analysis, additional sources of information have been used
to support the specific findings of this chapter.
2.1. Socio-Cultural Demand Side
Out-of-school children are often the consequence of a multifactor impact: social, cultural, economic,
and educational. Children’s school participation is the result of converging actions taken by the school,
their family, representative community-based institutions, and public authorities. If any of these bodies
do not work to optimal capacity, the risk of non-attendance increases and so do the related social and
economic implications. For example, this is good illustration of the capability theory: a community
lacking positive social and cultural capacities has a negative impact on individuals’ development in
terms of social integration, cultural development at different levels and restricting access to social
services, including education.
Frequently enough, in Romania the causes to non-attendance are chiefly thought to be related to
poverty and precarious socioeconomic conditions typical to most-at-risk groups: children of Roma
ethnicity, children from rural areas, children from economically challenged settings, children with special
educational needs. Nonetheless, an increasing number of recent studies highlight the fact that ever so
often social and cultural determinants have lasting large-scale effects on school participation
(Dobrică&Jderu, 2005). Thus, for each at-risk group and for the profiles identified in the previous
chapter, there is a series of specific socio-cultural drawbacks which we will further look at in detail.
Roma Children and Adolescents

38
Romania has the largest Roma population of all European countries. The official data available are
those collected for the 2002 official census, when only 535,140 people (accounting for 2.47% of the
entire population) declared to be Roma. Still, according to the Romanian Research Institute for the
Quality of Life,the number of self-identified and hetero-identified Roma is 1.5 million (in other words
6.7% of the entire population). This is the most frequently used estimate and considered to be the
closest to reality (2010, OSF, No Information, No Progress) even if other local or international
organizations (such as Amnesty International) talk about approximately 2 million Roma or nearly 10% of
the population. Roma have a relatively uniform coverage across the Romanian territory and according
to official statistics the counties with the highest shares of self-declared Roma people are Mureş (7.0%),
Călăraşi (5.6%), and Bihor (5.0%).
School participation of children belonging to the Roma minority group was analysed in a lot of research
and studies and improving this matter became the overall goal of various intervention projects involving
decision-making authorities or mobilising Roma or non-Roma NGO’s.
The educational disadvantage is indicated by the very high percentage of functionally illiterate Roma
(over a quarter of the entire Roma population according to RomaniCriss estimates), and by the great
number of unschooled children and youth or early school leavers. Therefore, current estimates reveal
that more than 80% of children who have never attended school are Roma and that at least 18% of
Roma children have not completed the compulsory education level (Ionescu and Matache, 2011).
Moreover, recent research (Surdu 2011) shows that only 81% of Roma children attend primary school
and just 61% go to lower secondary schools. Moreover, in the case of adolescents, the disadvantaged
situation is also important with only 33% of the Roma aged 15-18 years are still in school, compared to
almost 79% of the other youngsters.
Relevant studies have identified a set of socio-cultural drawbacks for this group as presented
hereinafter:
- The low education attainment of Roma families is often considered a key factor for Roma children’s
poor educational participation. Research on international assessments (TIMSS, PISA) designates a
direct link between learner attainment and their families’ level of education. Some research (Jigău,
2002) has highlighted the fact that most dropouts (over 50%) come from unschooled or primary-
schooled families. Thus, Roma children’s belonging to socially and educationally disadvantaged
families often acts as a barrier for their academic attainment – firstly because low-educated parents
cannot offer the educational support needed for their child’s school preparation, and secondly this
may be the effect of children’s negative role models in terms of school attendance and worth for
their social and professional rise.
- Some Roma communities have preserved cultural customs related to early marriages. Such
practices (like “stealing girls”) have actually become less common but they continue to work as a
“living legend” in the collective mindset and they have a direct impact on school participation,
especially on girls’. These kinds of traditions make Roma parents either sign their girls up for school
late or pull them out of school after a few years or never send them to school in the first place. On
the same note, Roma boys’ school continuation after finishing compulsory education seems to be a
problem because this goes against the custom of them starting working and gaining economic and

39
financial independence as early in their adolescence (Dobrică&Jderu, 2005). The point of these
practices is basically the preservation of traditions and hence of ethnic identity.
- Gender gaps within the Roma community are more noticeable in the case of girls after they
finish primary education (4th grade) and up to the end of lower secondary education (8
th grade),
while in boys after finishing compulsory schooling (10th grade – Duminică&Ivasiuc, 2010).
- The early marriage tradition acts as a poverty-proliferating mechanism from one generation to
another. An illustrative example is that of young girls who become pregnant (Bennett, 2010). They
have smaller chances of benefiting from parenting care or support for their child-raising, child care
and education, which makes it difficult for them to complete basic education, to get an appropriate
qualification and enter the job market.
- The group of children and youth whose parents respected the early marriage tradition should be
analysed more thoroughly as they have not yet been made the subject of specific analyses. These
children are more exposed to the risk of low birth weight or premature birth and they are less likely
to be breastfed thus risking poorer physical and mental health than other children (Horga & Jigău
2009). Besides medical and health problems, this group receives less family support and it is hence
more exposed to academic failure.
- The mobility of Roma nomadic communities – migrating from one place to another according to
season, economic conditions, social dynamics inside the community – is a significant cause of early
school leaving. This phenomenon has become even more common in recent years against the
backdrop of Roma parents’ migration abroad accompanied by their children. Dropping out or
coming back home/to school during the academic year is frequent in these communities and this
reality increases drop-out risks as the education system shows little flexibility for a child’s
comeback/re-enrolment during the academic year (Fartușnic, 2011). Difficulties are pointed out
regarding recognition of studies completed abroad when children have attended a form of schooling
and regarding specific catch-up lessons that need to be planned.
- Another barrier to Roma children’s access to education consists in their lack of identity
documents (birth certificate, identity card). This matter has significantly improved in the last
decade as a result of governmental support programmes – for example, the development of a
methodology addressing lack of marriage, identity and housing documents, as part of a PHARE
programme (Fleck, 2006) – or of specific projects developed by NGO’s. Nevertheless, in some
communities Roma children still do not have identity documents. The causes of this are diverse:
lack of interest, lack of knowledge regarding the steps to getting the documents, lack of financial
resources for such a proceeding, lack of local public services advising on such matters, etc. The
absence of identity papers hinders most of all access to education and health care.
- The language spoken in the family is frequently a barrier in terms of access to education and of
school success. Different relevant studies (Jigău, 2002) have highlighted the link between school
participation and the language spoken in the family. Thus, research studies conducted at the
beginning of the 2000’s showed that participation in pre-primary education was twice as low in

40
Romani-speaking families as in (hetero- or self-identified) Roma families which did not make use of
this language. In the case of school age children (7-16 years), the share of children currently not
attending school is 2 ½ times more frequent in Romani-speaking families than in the families which
do not speak this language while school age children not enrolled is almost three times higher in
self-identified Roma families. As a result of policies that have promoted the Romani language in the
curriculum (through Romani language lessons and teachers), these figures have improved in the
last decade, but lack of Romanian language knowledge continues to be an obstacle and a drop-out
risk factor at least at school debut (Fartușnic, 2011; Surdu, 2011).
- Another barrier, transcending both demand and supply side, concerns discrimination.
Geographically, we can often talk about residential segregation: compact Roma communities are
frequently located at the outskirts of communities, struggling with improper infrastructure, poverty
and being far from schools. For example, in 2009, a mayor of a locality from the County of Brașov
built a wall to physically separate the Roma community from the Romanian and Hungarian
communities (Stoian, 2010). These sorts of actions lead to Roma’s self-marginalization from other
communities and to a refusal of cultural exchange: “We come from the uphill neighbourhood, the
gipsy neighbourhood. We are different from those in the downhill neighbourhood. They are richer.”
(Interview with Roma parents, Constanța, 2010).
- A 2009 Gallup survey commanded by the European Union Agency for Fundamental Rights shows
that of all the groups represented in the Member States, the Roma ethnic group is the most
exposed to discrimination. Although Romania has the lowest level of discrimination towards the
Roma, the perception of the majority over this minority group continues to be based on stereotypes
like criminality, violence, lack of interest for school or work. According to the survey, one in three
respondents finds that most Roma break the law and one in three that Roma are more violent that
the members of other ethnic groups. Other surveys (INSOMAR, 2009) reveal that 40% of
respondents think that mixed marriages between Roma and non-Roma are bad or very bad and
25% believe that Roma children shouldn’t be playing with children of other ethnicities.
- At the level of pre-primary education, almost one third of Roma children learn in Roma-majority
classes, and 11.7% of them in Roma classes. Most of the time, segregation comes from non-Roma
parents’ refusal to enrol their child in classes attended by Roma children. This phenomenon is also
noticed in relation to the preferred educational establishment as some schools have eventually
turned into schools that traditionally teach Roma children. Recent studies (Surdu, 2011; Bennet,
2010) indicate that in the schools with high shares of Roma children – that are actually segregated
schools – the quality of education is much poorer than the average level of Romanian schools:
repetition and functional illiteracy are significantly higher. Segregated schools have under-qualified
staff and worse infrastructure, issues that will be discussed in detail in section 2.3.
Children and Adolescents from Rural Areas
Taking into account residential area-based disparities identified in the previous chapter as well as the
fact that important policies have been promoted to reduce rural students’ gaps in terms of school

41
access, participation and attainment compared to children in urban areas, this analytical dimension is of
special importance to our research. The Final Longitudinal Study (UMPFE, 2009) presents an overview
of wide-ranging barriers facing children and youth in rural areas as regards school participation, where
socio-cultural factors play a major role:
- The socioeconomic development of rural communities is often a factor that holds back school
participation: underdeveloped infrastructure; relatively great distance from children’s home to
school (a problem when we consider the merger of several rural small-sized schools); precarious
school infrastructure and material equipment; qualified teachers’ relatively low interest to commute
and teach in more remote rural communities (UMPFE, 2009; Jigău, 2002).
- In a context where rural communities are struggling with a still underdeveloped economic
environment and professional insertion/job-finding opportunities are quasi-inexistent for rural youth
in their communities, the motivation for school participation is usually low. The rural population’s
poor level of schooling, especially in terms of post-secondary/tertiary education, also leads to more
reduced educational aspirations that adults pass on to the younger generation. Still, the tradition
of leaving school after 8th grade has become less frequent even in rural areas mostly due to
examples in the community of children who continue their studies after finishing this educational
stage. Moreover, qualitative analyses on school leavers have indicated (Voicu, 2010) that they
relate to school as to a lost good, recognising its importance and describing it as a setting where
they would like to return.
- Given that the rural population generally works in farming, students’ involvement in such activities
increases the risk of early school leaving. Most of the time, they accrue absences and struggle with
school demands. Therefore, students and their families may have lower trust in education
especially when drop-out is imminent.
- Inefficient or inexistent collabourationbetween local agencies responsible for child census (local
authorities, schools, medical centres) is yet another major barrier. There are times when these
agencies do not run a census or the data are not passed from one institution to another (although
all of them need to know and monitor the children’s entire social, academic and medical track). Due
to lack of clear records about the children of a community and insufficient monitoring, they are left
out of efficient educational, social, professional inclusion measures and strategies.
Children and Adolescents from Poorest Quintile
The group of children from poor families, identified in Chapter I to this report as children from families in
the 5th wealth quintile, is partially overlapping the first two groups that have been previously analysed
(Roma children, rural children) as regards socio-cultural exclusion barriers. Besides the drawbacks
already mentioned, in the case of children from poor families we also notice the following:
- As far as poor communities are concerned, we can talk about a lack of efficient strategies that
motivate children to take part in education and their parents to enrol them and support them while

42
in school – given that education is not regarded in the family as playing a decisive role for an
individual’s social and professional achievement. Studies on drop-out (Voicu, 2010; Surdu, 2011)
notice that families dealing with particular economic challenges are often unaware of the
importance of education and lack confidence in the utility of attending school. Particularly in
the case of pre-primary and primary school children, at an age where parental influence is crucial,
this view has a high potential negative impact on school attendance and performance.
- Lack of conditions for the family to support education primarily concerns the financial resources
needed to provide minimum child schooling conditions (clothes, footwear, school supplies) as well
as small contributions to various extra-curricular activities (such as field trips). In addition, needy
families struggle to provide children with minimum home study conditions (space, electricity, proper
temperature, etc.). All these factors are an impediment to school access and participation – under
the conditions of compulsory school enrolment and compulsory homework completion specific to
the Romanian education system.
- The impact of other types of resources than financial or physical on non-schooling or the school
drop-out phenomenon should be further explored. Resources such as demographical, symbolical,
relational are fundamental for the social hierarchy and for accumulation of experiences and positive
models that can be generalised in everyday life (Vasile, 2010).
Children with disabilities/special educational needs
For children with special educational needs, socio-cultural setbacks refer to a series of specific
aspects:
- A first barrier applicable for both supply and demand side in the case of children with SEN is more
generic: insufficient development of an inclusive culture – both in and out of school. In Romania,
the integration of children with SEN into mainstream schools has been an educational policy
measure implemented too suddenly, without the adequate preparation of the education system as
regards (human, material, financial) resources, raising awareness of the importance of inclusion
and developing a correlated school ethos.
- Discriminatory attitudes towards children with SEN are mainly socially manifested, often going
along with parental shame. Social labelling of children sometimes makes their parents not settle
their child’s academic record straight (in the sense of getting an SEN certificate entitling them to
different types of school support, like a support teacher): “Some parents don’t want their own child
to be assessed because they are ashamed of what the neighbours might say … he is handicapped;
so they don’t do it although the child has a problem”; “Some parents have simply refused their
children’s assessment, they can’t accept this label, that their son or daughter is this way and so the
child has to suffer. We even have children who are eligible for inclusive schooling but some parents
don’t want this.” (Interview with a teacher, apud. Jigău&Horga, 2009, p.64).
- All these school attitudes towards children with SEN are often a risk factor. While the right to
education of all children is generally promoted, when confronted with the actual situation of

43
including these children into mainstream education, school stakeholders are somewhat reluctant:
some teachers think that these children do not have real chances to academic attainment; some
parents are against including children with SEN in their child’s class and look at this as
downgrading the quality of education delivered to their “normal” children or as a factor preventing
their children’s development (Jigău&Horga, 2009).
2.2. Economic Demand Side
In Romania, GDP per capita is around 40 percent of the EU average. Moreover, Romania has one of
the highest inequality of income distribution in EU (after Letonia Latviaand Portugal), with a Gini index
estimated to 34.9% in 2009 by National Institute of Statistics and 31% by other international studies
(MONEE and EUSILC).
EUROSTAT 2010 and EUROCHILD 2010 data reveal that poverty today is a major problem for a
significant part of the country’s population. Thus, almost a quarter of the population is at risk of poverty,
with a net income below 60% of the national equivalent average net income (after social transfers). At
the same time, 33% of children aged 0-17 years are at risk of poverty as they grow up in households
earning an income that is below 60% of the national average household income.
The consequences of poverty and extreme poverty on school participation and drop-out are evidenced
by numerous national surveys (Voicu, 2010; Jigău, 2002). Thus, even if compulsory education is free,
indirect school costs are very often named as one of the most important barriers to school participation.
Children and adolescents from poorest quintiles and Roma children and adolescents are thus the
categories that are mostly exposed to the risk of dropping out in pre-primary and primary education, as
well as in upper educational stages.
Major difficulties that children from needy families are often faced with concern insufficient food that
they get at home, lack of adequate medical care when they are sick and parents’ neglect/lack of
emotional support. All these barriers have direct effects on these children’s capacity to attend school
and on their academic attainment.
A study carried out by the Institute for Education Sciences (ISE, 2005) shows that the total amount that
families spend on students’ specific school expenditures is 419.37 EUR per annum, which is more than
the poorest Romanian families can afford. Most of the items would be impossible to buy if they were not
free (textbooks, stationary and transportation). The amount of the social scholarship for students is
established by local authorities and paid from their budget – with a national average of around 200
RON (46.2 EUR) per annum. The information available about the poorest families indicates that only a
small amount is regularly spent on educational materials as other priorities come first.
A more recent study explores the hidden costs of the pre-university school system (GrădinarușiManole,
2010). The surveyed parents were asked to estimate the total cost that the family had to cover
throughout a school year for their children’s schooling (at primary, lower secondary and upper
secondary levels). Taking into account different expenditure categories – textbooks, special exercise
books and notebooks, educational software, school supplies, the uniform and sports outfit, school pool
fund, class pool fund, contribution to school security, tutoring, lunchbox, transport, various school

44
events – as well as other categories, the median total cost (per annum) per child is 1,490 RON (around
370 EUR).
As to the breakdown of average costs by expenditure category, the research has found that the biggest
amounts that parents pay (id., p. 23) are usually for tutoring (1,348 RON – 330 EUR), school transport
(721 RON – 175 EUR) and food (634 RON – 155 EUR). As concerns the costs that are directly
associated with education, school supplies and textbooks, exercise books, special notebooks and
educational software account for 467 RON (114 EUR). The uniform and sports outfit add 255 RON (62
EUR) to the final count and over 440 RON (107 EUR) go to: class and school pool funds, school shows
and events, school security and repairs or new furniture (for these, money is collected separately from
class/school pool funds), gifts and flowers (for teachers and colleagues on special occasions, such as
March 1st and 8
th), school contests, extra-curricular activities carried out in school, Internet use or
magazine purchase. Some parents also mention boarding costs.
Data analysis points to disparities between rural and urban communities: urban children pay a (private)
tutoring price which is almost three times higher (it should be said that this phenomenon is not
mandatory and it is mostly encountered at upper secondary education level); rural children’s travel
expenses are more than 1 ½ higher than those of urban children’s; the annual amount needed to
support a child while in school is greater in urban areas – 1,572 RON (380 EUR) than in rural
communities – 1,372 RON (330 EUR).
The analysis on the use of the money paid by students’ families to school pool fund (28% of
respondents to the questionnaire declared that the payment was mandatory) and to class pool fund
(over 43% of the parents participating in the survey declared that it was a mandatory contribution)
tracks down the following main allocations: school repairs/renovation and classroom
refurbishment/maintenance, school lab/classroom equipment and purchasing teaching materials,
stationary and office supplies.
Many teachers say that they constantly provide material support (mainly clothes and school supplies) to
economically challenged children, support that is sometimes rounded off by other classmates.
Moreover, the principals of the schools counting a great number of children from needy families declare
that these shortcomings are addressed through contributions of local or international NGO’s and
donations from religious/congregational organizations (Fartușnic, 2011).
At the same time, distance to school is an important barrier because the families of these children live
at the outskirts of localities or even outside of them. A greater distance to school leads to a greater risk
of non-attendance in the absence of proper school transport provided by the local community, while
parents say that their children’s non-attendance is due to lack of proper clothes or footwear and to bad
weather conditions (Surdu, 2011).
We will next look at a few barriers related to the economic causes of exclusion regarding the group
which is most affected by the phenomenon of not being enrolled at all in education system and by drop-
out, namely Roma children.
Half of the Roma population and around 60% of Roma communities in Romania live in extreme poverty
(Sandu, 2005). At the same time, 74% of Roma communities struggle with serious income shortages,
67% of them have severe accessibility problems and 23% of them have to deal with very bad electricity
and/or drinking water shortcomings. With only one in eight active citizens having graduated from

45
secondary school, Roma population has a major qualification deficit, translated into lower employability
and low and unstable income. This is why estimations show that Roma’s GDP per capita is roughly one
third of the national average (around $1,500 – measured by a purchasing power parity method for
Romania as a whole).
A recent World Bank study estimates that Roma employment figures are 26% lower than the average
male employment rate (World Bank, 2010) . The poor level of education also reflects in the income
earned by Roma employees (55% less than the majority) while the financial and economic crisis that
started in 2008 makes things even worse.
UNDP/ILO data indicate that in Romania more than 40 % of the children from Roma households
experience severe malnutrition close to starvation (Gabor and Rughinis, 2008). Even if this
percentage should be further documented, it is clear that Roma community is trapped in a very severe
poverty gap, similar to the populations living in the most impoverished regions of the world. Hence, it
does not come as a surprise that the latest Romanian survey on drop-out, conducted by Romani CRISS
and UNICEF in 2010, points out that drop-out is primarily caused by lack of financial resources. This is
mostly mentioned as a cause by Roma parents who pull their children out of kindergarten or agree to
drop-out, with a frequency of nearly half of the answers (44.7%), higher up than other reasons named
such as poor quality of education delivered (34%), emigration (12.8%), child’s immaturity or health
(8.5%).
Moreover, poverty effects build up circulatory migration and child work inside the household (including
looking after younger siblings) or outside of it. Moreover, economic problems lead to large families
where child benefits become one of the main income sources. Early school leaving-focused research
points towards family disorganization as an important risk factor often arising from high poverty (Voicu,
2010) although relevant systematic data are not available.
A series of socioeconomic shortcomings are still persistent in rural areas too, often acting as a risk
factor for school attendance in the case of rural children and adolescents. The most important is
involvement in lucrative activities for the family, which is the reality of poor rural communities. Early
on, children are considered labour force by their family and their schooling is perceived as labour loss
or as a reduction in the family’s benefits. Child and adolescent involvement in lucrative activities and
their taking over adult roles inside the household (house cleaning, cooking, taking care of livestock,
looking after younger siblings) seems to have become a stronger phenomenon in recent years against
the backdrop of rural population’s massive economic migration abroad, at least in some rural
communities (Toth, 2008). Such cases lead to high truancy, insufficient preparation for school and
finally to drop-out. Unfortunately, there are no recent national surveys offering a systematic analysis of
child work phenomenon and its effects on drop-out.
Another under-analysed factor, encountered both in urban and rural areas, is the migration
phenomenon and how one or both parents’ migration abroad impacts school participation. Not earlier
than 2005, Romania started to talk about the situation of underage children left home alone. 2008
research reports indicate that over 350,000 children aged 0-18 years (representing around 7% of all
children in that age group) had at least one parent abroad, while one third of them had both parents
abroad (Toth 2008). The survey conducted by the NGO Alternative Association from Iași with the
support of UNICEF Romania offers an overview of the emotional and social problems facing these
children, especially when they are separated from their parents for longer periods of time. The main

46
positive aspect mentioned by children in this situation is their improved material status, whereas related
difficulties concern lack of proper care from the adult they have been left with (most often a grandparent
or other close relatives), new responsibilities after having to take on the role of their migrant parents,
lack of information and participation in family decision making or communication issues. The survey
shows the major drop-out risk to which these children are exposed, with a focus on secondary school
children (over 13-14 years).
2.3. Supply Side Barriers
The most significant barriers regarding the educational and social service supply for children and
adolescents who have dropped out or are at risk of dropping out focus on three main areas:
- Supply side economic ;
- Shortcomings related to educational supply, the quality of school infrastructure and outfitting;
- Barriers related to the adequacy and training of human resources employed in the education
system.
In recent years, a pre-primary school network has been developed, which has translated into a growing
number of children who attend this educational stage. In big towns (with more than 150,000 inhabitants)
but ever more so in rural areas, the supply of public kindergartens does not manage to fully meet
demand although new buildings were built during the reference period of the report. Moreover, the
number of children in a kindergarten group can exceed the legal upper limit and some groups work
simultaneously with over 30 children, with a clear negative impact on individualisation and
personalisation of learning and support.
By comparison, primary or lower secondary schools supply sufficient places and the number of
students rarely goes beyond the acceptable limits set forth in school regulations. The area of residence
continues to be a major differentiating factor for this indicator. The biggest discrepancies are noticed in
pre-primary education (19 children/teacher in rural areas compared to 16 children/teacher in urban
settings) and in primary education where the ratio is reversed in favour of rural schools (19
students/teacher in urban areas compared to 15 students/teacher in rural area). Lower secondary
education reports the lowest student/teacher ratio of the entire education system, especially in rural
areas where the average ratio is of only 10 students to one teacher. However, the values of this
indicator are expected to change after the recent measures of school network rationalisation through
the closedown/merger of educational establishments and without the right transportation services, the
rural children and adolescents will be exposed to increased absenteeism and the risk of drop out. At
present, according to MECTS data, there is a shortage of nearly 700 school buses, almost 90% of them
being needed in rural areas. Where transport is not provided, economically challenged families say that
they can’t cover that cost and thus refuse to send their child to school (Fartușnic, 2011). In addition,
distance to school and in particular the bad state of most roads in remote rural communities are a
cause of irregular school attendance, especially in winter.
Another major issue that kindergartens and schools have to deal with, mostly in rural areas, are
operating conditions. As seen in Table 2.3.1., one in three rural schools fails to meet the requirements
set by sanitary authorities. Primary schools, usually serving a small number of students in inadequate

47
facilities, are most affected – namely 40% of them. The majority of primary schools are located in rural
communities (over 95%), which comes to confirm the urban/rural divide.
Table 8. Schools receiving sanitary authorisation*
YES In progress NO
URBAN
Total 78.67 6.71 14,62
Kindergarten 76.88 7.26 15.86
Primary school 52.67 8.23 39.09
Primary and secondary school 86.96 5.35 7.69
RURAL
Total 54.41 14.27 31.32
Kindergarten 52.20 14.12 33.68
Primary school 47.14 14.19 38.67
Primary and secondary school 64.67 14.57 20.76
*Issued by County Sanitary Authority
Source: The Ministry of Education, Research, Youth and Sport, 2011
One of the reasons why schools are not granted the permit is their connection to water mains. Whilst
only 5.5% of urban schools are not currently connected, in rural areas one third of all educational
establishments are in this situation (Table 2.3.2.). Once again primary schools are in the most difficult
position as almost half of them are not connected to running water mains or their system is currently out
of use. By comparison, only 1.97% of primary and lower secondary schools from urban areas do not
have access to this utility.
Table 9. Schools with running water
Access to running water
Yes In progress No/ Out of use
URBAN
Total 93.83 0.79 5.53
Kindergarten 94.50 0.46 4.89
Primary school 66.12 2.45 31.43
Primary and secondary school 97.65 1.14 1.97
RURAL
Total 62.14 4.07 33.79
Kindergarten 58.70 4.48 36.82
Primary school 52.77 3.95 43.36
Primary and secondary school 76.07 3.54 20.35
Source: The Ministry of Education, Research, Youth and Sport, 2011
We notice that things are similar when it comes to access to electricity, primary and lower secondary
schools from rural areas being entirely or in the process of getting connected to electricity mains. But

48
there are 62 rural schools that are still not connected to electricity, accounting for nearly 0.42% of all
schools in rural areas.
Table 10. Access to electricity
Access to electricity
YES In progress NO
URBAN
Total 99.78 0.10 0.14
Kindergarten 99.77 0.08 0.15
Primary school 99.18 0.00 0.82
Primary and secondary school 99.85 0.15 0.00
RURAL
Total 99.48 0.10 0.42
Kindergarten 99.41 0.13 0.46
Primary school 99.38 0.10 0.51
Primary and secondary school 99.70 0.05 0.26
Source: The Ministry of Education, Research, Youth and Sport, 2011
Like for other utilities, school sanitation depends on how developed the area is (Table 2.3.4.).
Infrastructure projects are under way in many rural communities, but there are significant lacks related
to sewerage or gas access in these locations. Thus, one in five rural schools have to cope with totally
improper sanitation, which makes it difficult to ensure personal hygiene and brings about major health
risks.
Table 11.Types of sanitation
Types of sanitation
Sewerage Septic tank Other
URBAN
Total 79.91 15.50 4.59
Kindergarten 82.65 13.01 4.35
Primary school 23.67 52.65 23.67
Primary and secondary school 84.98 13.51 1.52
RURAL
Total 8.81 72.08 19.11
Kindergarten 8.18 71.25 20.57
Primary school 6.01 69.20 24.79
Primary and secondary school 12.35 76.02 11.63
Source: The Ministry of Education, Research, Youth and Sport, 2011
While rural local authorities having to cover the running costs are short of resources, many schools still
do not have modern heating (Table 2.3.5.). Moreover, only 60% of urban schools and 14% of rural
schools are connected to gas mains. The negative impact of these conditions on quality learning
environment is directly observed during seasons with extreme low temperatures, when often heating
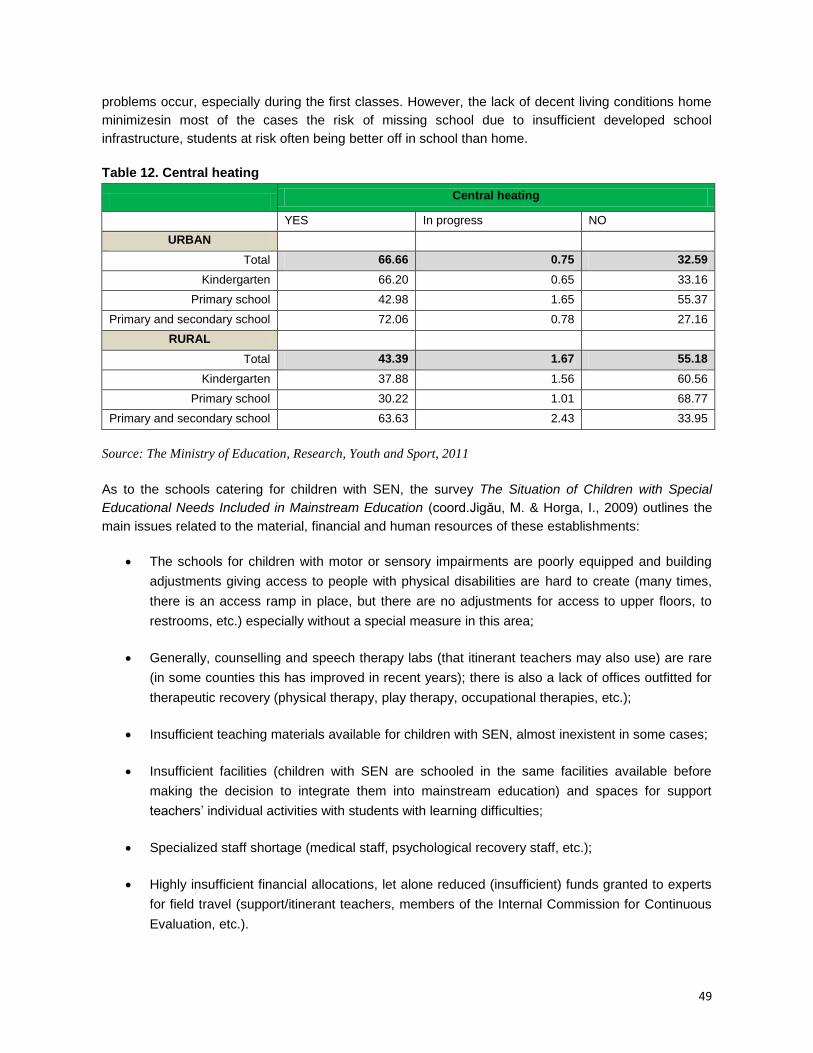
49
problems occur, especially during the first classes. However, the lack of decent living conditions home
minimizesin most of the cases the risk of missing school due to insufficient developed school
infrastructure, students at risk often being better off in school than home.
Table 12. Central heating
Central heating
YES In progress NO
URBAN
Total 66.66 0.75 32.59
Kindergarten 66.20 0.65 33.16
Primary school 42.98 1.65 55.37
Primary and secondary school 72.06 0.78 27.16
RURAL
Total 43.39 1.67 55.18
Kindergarten 37.88 1.56 60.56
Primary school 30.22 1.01 68.77
Primary and secondary school 63.63 2.43 33.95
Source: The Ministry of Education, Research, Youth and Sport, 2011
As to the schools catering for children with SEN, the survey The Situation of Children with Special
Educational Needs Included in Mainstream Education (coord.Jigău, M. & Horga, I., 2009) outlines the
main issues related to the material, financial and human resources of these establishments:
The schools for children with motor or sensory impairments are poorly equipped and building
adjustments giving access to people with physical disabilities are hard to create (many times,
there is an access ramp in place, but there are no adjustments for access to upper floors, to
restrooms, etc.) especially without a special measure in this area;
Generally, counselling and speech therapy labs (that itinerant teachers may also use) are rare
(in some counties this has improved in recent years); there is also a lack of offices outfitted for
therapeutic recovery (physical therapy, play therapy, occupational therapies, etc.);
Insufficient teaching materials available for children with SEN, almost inexistent in some cases;
Insufficient facilities (children with SEN are schooled in the same facilities available before
making the decision to integrate them into mainstream education) and spaces for support
teachers’ individual activities with students with learning difficulties;
Specialized staff shortage (medical staff, psychological recovery staff, etc.);
Highly insufficient financial allocations, let alone reduced (insufficient) funds granted to experts
for field travel (support/itinerant teachers, members of the Internal Commission for Continuous
Evaluation, etc.).

50
As concerns the outfitting of the schools where Roma students learn, recent data (Dumincă, G.,
Ivasiuc, A., 2010) reveal a series of problems such as:
Specialised labs: 26% of researched schools do not have specialized labs for subject matters like
biology, chemistry, physics or computer science; moreover, according to the data regarding the
schools that have such labs, these facilities are used daily up to 77%, the rest of them being used
weekly, monthly or never; it has been noticed that the availability of specialised labs in schools is
disproportionate to the share of Roma children: the higher the percentage of Roma students, the
less likely for the school to have specialised labs;
Libraries: 18% of schools do not have a library, and in nearly 10% of those that do have one,
students do not have access to books – this is typically encountered in the schools where the
library is actually located inside the schools with legal personality (coordinating schools) and not in
the subordinate structures/establishments that may be located at a great distance from the
coordinating school; we spot the same tendency of a school being less likely to have a library as
the share of Roma students in the total student population increases;
Number of books in library: the schools with a high share of Roma tend to report a smaller number
of books per student than the schools with less Roma students;
Gyms/athletic fields: the schools with high shares of Roma are less likely to have a gym or an
athletic field than those with low shares of Roma students.
Other supply side factors could be identified :
Ethnic discrimination is often mentioned to be present in the school environment as well. Relevant
studies (Duminică&Ivasiuc, 2010; Surdu, 2011, Voicu 2010) have identified a greater number of
problem schools in Roma communities: unqualified and unsteady teachers; precarious material
resources (facilities, equipment, teaching materials); discriminatory school climate (teachers’
discriminatory attitudes towards Roma students).
Negative school ethos and ethnic segregation overlapping academic attainment-based
segregation (many badly performing children are Roma) often act as major school risk factors: “I
have a girl who finished 5th grade last year; she went to school for a while and then she wouldn’t go
anymore. She felt bad for not being like the others. She didn’t know [things]. Her colleagues would
help her do her homework.” (Interview with Roma parent, apud Ulrich, 2009: p.29). In this context,
there is also a negative perception of the community over the education system, “including
discrimination, school violence, lack of vacancies at the school of choice or lack of a school
teaching the trades of choice, school schedule, as well as the child’s inability to speak the teaching
language.” (Surdu, 2011: p. 7).
While the main causes of schools with Roma students being works off are not systematically
researched, it seems that unequal distribution of resources is clearly linked with the funding
mechanisms (based on historical costs), making the risk higher in schools where there is already a long
tradition of under-financing. Moreover, the voice Roma parents seems to have lower chance to
effectively put a pressure on decision-makers and correct these inequalities compared with other
parents associations.

51
At the same time, although several initiatives have been taken in this department, the education and
training system continues to lack flexibility for covering the shortage/low level of education of at-risk
groups, especially of the Roma population. Second Chance programmes are the only way to
complete a minimum level of learning but such programmes do not enjoy a homogeneous geographical
coverage and do not live up to the current demand; in addition, this type of programmes is insufficiently
known in certain communities, leading to a vicious circle where lack of demand hampers supply growth:
these schools cannot operate without a minimum number of students enrolled.
Unfortunately, in the absence of integrated intervention strategies, the practice of developing flexible
educational programmes that encourage the preservation of traditions and hence of ethnic identity is
underdeveloped. For example, local and school decision makers still resist accepting classes only for
Roma girls or accepting one parent’s presence during lessons, despite the fact that the risk of having
the girls kidnapped while at school is one of the reasons indicated by family why keeping the girls
home. More flexible organisation procedures can address this issue, just as the case of students that
engage in seasonal work (farming, animal husbandry), with school timing/schedule better adapted to
attendance patterns. Except for medical cases, any form of home schooling is not officially approved.
Specific supply challenges are faced also by children and adolescents from rural areas. As far as
human resources are concerned, we notice once again the concentration of experienced and qualified
teachers in urban, high-performing schools to the detriment of those located in rural or peri-urban
areas. Due to national training programmes, at present the share of qualified teachers in pre-primary
education continues on the same rising trend as previous years, going up to 95.4%. Nonetheless, pre-
primary education still shows the highest share of unqualified teaching staff, mostly in rural areas.
According to INS data (2010), the shares of qualified teachers have increased in primary and lower
secondary education levels, reaching 98.5% in primary schools and 97.1% in lower secondary
schools. Still, initial training and continuing training programmes seem to have failed to develop the
skills required for individual work with children at risk. For example, despite the adequate provision of
school instruction books, there is a lack of teaching/learning materials adapted to the needs of children
with few opportunities and most at risk of dropping out. Moreover, the teachers have limited skills in
developing their own teaching materials and making the necessary curriculum adaptation to the needs
of this group of students (Voicu, 2010; Fartușnic, 2011).
The current curriculum is perceived by all stakeholders (students, teachers, parents)to be overloaded
with low-relevance information for adult life and employment and hardly linked to the specific context of
a particular school/environment. Information still takes precedence over problem-solving skills
development, andit is clearly not valued by many parents or students (Duminică and Ivasiuc, 2010).
Other important challenges, especially for rural schools refer to the high share of commuting teachers,
of those without tenure (high staff turnover) and of few specialized training opportunities aiming at the
development of teaching strategies adapted to the needs of students at risk. Moreover, the 2011
teacher certification examination brought to light the existing lacks in the current selection and training
system for future teachers as more than 70% of applicants failed the exam.
Hence, promoting inadequate learning methods escalates academic failure risks for students at risk,
while skills shortage is also confirmed by the very high number of students who believe that poor
communication with teachers and the fact that the latter are not open to their problems are the main
causes of violent behaviours in schools (Jigău, 2004).

52
Insufficient teacher training is something that comes out of recent national and international
assessments as well. Therefore, the scores at the national 8th grade assessment for the 2009-2010
school year indicate a Romanian Language and Literature promotion rate of 83.3% whereas for Math it
goes down to 76.4%. There are significant residential area-based differences, with a promotion rate in
rural communities that is around 8 percentage points lower than in urban areas for Romanian Language
and nearly 5 percentage points lower for mathematics. PISA, TIMSS and PIRLS international
assessments confirm the fact that Romania performs worse than other states in the region, and once
again rural students’ scores are significantly lower than urban children’s (for example, the average
score for reading is 436 in the case of urban students and 392 for rural students). An overview of the
scores reached at the last PISA test in Romania (2006) is presented in Table 2.3.6. At the same time,
reading score differences due to family disadvantaged background (poverty) are illustrated in Table
2.3.7.
Table 13. Average PISA Scores
Average
score
Reading
Average
score
Math
Average
score
Science
% pupils
scoring
below
level 1
Reading
% pupils
scoring
below
level 2
Reading
% pupils
scoring
below
level 1
Math
% pupils
scoring
below
level 2
Math
% pupils
scoring
below
level 2
Science
424 427 428
below L1b:
4.1%;
at
L1b:12.7%;
at
L1a:23.6%
at.L2:31.6
%
below
L1:19.5%;
at L1:
27.5%
at
L2:28.6%
at
L2:34.1%
Data source: OECD - PISA 2009 Results, volumes I and II. 2010.
Table 14.Summary of students' and schools' socio-economic background and performance
Mean
performance
score in
Reading
Percentage
of students
below
proficiency
Level 2 in
Reading
Average
PISA index
of
economic,
social and
cultural
status
(ESCS)
Mean index
Interquartile
range of the
distribution
of the
student
ESCS
Score point
difference
associated
with one
unit
increase in
the ESCS
Gini index
Percentage
of explained
variance in
student
variance
424 40,40% -0,34 1,12 36 0,31 13,60%
Data source: OECD - PISA 2009 Results, volumes I and II. 2010.
Recent studies (Voicu, 2010) have shown that drop-out is directly influenced by the inclusive culture of
the class and school. Teacher training programmes are still missing in the area of support and proper
management of relationships between children at risk of dropping out (including children who got
married at a young age) or who return to school after dropping out and other school stakeholders. At

53
the same time, drop-out risk detection skills are underdeveloped. Without proper detection, mediation,
facilitation and communication, school stakeholders’ prejudices and stereotypes affect the self-
confidence and motivation for learning of the children from every exclusion dimension.
In the case of children and adolescents with SEN, another supply challenge is related to the insufficient
preparation of the school for being an inclusive school – in terms of needed material, human and
teaching resources – is the main risk factor for children with SEN. Hence, without really knowing their
developmental potential, such children are often regarded as bad students, learning support is lacking,
and the “likelihood” of academic failure is prevailing. These issues will be discussed again in the section
dedicated to educational supply, especially as regards provision of support staff for students with SEN
attending mainstream education (Jigău&Horga, 2009).
2.4. Policy, Governance, Capacity, Financing
Both at the level of the education system and at the level of social policies in general, there is a strong
commitment to inclusion and school participation of groups at risk is one of the clearly stated
governmental priorities. Unfortunately, the strategy development process was slow and strategy
implementation and monitoring were not done on a systematic basis. For example, the measures set
for monitoring truancy and drop-out, especially among students at risk, have not been sufficiently
coordinated and systematically applied across the entire education system.
Therefore, a general and unitary definition of drop-out and never attending school is still missing, and a
coherent data collection methodology is just being developed for local, regional and national
information, training and communication structures and mechanisms in key areas:
desegregation/discrimination, prevention and fight against school violence phenomena, inclusion, etc.
In addition, at the level of quality assurance policies, “Educational Risk Mapping” is expected to be put
into practice to highlight the added value of a school’s educational services directly linked to the
environment where it works, and specific quality standards are expected to be piloted and applied for
each level and type of school.
The Report on the State of Education (MECTS, 2010) indicates that efficient decentralisation and
decisions as close to beneficiaries as possible must be seconded by coherent regulations and process
control, which requires improved management control standards. Therefore, school management
teams need assistance to apply the measures required to continue the decentralisation of the pre-
university education system, mainly as regards:
- The application of funding and reporting mechanisms and procedures in a decentralized
education system;
- Restructuring institutional management to take on and fulfil new roles and functions;
- Implementing the system of standard costing compatible with quality standards and students’
specific educational needs, required to manage and coordinate schools in a decentralized
setting;
- Providing transparency and public accountability.

54
Upper secondary school network is insufficiently developed in rural communities, especially those that
have a well-defined vocational profile and that could offer the chance of getting a professional
qualification. Limited access to such schools (due to distance, required financial resources, time) drops
the motivation for school participation in lower educational levels too. At the level of the entire education
system, the share of those who choose a vocational path in technical high schools without continuing
their studies in tertiary education is relatively low, which means that there is a risk of a strong social
polarization between those who graduate from university and those who have a low level of qualification
(Voicu, 2010). Rural education is even more exposed to this risk as participation in post-compulsory
education is much more reduced here than in urban settings.
Financing
At present, the new regulating framework aims at mainstreaming a system of financial allocation per
capita that could make educational budget allocation more equitable. The new Education Act introduces
the principle of “funding per student” whereby public fund allocation becomes transparent and is done in
accordance with strategic educational targets. It is expected that annual standard costing per student
should boost inter-school competition and school performance. At the same time, the new planned
mechanism will facilitate the monitoring of resource allocation and expected results as well as
corrections where local budget allocations are not met13.
Financial expenditures related to salaries, benefits, indemnities and other pay rights, as established by
law, as well as related contributions, for pre-university public educational establishments, will be done
based on standard costing per student/pre-primary child, in line with Government Decision
1618/2009on financing pre-university public educational establishments funded from local budgets. In
order to increase the efficiency of the education system and the quality of teaching, standard costing
per student/pre-primary child is to be introduced for utilities as well, leading to a higher transparency on
costs and actual expenditures. OOSC are the first group to take advantage of the new financing system
as it is expected that school managers will be directly interested in keeping all the children in school
and secure the planned school budget for a specific year.
Unfortunately, only a few indicators on funding by level of education are currently available and only for
2007 (EUROSTAT, 2011). Consequently, it is impossible to run a pertinent analysis on the degree of
equity in educational budgeting and budget execution, identifying funding gaps and specific strategies
to assist vulnerable groups. After a long period of being under-financed, starting with 2007 the
educational budget exceeded 4% (see the chart below). The set target is 6% of GDP, but there are no
data proving that it has been actually reached.
13 The new mechanism is planned to be introduced at the level of education system starting with school year
2012/2013.

55
2.5. Analytical summary
Regardless of which group out-of-school children belong to, our analysis points to a series of general
bottlenecks acting as barriers or causes of drop-out:
- Underdevelopment of efficient, sustained and concurrent strategies to include in the education
system all children irrespective of their individual, family, socioeconomic, cultural challenges;
- Failure to apply a nationwide unitary methodology to record and monitor school age children and
out-of-school children;
- Lack of implementing rules for the laws on compulsory school participation and insufficient
knowledge over the socioeconomic background of the most vulnerable groups;
- Poor development of alternative educational services/educational tracks for children at risk of
staying out-of-school and failure to represent vulnerable groups (and hence the right to education);
insufficient bodies meant to protect and uphold the respect for the right to education of all children
(such as a “juvenile court”/”children’s advocate”);
- Insufficient parent involvement in school life through specific information, training, assistance,
counselling programmes addressing children most at risk of dropping out in particular; lack of
system-level mechanisms meant to valorise/capitalise on positive experiences acquired through
relevant projects promoted in partnership with schools and non-governmental organizations.

56
At the same time, this chapter has captured a series of barriers specific to certain at-risk groups. Thus,
with regard to Roma children and youth, a number of factors having a strong impact on their school
participation have been highlighted:
Both single-parent families and two-parent families often find themselves in a challenging
socioeconomic position; to cover their shortcomings, the children of these families are used for
work, for looking after their younger siblings or for taking care of the household;
Often, lack of local employment opportunities makes education useless (or almost) as long as
school participation and academic attainment do not translate into employment and earning
opportunities;
Their under-representation in student and parent advisory boards and even the opposite trend:
the higher the share of Roma students, the less likely it is for that school to even have a student
board (Duminică and Ivasiuc, 2010).
Moreover, if school representatives discourse states that discrimination does not exist in schools,
practice-wise the phenomenon is highly felt by two of our identified categories of children and
adolescents at risk: Roma and SEN. Teachers describe Roma children as more indolent, lazier, filthier,
and less intelligent than other students; moreover, teachers blame Roma students exclusively for their
academic failure. The same goes for SEN students often labelled as violent, disturbing the classroom,
with no potential for learning.
With regard to gender distribution, the analysis has shown that one of the most important reasons why
girls drop out after primary school, especially in the case of Roma and rural girls from primary and lower
secondary is their involvement in household work and/or looking after their younger siblings and early
marriage. Boys leave school in upper classes to work abroad with other adults; the discussions with
parents of low and very low socioeconomic level revealed that education, at least higher education, had
no point to them and lacked perspectives; more than that, if girls attended this level of education, they
would go beyond marriageable age, while boys would put off the time when they become financially
autonomous and independent.

57
Chapter III. POLICIES AND STRATEGIES
RELATED TO THE FIVE
DIMENSIONS OF EXCLUSION
This chapter offers a detailed analysis of the most important policies and strategies targeting out-of-
school child issues as promoted at governmental level and by civil society players, capitalising on the
main findings of the preceding two chapters. Thus, we aim at identifying more efficient and better
targeted interventions for the future, starting from the profiles and causes of exclusion pointed out so
far.
This chapter has been designed based on the recent changes to the educational legal framework and
on the main areas of analysis proposed in the OOSC methodology: evidence on results and good
practice related to demand side (socio-cultural and economic policies and strategies), supply side
(educational and cross-sectoral interventions), management and governance, and budgeting/financial
policies and strategies. The second part of the chapter outlines the social protection system, exploring
key social protection programmes, evidenced and perceived impacts of these programs on OOSC, a
cross-sectoral approach and funding mechanisms for social protection systems.
3.1. Supply side – a new policy framework
The new National Education Act has operationalized the basic options set forth in the National Pact for
Education, signed in the spring of 2009 by every parliamentary party and representatives of trade
unions, student/pupil/parent organizations, and of other non-governmental organizations delivering
educational programmes. Thus, the aim has been to develop a regulatory legal framework as realistic
and as stimulating as possible, backed up by secondary legislation and later developments better
adjusted to educational pathway changes.
As far as pre-university education is concerned, the new act has aimed at matching the levels of
education to the demands of modern schooling and to the European Qualifications Framework, at new
curricular policies and appraisal procedures, at speeding up decentralisation in the context of quality
assurance and reforming HR policies. The most important points of novelty brought in by the new legal
framework relative to the children and youth from the groups at risk analysed in this report are the
following: explicit consideration of parents as school partners; special attention to early childhood
education and making preparatory year compulsory; development of lower secondary education;
professionalizing the teaching career and reconsidering teacher’s role and place in the education
system; promotion of the educational portfolio. In this section, we will run a brief analysis of these
issues from the perspective of low-opportunity groups as identified in Chapter 1 to this research report.
Parents as School Partners
At the time of enrolment of ante-preschool, preschool or school children, educational establishments
and parents enter an educational contract stipulating the parties’ mutual obligations. The
responsibility for the child’s education no longer goes entirely to teachers, but also to the parent or legal

58
guardian who must take measures to make sure the child attends school during compulsory school
years.
Moreover, parents play a significant role in specific programmes promoted in pre-university education.
Hence, the “School After School” programme, delivering educational, leisure, spare time activities to
consolidate acquired knowledge or to speed up learning, as well as remedial learning lessons, will be
scaled up across the system through a partnership between MECTS and parent associations. At the
same time, the Parent Committee shall work with the educational establishment in order to decide on
optional and voluntary disciplines (part of the curriculum as decided by school). Parents are constantly
informed on how their children are doing at school through the Student’s Educational Portfolio
communicated at the end of 2nd
and 6th grades (after being previously assessed).
At decision-making level too, the role of parents and of their associative structures becomes
increasingly important. According to the new arrangement, the school board of each educational
establishment – the main decision maker at school level – is made up of parent representatives
alongside teachers elected by the school’s teaching staff, and local community representatives. Faculty
council meetings are attended by other representatives of the Parent Committee, without any right to
vote. Moreover, the new legislation prescribes that each year the Council shall present to the Parent
Committee a report on the quality of education – a provision that ensures accountability of school
decision-making.
Promotion of Early Childhood Education
The new act reforms early childhood education, covering the period of 0-6 years, with its two
components: ante-preschool education (0-3 years) and pre-primary education (3-6 years). This lays the
foundation for a unitary approach to education at young ages, highlighting the crucial importance of this
stage for the child’s full development later on. For the first time in a legal document of such importance,
the transition has been made from a “childcare-based” approach to an “educational” approach to
children under 3. Therefore, ante-preschool educationalestablishments shallbe organised in
accordance with the quality standards approved by Government Decision and initiated by the Ministry
of Education, which requires education stakeholders and health and childcare service representatives
to share similar views. The accreditation methodology for ante-preschool education service providers is
also drawn up in partnership by the Ministry of Education, Research, Youth and Sports and by the
Ministry of Health.
From now on, pre-primary education shall stretch over three years and the current policy aims at its
gradual mainstreaming. Thus, the number of children aged 3-6 years who are not in kindergarten is
expected to drop significantly, especially in first- and second-year groups, due to integrated support
measures targeting vulnerable child groups.
At the same time, the law stipulates that public funds may be allocated to accredited early childhood
education service providers, regardless if they are public or private. Thus, the principle of “child-based
funding” applies at this level also, aiming at boosting competition between different ante-preschool
education service providers and scaling up children’s access to quality educational and childcare
services.

59
Introducing Preparatory Year
A preparatory yearwill be introduced in order to offer children a gradual transition, in an integrated and
organised setting, from pre-primary education (for those who have attended it) or from an exclusive
home life (for those who have not attended pre-primary schooling) to school life. On the one hand, the
prep year will build up the preparation of those who have been part of pre-primary education, and on
the other hand it will allow those who have never been enrolled in kindergarten to socialize, to become
accustomed to life in a group and acquire the skills needed for school.
A great advantage of this new arrangement is that the prep year is an integral part of compulsory
education. Therefore, it is expected that introducing a preparatory year in primary schooling should
have a positive impact on children from socially and economically challenged or low-opportunity groups
– that, as we have seen, have the smallest participation rate in pre-primary education which leads to
educational disadvantage later on after signing up for primary school. The experience gained in projects
that promoted summer kindergartens, implemented by the Ministry of Education and other
governmental and non-governmental organizations, has evidenced the beneficial effects of such
programmes on children’s social and school integration, as well as increased chances for academic
success. Whilst major results can be noticed after a few week-long interventions, compulsory
participation in a prep year will increase the chances for school integration and academic achievement,
with lasting effects during compulsory schooling years.
Last but not least, this will lead to a more harmonised compulsory school starting age (at present,
especially in urban areas, children start 1st grade at around 7 years of age) and, consequently, to more
homogenous age groups, with benefits to students and teachers.
Changes in Lower Secondary Education
At the moment, during compulsory schooling right after 8th grade, students must embark on a
differentiated pathway (high school with different sections and profiles, apprenticeship or vocational
school), which means that at the end of compulsory education they cannot meet the same standards
because they do not benefit from the same training. The measure to extend lower secondary education
to five years (thus comprising 5th-9
th grades) aims at providing a continuous and unitary educational
pathway which allows compulsory schooling to end after lower secondary level.The advantages to this
come primarily from the possibility of designing the academic content in a coherent manner in order to
attain the purpose of compulsory schooling at the end of lower secondary stage through a unitary
curriculum.
This change also postpones the time when students have to choose the type of school they want to
attend after 8th grade, from the age of 14-15 years to 16 years, which increases the chances of them
making conscious and informed decisions about their own future. This future may mean continuing their
studies or entering labour market, which they can legally do at the age of 16 years.A lower secondary
9th grade will allow more children to finish compulsory schooling in a context where, at present, the
drop-out rate is high, especially in 8th grade. This phenomenon is more common to children from
socially and economically disadvantaged families who cannot afford to pay board and lodging costs in
order to send them to school in another town.
But there is still the issue of the options available for continuing school after compulsory education
given that Schools of Arts and Trades, the only vocational option that could lead to a qualification, have

60
been closed down and currently there is no other vocational option in upper secondary education
besides technological high schools. As indicated in the previous chapter, without a viable alternative for
carrying on with school, students and their families opt for leaving school before the end of secondary
education (8th grade) once the child can engage in work inside or outside the household.
Teaching Staff Development
According to the new regulations, every member of the teaching staff will be conferred the same title
(teacher) and will need to hold a higher education degree. At present, the teaching staff hired in the
education system is under-trained especially in the area of practical work. Teacher initial training will
change to require bachelor degrees in one specialty, a two-year teaching master’s and one-year
internship in an educational establishment under the supervision of a mentor teacher.
Bachelor degree holders are encouraged to get an interest in launching a teaching career through
teaching master’s scholarships funded from the state budget that equal the net salary of a starting
teacher. The applicant may land a teaching position for their one-year internship through an open
competition for available positions/chairs or based on a fixed-term employment contract for one school
year. At the end of their internship, the starting teacher must sit the national teacher certification exam
whose passing score confers the title of teacher with the right to teach in pre-university education.
The initial training system continues to face major challenges such as: boosting the participation of
youth from socially and economically challenged settings, from remote or rural communities (and going
back to teach in the schools of their communities); supplying the needed teaching staff in lines of study
where the private sector offers better job opportunities (like foreign languages, IT).
As for good practice related to management and governance, the Ministry of Education, Research,
Youth and Sports will set up the nationalbody of experts on educational management following the
competition-based selection of teachers who make proof of having graduated from a certified training
programme in educational management, with a minimum of 60 ECTS credits. In these programmes,
supporting low-opportunity students’ access to and participation in quality education is foreseen to play
an important part of the training curriculum.
At the same time, in the new context, educational establishments and local governments may decide on
establishing school consortiums (i.e. contractual partnerships between educational establishments) that
allow the free movement of staff across the schools that are members of the consortium; shared usage
of the resources available to the educational establishments that are part of the consortium; expansion
of learning opportunities provided to students and mutual recognition of their learning achievements
and appraisal scores.
At the level of the educational establishment, decisions on vacant teaching positions, open competitions
and teaching staff employment are made by the school board.
Educational Portfolio
For the very first time, the new act introduces the educationalportfolio which will comprise all the
degrees, certificates or other documents awarded following an assessment of competences acquired
in formal, non-formal and informal learning contexts. The educational portfolio is the central piece
of learning evaluation and will stand for an educational identity card that will be used starting with the

61
prep year. Its main components are: assessment of the child’s cognitive, emotional and social skills at
the end of prep year; assessment of basic skills acquisition at the end of 2nd
grade: reading-writing-
numerical literacy; student appraisal at the end of 6th grade through cross-curricular tests: language and
communication (Romanian language and a foreign language), mathematics and science. The scores
will be used to draw up individual learning plans for students, with better chances to identify any lagging
behind and develop remedial strategies. Moreover, the scores contribute to school and vocational
guidance later on as together with individual plans they are communicated to students’ parents.
Another major initiative that comes to support children at risk of dropping out, with school adjustment
problems and poor attainment is that of assessing at the end of 4th grade the basic skills acquired in
primary school to diagnose the education system based on the model of international tests. These tests
may offer comprehensive information about the groups of students that are lagging behind the most
and about key areas of intervention in their case. New, better targeted policies could be developed,
especially in what concerns remedial education and integrated measures, offering school and social
support to students and families.
At the same time, at the end of 9th grade, a national compulsory cross-curricular appraisal of all
students will be performed. The results, expressed as scores similar to international tests, cumulate the
child’s performance at an interdisciplinary test on communication skills in their mother tongue and an
international auxiliary language, at a test on numerical and science skills and one on computer skills.
The national appraisal scoring goes into the student’s Educational Portfolio and becomes an important
element for the early detection of school factor risks for children at risk of dropping out. As a direct
consequence, more informed decisions will be possible, targeting better the categories at risk.
Challenges remain with regards to out-of-school children issues and the capacity of the education and
training system to recognise the skills these children have acquired in non-formal and informal settings.
Moreover, a specific methodology needs to be developed to allow these children to be registered with
school and vocational guidance centres in order to be assessed and to benefit from dedicated support.
This way, Educational Portfolios may become a major tool for dropouts too in terms of their social and
professional integration, collecting evidences of competences acquired in formal but also in non-formal
and informal contexts.
Another challenge comes from the current low level of cooperation between school actors. All the other
major skills at the end of 9th grade are assessed by the class teacher, school counsellor and the
teachers of the respective class, while avoiding academic failure (and thus drop-out) requires strong
cooperation between all these school players. In reality, teaching focuses more on reaching standards
than on remedial/support activities. Hence, especially in rural schools where many teaching positions
are still not covered by qualified teachers, these activities have still not attained expected active
involvement in common interventions.
3.2. Other relevant on-going supply side policies
This section briefly presents recent strategies and policies relevant for the out of school children. Even
if not explicitly targeted for a specific category at risk identified in previous chapters, these initiatives are
highly relevant for the improvement of the situation of these students, aiming at building an education
system that is stable, equitable, efficient, and predictable: The 2009-2012 Government
Programme, the “Education and Research for a Knowledge-Based Society” Strategy, the National

62
Development Plan 2007-2013, the National Strategic Reference Framework 2007-2013, the National
Reform Programme 2007-2010.
We will next outline a series of on-going programmes that target this objective by: ensuring equity and
access to education and training; school network rationalisation and long-term stabilisation; science-
and fact-basedmodernization of the curriculum; making early childhood education a public good; quality
assurance for pre-university education; efficient system decentralization – coherent regulations, careful
process control and scaling up standard costing per student. All these measures document the results
and good practices related to supply side policies and strategies, the profiles of children in the 5
dimensions of exclusion and the key disparities within them.
3.2.1. Ensuring Equity and Access to Education and Training
Romania has not set national targets for drop-out reduction. Nonetheless, it has taken on board the
benchmark values of the objectives set down in the Europe 2020 Strategy. The memorandum on the
Approval of Final Values of Romania’s Objectives for Europe 2020 Strategy sets the pre-university education
target of cutting down the early school leaving rate to 14.8% by 2013 and to 11.3% by 2020.
To reach the above-mentioned objectives, social programmes and programmes addressed to
disadvantaged groups will be further implemented, whilst compensatory education programmes or
Second Chance programmes will be scaled up for those who have temporarily left formal basic
education, including programmes financed by the European Social Fund. The state budget will continue
to fund:
- Provision of school supplies to children who attend day classes at primary and lower secondary
public schools, whose families’ average net monthly income per family member is up to 50% of
the national minimum gross base salary;
- Money for high school – financial aid to students from low-income families;
- The Croissant and Milk programme for primary and lower secondary school children who
attend public institutions and for preschool children from half-day public kindergartens;
- “Euro 200” – granting financial support to stimulate computer purchase for students from
socially and economically disadvantaged environments, etc.
Even without specific targets, educational authorities declare that they will continue to monitor truancy
and drop-out, especially among Roma students, and that they will develop and implement local,
regional and national information, training, monitoring and communication structures and mechanisms
in relevant areas such as: desegregation/discrimination, prevention and fight against school violence,
inclusion, etc.
But the means to promote extracurricular, extra-scholastic programmes and activities as well as
educational alternatives are still insufficiently developed. For example, as far as methodology and
funding mechanisms are concerned it is still unclear what the means are to scale up the “School After
School” programme, although this is appreciated by parents and school players alike as it allows
students to continue their activities in the school setting at the end of their lessons, to consolidate the

63
knowledge acquired in class or to catch up,while ensuring child supervision and protection. At the same
time, it is not obvious to what extent local authorities want and can offer financial support to this
program as they are often facing difficulties in covering the current costs related to school functioning
(utilities, basic resources, small investments in infrastructure etc.).
School Network Rationalisation and Long-Term Stabilisation
Educational establishments with and without legal personality, with reduced student headcount – below
the threshold prescribed by law – will continue to merge, the classes with a smaller number of students
than the lowest threshold will merge and simultaneous classes will be dissolved. This optimization will
primarily lead to increased learning opportunities for students due to more concentrated material,
financial and human resources available to schools. Starting with the 2010-2011 school year, the
school network was restructured through: a reduction of nearly 1,000 educational establishments with
and without legal personality; a reduction of approximately 1,000 classes with low student headcount.
Even if the impact of distance on school attendance is not systematically assessed/researched, recent
studies on school drop-out (Voicu, 2010; Surdu, 2011) indicate that difficulties in reaching school,
especially in seasons with extreme temperatures is still indicated by families as an important reason
why keeping the child at home.
According to Ministry of Education data, the school network optimization performed during the 2010-
2011 school year has led to an increase in the student-teacher ratio from 13.37 in the 2009-2010 school
year to 13.82 in 2010-2011; an increase in the average number of students in a class from 21.33 in the
2009-2010 school year to 22.03 in 2010-2011; a reduction in the number of positions filled by under-
qualified teaching staff by 45.1%, namely 2,379 positions; a reduction in the number of positions filled
by retired teachers by 32.46%, namely 1,223 positions; an increase in the share of qualified teaching
staff in pre-university education from 97.83% to 98.75% through open competitions for teaching position
vacancies.
Modernizing school infrastructure is one of the key factors to learner attainment. However even if
MECTS will continue to implement projects aimed at addressing the educational disadvantage of
students who learn in out-dated schools, the coverage of these initiatives is still far from the needed
investment: the project on School Infrastructure Rehabilitation – 320 locations to benefit from
investment: pre-university schools will be rehabilitated, modernized and furnished in order to re-
establish school building safety, hygiene and sanitation, and comfort; the project Early Childhood
Education Reform in Romania– 750 locations rehabilitated, consolidated, extended, undergo capital
repairs and will be furnished; the project on social inclusion – Part 2 – The Programme for Inclusive
Pre-Primary Education– 8 locations to benefit from investmentin communities with high shares of Roma
population.
As far as pre-university education goes, the investing priorities of the Ministry of Education, Research,
Youth and Sports have their eye on fund provision to objectives that can be reached in 2011, in
particular to schools that have taken over students from closed down or merged educational
establishments and to institutions that are directly funded by MECTS (i.e. Children’s Palace and Clubs).
The School Campusdevelopment programme for lower secondary levelcould offer the opportunity to
high-school students from categories at risk to study in schools in other locations than the place of
residence. Combined with social support schemes, this policy could address the current exclusion

64
challenge due to limited available campus places and the high costs for students with a disadvantaged
background.
3.2.2. Curriculum Modernization
Following the first major reform of the national curriculum carried out as part of a World Bank
assistance programme over the period 1998-2001, the Romanian education system is now at a crucial
point where it will introduce a new curriculum based on key competences that can better meet current
individual and social needs. To this end, the curricular framework is being prepared as the base for
national curriculum design and implementation and for the writing of framework programmes and
syllabuses.
If in preschool education a modern early childhood education curriculum was already promoted in 2008
for children from birth to the age of 6/7 years (as part of the Early Childhood Education Reform
Programme 2006-2011 coordinated by the Externally Financed Project Management Unit), over the
next period the curriculum modernization process is expected to make it more relevant, attractive and
accessible also to low-opportunity primary and lower secondary school children. The main directions for
curricular reform are, among other things, the promotion of interdisciplinarity, of a school-decided
curriculum, acceptance of non-formal and informal education, digitalization and applicability to everyday
life.
All these steps are a pre-requisite for designing new and more attractive and more relevant textbooks
which are expected to be available to students no later than the 2011-2012 school year. Moreover, as
indicated in the impact assessment of the previous curricular reform programme, appropriate teacher
training with regard to new curriculum application is the key to success for this policy, especially the
training of those teachers who work with children at risk of dropping out. Therefore, traditional focus on
support given to pre-university educational performance and excellence activities will have to be paired
with comprehensive support needs assessment for low-opportunity children. Participation in
international tests (PISA, TIMSS, PIRLS) will help to assess the level of knowledge acquisition and also
these students’ efficiency in following the new curriculum.
3.2.3. Making Early Childhood Education a Public Good
For the children at risk that fall under Dimension 1, the initiatives taken to develop the early childhood
education concept and to create the national implementing background for early childhood education
programmes are most relevant. An impactful programme in this area is the Early Childhood Education
Reform Project (ECERP), a national project co-financed by the Romanian Government and the Council
of Europe Development Bank, implemented over the period 2007-2011 and holding a budget of EUR
105 million. The key areas of intervention aim at: improving kindergarten management; improving the
existing infrastructure through rehabilitation works; refresher courses for teachers working in the
system; increasing the educational service quality at ante-preschool level.
Another important programme is the Programme for Inclusive Early Childhood Education (PIECE),
financed by World Bank (EUR 6.1 million) and the Romanian Government (EUR 1.7 million) as a
component of the Social Inclusion Programme; it is executed over the period of 2007-2011, with a
budget of EUR 7.8 million. The key intervention areas of this programme focus on: creating and
improving educational conditions in order to ensure minimum operating standards for the poorest

65
schools in the most disadvantaged communities, including Roma communities, leading to increased
access to initial, early and basic education; increasing the quality of outputs as well as of educational
inputs; raising decision-makers’ awareness and capacity building in the areas of management, planning
and evaluation.
These programmes were complemented by the initiatives of non-governmental and international
organizations, which focused on the main causes to child non-participation also highlighted in this
report related to preschool education: under-developed network which translates into insufficient
number of places available in kindergartens; inappropriate furnishings and improper operating
conditions; and the family habit that encourages a child to stay home until s/he starts school (Surdu,
2011). In relation to parenting in particular, a major role was played by the UNICEF programme carried
out in partnership with Our Children Foundation and the Ministry of Education and aimed at parenting
skills building (with almost 30,000 parents as beneficiaries) or the projects carried out by UNICEF in
partnership with Holt Romania and the National Child Protection Agency which have resulted in
Community Resource Centres set up in 8 counties across Romania.
EU-funded programmes, especially those falling into the Sectoral Operational Programme – Human
Resources Development, currently underway, may provide significant support to boost child
participation in preschool education addressing both demand and supply side challenges. Here are a
few relevant examples:
- Together with Children for a Quality School Start – Digital Teaching Tools for Prep-Year
Preschool Children (budget: approximately USD 7 million). The project aims at increasing
school adaptability associated with prevention of academic failure in prep-year pre-schoolers by
creating/testing/piloting digital teaching tools and an alternative methodology for school start
preparation.
- All in Kindergarten, All in First Grade – integrated programmes to increase access to
education and the educational level of the children from disadvantaged communities,
with focus on Roma, over 2008-2009 (budget: around USD 6 million). The project aims at
preventing and correcting early school leaving among children aged 5-8 years from 420
disadvantaged communities with high shares of Roma, mainly from rural and small urban
localities, by implementing educational alternatives for pre-schoolers and their parents. The
target group is comprised of 8,400 children at risk of early school leaving, especially children
from rural areas, Roma communities or poor families, participants in the national “Summer
Kindergarten” programme; 6,000 students at risk of early school leaving, especially children
from rural areas, Roma communities or poor families, children with poor academic
achievements, participants in the national “Summer Kindergarten” programme; 2,100 people –
specialised staff trained and involved in the implementation of alternative educational
programmes: “Summer Kindergarten”, “School After School”, “Parenting School”; 10,000
parents/legal guardians of children at risk of early school leaving, mostly from Roma
communities, rural areas and poor population, who will benefit from information and counselling
on child education; 5,000 parents/legal guardians of children at risk of early school leaving
mostly from Roma communities, rural areas and poor population, participants in the “Parenting
School” programme; 8,000 children from disadvantaged communities/families (including from
the Summer Kindergarten programme) who benefited from subsidies consisting of a basic

66
clothing kit for 1st grade enrolment; 420 representatives of disadvantaged communities –
community promoters – trained and engaged in the community development process.
Moreover, a preschool prep learning kit was developed in the project, “From Here... to 1st
Grade”, containing the textbook-notebook for the 23 days of preschool preparation and related
learning materials (pre-schooler component – 20,000 copies) and the Guidelines for the
Summer Kindergarten Teacher (teacher component – 1,000 copies) as well as a kit with
specific teaching/learning materials useful for the implementation of the “School After School”
educational programme.
3.3. Demand side educational and social
policiesdirectlytargetingexcludedgroups
To address socio-economic and cultural barriers facing children at risk of dropping out, in the last few
years a series of specific intervention policies and programmes have been developed and implemented
both at national and regional levels. With the main goal of increasing the quality of services provision in
pre-university education, these initiatives targeted mainly demand side issues (socio-cultural aspects,
improving social and material conditions for the family and the community).
Besides the above-mentioned policy measures, in this section we will look at other examples of relevant
interventions and strategies, described from a needs perspective of the main vulnerable groups
identified in Chapter 1: Roma children, children from rural areas, children from poor families, and
children with SEN.
Demand Side Policies Addressing Roma Children
Some of the policy measures taken by Romania in the context of the European Union accession –
directly or indirectly – aimed at improving the condition of Roma population at different levels (social,
economic, financial, cultural, educational, community, public administration, etc.). These documents
made the general framework of public Roma policies: The Strategy for Improving the Condition of the
Roma(2001-2010), The National Anti-Poverty and Social Inclusion Promotion Plan (2002-2012), The
Joint Inclusion Memorandum (2005-2010). To these added the signing of the European initiative The
Decade of Roma Inclusion (2005-2015), whereby Romania took the commitment to promote active
policies for Roma inclusion, with a focus on four priority areas: education, health, employment, housing
– in parallel to the cross-cutting areas of fight against poverty, discrimination and gender inequality.
Nevertheless, the surveys conducted in this area (Stoian, 2010) highlight certain gaps between the
provisions set forth in these policy documents and reality, as well as the lack of mechanisms
implemented to monitor and evaluate ameliorative interventions for Roma. But at the same time, at
some levels, the efforts to improve the condition of Roma, including from the point of view of school
participation, have had positive outcomes. We could name a few initiatives that addressed socio-
cultural barriers (language, prejudices and stereotypes, etc.):
- Social and media campaigns aimed at raising public awareness of Roma prejudices and advocating
for equal access to social/educational services (examples: The 2009 Dosta! Leave Your Prejudices
Behind, Get to Know the Roma! Campaign; the campaign entitled Roma discrimination is picked up

67
at home. Get to know them before you judge them! carried out in 2008 and 2009; the campaign Jan
angle, Romale! (Take a Step Forward!) from 2009 targeting the Roma population);
- Setting up Inclusive Education Resource Centres at county level – with a role to document, advise,
monitor and offer support in the area of inclusive education;
- Creating Romani language classes (as of 1990) to train Romani language kindergarten teachers
and schoolteachers;
- An appointed inspector for Roma matters in each County School Inspectorate – with a role to
monitor, advise and lend support to schools with Roma students and Roma/Romani language
teachers;
- Establishing the school mediation practice by creating school mediator positions as an interface
between school and community, with a role to enhance communication between (Roma)
community and school/teachers (most of them non-Roma);
- Developing “second chance” programmes – as part of the Access to Education for Disadvantaged
Groups PHARE programme – allowing dropouts to continue their studies (in 2007 this programme
reached national coverage);
- Diversity issues integrated into the curriculum – as stipulated in Ministerial Order No 1529/2007;
later, syllabuses were developed and approved for the optional disciplines Intercultural Education
(lower secondary education) and Human Rights (high school);
- Implementing school desegregation measures (under Ministerial Order No 1540/2007);
- Implementing programmes co-financed by ESF funds through SOP-HRD, promoting participation in
pre-primary education as a success factor to school debut; examples: the Roma Children Get
Ready for Kindergarten project (MECTS, Save the Children, 2009-2011); All in Kindergarten – All in
First Grade (MECTS, Ruhama Foundation, 2009-2010); these programmes should be replicated at
county level as building up Roma child participation in preschool education is one of the measures
with the highest impact on reducing drop-out or never attending school risks (Sarău, 2011). Lack of
basic communication skills in Romanian, a low intercultural teaching approach or a non-inclusive
school culture are entailing high difficulties for a Roma child to adapt to school culture without any
prior schooling experience.
- Developing continuing professional development programmes for teachers focused on inclusive
education, intercultural education, child rights – through related programmes offered by MECTS in
partnership with UNICEF (on educational Romanipen, Roma fundamental values, non-
discrimination and non-segregation in school, implemented by Teacher Training Houses or NGO’s
addressing Roma issues (Grigore et al, 2009) or as a national programme component (for example,
Access to Education for Disadvantaged Groups PHARE programmes);

68
- Developing non-formal and extracurricular educational programmes on ethnic diversity (parenting
activities, school contests, exhibitions, activities hosted by Children’s Palace, etc.).
A number of Roma condition monitoring reports point however towards the insufficient application of
such measures (Duminică, 2010). Thus, it is considered that Romanian schools have stayed
preponderantly monocultural, that teachers are under-trained on interculturality during their pre-service
training and that this is exclusively dealt with through continuing training (Stoian, 2010), while some
research shows that segregation-associated phenomena are present in more than two thirds of the
schools with Roma students (Surdu, 2008). Apart from these limitations, the previously mentioned
policies have managed to create a “friendlier school”, where Roma and Romanian children learn
together, with fewer socio-cultural risks determining school non-participation – at least in the schools
where national or local projects have been implemented (Ulrich, 2009).
Demand Side Policies Addressing Children and Adolescents from Rural Areas
In rural areas, the main educational interventions were implemented through the Project for Rural
Education. The measures aimed in particular at improving material conditions and furnishings and
developing human resources in schools – in the sense of HR training and upgrading for successful
curriculum implementation: teacher continuing training programmes; training programmes for unskilled
staff; school-community relationship development programmes. It is indirectly assumed that human
resources development in rural schools and the promotion of a more active school-community
partnership have helped address socio-cultural barriers present in rural settings (lower motivation for
school participation, mistrust in education as a key to academic success in the context of precarious
socioeconomic environment).
Moreover, we need to mention programmes promoted at county level by Child Protection Authorities
and through County Resource and Educational Assistance Centres meant to support children left home
alone by migrant parents. Particularly in rural areas, children’s access to counselling or psychological
assistance services is much more difficult and they are thus more exposed to the risks associated with
this phenomenon.
Demand Side Policies Addressing Children and Adolescents from Poorest Quintile
The policies addressed to children from poor communities have focused mainly on programmes
implemented to improve their precarious economic condition. Thus, the impact assessment of the
Croissant and Milk programme targeting primary and lower secondary school children in public schools
and preschool children in half-day public kindergartens (Arpinte, 2009) indicates that this programme
has proved to be particularly useful for disadvantaged children, for rural school children, Roma school
children and children from poor families. As far as these groups of children are concerned, the
programme had a positive influence in terms of the reduction of drop-out risks in preschool and primary
school children, especially in the first years of implementation.
As already presented another effective programme is the School After School programme. At present,
such programmes are run for Roma children with support from structural funds and national and
international foundations (for example, the project started by Roma Education Fund in 40 communities
across the country with the majority of Roma population).

69
3.4. Social protection policies relevant for out of school children and
adolescents at risk
The social protection and assistance system comes to round out the already mentioned measures with
regard to different types of material or financial support (textbooks, school supplies, free transportation,
provision of daily meals, scholarships, etc.) benefiting school children or their families.
Unfortunately, Romania allocates the smallest percentage of GDP to social expenditure (16.4%
compared to the European average of 31.9%). The percentage allocated strictly to social protection is
only 13% compared to the European average of 26.7% (ICCV, 2010), and in most of the cases funds
are granted for social benefits and protection services and less for prevention services. As in the case
of educational measures, the allocation of resources is insufficient and, in addition to that, the
Romanian social protection system has to deal with inequity in the allocation of resources for different
decentralization levels or even different areas.
Pensions - The Romanian pension system – including old age, disability and survivor pensions - is
based on a PAYG scheme mixed with a recently introduced (2007/2008) private pension system. The
structure comprises three pillars: the first one refers to the social insurance public pension system,
while the second and the third make the private component of the system. The pension programme
data reported in Table 1 refer to the social insurance public pension system.
Work Injury - Temporary disability benefits are contributory. The benefit is paid by the employer until
recovery or the certification of permanent disability.
Sickness and Maternity - Sickness benefits financially cover the periods of time during which the
insured cannot attend work and thus is unable to work for wages. Sickness benefits are complemented
by illness prevention and work capacity recovery indemnities. Besides cash transfers, the insured is
also offered in-kind benefits in the form of recovery treatment or professional rehabilitation training. With
regard to mothers and children, the Romanian state offers maternity benefits, maternity risk benefits as
well as childcare allowances.
Health – medical benefits summarize the Romanian healthcare system. The benefits consist of medical
services for which every Romanian citizen is eligible. It entails basic package of services covered by
national and county insurance bodies. Currently a new reform of the healthcare system is foreseen,
with a draft law launched for public and expert debate.

70
Table 15. Key Programmes of the Social Protection System
Title of the
programme
Start
date
Programme and
Benefit Type Targeting Objectives Existing Coverage
PENSIONS:
Old Age;
Disability
Pension;
Survivor
Pension;
Funeral
Grant
1912,
2001
(1), (3)
Social insurance;
in cash;
contributory
Old Age: Age 63 and 9 months with at
least 12 years and 6 months of
contributions (men) or age 58 and 9
months with at least 12 years and 6
months of contributions (women).
Disability Pension Partial or total
disability regardless of age. Survivor
Pension Eligible survivors who are a
widow(er) who satisfies age and
marriage conditions or has a disability
and children up to age 16.
Funeral Grant Pays for the death of the
insured or the insured’s dependent.
Consumption
Smoothing;
Social Security
5,498,800 of Social
Insurance
Pensioners in 2010:
of which 871.8
receive disability
pensions, 535,200
receive survivor
pensions and 1,400
thousands receive
various other forms
of social allowance.
(2), (4).
Temporary
Disability
Benefits
1912;
2000
(1), (5)
Social insurance;
contributory; in
cash; in-kind
Individuals who sustained injuries at the
workplace or contracted occupational
diseases.
Consumption
smoothing in
case of work
injury or
occupational
diseases.
Sickness
Benefits
1930;
2000
Social Insurance
/ Social
Assistance
based on the
principle of
social solidarity;
in cash
The insured must have at least 1 month
of contributions in the 12 calendar
months before the incapacity began; no
qualifying conditions apply for
emergency surgery and in cases of
tuberculosis, AIDS, or other contagious
diseases
Social Security;
Consumption
Smoothing in
case of Sickness
State
children
allowances
1993
Social
Assistance,
Universal, non-
contributory
Paid for children younger than
age 18 (older if a full-time student or a
trainee). (1)
Improve child
well-being
Social
Assistance 2006
Social
Assistance; non-
contributory,
means-tested
Paid to families and persons without
income or with low income. (1) Poverty relief
Benefits for
the Elderly 2000
Social
Assistance,
non-contributory,
in cash, in-kind,
means-tested
(10)
Elderly individuals with no/insufficient
income, who do not have any family,
who do not have a home, who are
physically unable to care for themselves
(10).
Improve the life
quality of the
elderly segment
of the population
Source: Country Snapshot UNICEF
Social Assistance – Although no coverage or expenditure data is available for this sector, several
programs have been started in the last decade (2000-2010). These consist mainly of social assistance
benefits meant as poverty relief measures for the vulnerable segments of society (those with no or

71
insufficient sources of income, people with special physical disabilities or illnesses - such as blindness
and HIV/AIDS - or some segments of the elderly population who fall through the social safety net). Also,
as part of the Romanian state measures to tackle demographic decline, cash transfers are offered for
new-borns (both at their birth – one-off lump sum, and as support – monthly transfers).
Children are also supported through universal non-contributory child allowances offered on the principle
of social solidarity. Although there are several types of benefits, their worth is reduced due both to
inflation and budget reduction. For example, according to ICCV data (2011), the most widespread
social benefit for children – the child benefit –accounted in 2010 for nearly 7% of the national minimum
gross wage and for 9% of the national minimum net wage. The gradual downsizing of this benefit is
obvious if we compare it to 1989 as its current value stands for around one third of that year’s value.
Involving the education system in the implementation of the child benefit provision mechanism made
receipt of this support conditional on attendance of compulsory mainstream education. The
Constitutional Court ruled out this conditionality by Decision 277 in March 2006. It is interesting to in the
next school year a slight drop in primary and lower secondary enrolment rates (2007/2008).
At the beginning of 2011, a complementary allowance granted to poor families was once again
conditioned by school attendance and the system stakeholders sustained that the measure resulted in
some improvement of the drop-out phenomenon. Even if is too early to assess the real impact on the
conditionality of this support on school attendance, it should be underlined that without other
accompanying measures (i.e. improving the school-related factors), this conditionality could harm the
intrinsic value of attending school, creating long-term expectations on receiving a benefit for staying in
school. Similar NGO initiatives, providing food coupons to families sending their children to school (i.e.
OvidiuRrom project) are also facing this risk.
Table 16. Financing of key programmes
Title of the
programme Coverage (2010) Cost (2009) Financing
PENSIONS:
Old Age;
Disability
Pension;
Survivor
Pension;
Funeral Grant
Total Number of Social
Insurance Pensioners (2010):
5,498,800 of which 871,800
receive disability pensions,
535,200 thousands receive
survivor pensions and 1.4
thousands receive some
various other forms of social
allowance (funeral grant
included). (2), (4).
Social Insurance = 8% of
GDP (2009) (4), (5).
Pensions are calculated using a points system
(Public PAYG Pension System). Employers pay
19.5% to 29.5% of the employee’s gross salary
as a pension contribution. Social security
pension contributions for employees amount to
9.5% of monthly gross wages. (3)
Temporary
Disability
Benefits
967,186,790 thousands lei
(8)
Insured person: None; voluntary contributors pay
1% of the average monthly income; Self-
employed person: 1% of the average monthly
income; Employer: Between 0.15% and 0.85%
of average gross monthly income, according to
the assessed degree of risk; Government:
Provides subsidies. (1)
Administration: National Pension and Social
Insurance Fund; National House for Health

72
Insurance.
Supervision: Ministry of Labour, Family, and
Social Protection;
Sickness
Benefits
583.431 thousands lei (8)
Insured person = None; Self-employed person =
0.85% of earnings;
Employer = 0.85% of covered payroll;
Government = None;
Administration: National Health Insurance Fund
Supervision: Ministry of Health and Ministry of
Labour, Family, and Social Protection;
Finally, benefits are also granted in order to cover heating costs. It is not possible to analyze the trends
in programme coverage and spending due to data unavailability. However, it is possible to highlight
those instruments/programmes that received greater focus. Social insurance pensions represent an
important part of the system with public expenditures equal to 8% of GDP in 2009.
Demand Side Policies Addressing Children with Special Educational Needs
Recent years’ policies have advanced a series of specific measures that come to support the
integration of children with special educational needs in mainstream schools, in various areas: support
planning and services, human resources, and material resources needed to promote inclusive
practices. Nationally, interventions were promoted by two main categories of actors (Ulrich, 2009;
Horga and Jigău, 2008):
- Public institutions working or holding responsibilities in this department, which focused on starting
and promoting legal measures and national strategies and on programme and project
implementation. A few examples: The National Strategy for Community Action from 2004
(implementing a series of actions in the area of inclusion, carried out by school children and
teachers); The Together in the Same School Programme (promoting varied and efficient
educational services capable of meeting every child’s needs); PHARE RO Programme – Access to
Education for Disadvantaged Groups (making access to education for children with SEN a priority);
The Early Childhood Education Reform Project 2007-2011 (which promoted educational support
provided to children with special educational needs from very small ages, 0-3 years, in order to
facilitate their integration in mainstream preschool education); The Project for Inclusive Education
2007-2011 (part of the Social Inclusion Programme, aimed at providing equal access to quality
early childhood education for children from disadvantaged and vulnerable groups – including
children with special educational needs).
- Nongovernmental organizations and international organizations active in the field – which
implemented a series of programmes and projects with international or national support to promote
integrated education, such as: UNICEF, Open Society Foundation, REF, RENINCO, Save the
Children, Centre Education 2000+.

73
The following types of intervention are found in these policies:
- Implementation of human resources training programmes (for school managers, teachers) on
issues relative to inclusive education, non-discrimination, holistic approach to children;
- Recruitment of human resources (support teachers, school counsellors) with a role to sustain
children with SEN and their parents in order to raise awareness of disability and work together to
support them;
- Setting up functional inclusive education resource centres (under GD No 1252/2006) –
subsequently taken over by County Resource and Educational Assistance Centres;
- Development of specific tools to support the integration of children with SEN from special schools
into mainstream schools: LSP (learning support programmes for students with learning difficulties);
PIP (personalised intervention programmes).
The related studies previously cited highlight some shortcomings and the lack of resources needed for
the sustainability of some of the policies dedicated to children with SEN (Horga and Jigău, 2008). The
organisational and administrative steps taken towards these children’s integration into mainstream
education were not paired with an efficient child rights awareness and inclusive climate promotion
campaign at the level of schools, of the civil society or of decision makers. In this context, socio-cultural
barriers that affect Roma children for example overlap those specific to children with SEN as these two
groups of children notably are facing the most stereotypes and prejudices in school and society (Horga
and Jigău, 2008).
As in the case of preschool education, many projects are underway for at-risk primary and lower
secondary school children, financed through the SectoralOperational Programme – Human Resources
Development, such as Support to the special education system through a dedicated educational
portal(budget: approximately USD 8 million). The project aims at developing and stimulating the special
education system in order to offer children with special educational needs (those with mental disabilities
in particular) a better understanding of the environment and the society in which they grow, as well as
to ensure their integration and active and responsible participation in social life.
3.5. Efficient System Decentralization and Scaling Up Standard
Costing per Student
Recent measures in the area of decentralization leave more room to school autonomy. Carrying on the
pre-university education system decentralization has direct relevance to students at risk. By taking on
and fulfilling new roles and functions, schools may have greater capacity to meet these students’ needs
by recruiting qualified teachers, by developing specific programmes/projects or by promoting a relevant
school-decided curriculum. Nonetheless, funding and reporting mechanisms and procedures developed
in a decentralised education system may have a negative impact on the schools located in socially and
economically challenged areas with limited local resources. The implementation of standard costing
reconciled with quality standards and student-specific educational needs, required in order to manage

74
and coordinate a school in a decentralized setting should be systematically monitored. Thus, any
under-funding may be corrected through specific assistance programmes (complementary financing).
The mainstreaming of the “funding per student” scheme (after a long period of historical cost-based
budget allocations) makes public resource allocation transparent and links it to strategic educational
targets. Nevertheless, efficient decentralization and bringing decisions closer to beneficiaries must be
seconded by coherent regulations and process control, which requires improved management control
standards and developing specific training programmes for school management teams. From this
perspective, quality assurance projects play a highly important role, especially in the areas that
educational risk mapping identified as the most disadvantaged:
- Development of the national quality management and assurance system in pre-
university education (budget: approximately USD 6 million). The project aims at developing
the national quality management and assurance system and building a quality culture as a key
means to increase competitiveness and efficiency in the pre-university education system. The
target group is comprised of: management, guidance and control staff active in the MECTS
system, inspectors at County/Bucharest School Inspectorate and experts involved in education
and initial training quality assessment.
- Development of a quality culture and delivery of quality education in the pre-university
educational system in Romania through application of reference standards(budget:
approximately USD 6.5 million). The project aims at building capacity for the pre-university
education system to deliver quality education through the application of reference standards
and through assistance to education and training service providers for the application of
quality/reference standards with the view of regular quality assessment.

75
RECOMMENDATIONS
The analysis of existing school participation data allowed for OOSC categories and characteristics to be
outlined. Unfortunately, the lack of disaggregated data got in the way of an in-depth analysis of school
participation barriers and bottlenecks that these children are faced with. Moreover, without systematic
impact assessments of policies aimed at boosting participation and fighting drop-out, it is impossible to
accurately indicate priority areas of intervention for improving the situation of these children or means to
make current programmes and strategies more efficient and more effective. Starting from the analysis
of available data, this last section of the report tries however to formulate a series of general
recommendations relevant to all OOSC categories. This section equally suggests a number of specific
interventions for each vulnerable category that has been identified: Roma children, children from rural
communities, children from poor families, and children with special educational needs.
Although these recommendations are applicable to all the five dimensions of exclusion targeted in the
OOSC methodology, the main focus is placed on dimensions 4 and 5 – primary and lower secondary
school children at risk of dropping out. This is determined both by the data on hand (collected mainly by
using administrative data available in schools) and by the pragmatic focus on drop-out prevention to the
detriment of interventions meant to recover school leavers. Present INS data show that, in Romania,
the majority of current out-of-school children had a prior experience of enrolment in the formal
education system. Moreover, many surveys indicate that interventions aimed at recovering dropouts
have smaller success rates and require more resources (and therefore bi-annual monitoring and
interventions are often lagging behind). The analysis of profiles of children who have already dropped
out offered important insights for understating the risk factors for children in Dimensions 4 and 5 and for
a. General Recommendations
Collecting and Reporting Drop-Out Data
The distortions identified with regard to students’ real academic record and the inconsistencies between
gradebook entries and statistical statements as reported in an ad hoc cohort analysis of the drop-out
phenomenon (IES, 2011) point towards two main problem categories in this area. First of all, there are
problems related to a school’s context, determined by the little importance given to these aspects by
some educational establishments (acceptance of drop-out as an everyday reality); teachers’ insufficient
knowledge of relevant regulations; little professional experience of the staff responsible for the
statistical reporting of student academic data, with effects on the reported data; personal interpretation
of the regulation. As far as these problems are concerned, there is firstly a need to better train the staff
holding relevant responsibilities, while more efficient monitoring and checking instruments should be in
place both at the level of County School Inspectorates and of each school.
The second category refers to these “methodological” dysfunctions/problems arising from lack of clarity
and precision in definitions and from insufficient harmonisation/coherence between relevant
definitions/regulations. These comprise the inaccurate/ambiguous definition of students’ academic
status in grade book sections and the lack of harmony/coherence between definitions and rules on how
non-attendance should be documented (drop-out, withdrawal, grade retention, other situations, etc.) as
specified in the Organisation and Operating Rules, in the instructions on completing specific grade book

76
sections, and in the guidelines for completing school participation statistical questionnaires (SQs)
administered by NIS.
All these dysfunctions affect the accuracy and the quality of information on student academic record not
only at the level of the researched schools, but potentially at the level of the entire education system.
Hence, conceptually speaking, drop-out should be clearly and consistently defined in order to allow
system-level decision makers, management teams and teaching staff to use a unifying methodology in
this department. Without this, the drop-out phenomenon will remain difficult to detect and measure.
Developing a School Cohort Evolution Tracking System
For a deeper analysis of out-of-school children’s characteristics (for example, family’s living conditions,
engagement in circulatory or work migration, sibling influence, academic failure record, etc.), a long-
term school cohort evolution tracking system needs to be developed and implemented. A national
representative sample (of minimum 5,000 children) could be surveyed in various stages of the
educational pathway, with research repeated every four school cohorts (Voicu, 2010). Alternatively, an
electronic matriculation register could be created allowing for the real-time monitoring of each student’s
school pathway. In this case, for every child that a school identifies to be most at risk of dropping out
basic information on risk factors must be collected. This type of research may offer documented
answers about school, family or community effects on an individual’s educational pathway and on their
later professional course. Identifying OOSC’s characteristics will relevantly inform efficient policies in
education and related areas (social area, health).
Strict School Monitoring of Truancy, Drop-out and Children never attending
school
In order to reduce and to recover out-of-school pre-schoolers and school children it is essential to
strictly monitor school participation as well as truancy, drop-out and children never attending school. In
disadvantaged communities, where these phenomena are more frequent, there is declining respect for
every child’s right to education. Public awareness campaigns on the importance of education must
equally target parents, the public opinion and all school stakeholders: students, teachers, management,
and support staff. Moreover, schools and local authorities also need to be made accountable while local
cooperation organizations should be consolidated to also involve school and health mediators, informal
community leaders, child protection structures, and representatives of NGO’s that run relevant local
projects (Sarău, 2011).
From this angle, it is very important for schools to also monitor the situation of children caught in
circulatory migration. At national level, it is timely to introduce a fly gradebook/academic passport for
those children who often accompany their parents to work in other European countries or in their home
countries in order to recognise the grades attended/finished and some courses followed during the
respective school year (even marks). With certificates issued to document the school record of the
leaving/arriving/returning student, s/he can easily move from one education system to another (Sarău,
2011).

77
Appropriate Human Resources Training on a Curriculum Adapted to the Needs
of Children at Risk of Dropping Out
The current appraisal system pushes teachers towards producing students that perform well at national
tests. On the other hand, the education level of students from socially and economically challenged
settings is way under the national average in terms of performance and any kind of progress they make
is difficult to measure unless it matches national standards. Moreover, teacher training programmes
focused on working with low-opportunity students (differential teaching, formative and individual
progress-centred appraisal, positive approach, etc.) are insufficiently developed.
Because of all these, most often teachers get a feeling of failure as, despite their attempts, they don’t
manage to get the student to the national test-required performance standard. These test scores are
decisive for a school’s good or bad reputation and teachers feel mostly evaluated (formally or informally
by their professional community) based on national scores. Developing relevant training programmes is
not enough unless the current curriculum and the appraisal system take into consideration the existing
differences in economic, social and cultural status and unless they come up with new ways of adjusting
to the needs of low-opportunity children.
Projects that acknowledged the importance of curricular adjustment for drop-out and truancy prevention
(for example, Educational Priority Areas promoted by IES and UNICEF Romania) delivered great
results in this respect. Class-specific and catch-up teaching skills are insufficiently trained in initial
training programmes, which mean that the outcomes of such projects should be systematically
promoted in a context where the entire curricular framework (curricula and syllabuses) is under reform
and the importance of school-decided curriculum is reconsidered.
Recent surveys (Voicu, 2010; Duminică, 2011) indicate that school could catalyse those determinants
that help retain students in the system, and the teachers who are constantly in touch with students play
a special role in this. They may identify and diagnose student problems early on, ask for support from
qualified authorities and start a successful early intervention.
From this perspective, it is crucial to recognise the importance of and the required skills for working with
children at risk of dropping out and to enhance the prestige of teachers who work in the schools where
most of these children learn. This recognition must reflect both in the wages and in other incentives for
these teachers (funding research projects in these schools, facilitating experience exchanges with
schools catering in similar settings, allocating additional teaching resources, etc.). Teachers’ motivation
is important for them to take on new responsibilities besides those strictly related to the subject matter
they teach.
Valorising School-Parents Partnership and Increasing School Attractiveness
As we have seen, the main drop-out causes are the student’s family features. The income level at the
brink of survival, the low level of education, the lack of a stable job and the very low expectations
regarding their children’s education are major risk factors. Hence, the families of the children at risk of
dropping out need to be engaged in school activities, in an open and relevant partnership. More
precisely, parents may be involved in extracurricular event planning and may benefit from counseling or
professional training services. This may add a new meaning to the partnership with the family as
currently schools often turn for support to a handful of parents whose children are not at risk.

78
From this perspective, alternative parenting programmes should be encouraged and they should
promote issues regarding parent-school/teacher communication as well as parent involvement in school
decision making. In addition, with support from local authorities – in charge of covering running costs –
school teams should be championed in their initiatives of making school more attractive to all student
groups. Initiatives like Inclusive School or Friendly School may significantly enhance the feeling of
belonging and the self-esteem of students who many times don’t relate to the school they attend. The
experience of programmes such as PHARE Access to Education, Equal Opportunities or Educational
Priority Areas comes to prove that engaging students at risk of drop-out into extracurricular activities
and stimulating student-teacher and parent-teacher communication are highly important to the success
of drop-out prevention work. In contrast, where students’ academic attainment is constantly looked
down on, a feeling of aversion towards school environment may arise and may be decisive for leaving
school.
Administrative and Management Capacities
The poor cooperation between the institutions responsible for delivering public educational and social
care services leads to insufficient focus on people at risk of social exclusion, who are most in need of
these services and whose vulnerability comes out of their reduced capacity to negotiate and their
sporadic or difficult access to social care services.
As far as this goes, there is a need to build up the administrative capacity to implement programmes
addressing the issues of socially and economically disadvantaged communities as well as to deliver
services targeted at their population. A first priority is to develop decision makers’ and administrative
staff’s competences at national and local levels regarding their capacity to design and implement public
policies and to manage different programmes14.
At present, public policy development faces major shortcomings – especially poor inter-institutional
coordination as regards common problem solving, limited consultation with stakeholders, inaccurate
estimation of the efforts and capacities needed to draw up well-documented reform proposals, frequent
legal framework changes and the high number of citizen regulations. These barriers are also noticed in
the policies promoted at local, county or national level to advance school participation and to prevent or
fight drop-out.
Thus, at the level of schools it has become a priority to develop principals’ managerial experience in
order to allow them to take over and fulfil the new responsibilities deriving from the decentralisation of
education. Unfortunately, the weak cooperation between local governments and schools leads to
school issues being constantly left out of the local decision-making agenda. Hence, management teams
must also build their capacity to organise and facilitate local structures15. To this end, training and
14
Framework-Document for Implementing the Operational Programme Administrative Capacity Development,
October 2009, p8.
15 Sectoral Analysis of Educational Issues, conducted in the document compiled by the Ministry of Interior and
Administrative Reform, Operational Programme Administrative Capacity Development 2007-2013, September
2007, p19.

79
professional development programmes must be adapted and better matched to individual and
institutional beneficiaries’ needs and concerns.
Reasonable Funding for Social and Educational Programmes
Evidence-based systematic impact assessments of current social and educational policy funding could
facilitate swift reactions from decentralised local authorities and deconcentrated services and could
increase trust in people and institutions and their social efficiency.
As we have seen in previous chapters, there is a direct link between resources available (at family,
school, community level, etc.) and the risk of non-attendance or drop-out. The economic reasons are
some of the main drop-out causes which requires above all, in a time of crisis, the sensible use of
existing resources. Unfortunately, in the absence of systematic impact assessments, most of the times
current investments and priorities cannot be improved. For example, the funds that local governments
allocate to education from the state budget cannot incorporate standard costing or correction indicators
so long as these funds are exclusively devoted to staff or scholarship-related expenditures. Therefore,
diversifying funding schemes and, more particularly, correlating institutional performance to the level of
allocated resources in a clearer, more transparent manner are priorities for the current administrative
reform and education decentralisation processes.
Another priority is the modern organisation and management of social services in general and of
educational ones in particular and building capacities to locally absorb national and European funds a
well as funds from other external sources. Given the limited resources, European funds (for example
those available through structural programmes on human resources development – SOP HRD) are a
major resource both for educational establishments and for the organizations that play an active role in
supporting low-opportunity children and families.
b. Specific Recommendations for Identified Categories
Incentives for increasing Roma Participation to Education
Despite several targeted policies conducted since early 90’s in Romania, Roma school attendance
continues to be an important challenge, demonstrating the complexity of the problems addressed. The
School Mediator’sGuidelines (Sarău and Radu, 2011) indicate several intervention priorities for
enhancing the effects of existing policies, including:
• Carrying on and developing programmes to train and co-opt Roma human resources into the
education system: Roma school mediators, teachers, Romani language and literature/Roma history
and traditions methodologists, advancing a network of mentors/tutors to provide educational
assistance to Roma high school students admitted on dedicated 9th grade places;

80
• Training non-Roma teachers working with Roma students and children on the educational
Romanipen profile, Roma fundamental values, non-discrimination and non-segregation in school;
• Enhancing Roma school attendance also by motivating them to attend lessons of Romani language
as a mother tongue or even to study entirely in this language;
• Encouraging Roma lower secondary students to attend high school and university by providing
dedicated places to Roma applicants upon their admission to high schools and universities; granting
scholarships for Roma medical staff;
• Carrying out special training programmes for school principals and school mediators in Roma-
majority schools to reduce truancy and drop-out.
The guidelines also point to other priority interventions for Roma students who have dropped out or are
at risk of dropping out, which are consistent with the findings of this report. The most important ones
refer to banning Roma segregation in the Romanian education system and promoting (historical/ethnic,
linguistic/cultural/religious/gender/physical, etc.) diversity. Basically, they promote the idea of efficiently
monitoring the observance of current regulations banning Roma children’s school segregation and
approving the methodology for preventing and addressing Roma children’s school segregation against
the backdrop of educational establishment reconfiguration. This intervention should be carefully
analysed given that some Roma parents think that it would be preferable for their children to learn in
Roma-exclusive schools (Surdu, 2011) and that there are other barriers pointed out in the anti-
segregation policy evaluation report (Surdu, 2008) conducted in 2008, which didn’t produce noteworthy
results, being either ignored or little known in schools.
In this context, it is also important to carry on with the measures that provide assistance to the children
who haven’t attended kindergarten and are about to start 1st grade, such as: 3 to 4-week 1
st Grade Prep
Summer Kindergartens or the Summer Kindergarten meant to make children accustomed to preschool
education (and later direct them towards kindergarten) where teaching is also done in Romani language
(based on a bilingual approach: Romani – Romanian, Romani – Hungarian).
Measures for Children from Poor Families
A first solution frequently mentioned in various surveys and research is to improve the economic
situation in the families of the students at risk of dropping out or who have already dropped out. There
is obviously a strong connection between the family’s economic status and a student’s likelihood of
dropping out at some point or of being left out of the education system. Social campaigns, aimed at
offsetting poverty, play a major role in bringing to and keeping children in school. Unfortunately, the
state allocates extremely small resources to such campaigns and they remain quite inefficient (ICCV,
2011). The main financial support measure for students – social scholarships – doesn’t rise to the
needs of children from poor families. Recent measures set forth in the Education Act must be
systematically applied, monitored and evaluated, taking into account the fact that at present the number
of granted scholarships is estimated to be at least three times inferior to the real needs.
At the same time, teacher training programmes should address the current tendency of paying regard
to the student’s socioeconomic status during the appraisal. Given that academic failure (for example,
frequent grade retention) is one of the major factors contributing to drop-out, developing teachers’ skills
on teaching methods adapted to these children’s needs constitutes a priority.

81
In addition, some teachers have embraced the stereotype that uneducated parents are not interested in
school and in their child’s academic pathway. Nonetheless, recent studies (Surdu, 2011; Voicu, 2009)
show that, although this statement is often mentioned as a cause to drop-out, in reality things couldn’t
be more different: the lower the education level of family members is, the more interest they take in
school and their child’s participation in educational activities. Thus, research findings indicate that
illiterate parents are three times more numerous to express a positive attitude towards school and
education than the other parents(Surdu, 2011).
Measures for Children from Rural Area
Both national and international assessments point to a significant academic attainment discrepancy
between students from urban areas and those from rural areas. As seen in Chapter 1, the discrepancy
between the two areas of residence reflects in lower school attendance rates in rural communities. Also
considering the fact that for several decades qualified teachers preferred to work mostly in an urban
area-situated school, we notice that this gap is impossible to narrow without the systematic promotion
of policies that enhance the quality of education in rural settings.
Once again, investments in human and material resources are crucial but their level needs to be
transparently correlated to a significant added value. In this context, it is recommended to use the
educational risk mapping tool providing an undistorted picture of an institution’s performance according
to the context where it operates (ARACIP, 2011).
From this perspective, the priority is to assist low-resource local governments from remote areas to fulfil
current responsibilities and to support the project aimed at improving educational quality. Without this
support, key programmes, such as employment of school mediators, provision of school transport or
supply of equipment and teaching materials, are not possible.
Measures for Children with Special Educational Needs
Chapter 2 to this report presented a brief overview of major challenges regarding the education of
children with SEN: a shortage of specialised staff that can identify children with SEN (school
counsellors, support teachers, speech therapists); the lack of a coherent initial assessment system for
the early identification of children with SEN; the number of children with SEN integrated into
mainstream schools left out of national statistics; children with learning difficulties who are not officially
recognised are not included in statistics, are not monitored and often don’t benefit from supportive
services; fearing labelling or out of indifference, some parents don’t engage in the child assessment
and special educational needs identification process.
Priority measures must focus on supplying support staff and addressing current differences between
counties (from less than 10 support teachers/county to more than 100). At the same time, access of
rural schools to support teachers and auxiliary support staff (school counsellors, school psychologists,
speech therapists, etc.) should be reviewed.

82
Particularly as regards children with SEN integrated in mass education, there is still a great need for
training on working with these children. Competences on inclusive education and efficient approach to
children with special educational needs are lacking and in some counties teachers haven’t yet benefited
from any training in this department. Moreover, related training offers need to be diversified as right now
they only partially match the needs of the teachers who work with these children.
A priority remains improving the physical infrastructure of schools which is currently insufficiently
adapted to ensure access and appropriate schooling to students suffering from different types of
physical disabilities and has few means to ensure adequate spacing for individual work with students
with SEN. What is equally needed is to continue the programmes aimed at outfitting counselling and
speech therapy offices, including with teaching materials needed when working with children with SEN
(worksheets, ancillaries, special notebooks, etc.), which are almost inexistent right now, and with
information resources on learning difficulties and working with children with SEN which are presently
scarce.
*
* *
We won’t conclude before making one last recommendation. Most measures aimed at combating drop-
out phenomena which have been recently proposed and endorsed at national level are centred on
coercive methods. For example, the provisions laid down in the Education Act 1/2011 prescribe that
“the parent or legal guardian must take measures for the student’s schooling throughout compulsory
education years.” (Art. 86, paragraph 3), and failure to conform to this paragraph entails a fine sanction
or community service. Police involvement in the fight against drop-out is already a relatively common
practice, especially in the rural communities that don’t benefit from the services of a school mediator or
a psychologist.
This approach could turn drop-out into a crime-related issue, especially without a clear definition of the
term, and may generate abuses and discrimination. Moreover, imposing financial coercions on social
groups living in extreme poverty is counterproductive, and the “community service” solution may lead,
under conditions of poverty, to a slide into “forced labour”. From the perspective of Romanian decision-
making authorities, the response to drop-out must be paired with adequate support measures so that
this obligation may be assumed and fulfilled. Without such assistance, punitive measures will aggravate
drop-out triggers even more, cancelling out the measures that are based on an equal partnership
between school and family and replicating the effects of affirmative measures that are not regarded as
rights that come with duties.

83
Bibliographic References
1. Caragea, N., Education Trends in Romania - A Statistical Analysis by Gender for the Last
Decade, Tehnologia Inovativă, nr. 3/2010, p. 55-61.
1. Dobrică, P. and Jderu, G. (2005). Educaţia şcolară a copiilor romi. Determinări socio-culturale.
Bucureşti: Ed. Vanemonde.
2. Dumincă, G., Ivasiuc, A. (2010). O şcoalăpentrutoţi? Accesul copiilor romi la o educaţie de
calitate. Raport de cercetare. Bucureşti: Ed. Vanemonde.
3. Fartușnic, C. (coord.) (2011) Final results of Priority Education Areas Project 2010-2011,
Bucharest: Institute for Education Sciences.
4. Fleck, G. (coord.) (2006). Metodologie pentru soluționarea problemei lipsei actelor de stare
civilă, de identitateși locative, Phare RO2004/016-772.01.01.01.
5. Fleck,G. and Rughinis,C. (2008). Come closer: Exclusion and Inclusion of Roma in Present-
Day Romania, Romanian Government.
6. Grădinaru și Manole (coord.) (2010) Învăţământul gratuit costă! Cercetare cu privire la costurile
”ascunse” din educaţie.
7. Grigore, D. et all (2009) Evaluarea politicilor publice educaționale petnru rromi. București: Ed.
Alpha MDN.
8. Horga, I. and Jigău, M.(coord.)(2009). Situaţia copiilor cu cerinţe educative special incluşi în
învăţământul de masă. Bucureşti: Ed. Vanemonde
9. Ionescu, M. șiMatache, M. (2011) Roma Early Childhood Inclusion Report, UNICEF.
10. Istrate, G. (coord.) (2010). Sistemul educational în România. Date statistice. București:
Institutul Național de Statistică.
11. Istrate G., (2007), Hrehorciuc-Caragea N., Time spent in education – a key of social and
economic development, Proceedings of IATUR Conference, USA, SSRN
12. Jigău, M. (coord.) (2002). Participarea la educație a copiilor romi. Probleme, soluții, actori.
București: Ed. Marlink.
13. Jigău, M. (coord.) (2002). Învăţământul rural din România: condiţii, problemeşistrategii de
dezvoltare. București: Ed. MarLink.
14. Jigău,M. (coord.) (2004). Violențaînșcoală. București: Ed. MarLink.
15. Jigău, M și Fartușnic, C (coord) (2011): Estimarea dimensiunii fenomenului de abandon şcolar
folosind metodologia analizei pe cohortă. București: ISE (în curs de publicare).
16. Măntăluță, O (coord.) (2008) The impact of school material resources on student achievement,
Bucharest: ISE.

84
17. MECT (2008). Implementarea metodologiei şi a instrumentelor pentru monitorizarea şi
evaluarea Proiectului pentru Învăţământul Rural. Studiu final.
18. Sandu, D. (2005) Comunitatile de Romi din România- O harta a sărăciei comunitare prin
sondajul PROROMI, Banca Mondială, București.
19. Surdu, L. (coord.) (2011). Participare, absenteism școlar și experiența discriminării în cazul
romilor din România. Romani Criss, București: Ed. Vanemonde.
20. Toth A. (coord.) (2008). Analiză la nivel naţional asupra fenomenului copiilor rămaşi acasă prin
plecarea părinţilor la muncă în străinătate. Buzău: Ed. Alpha MDN.
21. Ulrich, C. (coord.) (2009). Programele PHARE „Acces la educaţie pentru grupuri
dezavantajate”. Studiu de impact. București.
22. Vasile, M. (2010) Stiluri de viată în România post-comunistă. Ce modele comportamentale
adoptăm și de ce. Iași: Ed. Lumen.
23. Voicu, L. (coord.) (2010) Renunțarea timpuriela educație: posibilecăi de prevenire.București:
Ed. Vanemonde.
24. Vrăjmaș, T. (coord.) (2010) Incluziuneașcolară a copiilor cu cerințeeducaționalespeciale.
Aspirațiișirealități. București: Ed. Vanemonde.
*** European Values Survey, 2008.
*** Gallup Survey for the European Union Agency for Fundamental Rights, 2009
*** INSOMAR Survey (2009). Discrimination Phenomena in Romania – Perceptions and Attitudes,
CNCD, INSOMAR.
*** Education in Romania, Research in Romania.Report of the Presidential Commission for Educational
and Research Policy Analysis and Development, Bucharest, 2007.
*** Final Longitudinal Study, Rural Education Project, UMPFE, Ministry of Education, Research and
Youth.
*** Report on the State of Education, 2010: Ministry of Education, Research and Youth.
*** România în cifre 2011 [Romania key figures 2011], National Institute for Statistics.
*** Cartea Albă, 2008: Ministry of Education, Research and Youth
*** Caiete statistice INS, 2005-2011 privind învățământul preșcolar, primar, gimnazial, professional și
liceal din România, Institutul National de Statistica [Statistical reports INS, 2005- 2011 for pre-school,
primary, lower secondary, professional and high school level in Romania, National Institute for
Statistics].

85
ANNEX Table 1: Percentage of students of pre-primary age in pre-primary or primary education, by
gender and other characteristics
Year
Not attending
school
Attending pre-
primary school
Attending
primary school
Attending either
pre-primary or
primary
Male
Residence
2005/06 Urban 16.25 77.48 6.28 83.75
Rural 23.49 68.89 7.17 76.06
Total 20.36 72.88 6.76 79.64
Female
Residence
Urban 14.34 78.79 6.83 85.62
Rural 22.56 69.85 7.59 77.44
Total 17.86 74.00 7.24 81.24
2006/07 Male
Residence
Urban 17.66 76.92 5.42 82.34
Rural 22.07 71.69 6.24 77.93
Total 19.98 74.17 5.85 80.02
Female
Residence
Urban 15.21 78.61 6.18 84.79
Rural 20.81 72.47 6.72 79.19
Total 18.15 75.39 6.46 81.85
2007/08 Male
Residence
Urban 15.46 79.62 4.92 84.54
Rural 22.18 71.93 5.89 77.82
Total 18.91 75.67 5.42 81.09
Female
Residence
Urban 13.72 80.73 5.56 86.28
Rural 20.89 72.85 6.26 79.11
Total 17.41 76.67 5.92 82.59
2008/09 Male
Residence
Urban 15.99 79.32 4.70 84.01
Rural 22.17 72.43 5.40 77.83
Total 19.09 75.87 8.05 80.91
Female
Residence
Urban 14.39 80.47 5.14 85.61
Rural 20.45 73.63 5.92 79.55
Total 17.43 77.04 5.53 82.57
2009/10 Male
Residence
Urban 16.79 78.98 4.23 83.21
Rural 20.86 74.20 5.12 79.14
Total 18.76 76.58 4.66 81.24
Female
Residence
Urban 15.71 79.60 4.69 84.29
Rural 19.19 75.15 5.66 80.81
Total 17.40 77.44 5.16 82.60
Source: INS

86
Table 2: Percentage of children attending school, by age and level of education
Pre-
pr. Primary
L.
Sec.
Upper
Sec.
Post-
Sec. Total
Pre-
pr. Primary
L.
Sec.
Upper
Sec.
Post-
Sec. Total
Pre-
pr. Primary
L.
Sec.
Upper
Sec.
Post-
Sec. Total
Pre-
pr. Primary
L.
Sec.
Upper
Sec.
Post-
Sec. Total
Pre-
pr. Primary
L.
Sec.
Upper
Sec.
Post-
Sec. Total
M 2005/2006 2006/2007 2007/2008 2008/2009 2009/2010
3 53.43 53.43 56.87 56.87 60.60 60.60 62.27 62.27 61.71 61.71
4 74.55 74.55 75.35 75.35 79.25 79.25 78.82 78.82 78.99 78.99
5 85.83 85.83 85.11 85.11 85.09 85.09 86.18 86.18 86.47 86.47
6 76.56 26.40 102.96 78.66 22.34 101.00 77.80 21.30 99.10 76.68 20.34 97.02 79.73 19.16 98.89
7 5.36 91.33 96.69 5.75 90.45 96.20 5.91 89.46 95.37 5.80 90.61 96.41 6.30 89.11 95.40
8 98.94 98.94 95.14 95.14 94.86 94.86 93.85 93.85 94.39 94.39
9 98.54 98.54 100.36 100.36 95.69 95.69 95.53 95.53 95.08 95.08
10 87.86 10.36 98.22 86.97 10.07 97.04 75.21 23.82 99.03 75.13 19.93 95.06 78.52 17.27 95.79
11 15.01 82.42 97.43 15.08 82.83 97.91 11.10 84.60 95.71 11.81 86.07 97.89 11.55 82.78 94.34
12 7.38 93.43 100.81 6.91 91.84 98.75 7.05 92.62 99.67 6.65 91.44 98.10 6.25 94.19 100.44
13 92.69 92.69 94.34 94.34 91.79 91.79 92.77 92.77 92.73 92.73
14 84.47 9.75 94.22 82.19 7.84 90.03 83.65 7.79 91.44 81.82 7.71 89.53 82.72 8.90 91.62
15 14.30 63.96 78.25 17.48 72.28 89.76 16.74 69.64 86.39 16.79 73.19 89.97 16.11 70.98 87.08
16 7.99 75.77 83.76 7.79 67.43 75.22 9.93 77.88 87.81 9.94 74.24 84.18 10.77 77.04 87.81
17 69.83 69.83 70.73 70.73 63.31 63.31 75.22 75.22 72.75 72.75
>17 21.78 2.19 23.97 25.66 1.47 27.13 29.21 1.71 30.92 28.86 2.21 31.07 31.53 2.65 34.18
F 2005/2006 2006/2007 2007/2008 2008/2009 2009/2010
3 56.65 56.65 59.42 59.42 63.02 63.02 64.42 64.42 64.50 64.50
4 75.49 75.49 78.16 78.16 79.79 79.79 80.28 80.28 80.26 80.26
5 86.26 86.26 85.78 85.78 87.39 87.39 87.38 87.38 87.49 87.49
6 76.36 28.05 104.41 77.71 24.64 102.35 76.64 23.16 99.80 76.51 22.48 98.99 77.97 21.12 99.09
7 4.86 92.41 97.27 5.24 90.37 95.60 5.16 90.12 95.28 5.11 90.17 95.28 5.34 90.70 96.04
8 97.62 97.62 95.32 95.32 93.95 93.95 93.94 93.94 93.39 93.39
9 98.50 98.50 99.57 99.57 96.02 96.02 94.46 94.46 94.74 94.74
10 86.69 11.21 97.90 86.08 11.14 97.22 71.41 26.24 97.65 73.33 22.07 95.40 75.07 19.43 94.50
11 12.28 84.04 96.31 12.32 84.95 97.27 8.73 86.73 95.46 9.46 86.77 96.23 9.63 85.21 94.84

87
12 4.66 94.01 98.66 4.19 92.19 96.38 4.43 93.39 97.83 4.09 92.72 96.82 3.91 93.52 97.43
13 93.37 93.37 94.31 94.31 91.92 91.92 93.41 93.41 93.01 93.01
14 84.44 12.01 96.46 82.10 9.74 91.84 82.80 9.08 91.87 81.21 9.78 90.99 81.73 10.52 92.25
15 10.17 69.41 79.58 13.18 78.23 91.42 12.62 74.56 87.17 12.66 77.34 89.99 12.38 76.14 88.52
16 4.03 79.36 83.40 3.86 70.68 74.55 5.11 81.95 87.06 5.23 77.31 82.55 5.86 79.13 84.99
17 74.70 74.70 73.86 73.86 66.27 66.27 79.41 79.41 75.65 75.65
>17 19.90 4.35 24.25 22.77 4.03 26.79 25.93 4.93 30.87 25.94 5.75 31.69 27.97 7.19 35.16
T 2005/2006 2006/2007 2007/2008 2008/2009 2009/2010
3 54.98 54.98 58.11 58.11 61.77 61.77 63.31 63.31 63.06 63.06
4 75.01 75.01 76.71 76.71 79.51 79.51 79.53 79.53 79.61 79.61
5 86.04 86.04 85.43 85.43 86.20 86.20 86.76 86.76 86.97 86.97
6 76.46 27.20 103.67 78.20 23.46 101.66 77.24 22.21 99.44 76.60 21.37 97.97 78.87 20.11 98.99
7 5.11 91.86 96.97 5.50 90.41 95.91 5.55 89.78 95.33 5.46 90.40 95.86 5.83 89.88 95.71
8 98.30 98.30 95.23 95.23 94.41 94.41 93.89 93.89 93.90 93.90
9 98.52 98.52 99.97 99.97 95.85 95.85 95.01 95.01 94.92 94.92
10 87.29 10.77 98.06 86.54 10.59 97.13 73.35 25.00 98.36 74.25 20.97 95.23 76.83 18.33 95.16
11 13.68 83.21 96.88 13.73 83.87 97.60 9.95 85.64 95.59 10.66 86.42 97.08 10.62 83.96 94.58
12 6.05 93.71 99.76 5.58 92.01 97.59 5.77 93.00 98.77 5.41 92.07 97.47 5.11 93.86 98.97
13 93.02 93.02 94.33 94.33 91.85 91.85 93.08 93.08 92.87 92.87
14 84.46 10.85 95.31 82.15 8.77 90.91 83.23 8.42 91.65 81.52 8.72 90.25 82.24 9.69 91.93
15 12.27 66.63 78.90 15.39 75.18 90.57 14.73 72.04 86.77 14.77 75.22 89.98 14.29 73.49 87.78
16 6.04 77.54 83.58 5.86 69.02 74.89 7.58 79.86 87.44 7.64 75.74 83.38 8.37 78.06 86.43
17 72.21 72.21 72.27 72.27 64.76 64.76 77.26 77.26 74.17 74.17
> 17 20.87 3.24 24.11 24.25 2.72 26.96 27.61 3.29 30.89 27.43 3.95 31.37 29.79 4.87 34.66
Note: For the ages of 6 and 12 years the values exceed 100% because the data on the children enrolled in the respective levels of education (pre-primary and primary) refer to the
population of “X years and over” and the respective number relates to the population of “X years”.
Source: INS

88
Table 3: Adjusted net enrolment rate (ANER), by gender and level of education, with GPI
2005/2006
Level of education Male Female Total GPI (M/F)
Primary school 96.73 96.60 96.67 1.00
Lower secondary 96.18 96.15 96.16 1.00
2006/2007
Primary school 95.71 95.59 95.65 1.00
Lower secondary 95.11 94.85 94.98 1.00
2007/2008
Primary school 94.72 94.41 94.57 1.01
Lower secondary 94.56 94.19 94.38 1.00
2008/2009
Primary school 93.79 93.53 93.66 1.00
Lower secondary 94.47 94.30 94.36 1,00
2009/2010
Primary school 93.66 93.38 93.52 1.00
Lower secondary 94.73 94.36 94.55 1.00
Source: INS
Table 4: Number of children out of school, by age group and gender
2005/2006 Male Female Total
Primary school age 14843 14666 29509
Lower secondary school age 19330 18554 37884
2006/2007
Primary school age 19467 19062 38529
Lower secondary school age 23868 23999 47867
2007/2008
Primary school age 23938 24101 48039
Lower secondary school age 25635 26086 51721
2008/2009
Primary school age 28090 27829 55919
Lower secondary school age 25431 24972 50403
2009/2010
Primary school age 28220 27885 56105
Lower secondary school age 23882 24306 48188
Source: INS
Table 5: Percentage of out-of-school (dropped out) children across primary and lower secondary school ages
Year
Dimension 2
Primary age
Dimension 3
Lower secondary age
Male Female Total Male Female Total
2005-2006 1.70 1.30 1.50 2.30 1.80 2.10
2006/2007 1.90 1.50 1.70 2.50 2.10 2.30
2007/2008 2.00 1.50 1.80 2.50 2.00 2.20
2008/2009 1.60 1.30 1.40 2.00 1.80 1.90
2009/2010 1.60 1.30 1.40 1.80 1.50 1.70
Source: INS

89
Table 6: Percentage and number of primary school age children out of school, by age and gender (%)
Year Age Male Female Total
% Number % Number % Number
2005/2006 7 8.67 9958 7.59 8252 8.14 18210
8 1.06 1174 2.38 2500 1.70 3674
9 1.46 1679 1.50 1633 1.48 3312
10 1.78 2032 2.10 2281 1.94 4313
2006/2007 7 9.55 10879 9.63 10490 9.59 21369
8 4.86 5585 4.68 5089 4.77 10674
9 1.90 2152 1.69 1803 1.80 3955
10 2.96 3397 2.78 3027 2.87 6424
2007/2008 7 10.54 12072 9.88 10723 10.22 22795
8 5.14 5857 6.05 6584 5.59 12441
9 4.31 4941 3.98 4326 4.15 9267
10 0.97 1068 2.35 2468 1.64 3536
2008/2009 7 9.39 10290 9.83 10223 9.6 20513
8 6.15 7043 6.06 6576 6.11 13619
9 4.47 5092 5.54 6030 4.99 11122
10 4.94 5665 4.60 5000 4.77 10665
2009/2010 7 10.89 11655 9,30 9327 10.12 20982
8 5.61 6141 6.61 6871 6.10 13012
9 4.92 5629 5.26 5703 5.08 11332
10 4.21 4795 5.50 5984 4.84 10779
2005/2006 Total 3.27 14843 3.40 14666 3.33 29509
2006/2007 4.29 19467 4.41 19062 4.35 38529
2007/2008 5.28 23938 5.59 24101 5.43 48039
2008/2009 6.21 28090 6.47 27829 6.34 55919
2009/2010 6.34 28220 6.62 27885 6.48 56105
Source: INS
Table 7: Percentage of lower secondary school age children out of school, by age and gender
Year Age Male Female Total
% Number % Number % Number
2005/2006 11 2.57 3122 3.69 4262 3.12 7384
12 ... ... ... ... ... ...
13 7.31 9606 6.63 8326 6.98 17932
14 5.78 7586 3.54 4413 4.69 11999
2006/2007 11 2.09 2382 2.73 2959 2.40 5341
12 1.25 1517 3.62 4184 2.41 5701
13 5.66 6871 5.69 6616 5.67 13487
14 9.97 13098 8.16 10240 9.09 23338
2007/2008 11 4.29 4923 4.54 4944 4.41 9867
12 0.33 372 2.17 2357 1.23 2729
13 8.21 9950 8.08 9339 8.15 19289
14 8.56 10390 8.13 9446 8.35 19836
2008/2009 11 2.11 2325 3.77 3960 2.92 6285
12 1.90 2181 3.18 3466 2.53 5647
13 7.23 8238 6.59 7141 6.92 15379
14 10.47 12687 9.01 10405 9.75 23092
2009/2010 11 5.66 6493 5.16 5609 5.42 12102
12 ... ... ... ... ... ....
13 7.27 8330 6.99 7603 7.13 15933
14 8.38 9540 7.75 8394 8.07 17934
2005/2006 Total 3.82 19330 3.85 18554 3.84 37884
2006/2007 4.89 23868 5.15 23999 5.02 47867
2007/2008 5.44 25635 5.81 26086 5.62 51721
2008/2009 5.53 25431 5.70 24972 5.61 50403

90
2009/2010 5.27 23882 5.64 24306 5.45 48188
Source: INS
Observation: 2005/2006 and 2009/2010 school year data for the male and total in the case of 12 years old
children could not be calculated since the data collected from schools refers to children”12 years old and
over” (as a consequence, the percentage of children of this age in school is higher than 100%)
Table 8: Percentage of new entrants to primary education with no ECCE experience
Year Residence Male Female Total
2005/2006 Urban 12.8 11.2 12.0
Rural 14.6 12.9 13.7
Total 13.7 12.1 12.9
2006/2007 Urban 11.6 9.1 9.7
Rural 9.7 8.8 9.3
Total 10.0 9.4 10.6
2007/2008 Urban 9.9 8.8 9.4
Rural 8.4 8.0 8.2
Total 9.1 8.4 8.8
2008/2009 Urban 10.7 9.0 9.9
Rural 9.3 8.1 8.7
Total 10.0 8.5 9.3
2009/2010 Urban 10.8 9.0 9.9
Rural 8.5 7.3 7.9
Total 9.6 8.1 8.9
Source: INS
Table 9: Repetition rate at the primary and lower secondary level of education by grade and area of residence
Year Residence Grade
1 2 3 4 5 6 7 8
2005/2006 Urban 2.3 1.5 0.8 1 2.8 2.3 2.8 1.9
Rural 5.5 3 1.4 1.9 3.8 2.6 2.7 2.2
Total 4.0 2.3 1.2 1.5 3.3 2.5 2.7 2.0
2006/2007 Urban 0.7 1.1 1.1 0.8 2.9 2.2 2.4 1.8
Rural 1.1 2.1 1.8 1.5 3.8 2.3 2.4 1.9
Total 0.9 1.6 1.5 1.2 3.3 2.2 2.4 1.8
2007/2008 Urban 0.5 1.7 1.1 1.3 2.6 2.4 2.8 1.8
Rural 0.9 3.5 2.0 2.5 3.3 2.7 3.1 2.1
Total 0.7 2.6 1.5 1.9 3.0 2.5 2.9 2.0
2008/2009 Urban 0.4 1.7 1.1 1.1 3.5 1.9 2.7 1.6
Rural 1.0 3.4 2.2 2.2 4.8 2.3 2.9 1.9
Total 0.7 2.6 1.7 1.7 4.1 2.1 2.8 1.8
2009/2010 Urban 0.5 1.7 1.2 1.1 3.1 2.4 2.2 1.5
Rural 1.2 3.7 2.3 2.4 4.6 3.2 2.6 2.0
Total 0.9 2.7 1.8 1.8 3.8 2.8 2.4 1.7
Source: INS
Table 10: Dropout rate at the primary and lower secondary level of education, by grade and area of residence Year Residence Grade
1 2 3 4 5 6 7 8
2005/2006 Urban 2.4 1.5 1.2 1.4 2.7 2.0 1.8 1.5
Rural 2.1 1.3 1.1 1.2 2.5 1.8 2.3 2.1
Total 2.2 1.4 1.2 1.3 2.6 1.9 2.0 1.8
2006/2007 Urban 2.6 2.0 1.9 1.7 2.9 2.2 2.1 1.9
Rural 1.7 1.4 1.3 1.2 2.7 2.0 2.4 2.1
Total 2.1 1.7 1.6 1.5 2.8 2.1 2.2 2
2007/2008 Urban 2.0 1.5 1.4 1.2 2.4 1.7 1.9 1.5
Rural 2.3 1.8 1.8 1.9 2.9 2.3 2.8 2.4
Total 2.2 1.6 1.6 1.6 2.6 2.0 2.3 1.9

91
2008/2009 Urban 2.2 1.1 1.0 1.1 2.6 1.4 1.5 1.1
Rural 2.1 1.4 1.2 1.4 3.0 1.8 2.2 1.9
Total 2.1 1.3 1.1 1.3 2.8 1.6 1.8 1.5
2009/2010 Urban 2.4 1.2 1.1 1.2 2.5 1.5 1.2 1.1
Rural 2.3 1.3 1.1 1.1 2.4 1.6 1.7 1.6
Total 2.3 1.2 1.1 1.2 2.5 1.5 1.4 1.3

92
Table 11: Survival rate to the last grade of primary education and to the last grade of lower secondary education
2005/2006 2006/2007 2007/2008 2008/2009 2009/2010
M F T GPI M F T GPI M F T GPI M F T GPI M F T GPI
Survival rate
to the last
grade of
primary
education
93.3 94.9 94.1 1.02 91.6 93.5 92.5 1.02 92.3 93.0 92.7 1.00 92.5 93.6 93.0 1.01 92.5 93.6 93.0 1.01
Survival rate
to the last
grade of
lower
secondary
education
87.6 90.8 89.2 1.04 87.0 90.7 88.8 1.04 85.9 89.6 87.7 1.04 85.9 89.5 87.6 1.04 87.4 90.1 88.7 1.03
Source: INS

93
Table 12: Dropout rate from primary education, by gender and residence Source: INS
Year Residence Male Female Total 2005/2006 Urban 1.8 1.4 1.6
Rural 1.5 1.3 1.4 Total 1.7 1.3 1.5
2006/2007 Urban 2.3 1.8 2.1 Rural 1.5 1.2 1.4 Total 1.9 1.5 1.7
2007/2008 Urban 1.8 1.3 1.5 Rural 2.1 1.8 2.0 Total 2.0 1.5 1.8
2008/2009 Urban 1.5 1.1 1.3 Rural 1.6 1.4 1.5 Total 1.6 1.3 1.4
2009/2010 Urban 1.6 1.3 1.5 Rural 1.6 1.3 1.4 Total 1.6 1.3 1.4
Table 13: Dropout rate from lower secondary education, by gender and residence Source: INS
An Residence Male Female Total 2005/2006 Urban 2.3 1.6 2.0
Rural 2.3 2.0 2.2 Total 2.3 1.8 2.1
2006/2007 Urban 2.6 1.9 2.3 Rural 2.5 2.2 2.3 Total 2.5 2.1 2.3
2007/2008 Urban 2.2 1.5 1.9 Rural 2.8 2.4 2.6 Total 2.5 2.0 2.2
2008/2009 Urban 1.8 1.4 1.6 Rural 2.3 2.1 2.2 Total 2.0 1.8 1.9
2009/2010 Urban 1.8 1.3 1.6 Rural 1.8 1.8 1.8 Total 1.8 1.5 1.7
Table 14: Transition rate from primary to lower secondary education Source: INS
Year Male Female Total GPI
from primary to lower secondary education
2005/2006 97,9 97,9 97,9 1,0
2006/2007 98,1 97,7 97,9 1,0
2007/2008 97,1 96,9 97,0 1,0
2008/2009 98,5 97,8 98,2 0.99
2009/2010 98,3 97,6 97,9 0.99
from lower secondary to upper secondary education
2005/2006 89,9 91,7 90,8 1.02
2006/2007 89,5 91,3 90,4 1.02
2007/2008 92,0 93,2 92,6 1.01
2008/2009 93,2 94,7 93,9 1.02
2009/2010 92,6 93,0 92,8 1.00
Table 15. Children with disabilities out of school, by type of handicap, age group, gender and area of residence Source: ANPC
3-6
years
old
7-10
years
old
11-14
years
old
girls boys urban rural total
Mild handicap 364 23 33 193 227 184 236 420
Medium handicap 1490 364 393 1009 1238 1166 1081 2247
Severe handicap 1211 / 479/ 521 / 926 1285 945 1266 2211
Very severe handicap 3805 2454 2369 3734 4894 3761 4867 8628

94
ANNEX 2. Education system structure for the reference period of the report (2005-2010)
Starting Starting
Grade/
ISCED Educational Level Qualification
Level Age (national)
age (ISCED)
Group
>18-19 >18-19
6 University Education
5
5 4
4 Non-university tertiary education
3 Post high school
18-19 19 XIII
3
Technological high school
3
17-18 18 XII Theoretical high school
Vocational high
school (arts,
sports, theology)
Technological high school 16-17 17 XI Extra year 2
15-16 16
X
2
Theoretical education
Technological education
Vocational Education (School of Arts and Trades)
1
C
O
14-15 15 M IX
13-14 14 P VIII
Lower-secondary Education
Dec-13 13 U VII
11-Dec 12 L VI
10-Nov 11 S V
09-Oct 10 O IV
1 Primary Education
08-Sep 9 R III
07-Aug 8 Y II
06-Jul 7 I
05-Jun
6
Preparatory year
0 Pre-primary Education
Group 3
5
04-May
Group 2
4
03-Apr
3 Group
1

95
ANNEX 3. Overview of data sources
For the out-of-school child data, multiple sources were used, as presented hereinafter.
a. Exhaustive survey in all public and private educational establishments in Romania. The survey is
based on research tools (questionnaires) agreed by the Ministry of Education and Research and the
National Institute of Statistics and it is conducted at the beginning and the end of the school year. The
data are collected from all types of educational establishments and from all levels of education in
October-November each year, relating both the beginning of the current school year and the end of
the previous school year. The survey – conducted yearly – is run by the National Institute of Statistics.
Sample design and data collection coverage: National, macro-regional, regional, county
The smallest administrative area for which out-of-school population statistics are statistically
accurate: Town/commune
Types of potential data disaggregation: The data on school population is collected/disaggregated
by gender, age, teaching language, area of residence (urban/rural), level of education, geographic
area, type of school (public, private), grade. For some indicators, other types of disaggregation may
be used: i.e. by specialisations/qualifications, ethnic origin, Romanian students/foreign students, etc.
The data collected from public and private educational establishments based on the questionnaires
are aggregated by educational stages (pre-primary, primary, lower secondary, upper secondary,
vocational, post-secondary and tertiary) in line with the organisational structure of the national
education system in Romania.
Some results are available on the website of the National Institute of Statistics. Other results are
published yearly by the National Institute of Statistics in statistical reviews such as: Primary and Lower
Secondary Education (beginning and end of school year), Upper Secondary Education, Special
Education or in syntheses such as The Education System of Romania, Yearly Romanian Statistical
Book, etc.
At request, the National Institute of Statistics database (TEMPO) can also be accessed.
All questionnaires are available in word and excel formats at the following address:
http://www.insse.ro/cms/rw/pages/chest_invatamant.ro.do;jsessionid=0a02458c30d5b04e2de915d2
45cdac869a0b34388175.e38QbxeSahyTbi0Lbxz0
The definition of an out-of-school child used in the survey is the following: a child who is enrolled but
stops attending the classes during a specific school year.
Definitions of other educational terms:
School entrance age: School entrance age in the reference period of the report varies from one
level of education to another. School entrance age for pre-primary education is 3 years, for
primary education is 6/7 years, for lower secondary education is 11 years and for upper
secondary education is 15 years.
Enrolment: all children, pupils and students (included in the educational and training process)
during a school/university year regardless of the type of education attended (day, evening, part-
time education and distance learning) and of age.
Attendance: the total number of pupils/students of a certain age group, regardless of the level of
education in which they are included, expressed as a share in the total population of the same
age group.
Drop-out: Drop-out rate is an indicator defined as the difference between the number of students
school population enrolled at the beginning of the school year and the number of students
enrolled at the end of the year, divided by the number of students enrolled at the beginning of the
school year, multiplied by 100.

96
Educational attainment: The highest educational level attended by a person (primary,
secondary, tertiary)
Other relevant terms: the total number of pupils/students of a certain age group, regardless of
the level of education in which they are included, expressed as a share in the total population of
the same age group.
b.The second important source for the report, in relation with the data on the economic background of
the students of the five dimensions analysed, is the Household Budget Survey (HBS). The data are
collected each month on a sub-sample of 3,120 households.The sampling unit is the household.
Sampling (the smallest administrative area for which out-of-school population data are statistically
accurate) or regional coverage of schools (NUTS-II level).
The National Institute of Statistics is in charge of the data collection process (data collection
management). The periodicity of data is Quarterly and Annually.
The data may be disaggregated by gender, age, area, wealth quintile.
The definition of out-of-school children used in this survey is the following: school-age population with
other occupational status than that of students.
The collected, processed and aggregated statistical data are published and disseminated on a
quarterly and yearly basis. This information may be accessed by any interested institution. The
general public may consult these publications.
Limitations arising from the specificity of the questionnaire:
The students who never attended pre-primary education could not be accurately identified; this
situation is due to the fact that in the case of the information regarding the family members’
current status the answer options in the questionnaire do not include the status enrolled in
kindergarten.
For family members who are over 15 years of age, the school enrolment situation cannot be
accurately detected as the data collection tool focuses on their situation on the labour market
(employed/unemployed) and not on their school situation (enrolled/not enrolled in education).
c. Additional sources of data were used for filling in the information not covered by the sources quoted
above. In particular relevant data on specific categories of children and on specific issues for the
report were consulted such as: situation of children with disabilities, Roma children participation to
education, PISA international assessments results, ad-hoc survey on drop-out registration etc.). Also
relevant official reports of Ministry of Education, Youth and Sport and National Authority for Child
Protection were consulted. All these sources are indicated in the analysis, while a complete list of the
additional sources is indicated in the bibliographical section of the report.

97
For more information: Visit our Website: www.unicef.org Or contact: Luminita Costache, Social Policy Specialist UNICEF Romania Office, 48A, Blvd. Primaverii 011975 Bucharest 1 Romania Phone: +40 21 201 7862 E-mail: [email protected]
Institutul
de Ştiinţe ale Educaţiei