global m&a review h1 2019 - bureau van dijk · h2 2016 52,793 2,719,619 h1 2016 60,473...
TRANSCRIPT

Global M&A Review H1 2019
Zephyr Quarterly M&A ReportGlobal, Q3 2015

You are free to use any data or commentary from this report in your articles as long as the source is cited as “Zephyr published by Bureau van Dijk”
bvdinfo.com +44 161 838 9554 [email protected]
Global M&A Review H1 2019Global
Page 1 © Bureau van Dijk
The following report details mergers and acquisitions activity in H1 2019 using data from the Zephyr database.
It focuses on deal activity by target company.
Click here to access the raw data in an Excel spreadsheet.
Section 1: Global Deals Page 1
Section 2: Western Europe Page 19
Section 3: North America Page 30
Section 4: Asia/Asia Pacific Page 40
Section 5: MENA Page 51
Section 6: Russia/CEE Page 64
Global M&A volume and value down in H1
The volume and value of global mergers and acquisitions (M&A) declined in the first half of 2019. In all, there were 51,449 deals worth a combined USD 2,569,594 million announced worldwide over the course of the six months. In terms of volume, this represents a 17 per cent decline on the 62,057 deals announced in H2 2018, although the decline was less steep in a year-on-year comparison (H1 2018: 54,811).
In terms of value, the result represents the second consecutive six-monthly decline (H1 2018: USD 3,055,041 million; H2 2018: USD 2,605,292 million).
The disappointing result comes despite a number of sizeable deals being announced over the six months; all of the top 20 were worth over USD 10,000 million and the largest of all broke the USD 70,000 million-barrier.
Global deals by volume and value
Announced date No of deals Total deal value (mil USD)
H1 2019 51,449 2,569,594
H2 2018 62,057 2,605,292
H1 2018 54,811 3,055,041
H2 2017 54,189 2,459,217
H1 2017 52,837 2,355,032
H2 2016 52,793 2,719,619
H1 2016 60,473 2,228,905
H2 2015 64,083 3,159,305
H1 2015 54,291 2,872,480
You are free to use any data or commentary from this report in your articles as long as the source is cited as “Zephyr published by Bureau van Dijk”
The most comprehensive deal database
The world’s most powerful comparable data resource on private companies
Combining deal and company dataWelcome to the business of certainty.
We capture and treat private company and M&A information for better decision making and increased efficiency.
Bureau van Dijk is a Moody’s Analytics company

You are free to use any data or commentary from this report in your articles as long as the source is cited as “Zephyr published by Bureau van Dijk”
bvdinfo.com +44 161 838 9554 [email protected]
Global M&A Review H1 2019Global
Page 2 © Bureau van Dijk
Global deals by volume and value
0
10,000
20,000
30,000
40,000
50,000
60,000
70,000
0
500,000
1,000,000
1,500,000
2,000,000
2,500,000
3,000,000
3,500,000
H1 2015 H2 2015 H1 2016 H2 2016 H1 2017 H2 2017 H1 2018 H2 2018 H1 2019
Dea
l val
ue (m
il U
SD
)
Total deal value (mil USD) Number of deals

You are free to use any data or commentary from this report in your articles as long as the source is cited as “Zephyr published by Bureau van Dijk”
bvdinfo.com +44 161 838 9554 [email protected]
Global M&A Review H1 2019Global
Page 3 © Bureau van Dijk
US company targeted in H1 2019’s largest deal
The most valuable deal to have been announced during the first half of 2019 was worth USD 74,000 million and involved Bristol-Myers Squibb picking up biopharmaceuticals maker Celgene. This was followed by a Saudi Arabian deal as Saudi Arabian Oil agreed to acquire a 70 per cent stake in Saudi Basic Industries for USD 69,100 million.
One other deal was worth over EUR 60,000 million in the period under review as AbbVie, via its Venice Subsidiary unit, signed on the dotted line to purchase Irish pharmaceuticals player Allergan for USD 63,533 million.
In terms of the top countries by volume in H1 2019, the US led the way with 15,501 deals, followed by China with 6,907 and the UK with 3,344. The same three countries topped the rankings by value, with USD 1,609,325 million, USD 288,114 million and USD 128,350 million, respectively.
PE value up in H1 2019, despite volume declining
The aggregate value of private equity and venture capital (PE and VC) dealmaking announced worldwide increased in the first half of 2019 when compared to H2 2018, although volume declined over the same timeframe. In all, there were 12,385 deals worth a combined USD 443,115 million announced over the six months, compared to the USD 405,924 million invested across 12,691 deals in H2 2018.
However, the result was less impressive in a year-on-year comparison as both volume and value declined when compared to the 13,640 deals worth USD 472,780 million announced in the opening six months of 2018. This comes despite H1 2019’s value being boosted by five PE and VC deals worth over USD 10,000 million.
US deal tops PE and VC rankings
The most valuable PE and VC deal to have been announced worldwide in the first half of 2018 was worth USD 18,700 million and involved Blackstone acquiring the US urban, infill logistics assets of GLP. This was followed by Dreamvision Overseas picking up India-headquartered conceptual unmanned hypersonic research aircraft developer Tzar Aerospace Research Labs for USD 15,000 million.
Five of the PE and VC deals announced over the six months were worth over USD 10,000 million and others targeted in these deals included Zayo Group Holdings, Ultimate Software Group and Buckeye Partners. These five deals together accounted for 16 per cent of total PE and VC value during the period under review.
North American targets featured in many of the period’s top 20 deals, but companies based in the likes of Brazil, Germany, Spain and Australia were also targeted.

You are free to use any data or commentary from this report in your articles as long as the source is cited as “Zephyr published by Bureau van Dijk”
bvdinfo.com +44 161 838 9554 [email protected]
Global M&A Review H1 2019Global
Page 4 © Bureau van Dijk
Top 20 global deals by value
Deal value (mil USD) Deal type Target Target
country Acquiror Acquiror country
Announced date
1. 74,000 Acquisition 100% Celgene Corporation US Bristol-Myers Squibb Company US 03/01/2019
2. 69,100 Acquisition 70% Saudi Basic Industries Corporation SJSC SA Saudi Arabian Oil Company SA 27/03/2019
3. 63,533 Acquisition 100% Allergan plc IE AbbVie Inc., via acquisition vehicle, Venice Subsidiary LLC US 25/06/2019
4. 57,000 Acquisition 100% Anadarko Petroleum Corporation US Occidental Petroleum Corporation US 09/05/2019
5. 54,031 Acquisition 100% Raytheon Company US United Technologies Corporation US 09/06/2019
6. 43,000 Acquisition 100% Worldpay Inc. US Fidelity National Information Services Inc. US 18/03/2019
7. 39,000 Acquisition 100% First Data Corporation US Fiserv Inc. US 16/01/2019
8. 28,085 Acquisition 100% SunTrust Banks Inc. US BB&T Corporation US 07/02/2019
9. 21,500 Acquisition 100% Total System Services Inc. US Global Payments Inc. US 28/05/2019
10. 21,400 Acquisition 100% General Electric Company's BioPharma business US Danaher Corporation US 25/02/2019
11. 18,700 IBO 100% GLP Pte Ltd's US urban, infill logistics assets US The Blackstone Group LP US 02/06/2019
12. 17,300 Acquisition 100% WellCare Health Plans Inc. US Centene Corporation, via acquisition vehicle Wellington Merger Sub II Inc. US 27/03/2019
13. 17,300 Acquisition 100% Caesars Entertainment Corporation US Eldorado Resorts Inc. US 24/06/2019
14. 15,700 Acquisition 100% Tableau Software Inc. US Salesforce.com Inc. US 10/06/2019
15. 15,000 Minority stake 37% Tzar Aerospace Research Labs Pvt Ltd IN Dreamvision Overseas Pte Ltd SG 14/05/2019
16. 14,300 IBO 100% Zayo Group Holdings Inc. US Front Range TopCo Inc. US 08/05/2019
17. 14,000 Acquisition 100% Andeavor Logistics LP US MPLX LP US 08/05/2019
18. 11,400 Acquisition 100% Array BioPharma Inc. US Pfizer Inc. US 17/06/2019
19. 11,091 Minority stake 3% Alibaba Group Holding Ltd KY 03/06/2019
20. 11,000 IBO 100% Ultimate Software Group Inc. US Unite Parent Corporation US 04/02/2019

You are free to use any data or commentary from this report in your articles as long as the source is cited as “Zephyr published by Bureau van Dijk”
bvdinfo.com +44 161 838 9554 [email protected]
Global M&A Review H1 2019Global
Page 5 © Bureau van Dijk
Target country by volume - global deals
Target country H1 2018 H2 2018 H1 2019
US 10,641 17,518 15,501
China 8,688 8,995 6,907
UK 3,256 3,328 3,344
Japan 2,076 2,092 2,124
France 2,066 2,064 1,981
Germany 3,193 3,336 1,928
Australia 2,055 2,393 1,826
India 1,212 1,223 1,330
Canada 1,748 1,579 1,236
South Korea 1,388 1,423 1,221
Sweden 1,376 1,250 1,160
Spain 1,348 1,530 1,059
Netherlands 1,291 1,286 1,043
Vietnam 673 922 873
Russia 953 905 796
Poland 1,578 1,020 775
Italy 847 951 744
Singapore 519 594 528
Taiwan 393 509 513
Cayman Islands 515 608 465
Target country by value - global deals
Target country H1 2018 (mil USD)
H2 2018 (mil USD)
H1 2019 (mil USD)
US 1,009,939 861,615 1,069,325
China 410,416 397,877 288,114
UK 222,741 177,739 128,350
France 73,296 66,147 80,253
Ireland 4,635 25,736 77,915
Germany 219,943 103,130 75,899
India 66,003 54,041 75,855
Saudi Arabia 2,719 8,312 70,875
Canada 83,078 55,973 49,975
Cayman Islands 69,070 39,671 45,633
Netherlands 93,795 42,381 45,520
Russia 27,821 58,424 43,732
South Korea 48,154 51,201 41,962
Japan 43,119 58,336 41,531
Australia 52,523 78,889 38,533
Spain 100,828 66,250 33,132
Switzerland 31,634 30,886 30,877
Brazil 18,867 26,288 27,802
Sweden 29,435 24,111 24,887
Singapore 32,708 16,975 23,874

You are free to use any data or commentary from this report in your articles as long as the source is cited as “Zephyr published by Bureau van Dijk”
bvdinfo.com +44 161 838 9554 [email protected]
Global M&A Review H1 2019Global
Page 6 © Bureau van Dijk
Top five global target countries by deal volume in H1 2019 Top five global target countries by deal value in H1 2019
30%
13%
6%4%4%
42%
US
China
UK
Japan
France
All other countries
41%
11%5%3%
3%
36%
US
China
United Kingdom
UK
Ireland
All other countries

You are free to use any data or commentary from this report in your articles as long as the source is cited as “Zephyr published by Bureau van Dijk”
bvdinfo.com +44 161 838 9554 [email protected]
Global M&A Review H1 2019Global
Page 7 © Bureau van Dijk
Top five global target countries by deal volume in H1 2019 Deal volume between H1 2015 and H1 2019
Top five global target countries by deal value in H1 2019 Deal value between H1 2015 and H1 2019
0
200,000
400,000
600,000
800,000
1,000,000
1,200,000
H1 2015 H2 2015 H1 2016 H2 2016 H1 2017 H2 2017 H1 2018 H2 2018 H1 2019D
ea
l v
alu
e (
mil
US
D)
US China UK France Ireland
0
5,000
10,000
15,000
20,000
25,000
H1 2015 H2 2015 H1 2016 H2 2016 H1 2017 H2 2017 H1 2018 H2 2018 H1 2019
Nu
mb
er o
f d
ea
ls
US China UK Japan France

You are free to use any data or commentary from this report in your articles as long as the source is cited as “Zephyr published by Bureau van Dijk”
bvdinfo.com +44 161 838 9554 [email protected]
Global M&A Review H1 2019Global
Page 8 © Bureau van Dijk
Target sector by volume - global deals
Target sector H1 2018 H2 2018 H1 2019
Other services 20,585 22,234 19,207
Machinery, equipment, furniture, recycling 6,202 8,007 6,180
Wholesale & retail trade 3,432 4,091 3,295
Chemicals, rubber, plastics 2,816 3,968 2,866
Publishing, printing 2,724 2,624 2,255
Metals & metal products 2,487 2,434 1,945
Construction 2,229 2,121 1,684
Primary sector 1,402 1,763 1,220
Gas, water, electricity 1,054 1,390 1,138
Banks 956 1,317 1,087
Food, beverages, tobacco 1,151 1,409 1,075
Transport 915 1,215 960
Insurance companies 707 1,151 844
Education, health 1,056 966 842
Post and telecommunications 577 801 712
Hotels & restaurants 687 899 701
Textiles, wearing apparel, leather 513 643 497
Wood, cork, paper 380 473 315
Public administration and defence 39 36 38
Target sector by value - global deals
Target sector H1 2018 (mil USD)
H2 2018 (mil USD)
H1 2019 (mil USD)
Other services 976,467 834,224 893,657
Chemicals, rubber, plastics 316,019 211,833 366,408
Machinery, equipment, furniture, recycling 338,291 351,618 244,298
Primary sector 95,613 169,040 139,357
Banks 160,003 157,825 121,063
Wholesale & retail trade 101,284 92,001 120,984
Construction 105,620 97,571 85,481
Metals & metal products 55,496 79,329 80,876
Publishing, printing 75,497 113,624 77,694
Transport 105,742 99,855 76,502
Gas, water, electricity 166,721 90,827 72,957
Post and telecommunications 159,934 43,656 69,395
Hotels & restaurants 40,756 38,071 44,733
Food, beverages, tobacco 97,707 51,327 42,132
Insurance companies 154,658 72,956 39,573
Education, health 50,837 34,094 37,771
Textiles, wearing apparel, leather 17,145 13,471 9,502
Wood, cork, paper 28,637 15,258 8,986
Public administration and defence 2,108 781 403

You are free to use any data or commentary from this report in your articles as long as the source is cited as “Zephyr published by Bureau van Dijk”
bvdinfo.com +44 161 838 9554 [email protected]
Global M&A Review H1 2019Global
Page 9 © Bureau van Dijk
Global private equity deals by volume and value
Announced date No of deals Total deal value (mil USD)
H1 2019 12,385 443,115
H2 2018 12,691 405,924
H1 2018 13,640 472,780
H2 2017 12,418 426,235
H1 2017 12,775 382,406
H2 2016 12,573 320,217
H1 2016 12,465 280,640
H2 2015 13,851 430,412
H1 2015 13,373 334,149

You are free to use any data or commentary from this report in your articles as long as the source is cited as “Zephyr published by Bureau van Dijk”
bvdinfo.com +44 161 838 9554 [email protected]
Global M&A Review H1 2019Global
Page 10 © Bureau van Dijk
Global private equity deals by volume and value
11,500
12,000
12,500
13,000
13,500
14,000
0
50,000
100,000
150,000
200,000
250,000
300,000
350,000
400,000
450,000
500,000
H1 2015 H2 2015 H1 2016 H2 2016 H1 2017 H2 2017 H1 2018 H2 2018 H1 2019
Dea
l val
ue (m
il U
SD
)
Total deal value (mil USD) Number of deals

You are free to use any data or commentary from this report in your articles as long as the source is cited as “Zephyr published by Bureau van Dijk”
bvdinfo.com +44 161 838 9554 [email protected]
Global M&A Review H1 2019Global
Page 11 © Bureau van Dijk
Top 20 global private equity deals by value
Deal value (mil USD) Deal type Target Target
country Fund Manager/General Partner Announced date
1. 18,700 IBO 100% GLP Pte Ltd's US urban, infill logistics assets US The Blackstone Group LP 02/06/2019
2. 15,000 Minority stake 37% Tzar Aerospace Research Labs Pvt Ltd IN Dreamvision Overseas Pte Ltd 14/05/2019
3. 14,300 IBO 100% Zayo Group Holdings Inc. US Devonshire Investors LLC; EQT AB; Digital Colony Management LLC 08/05/2019
4. 11,000 IBO 100% Ultimate Software Group Inc. US Hellman & Friedman LLC; The Blackstone Group LP; JMI Management Inc.; Canada Pension Plan Investment Board
04/02/2019
5. 10,300 IBO 100% Buckeye Partners LP US IFM Investors Pty Ltd 10/05/2019
6. 8,662 Acquisition 90% Transportadora Associada de Gas SA BR La Caisse de depot et placement du Quebec 05/04/2019
7. 7,704 IBO 100% Axel Springer SE DE KKR & Co Inc. 12/06/2019
8. 5,268 Acquisition 30% to 100% Merlin Entertainments plc GB The Blackstone Group Inc.; Canada Pension Plan Investment Board; KIRKBI A/S 28/06/2019
9. 4,796 Minority stake 40% Compania Espanola de Petroleos SA ES Carlyle Group LP 08/04/2019
10. 4,300 IBO 100% El Paso Electric Company Inc. US JP Morgan Investment Management Inc. 01/06/2019
11. 3,723 IBO 100% WestJet Airlines Ltd CA Onex Corporation 13/05/2019
12. 3,700 IBO 100% Ellie Mae Inc. US Thoma Bravo LLC 12/02/2019
13. 3,600 IBO 100% Oryx Southern Delaware Holdings LLC's assets; Oryx Delaware Holdings LLC's assets
US; US Stonepeak Partners LP 02/04/2019
14. 3,413 IBO 100% Evonik Industries AG's methacrylates business DE Advent International Corporation 04/03/2019
15. 3,400 IBO 100% Inmarsat plc GB Warburg Pincus LLC; Ontario Teachers' Pension Plan Board; Canada Pension Plan Investment Board; Apax Partners LLP
25/03/2019
16. 3,273 IBO 44% and 100% Tallgrass Energy LP; Tallgrass Energy GP LLC US; US The Blackstone Group LP 31/01/2019
17. 3,050 IBO 100% Healthscope Ltd AU Brookfield Capital Partners Ltd 01/02/2019
18. 3,000 IBO majority stake Cox Enterprises Inc.'s 14 regional television stations US Apollo Global Management LLC 15/02/2019
19. 2,927 Acquisition 100% STOXX AG; Axioma Inc.; Deutsche Borse AG’s index business DAX CH; US General Atlantic LLC 09/04/2019
20. 2,800 IBO 100% Gategroup Holding AG CH RRJ Management Ltd 29/03/2019

You are free to use any data or commentary from this report in your articles as long as the source is cited as “Zephyr published by Bureau van Dijk”
bvdinfo.com +44 161 838 9554 [email protected]
Global M&A Review H1 2019Global
Page 12 © Bureau van Dijk
Target country by volume - global private equity deals
Target country H1 2018 H2 2018 H1 2019
US 7,685 7,066 7,472
China 1,762 1,460 1,084
UK 564 525 574
Japan 357 394 413
Canada 361 390 303
France 451 306 292
India 292 301 267
South Korea 127 246 252
Germany 257 278 161
Spain 169 150 131
Israel 130 128 122
Italy 113 117 121
Singapore 93 108 107
Australia 88 125 102
Netherlands 90 100 98
Sweden 111 92 82
Hungary 69 52 47
Belgium 41 55 40
Indonesia 14 29 38
Ireland 31 33 37
Target country by value - global private equity deals
Target country H1 2018 (mil USD)
H2 2018 (mil USD)
H1 2019 (mil USD)
US 179,502 158,139 211,824
China 70,973 47,986 32,731
UK 21,246 22,920 29,523
India 4,816 12,638 24,263
Germany 14,252 11,290 18,412
Spain 12,410 17,388 14,875
France 17,085 11,700 13,058
South Korea 7,481 9,463 10,371
Canada 34,661 6,358 10,231
Brazil 666 5,220 10,132
Netherlands 22,594 5,770 9,642
Australia 8,191 14,924 8,838
Switzerland 473 3,323 7,171
Sweden 2,632 5,213 6,652
Japan 1,613 1,421 6,190
Norway 2,488 956 5,544
Italy 10,939 10,534 5,247
Israel 1,475 2,776 3,363
New Zealand 43 2,446 3,352
Bermuda 501 8,535 2,427

You are free to use any data or commentary from this report in your articles as long as the source is cited as “Zephyr published by Bureau van Dijk”
bvdinfo.com +44 161 838 9554 [email protected]
Global M&A Review H1 2019Global
Page 13 © Bureau van Dijk
Target sectors by volume - global private equity deals
Target sector H1 2018 H2 2018 H1 2019
Other services 6,402 5,653 5,490
Publishing, printing 1,005 871 766
Machinery, equipment, furniture, recycling 907 809 741
Chemicals, rubber, plastics 271 290 267
Wholesale & retail trade 277 306 258
Education, health 267 214 194
Food, beverages, tobacco 144 143 151
Gas, water, electricity 140 139 130
Hotels & restaurants 108 79 81
Metals & metal products 128 98 72
Transport 63 74 63
Primary sector 93 84 58
Construction 100 76 57
Post and telecommunications 56 60 54
Insurance companies 64 56 49
Textiles, wearing apparel, leather 58 54 47
Banks 54 47 40
Wood, cork, paper 28 22 18
Public administration and defence 10 11 12
Target sectors by value - global private equity deals
Target sector H1 2018 (mil USD)
H2 2018 (mil USD)
H1 2019 (mil USD)
Other services 199,276 177,437 196,367
Transport 16,145 19,044 32,068
Machinery, equipment, furniture, recycling 48,723 41,997 27,836
Post and telecommunications 19,510 5,204 24,595
Publishing, printing 20,117 31,006 24,266
Chemicals, rubber, plastics 30,278 22,355 21,191
Wholesale & retail trade 13,231 8,986 20,696
Gas, water, electricity 15,524 19,974 14,591
Construction 7,237 7,056 12,063
Hotels & restaurants 12,444 3,482 10,821
Education, health 24,376 6,506 9,268
Food, beverages, tobacco 9,653 2,815 7,128
Primary sector 15,511 7,536 5,529
Insurance companies 5,353 9,822 3,626
Wood, cork, paper 3,123 963 2,942
Metals & metal products 3,656 3,285 2,596
Banks 3,532 12,292 1,503
Textiles, wearing apparel, leather 1,248 1,012 539
Public administration and defence 232 172 93

You are free to use any data or commentary from this report in your articles as long as the source is cited as “Zephyr published by Bureau van Dijk”
bvdinfo.com +44 161 838 9554 [email protected]
Global M&A Review H1 2019Global League Tables
Page 14 © Bureau van Dijk
Top 20 financial advisors global deals by value
Financial advisor Number of deals Number with consideration Total deal value (mil USD) Average deal value (mil USD)
1. JP Morgan 142 124 560,646 4,521
2. Goldman Sachs Group Inc. 87 70 464,631 6,638
3. Morgan Stanley 94 81 385,883 4,764
4. Citigroup Inc. 83 76 358,903 4,722
5. Bank of America Corporation 56 44 282,681 6,425
6. Evercore Inc. 42 29 202,833 6,994
7. Credit Suisse 58 50 138,305 2,766
8. Barclays plc 81 53 115,599 2,181
9. RBC Capital Markets Corporation 35 23 102,513 4,457
10. HSBC Holdings plc 30 26 99,384 3,822
11. Centerview Partners LLC 16 15 75,614 5,041
12. Dyal Company LLC 1 1 74,000 74,000
13. Evercore Partners Ltd 4 4 58,992 14,748
14. Lazard 66 46 58,719 1,276
15. Deutsche Bank AG 39 27 55,214 2,045
16. Rothschild & Co. 88 71 50,381 710
17. UBS 32 23 34,261 1,490
18. Greenhill & Company LLC 18 15 31,370 2,091
19. SunTrust Banks Inc. 5 3 30,237 10,079
20. Jefferies LLC 28 15 29,663 1,978
These advisor rankings have been introduced to the Global report based on the most current data available at the time of writing. If you feel any of the above information is incorrect or you have not been accurately represented please get in touch with our advisors team at [email protected]

You are free to use any data or commentary from this report in your articles as long as the source is cited as “Zephyr published by Bureau van Dijk”
bvdinfo.com +44 161 838 9554 [email protected]
Global M&A Review H1 2019Global League Tables
Page 15 © Bureau van Dijk
Top 20 financial advisors global deals by volume
Financial advisor Number of deals Number with consideration Total deal value (mil USD) Average deal value (mil USD)
1. JP Morgan 142 124 560,648 4,521
2. PricewaterhouseCoopers - Corporate Finance 100 63 18,058 287
3. KPMG Corporate Finance 100 34 10,223 301
4. Morgan Stanley 94 81 385,885 4,764
5. Rothschild & Co. 88 71 50,382 710
6. Goldman Sachs Group Inc. 87 70 464,631 6,638
7. Citigroup Inc. 83 76 358,905 4,722
8. Barclays plc 81 53 115,599 2,181
9. Ernst & Young 72 39 22,911 587
10. Lazard 66 46 58,719 1,276
11. Credit Suisse 58 50 138,305 2,766
12. Bank of America Corporation 56 44 282,681 6,425
13. Deloitte 53 27 3,412 126
14. Grant Thornton - Corporate Finance 51 35 1,236 35
15. Finncap Ltd 51 47 781 17
16. Houlihan Lokey 46 22 7,574 344
17. Numis Securities Ltd 46 43 2,980 69
18. Evercore Inc. 42 29 202,833 6,994
19. Deutsche Bank AG 39 27 55,214 2,045
20. Moelis & Company 38 24 19,581 816
These advisor rankings have been introduced to the Global report based on the most current data available at the time of writing. If you feel any of the above information is incorrect or you have not been accurately represented please get in touch with our advisors team at [email protected]

You are free to use any data or commentary from this report in your articles as long as the source is cited as “Zephyr published by Bureau van Dijk”
bvdinfo.com +44 161 838 9554 [email protected]
Global M&A Review H1 2019Global League Tables
Page 16 © Bureau van Dijk
Top 20 legal advisors global deals by value
Legal advisor Number of deals Number with consideration Total deal value (mil USD) Average deal value (mil USD)
1. Wachtell Lipton Rosen & Katz LLP 24 22 353,300 16,059
2. Kirkland & Ellis 192 78 191,771 2,459
3. Latham & Watkins LLP 141 98 165,619 1,690
4. Skadden Arps Slate Meagher & Flom 77 60 138,751 2,313
5. Jones Day 111 63 128,020 2,032
6. Simpson Thacher & Bartlett LLP 56 41 123,170 3,004
7. Clifford Chance LLP 42 29 115,445 3,981
8. Weil Gotshal & Manges LLP 71 42 108,424 2,582
9. Cravath Swaine & Moore LLP 17 14 106,859 7,633
10. Slaughter and May 21 19 103,075 5,425
11 Sullivan & Cromwell 33 25 91,074 3,643
12. Shearman & Sterling LLP 30 16 72,117 4,507
13. Arthur Cox 2 2 63,696 31,848
14. Willkie Farr & Gallagher LLP 39 24 56,567 2,357
15. Paul Weiss Rifkind Wharton & Garrison LLP 43 25 53,305 2,132
16. Allen & Overy 61 43 32,552 757
17. Sidley Austin LLP 19 15 28,974 1,932
18. Rigrodsky & Long PA 1 1 28,085 28,085
19. Freshfields Bruckhaus Deringer 28 18 25,051 1,392
20. King & Spalding 6 4 23,993 5,998
These advisor rankings have been introduced to the Global report based on the most current data available at the time of writing. If you feel any of the above information is incorrect or you have not been accurately represented please get in touch with our advisors team at [email protected]

You are free to use any data or commentary from this report in your articles as long as the source is cited as “Zephyr published by Bureau van Dijk”
bvdinfo.com +44 161 838 9554 [email protected]
Global M&A Review H1 2019Global League Tables
Page 17 © Bureau van Dijk
Top 20 legal advisors global deals by volume
Legal advisor Number of deals Number with consideration Total deal value (mil USD) Average deal value (mil USD)
1. Kirkland & Ellis 192 78 191,772 2,459
2. Latham & Watkins LLP 141 98 165,619 1,690
3. Jones Day 111 63 128,020 2,032
4. DLA Piper 89 57 13,082 230
5. Skadden Arps Slate Meagher & Flom 77 60 138,753 2,313
6. Weil Gotshal & Manges LLP 71 42 108,424 2,582
7. Allen & Overy 61 43 32,553 757
8. Simpson Thacher & Bartlett LLP 56 41 123,170 3,004
9. Hogan Lovells 51 35 20,661 590
10. ALLBright Law Offices 51 49 6,085 124
11 Dentons 50 34 3,181 94
12. Morgan Lewis & Bockius LLP 46 23 6,412 279
13. Gibson Dunn & Crutcher 45 26 21,215 816
14. Grandall Law Firm 44 44 2,561 58
15. Paul Weiss Rifkind Wharton & Garrison LLP 43 25 53,305 2,132
16. Clifford Chance LLP 42 29 115,445 3,981
17. Goodwin Procter 41 31 16,100 519
18. Wilson Sonsini Goodrich & Rosati 40 28 15,247 545
19. Willkie Farr & Gallagher LLP 39 24 56,567 2,357
20. King & Wood Mallesons 38 29 20,836 718
These advisor rankings have been introduced to the Global report based on the most current data available at the time of writing. If you feel any of the above information is incorrect or you have not been accurately represented please get in touch with our advisors team at [email protected]

You are free to use any data or commentary from this report in your articles as long as the source is cited as “Zephyr published by Bureau van Dijk”
bvdinfo.com +44 161 838 9554 [email protected]
Global M&A Review H1 2019Global League Tables
Page 18 © Bureau van Dijk
Top 20 private equity firms global deals
Private equity firm Number of deals Number with consideration Total deal value (mil USD) Average deal value (mil USD)
1. Appaloosa Management LP 1 1 63,533 63,533
2. KKR & Co Inc. 33 22 53,701 2,441
3. The Blackstone Group LP 27 19 41,598 2,189
4. Canada Pension Plan Investment Board 8 8 27,146 3,393
5. Dreamvision Overseas Pte Ltd 1 1 15,000 15,000
6. Digital Colony Management LLC 4 2 14,837 7,419
7. EQT AB 1 1 14,300 14,300
8. Devonshire Investors LLC 1 1 14,300 14,300
9. Apax Partners LLP 9 6 13,656 2,276
10. Carlyle Group LP 33 24 13,100 546
11. La Caisse de depot et placement du Quebec 8 7 12,702 1,815
12. IFM Investors Pty Ltd 2 2 12,000 6,000
13. JMI Management Inc. 9 6 11,757 1,959
14. Hellman & Friedman LLC 3 2 11,680 5,840
15. Apollo Global Management LLC 8 7 11,372 1,625
16. Public Sector Pension Investment Board 6 5 10,469 2,094
17. Onex Corporation 4 3 9,264 3,088
18. EQT Partners AB 25 14 9,068 648
19. Aisling Capital LLC 5 5 8,811 1,762
20. Wellington Management Company LLP 6 6 7,551 1,259
These advisor rankings have been introduced to the Global report based on the most current data available at the time of writing. If you feel any of the above information is incorrect or you have not been accurately represented please get in touch with our advisors team at [email protected]

You are free to use any data or commentary from this report in your articles as long as the source is cited as “Zephyr published by Bureau van Dijk”
bvdinfo.com +44 161 838 9554 [email protected]
Global M&A Review H1 2019Western Europe
Page 19 © Bureau van Dijk
Western European value at lowest level recorded in three years
The volume and value of M&A deals targeting companies based in Western Europe declined in H1 2019 to 12,946 deals worth an aggregate USD 555,677 million, representing the lowest-recorded result by value since H1 2016 (USD 506,282 million) and H2 2014 by volume (11,459).
In terms of value, dealmaking in Western Europe accounted for 22 per cent of total global M&A value in H1 2019 (USD 2,569,594 million), while the result represented a 16 per cent decline from USD 658,568 million in H2 2018 and a 40 per cent decrease from USD 930,935 million in H1 2018.
Volume, which accounts for a quarter of global M&A volume (51,449 deals), ended three consecutive increases over the six months and was down 21 per cent from 16,439 deals in H2 2018 and 20 per cent from 16,134 deals in H1 2018.
The overall decline in Western European M&A is surprising given seven of the top 20 deals by value were worth more than USD 5,000 million and the largest deal topped USD 60,000 million and was the third-largest deal globally in H1 2019.
Western Europe deals by volume and value
Announced date No of deals Total deal value (mil USD)
H1 2019 12,946 555,677
H2 2018 16,439 658,568
H1 2018 16,134 930,935
H2 2017 14,456 614,130
H1 2017 13,902 703,991
H2 2016 15,080 659,097
H1 2016 14,255 506,282
H2 2015 14,346 705,044
H1 2015 13,251 725,123

You are free to use any data or commentary from this report in your articles as long as the source is cited as “Zephyr published by Bureau van Dijk”
bvdinfo.com +44 161 838 9554 [email protected]
Global M&A Review H1 2019Western Europe
Page 20 © Bureau van Dijk
Western Europe deals by volume and value
0
2,000
4,000
6,000
8,000
10,000
12,000
14,000
16,000
18,000
0
100,000
200,000
300,000
400,000
500,000
600,000
700,000
800,000
900,000
1,000,000
H1 2015 H2 2015 H1 2016 H2 2016 H1 2017 H2 2017 H1 2018 H2 2018 H1 2019
Dea
l val
ue (m
il U
SD
)
Total deal value (mil USD) Number of deals

You are free to use any data or commentary from this report in your articles as long as the source is cited as “Zephyr published by Bureau van Dijk”
bvdinfo.com +44 161 838 9554 [email protected]
Global M&A Review H1 2019Western Europe
Page 21 © Bureau van Dijk
AbbVie’s acquisition of Allergan is Western Europe’s largest deal by far
The largest deal by value to target Western Europe was also the third-largest deal signed off globally in H1 2019 as AbbVie, via Venice Subsidiary, agreed to acquire Ireland-based pharmaceuticals manufacturer Allergan for USD 63,533 million. This deal accounted for 11 per cent of total M&A value in the region and was worth significantly more than the second-largest M&A deal in Western Europe, namely KKR, via Traviata, taking over German online news, magazines and advertising publisher Axel Springer for USD 7,704 million.
Interestingly, another Irish target featured in the third-largest deal of H1 2019 as Weatherford International, an oil and natural gas well drilling service provider, agreed to convert USD 7,400 million-worth of notes into a 99 per cent equity stake to senior noteholders. The fourth- and fifth-largest deals exceeded USD 6,000 million as Sunrise Communications agreed to buy Switzerland’s UPC Schweiz for USD 6,300 million, while Capgemini Service is picking up France’s Altran Technologies for USD 6,142 million. The UK was targeted in the sixth-largest deal; however, the country still featured in a total of six of the top 20 deals by value in H1 2019.
Germany was targeted in five of these deals, Switzerland featured four times, Ireland twice and the Netherlands, France and Spain in one deal each.
The UK once gain dominates top countries list
Despite not featuring in any of the top five M&A deals by value in Western Europe, companies based in the UK were still the most popular targets by value in the region and accounted for 23 per cent of total M&A value in Western Europe during H1 2019 (USD 555,677 million). In total, there were 3,344 deals worth USD 128,348 million targeting the UK during the six months under review. However, value for the country was down from USD 177,739 million in H2 2018 and USD 222,741 million in H1 2018.
France was second on both fronts with 1,981 deals worth USD 80,252 million, while Ireland (USD 77,915 million), Germany (USD 75,898 million) and the Netherlands (USD 45,520 million), followed by value.
In terms of volume, Germany placed third with 1,928 deals, followed by Sweden (1,160), Spain (1,059) and the Netherlands (1,043).
Western Europe PE and VC investment declines for the second-consecutive six-month period
PE and VC investment in Western Europe declined over the six months under review to 1,683 deals worth USD 114,070 million in H1 2019, representing 14 per cent of global PE and VC volume (12,385 deals) and 26 per cent of value (USD 443,115 million). Volume fell to the lowest-recorded result since H1 2013 (1,483 deals), while value declined 3 per cent from USD 117,571 million in H2 2018 and 12 per cent from USD 130,211 million in H1 2018.
All of the top 20 PE and VC deals in Western Europe were worth more than USD 1,000 million, twelve of which exceeded USD 2,000 million. The largest of these is the aforementioned acquisition of German publisher Axel Springer by KKR & Co for USD 7,704 million. A consortium of the Blackstone Group, Canada Pension Plan Investment Board and KIRKBI, via Berkeley Bidco, is buying UK-based theme park operator Merlin Entertainment for USD 5,268 million in the second-largest deal.
Other targets included Spain’s Compania Espanola de Petroleos, Germany’s Evonik Industries’ methacrylates business, UK-based Inmarsat and Gategroup Holding of Switzerland. Investors comprised Carlyle Group, Advent International, Warburg Pincus, General Atlantic, Triton Advisors and PAI Partners, to name a few.
The UK was once again the most popular target of PE and VC investment in Western Europe, with 574 deals worth USD 29,522 million. France was second by volume with 292 deals, while Germany was the runner up by value with USD 18,411 million.

You are free to use any data or commentary from this report in your articles as long as the source is cited as “Zephyr published by Bureau van Dijk”
bvdinfo.com +44 161 838 9554 [email protected]
Global M&A Review H1 2019Western Europe
Page 22 © Bureau van Dijk
Top 20 Western Europe deals by value
Deal value (mil USD) Deal type Target Target
country Acquiror Acquiror country
Announced date
1. 63,533 Acquisition 100% Allergan plc IE The Blackstone Group Inc.; Canada Pension Plan Investment Board; KIRKBI A/S via Venice Subsidiary LLC
US 25/06/2019
2. 7,704 IBO 100% Axel Springer SE DE KKR & Co Inc. via Traviata II Sarl LU 12/06/2019
3. 7,400 Acquisition 99% Weatherford International plc IE Senior Noteholders 10/05/2019
4. 6,300 Acquisition 100% UPC Schweiz GmbH CH Sunrise Communications Group AG CH 27/02/2019
5. 6,142 Acquisition 100% Altran Technologies SA FR Capgemini service SAS FR 24/06/2019
6. 5,300 Acquisition 100% Xiidra assets GB Novartis AG CH 08/05/2019
7. 5,268 Acquisition 30% to 100% Merlin Entertainments plc GB Berkeley Bidco Ltd GB 28/06/2019
8. 4,796 Minority stake 40% Compania Espanola de Petroleos SA ES Carlyle Group LP; Carlyle Partners VII LP; Carlyle International Energy Partners I; Carlyle International Energy Partners II SCS; Carlyle Europe Partners V SCSP
US; US; LU; LU
08/04/2019
9. 4,622 Acquisition 100% Panalpina Welttransport (Holding) AG CH DSV A/S DK 01/04/2019
10. 4,535 Capital Increase Vodafone Group plc GB 05/03/2019
11. 4,241 Acquisition 100% RPC Group plc GB Berry Global International Holdings Ltd GB 08/03/2019
12. 4,200 Acquisition 100% Camelot Holdings (Jersey) Ltd GB Clarivate Analytics plc GB 14/01/2019
13. 3,413 IBO 100% Evonik Industries AG's methacrylates business DE Advent International Corporation US 04/03/2019
14. 3,400 IBO 100% Inmarsat plc GB Warburg Pincus LLC; Ontario Teachers’ Pension Plan Board; Canada Pension Plan Investment Board; Apax Partners LLP via Connect Bidco Ltd
GB 25/03/2019
15. 3,247 Minority stake 5% Daimler AG DE Morgan Stanley; Investors US 04/01/2019
16. 3,016 Minority stake 3% Allianz SE DE Norges Bank NO 17/05/2019
17. 2,995 Acquisition 60% HELLA GmbH & Co KGaA DE Mr John Jakob Peter Sotje DE 12/03/2019
18. 2,927 Acquisition 100% STOXX AG; Deutsche Borse AG’s index business DAX; among other international assets
CH; NA Deutsche Borse Index and Portfolio Risk Analytics Business 09/04/2019
19. 2,857 Minority stake 10% Koninklijke Ahold Delhaize NV NL 10/05/2019
20. 2,800 IBO 100% Gategroup Holding AG CH RRJ Management Ltd KY 29/03/2019

You are free to use any data or commentary from this report in your articles as long as the source is cited as “Zephyr published by Bureau van Dijk”
bvdinfo.com +44 161 838 9554 [email protected]
Global M&A Review H1 2019Western Europe
Page 23 © Bureau van Dijk
Target country by volume - Western Europe deals
Target country H1 2018 H2 2018 H1 2019
UK 3,256 3,328 3,344
France 2,066 2,064 1,981
Germany 3,193 3,336 1,928
Sweden 1,376 1,250 1,160
Spain 1,348 1,530 1,059
Netherlands 1,290 1,286 1,043
Italy 847 951 744
Switzerland 711 764 305
Finland 411 323 251
Ireland 132 289 212
Belgium 315 265 179
Denmark 225 192 175
Norway 235 249 146
Luxembourg 122 122 131
Turkey 247 211 129
Portugal 119 90 74
Austria 155 134 51
Iceland 13 27 27
Cyprus 55 22 26
Malta 24 32 19
Target country by value - Western Europe deals
Target country H1 2018 (mil USD)
H2 2018 (mil USD)
H1 2019 (mil USD)
UK 222,741 177,739 128,348
France 73,296 66,147 80,252
Ireland 4,635 25,736 77,915
Germany 219,943 103,130 75,898
Netherlands 93,795 42,381 45,520
Spain 100,828 66,250 33,131
Switzerland 31,634 30,886 30,877
Sweden 29,435 24,110 24,887
Italy 38,878 53,529 19,825
Belgium 12,627 9,502 12,492
Norway 6,453 11,999 10,062
Luxembourg 23,443 9,187 7,123
Finland 10,678 14,668 6,474
Denmark 9,285 9,290 5,242
Cyprus 4,114 3,228 1,592
Portugal 8,471 6,411 1,423
Turkey 33,849 5,759 1,392
Greece 4,969 2,879 985
Iceland 359 637 384
Austria 11,845 2,849 368

You are free to use any data or commentary from this report in your articles as long as the source is cited as “Zephyr published by Bureau van Dijk”
bvdinfo.com +44 161 838 9554 [email protected]
Global M&A Review H1 2019Western Europe
Page 24 © Bureau van Dijk
Target sector by volume - Western Europe deals
Target sector H1 2018 H2 2018 H1 2019
Other services 6,336 6,229 5,212
Machinery, equipment, furniture, recycling 2,281 2,560 1,678
Wholesale & retail trade 1,218 1,288 1,109
Chemicals, rubber, plastics 793 944 673
Publishing, printing 776 631 650
Construction 698 609 544
Metals & metal products 646 614 461
Post and telecommunications 385 391 338
Food, beverages, tobacco 370 405 296
Banks 425 403 268
Transport 386 373 265
Insurance companies 267 310 264
Primary sector 315 387 252
Gas, water, electricity 389 393 238
Hotels & restaurants 234 260 232
Education, health 246 244 198
Textiles, wearing apparel, leather 219 218 177
Wood, cork, paper 161 186 132
Public administration and defence 8 15 8
Target sector by value - Western Europe deals
Target sector H1 2018 (mil USD)
H2 2018 (mil USD)
H1 2019 (mil USD)
Other services 246,365 188,485 170,639
Chemicals, rubber, plastics 150,473 61,549 115,318
Machinery, equipment, furniture, recycling 115,781 115,761 45,606
Wholesale & retail trade 30,654 27,453 36,557
Post and telecommunications 53,017 18,691 28,283
Primary sector 14,212 18,268 23,662
Transport 60,516 33,075 20,039
Banks 68,315 31,575 16,097
Hotels & restaurants 14,738 15,662 15,762
Insurance companies 22,541 32,455 15,739
Metals & metal products 10,116 25,234 15,421
Publishing, printing 18,691 14,707 13,586
Gas, water, electricity 83,145 29,573 11,545
Food, beverages, tobacco 15,795 9,929 11,541
Construction 21,745 21,040 8,584
Education, health 9,463 6,629 4,373
Textiles, wearing apparel, leather 11,226 5,629 3,454
Wood, cork, paper 7,008 2,827 2,097
Public administration and defence 229 559 121

You are free to use any data or commentary from this report in your articles as long as the source is cited as “Zephyr published by Bureau van Dijk”
bvdinfo.com +44 161 838 9554 [email protected]
Global M&A Review H1 2019Western Europe
Page 25 © Bureau van Dijk
Western Europe private equity deals by volume and value
Announced date No of deals Total deal value (mil USD)
H1 2019 1,683 114,070
H2 2018 1,871 117,571
H1 2018 2,067 130,211
H2 2017 1,924 104,459
H1 2017 1,898 82,256
H2 2016 2,001 89,830
H1 2016 1,948 73,294
H2 2015 2,120 66,515
H1 2015 1,954 68,267

You are free to use any data or commentary from this report in your articles as long as the source is cited as “Zephyr published by Bureau van Dijk”
bvdinfo.com +44 161 838 9554 [email protected]
Global M&A Review H1 2019Western Europe
Page 26 © Bureau van Dijk
Western Europe private equity deals by volume and value
0
500
1,000
1,500
2,000
2,500
0
20,000
40,000
60,000
80,000
100,000
120,000
140,000
H1 2015 H2 2015 H1 2016 H2 2016 H1 2017 H2 2017 H1 2018 H2 2018 H1 2019
Dea
l val
ue (m
il U
SD
)
Total deal value (mil USD) Number of deals

You are free to use any data or commentary from this report in your articles as long as the source is cited as “Zephyr published by Bureau van Dijk”
bvdinfo.com +44 161 838 9554 [email protected]
Global M&A Review H1 2019Western Europe
Page 27 © Bureau van Dijk
Top 20 Western Europe private equity deals by value
Deal value (mil USD) Deal type Target Target
country Fund Manager/General Partner Announced date
1. 7,704 IBO 100% Axel Springer SE DE KKR & Co Inc. 12/06/2019
2. 5,268 Acquisition 30% to 100% Merlin Entertainments plc GB The Blackstone Group Inc.; Canada Pension Plan Investment Board; KIRKBI A/S 28/06/2019
3. 4,796 Minority stake 40% Compania Espanola de Petroleos SA ES Carlyle Group LP 08/04/2019
4. 3,413 IBO 100% Evonik Industries AG's methacrylates business DE Advent International Corporation 04/03/2019
5. 3,400 IBO 100% Inmarsat plc GB Warburg Pincus LLC; Ontario Teachers' Pension Plan Board; Canada Pension Plan Investment Board; Apax Partners LLP
25/03/2019
6. 2,927 Acquisition 100% STOXX AG; Deutsche Borse AG’s index business DAX; among other international assets
CH; US General Atlantic LLC 09/04/2019
7. 2,800 IBO 100% Gategroup Holding AG CH RRJ Management Ltd 29/03/2019
8. 2,735 IBO 90% Norddeutsche Landesbank Girozentrale's non-performing shipping loans DE Cerberus Capital Management LP 02/02/2019
9. 2,510 IBO 100% IFCO Systems BV NL Triton Advisers Ltd 25/02/2019
10. 2,418 IBO 100% BCA Marketplace plc GB TDR Capital LLP 26/06/2019
11. 2,233 IBO 100% B&B Hotels SNC FR Goldman Sachs Group Inc. 20/05/2019
12. 2,073 IBO 100% IP-Only AB SE EQT Partners AB 11/06/2019
13. 1,841 IBO 100% Autostore AS NO Thomas H Lee Partners LP 20/06/2019
14. 1,800 IBO 100% Howden Group Ltd GB KPS Capital Partners LP 16/05/2019
15. 1,753 IBO 100% Areas SA ES PAI Partners SAS 24/04/2019
16. 1,704 IBO 100% Eiger MidCo BV NL KKR & Co Inc. 26/02/2019
17. 1,691 IBO 50% Indigo Infra SA FR Natixis Investment Managers SA 27/03/2019
18. 1,393 IBO 100% Solveig Gas Holdco AS NO HitecVision AS 01/04/2019
19. 1,351 IBO 100% CapeOmega AS NO Partners Group Holding AG 23/04/2019
20. 1,300 IBO 100% Efront Holding SAS FR BlackRock Inc. 22/03/2019

You are free to use any data or commentary from this report in your articles as long as the source is cited as “Zephyr published by Bureau van Dijk”
bvdinfo.com +44 161 838 9554 [email protected]
Global M&A Review H1 2019Western Europe
Page 28 © Bureau van Dijk
Target country by volume - Western Europe private equity deals
Target country H1 2018 H2 2018 H1 2019
UK 564 525 574
France 451 306 292
Germany 257 278 161
Spain 169 150 131
Italy 113 117 121
Netherlands 90 100 98
Sweden 111 92 82
Belgium 41 55 40
Ireland 31 33 37
Switzerland 50 69 35
Denmark 29 26 27
Finland 52 35 26
Portugal 21 16 22
Norway 24 19 20
Austria 22 20 11
Luxembourg 20 11 11
Iceland 3 4 4
Malta 1 6 3
Turkey 8 5 2
Target country by value - Western Europe private equity deals
Target country H1 2018 (mil USD)
H2 2018 (mil USD)
H1 2019 (mil USD)
UK 21,246 22,920 29,522
Germany 14,252 11,290 18,411
Spain 12,410 17,388 14,875
France 17,085 11,700 13,058
Netherlands 22,594 5,770 9,642
Switzerland 473 3,323 7,171
Sweden 2,632 5,213 6,652
Norway 2,488 956 5,544
Italy 10,939 10,534 5,247
Ireland 969 14,891 2,338
Belgium 449 1,529 1,988
Luxembourg 10,853 1,816 1,311
Denmark 6,930 540 938
Portugal 2,352 1,684 865
Finland 2,713 6,222 410
Malta 7 34 196
Austria 1,071 930 142
Turkey 362 0 17
Iceland 111 47 11

You are free to use any data or commentary from this report in your articles as long as the source is cited as “Zephyr published by Bureau van Dijk”
bvdinfo.com +44 161 838 9554 [email protected]
Global M&A Review H1 2019Western Europe
Page 29 © Bureau van Dijk
Target sectors by volume - Western Europe private equity deals
Target sector H1 2018 H2 2018 H1 2019
Other services 1,048 975 895
Publishing, printing 233 200 174
Machinery, equipment, furniture, recycling 252 214 160
Wholesale & retail trade 88 87 84
Chemicals, rubber, plastics 70 73 59
Food, beverages, tobacco 41 41 44
Education, health 41 36 40
Hotels & restaurants 38 22 36
Gas, water, electricity 30 37 32
Transport 26 28 22
Metals & metal products 37 24 22
Construction 36 27 22
Insurance companies 24 19 19
Textiles, wearing apparel, leather 24 23 19
Post and telecommunications 26 15 17
Primary sector 9 12 12
Wood, cork, paper 13 8 7
Banks 10 6 4
Public administration and defence 2 2 1
Target sectors by value - Western Europe private equity deals
Target sector H1 2018 (mil USD)
H2 2018 (mil USD)
H1 2019 (mil USD)
Other services 30,679 31,748 47,330
Chemicals, rubber, plastics 19,278 6,313 12,300
Wholesale & retail trade 7,073 4,078 9,023
Machinery, equipment, furniture, recycling 12,414 22,512 8,747
Hotels & restaurants 6,693 796 8,732
Post and telecommunications 14,117 4,287 6,031
Food, beverages, tobacco 5,193 272 4,350
Transport 10,692 5,879 3,998
Education, health 3,633 1,465 3,196
Publishing, printing 2,774 5,774 2,935
Gas, water, electricity 2,652 12,530 2,606
Primary sector 4,388 160 1,905
Metals & metal products 1,644 1,379 1,493
Construction 364 3,837 820
Wood, cork, paper 559 456 390
Banks 2,075 10,758 381
Insurance companies 2,077 4,912 368
Textiles, wearing apparel, leather 188 310 99
Public administration and defence 212 43 0

You are free to use any data or commentary from this report in your articles as long as the source is cited as “Zephyr published by Bureau van Dijk”
bvdinfo.com +44 161 838 9554 [email protected]
Global M&A Review H1 2019North America
Page 30 © Bureau van Dijk
North American value in H1 highest since H2 2015, volume one of the highest in three years
M&A targeting companies based in North America totalled 16,742 deals worth an aggregate USD 1,119,100 million in H1 2019, which accounted for 33 per cent of H1’s global volume (51,449) and 44 per cent of value (USD 2,569,594 million).
The volume of deals targeting North American companies in H1 may be down from 19,105 deals in H2 2018, but it still represented the second-highest volume recorded since H1 2016, when 21,287 deals were announced.
The fact volume was higher than all the preceding half-year periods, bar H2 2018, back to H2 2016 suggests prolific dealmaking provided a boost to H1 value. However, it should be noted that 19 of the top 20 deals by value were each worth USD 10,000 million or more and were the main drivers of growth in H1. Together, these deals accounted for 42 per cent of the region’s total value in H1, which represented the highest recorded since H2 2015 (USD 1,185,017 million).
Considering all of the 19 deals worth USD 10,000 million or more in H1 targeted companies based in the US, it is not surprising the country’s 15,499 deals totalling USD 1,069,322 million accounted for 93 per cent of North American’s total volume in H1 and 96 per cent of the region’s overall value. This contrasts starkly with Canada, which was targeted in just 1,236 deals worth USD 49,972 million, down from 1,579 deals aggregating at USD 55,972 million in H2 2018.
North America deals by volume and value
Announced date No of deals Total deal value (mil USD)
H1 2019 16,742 1,119,100
H2 2018 19,105 913,793
H1 2018 12,383 1,091,244
H2 2017 12,044 757,571
H1 2017 13,643 783,025
H2 2016 12,706 1,076,663
H1 2016 21,287 892,549
H2 2015 22,188 1,185,017
H1 2015 15,001 986,672

You are free to use any data or commentary from this report in your articles as long as the source is cited as “Zephyr published by Bureau van Dijk”
bvdinfo.com +44 161 838 9554 [email protected]
Global M&A Review H1 2019North America
Page 31 © Bureau van Dijk
US deals by volume and value
Announced date No of deals Total deal value (mil USD)
H1 2019 15,499 1,069,322
H2 2018 17,518 861,615
H1 2018 10,641 1,009,939
H2 2017 10,263 712,715
H1 2017 11,312 697,237
H2 2016 10,475 1,008,808
H1 2016 18,866 831,453
H2 2015 20,047 1,139,605
H1 2015 12,728 883,004
Canada deals by volume and value
Announced date No of deals Total deal value (mil USD)
H1 2019 1,236 49,972
H2 2018 1,579 55,972
H1 2018 1,748 83,078
H2 2017 1,787 49,036
H1 2017 2,335 85,345
H2 2016 2,233 67,208
H1 2016 2,426 61,906
H2 2015 2,143 46,565
H1 2015 2,274 103,781

You are free to use any data or commentary from this report in your articles as long as the source is cited as “Zephyr published by Bureau van Dijk”
bvdinfo.com +44 161 838 9554 [email protected]
Global M&A Review H1 2019North America
Page 32 © Bureau van Dijk
North America deals by volume and value
0
5,000
10,000
15,000
20,000
25,000
0
200,000
400,000
600,000
800,000
1,000,000
1,200,000
1,400,000
H1 2015 H2 2015 H1 2016 H2 2016 H1 2017 H2 2017 H1 2018 H2 2018 H1 2019
Dea
l val
ue (m
il U
SD
)
Total deal value (mil USD) Number of deals

You are free to use any data or commentary from this report in your articles as long as the source is cited as “Zephyr published by Bureau van Dijk”
bvdinfo.com +44 161 838 9554 [email protected]
Global M&A Review H1 2019North America
Page 33 © Bureau van Dijk
Myers Squibb’s proposed acquisition of Celgene is largest deal of H1
The first six months of 2019 have seen some game-changing deals in North America, not least Bristol-Myers Squibb’s proposal to take Celgene private in a USD 74,000 million acquisition.
Occidental Petroleum’s decision to derail an earlier USD 50,000 million bid by Chevron for Anadarko by tabling its own rival offer worth USD 57,000 million to create one of the world’s largest independent exploration and production companies represents the second-largest North American deal of H1. Incidentally, Berkshire Hathaway’s commitment of USD 10,000 million to help Occidental finance its offer is ranked 19th in the region’s top 20.
Other game-changers include Raytheon and United Technologies announcing a so-called a merger of equals, which would pave the way for a USD 121,000 million leading systems provider with advanced technologies within the aerospace and defence industry.
North America’s digital payment industry has also received significant interest in H1 as Fidelity National Information Services is acquiring Worldpay for USD 43,000 million, Fiserv is taking over First Data for USD 39,000 million, and Global Payments has made a USD 21,500 million play for Total System Services. By contrast, the largest traditional banking deal in H1 is the region’s sixth-largest deal overall and the only banking deal to feature in the top 20 as BB&T announced plans to buy SunTrust Banks for USD 28,085 million.
When compared to H2 2018, value was stripped away from dealmaking targeting companies operating in sectors such as machinery, equipment, furniture, recycling and wood, cork and paper, among others. The decline came against an increase recorded for banks and post and telecommunications, for example.
While chemicals, rubber and plastics led by value, the machinery, equipment, furniture and recycling sector led by volume, with the 1,682 deals recorded outpacing wholesale and retail trade (732). A decline in the volume of deals targeting companies operating in these two sectors from H2 2018 came alongside an uptick - albeit small - in dealmaking targeting gas, water and electricity, public administration and defence, and construction.
North American PE and VC value the highest since H2 2015, Canadian value one of the highest in eight years
There were 7,784 PE and VC deals targeting North American companies worth USD 222,066 million in H1, up from 7,466 deals totalling USD 160,929 million in H2 2018. In fact, like M&A value, PE and VC value was the highest recorded since H2 2015, when USD 263,409 million-worth of deals were announced.
While US-based companies attracted the most investment, namely USD 211,822 million, Canadian companies were targeted in USD 10,230 million-worth of PE and VC deals, which, after H1 2018 (USD 34,661 million), represents the second-highest value since H1 2011 (USD 10,534 million). The half-yearly increase from USD 6,358 million to one of the largest values in eight years was partly due to Onex announcing plans to acquire WestJet Airlines for USD 3,723 million and a USD 1,287 million buyout of Alberta PowerLine by a consortium that included Greystone Managed Investments and IST3 Investmentstiftung. Together, these two deals accounted for almost half of the country’s total value for H1 2019.
Blackstone accounted for the largest PE and VC deal target North America after launching an institutional buyout that values GLP’s US urban, infill logistics assets at USD 18,700 million.
Celgene deal propels chemicals, rubber and plastics sector to top position
Bristol-Myers Squibb’s proposal to take Celgene private for USD 74,000 million made chemicals, rubber and plastics one of the top sectors by value in H1, with USD 118,984 million-worth of deals, compared to USD 60,999 million in H2 2018 and USD 83,012 million in H1 2018, though volume was down over the six months at 686 deals, from 1,133 in H2 2018.

You are free to use any data or commentary from this report in your articles as long as the source is cited as “Zephyr published by Bureau van Dijk”
bvdinfo.com +44 161 838 9554 [email protected]
Global M&A Review H1 2019North America
Page 34 © Bureau van Dijk
Top 20 North America deals by value
Deal value (mil USD) Deal type Target Target
country Acquiror Acquiror country
Announced date
1. 74,000 Acquisition 100% Celgene Corporation US Bristol-Myers Squibb Company US 03/01/2019
2. 57,000 Acquisition 100% Anadarko Petroleum Corporation US Occidental Petroleum Corporation US 09/05/2019
3. 54,031 Acquisition 100% Raytheon Company US United Technologies Corporation US 09/06/2019
4. 43,000 Acquisition 100% Worldpay Inc. US Fidelity National Information Services Inc. US 18/03/2019
5. 39,000 Acquisition 100% First Data Corporation US Fiserv Inc. US 16/01/2019
6. 28,085 Acquisition 100% SunTrust Banks Inc. US BB&T Corporation US 07/02/2019
7. 21,500 Acquisition 100% Total System Services Inc. US Global Payments Inc. US 28/05/2019
8. 21,400 Acquisition 100% General Electric Company's BioPharma business US Danaher Corporation US 25/02/2019
9. 18,700 IBO 100% GLP Pte Ltd's US urban, infill logistics assets US The Blackstone Group LP US 02/06/2019
10. 17,300 Acquisition 100% WellCare Health Plans Inc. US Centene Corporation, via acquisition vehicle Wellington Merger Sub II Inc. US 27/03/2019
11. 17,300 Acquisition 100% Caesars Entertainment Corporation US Eldorado Resorts Inc. US 24/06/2019
12. 15,700 Acquisition 100% Tableau Software Inc. US Salesforce.com Inc. US 10/06/2019
13. 14,300 IBO 100% Zayo Group Holdings Inc. US Front Range TopCo Inc. US 08/05/2019
14. 14,000 Acquisition 100% Andeavor Logistics LP US MPLX LP US 08/05/2019
15. 11,400 Acquisition 100% Array BioPharma Inc. US Pfizer Inc. US 17/06/2019
16. 11,000 IBO 100% Ultimate Software Group Inc. US Unite Parent Corporation US 04/02/2019
17. 10,300 IBO 100% Buckeye Partners LP US Hercules Intermediate Holdings LLC US 10/05/2019
18. 10,084 Acquisition 100% Cypress Semiconductor Corporation US Infineon Technologies AG DE 02/06/2019
19. 10,000 Capital Increase Occidental Petroleum Corporation US Berkshire Hathaway Inc. US 30/04/2019
20. 9,600 Acquisition 100% Fox Sports Net LLC US Sinclair Broadcast Group Inc. via acquisition vehicle Diamond Sports Group LLC US 03/05/2019

You are free to use any data or commentary from this report in your articles as long as the source is cited as “Zephyr published by Bureau van Dijk”
bvdinfo.com +44 161 838 9554 [email protected]
Global M&A Review H1 2019North America
Page 35 © Bureau van Dijk
Target sector by volume - North America deals
Target sector H1 2018 H2 2018 H1 2019
Other services 4,944 6,557 6,040
Machinery, equipment, furniture, recycling 663 2,066 1,682
Wholesale & retail trade 337 956 732
Chemicals, rubber, plastics 344 1,133 686
Publishing, printing 578 729 584
Metals & metal products 672 596 518
Gas, water, electricity 141 392 402
Insurance companies 188 529 385
Banks 103 385 326
Primary sector 280 517 305
Food, beverages, tobacco 126 374 281
Transport 84 293 227
Education, health 234 224 211
Post and telecommunications 48 233 172
Hotels & restaurants 66 228 124
Construction 107 107 108
Textiles, wearing apparel, leather 55 106 88
Wood, cork, paper 35 82 55
Public administration and defence 20 14 17
Target sector by value - North America deals
Target sector H1 2018 (mil USD)
H2 2018 (mil USD)
H1 2019 (mil USD)
Other services 406,953 364,475 485,028
Chemicals, rubber, plastics 83,012 60,999 118,984
Primary sector 51,584 78,347 95,655
Machinery, equipment, furniture, recycling 101,883 119,892 95,513
Wholesale & retail trade 27,497 32,175 49,633
Publishing, printing 26,402 69,310 45,670
Banks 15,819 16,021 42,770
Transport 23,282 39,388 31,838
Gas, water, electricity 55,133 22,891 24,910
Hotels & restaurants 15,372 11,000 22,755
Education, health 23,950 15,012 19,856
Metals & metal products 10,076 11,352 19,658
Post and telecommunications 93,529 5,942 19,205
Food, beverages, tobacco 48,731 14,871 11,258
Insurance companies 80,074 16,909 8,920
Construction 5,328 4,594 4,878
Wood, cork, paper 8,712 8,283 3,244
Textiles, wearing apparel, leather 2,835 3,472 1,475
Public administration and defence 790 102 94

You are free to use any data or commentary from this report in your articles as long as the source is cited as “Zephyr published by Bureau van Dijk”
bvdinfo.com +44 161 838 9554 [email protected]
Global M&A Review H1 2019North America
Page 36 © Bureau van Dijk
North America private equity deals by volume and value
Announced date No of deals Total deal value (mil USD)
H1 2019 7,784 222,066
H2 2018 7,466 160,929
H1 2018 8,045 212,426
H2 2017 7,165 172,913
H1 2017 7,822 188,239
H2 2016 7,250 148,048
H1 2016 7,419 130,805
H2 2015 8,282 263,409
H1 2015 8,389 196,917
Canada private equity deals by volume and value
Announced date No of deals Total deal value (mil USD)
H1 2019 303 10,230
H2 2018 390 6,358
H1 2018 361 34,661
H2 2017 297 6,106
H1 2017 318 6,195
H2 2016 318 4,218
H1 2016 288 4,694
H2 2015 305 2,903
H1 2015 366 8,587
US private equity deals by volume and value
Announced date No of deals Total deal value (mil USD)
H1 2019 7,470 211,822
H2 2018 7,066 158,139
H1 2018 7,685 179,502
H2 2017 6,868 166,807
H1 2017 7,501 182,017
H2 2016 6,929 143,749
H1 2016 7,129 126,102
H2 2015 7,976 260,506
H1 2015 8,020 188,254

You are free to use any data or commentary from this report in your articles as long as the source is cited as “Zephyr published by Bureau van Dijk”
bvdinfo.com +44 161 838 9554 [email protected]
Global M&A Review H1 2019North America
Page 37 © Bureau van Dijk
North America private equity deals by volume and value
6,400
6,600
6,800
7,000
7,200
7,400
7,600
7,800
8,000
8,200
8,400
8,600
0
50,000
100,000
150,000
200,000
250,000
300,000
H1 2015 H2 2015 H1 2016 H2 2016 H1 2017 H2 2017 H1 2018 H2 2018 H1 2019
Dea
l val
ue (m
il U
SD
)
Total deal value (mil USD) Number of deals

You are free to use any data or commentary from this report in your articles as long as the source is cited as “Zephyr published by Bureau van Dijk”
bvdinfo.com +44 161 838 9554 [email protected]
Global M&A Review H1 2019North America
Page 38 © Bureau van Dijk You are free to use any data or commentary from this report in your articles as long as the source is cited as “Zephyr published by BvD”
Top 20 North America private equity deals by value
Deal value (mil USD) Deal type Target Target
country Fund Manager/General Partner Announced date
1. 18,700 IBO 100% GLP Pte Ltd's US urban, infill logistics assets US The Blackstone Group LP 02/06/2019
2. 14,300 IBO 100% Zayo Group Holdings Inc. US Devonshire Investors LLC; EQT AB; Digital Colony Management LLC 08/05/2019
3. 11,000 IBO 100% Ultimate Software Group Inc. US Hellman & Friedman LLC; The Blackstone Group LP; JMI Management Inc.; Canada Pension Plan Investment Board
04/02/2019
4. 10,300 IBO 100% Buckeye Partners LP US IFM Investors Pty Ltd 10/05/2019
5. 4,300 IBO100% El Paso Electric Company Inc. US JP Morgan Investment Management Inc. 01/06/2019
6. 3,723 IBO 100% WestJet Airlines Ltd CA Onex Corporation 13/05/2019
7. 3,700 IBO 100% Ellie Mae Inc. US Thoma Bravo LLC 12/02/2019
8. 3,600 IBO 100% Oryx Southern Delaware Holdings LLC's assets; Oryx Delaware Holdings LLC's assets
US; US Stonepeak Partners LP 02/04/2019
9. 3,273 IBO 44% and 100% Tallgrass Energy LP; Tallgrass Energy GP LLC US; US The Blackstone Group LP 31/01/2019
10. 3,000 IBO Cox Enterprises Inc.'s 14 regional television stations US Apollo Global Management LLC 15/02/2019
11. 2,927 Acquisition 100% Axioma Inc.; among other international assets US General Atlantic LLC 09/04/2019
12. 2,700 IBO 100% Shutterfly Inc. US Apollo Global Management LLC 10/06/2019
13. 2,700 IBO 100% Capital Vision Services LP US Goldman Sachs & Co LLC 03/06/2019
14. 2,500 IBO 100% Multi-Color Corporation US Platinum Equity LLC 24/02/2019
15. 2,500 IBO 80% Direct ChassisLink Inc.; Blume Global Inc. US; US Apollo Global Management LLC 07/03/2019
16. 2,000 IBO 75% Advisor Group Inc. US Reverence Capital Partners LLC 09/05/2019
17. 1,800 IBO majority stake Millennium Trust Company LLC US Abry Partners LLC 04/01/2019
18. 1,780 IBO 100% LBCT LLC US Macquarie Infrastructure Partners Inc. 30/04/2019
19. 1,700 IBO 100% Electronics For Imaging Inc. US Siris Capital Group LLC 15/04/2019
20. 1,600 Minority stake 45% Targa Badlands LLC US GSO Capital Partners LP; Blackstone Tactical Opportunities Advisors LLC 19/02/2019

You are free to use any data or commentary from this report in your articles as long as the source is cited as “Zephyr published by Bureau van Dijk”
bvdinfo.com +44 161 838 9554 [email protected]
Global M&A Review H1 2019North America
Page 39 © Bureau van Dijk You are free to use any data or commentary from this report in your articles as long as the source is cited as “Zephyr published by BvD”
Target sectors by volume - North America private equity deals
Target sector H1 2018 H2 2018 H1 2019
Other services 3,260 2,787 2,946
Publishing, printing 336 248 251
Machinery, equipment, furniture, recycling 314 253 244
Chemicals, rubber, plastics 119 109 108
Wholesale & retail trade 81 98 84
Gas, water, electricity 88 74 83
Education, health 111 68 70
Food, beverages, tobacco 60 51 49
Metals & metal products 69 51 32
Banks 35 36 31
Post and telecommunications 20 28 29
Transport 25 23 28
Primary sector 54 50 26
Insurance companies 26 23 18
Textiles, wearing apparel, leather 21 13 15
Construction 30 19 13
Hotels & restaurants 23 15 10
Public administration and defence 8 8 10
Wood, cork, paper 9 7 7
Target sectors by value - North America private equity deals
Target sector H1 2018 (mil USD)
H2 2018 (mil USD)
H1 2019 (mil USD)
Other services 101,105 74,038 95,699
Transport 5,108 9,074 24,251
Publishing, printing 9,521 8,855 18,297
Post and telecommunications 1,799 656 15,883
Machinery, equipment, furniture, recycling 15,600 11,429 10,879
Gas, water, electricity 13,661 3,238 9,789
Wholesale & retail trade 3,966 1,777 8,419
Chemicals, rubber, plastics 3,239 11,215 4,297
Primary sector 7,858 5,928 3,226
Wood, cork, paper 2,562 498 2,540
Food, beverages, tobacco 2,901 1,048 1,779
Hotels & restaurants 3,507 1,686 1,512
Insurance companies 2,629 1,225 690
Education, health 17,737 2,413 668
Banks 398 370 539
Textiles, wearing apparel, leather 275 503 284
Public administration and defence 20 85 89
Construction 856 1,256 88
Metals & metal products 1,255 540 48

You are free to use any data or commentary from this report in your articles as long as the source is cited as “Zephyr published by Bureau van Dijk”
bvdinfo.com +44 161 838 9554 [email protected]
Global M&A Review H1 2019Asia-Pacific
Page 40 © Bureau van Dijk
Asia Pacific volume and value down in H1 2019
The volume and value of M&A targeting companies based in Asia Pacific declined in H1 2019 to 17,151 deals worth USD 583,179 million. M&A in Asia Pacific represents 33 per cent of total global volume (51,449 deals) and 23 per cent of total global M&A value (USD 2,569,594 million).
Volume declined 16 per cent from 20,523 deals in H2 2018 and 10 per cent from 19,139 million in H1 2018, while value fell 23 per cent from USD 760,402 million in the previous six-month period and 21 per cent from USD 741,426 million in the same timeframe last year.
One deal exceeded USD 10,000 million in H1 2019 and accounted for 3 per cent of total M&A value in Asia Pacific, while the remaining top 20 deals by value all exceeded USD 2,000 million.
Asia and Asia Pacific deals by volume and value
Announced date No of deals Total deal value (mil USD)
H1 2019 17,151 583,179
H2 2018 20,523 760,402
H1 2018 19,139 741,426
H2 2017 20,329 834,046
H1 2017 17,900 673,296
H2 2016 18,205 701,783
H1 2016 17,176 665,338
H2 2015 19,949 964,201
H1 2015 18,302 905,157

You are free to use any data or commentary from this report in your articles as long as the source is cited as “Zephyr published by Bureau van Dijk”
bvdinfo.com +44 161 838 9554 [email protected]
Global M&A Review H1 2019Asia-Pacific
Page 41 © Bureau van Dijk
Asia and Asia Pacific deals by volume and value
15,000
16,000
17,000
18,000
19,000
20,000
21,000
0
200,000
400,000
600,000
800,000
1,000,000
1,200,000
H1 2015 H2 2015 H1 2016 H2 2016 H1 2017 H2 2017 H1 2018 H2 2018 H1 2019
Dea
l val
ue (m
il U
SD
)
Total deal value (mil USD) Number of deals

You are free to use any data or commentary from this report in your articles as long as the source is cited as “Zephyr published by Bureau van Dijk”
bvdinfo.com +44 161 838 9554 [email protected]
Global M&A Review H1 2019Asia-Pacific
Page 42 © Bureau van Dijk
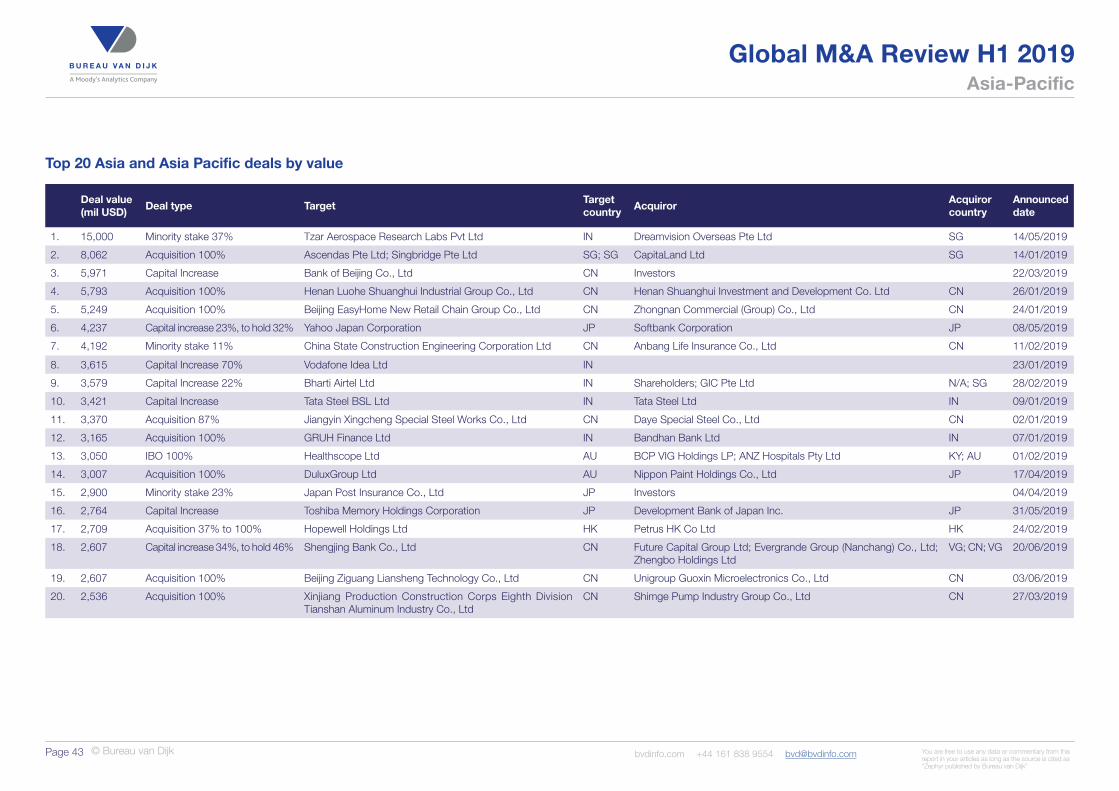
Indian targets feature in five of the top 20, including the largest deal in H1
While eight of the top 20 Asia Pacific deals by value targeted Chinese companies, it was India that stood out, having featured in five of the 12-largest deals. This includes the biggest deal in H1 2019 as Dreamvision Overseas agreed to acquire a 37 per cent stake in conceptual unmanned hypersonic research aircraft developer Tzar Aerospace Research Labs for USD 15,000 million.
This deal was worth significantly more than the second-largest as CapitaLand agreed to pick up Ascendas and Singbridge, both of Singapore, for USD 8,062 million. Bank of Beijing issued preference shares to raise USD 5,971 million in cash in the third-biggest deal.
Henan Luohe Shuanghui Industrial Group and Beijing EasyHome New Retail Chain Group placed fourth and fifth by value, respectively, while Yahoo Japan raised USD 4,237 million after issuing new shares to Softbank in the sixth-largest deal.
China dominates country rankings, while value in India increases in H1 2019
China led the way by both volume and value in H1 2019 as 6,906 deals worth an aggregate USD 288,095 million were signed off in the six months under review. M&A in the country accounted for 40 per cent of the volume recorded for the entire Asia Pacific region (17,151), with value representing 49 per cent of the total USD 583,179 million announced in H1 2019.
Having heavily featured in the top deals by value, companies based in India placed second in terms of value with USD 75,855 million, up 40 per cent from USD 54,041 million in H2 2018 and 15 per cent from USD 66,003 million in H1 2018. It is worth noting that the region’s largest M&A deal accounts for 20 per cent of total value in India.
South Korea (USD 41,962 million) and Japan (USD 41,530 million) placed third and fourth by value, respectively, with the latter also being the second most popular target in Asia Pacific, with 2,124 deals recorded during the six-month period.
Asia Pacific PE and VC investment also down in H1
The volume and value of PE and VC investment in companies based in Asia-Pacific declined across the board to 2,382 deals worth USD 85,401 million in H1 2019. Activity in the region accounts for 19 per cent of both global PE and VC volume and value of 12,385 deals worth USD 443,115 million.
In terms of volume, H1 2019 decreased 16 per cent from 2,824 deals in H2 2018 and 2,840 deals in H1 2018. While value did not exceed USD 100,000 million for the first time since H1 2017 (USD 81,977 million) and fell 15 per cent in a year-on-year comparison.
Value was supported by the largest PE and VC deal signed off in the Asia-Pacific region as Dreamvision Overseas agreed to acquire a 37 per cent stake in India’s Tzar Aerospace Research Labs for USD 15,000 million. This was also the region’s largest M&A deal and accounts for 18 per cent of total PE and VC value for the region.
Brookfield Capital Partners agreed to acquire Australia’s Healthscope for USD 3,050 million in the second-biggest of these, while China Development Bank Capital took part in an investment in China gas technology developer Shanxi Gas Group worth USD 2,384 million.
Other investors included SSG Capital Management, Partners Group Holding, IMM Private Equity and the Blackstone Group.
You are free to use any data or commentary from this report in your articles as long as the source is cited as “Zephyr published by Bureau van Dijk”
bvdinfo.com +44 161 838 9554 [email protected]
Global M&A Review H1 2019Asia-Pacific
Page 43 © Bureau van Dijk
Top 20 Asia and Asia Pacific deals by value
Deal value (mil USD) Deal type Target Target
country Acquiror Acquiror country
Announced date
1. 15,000 Minority stake 37% Tzar Aerospace Research Labs Pvt Ltd IN Dreamvision Overseas Pte Ltd SG 14/05/2019
2. 8,062 Acquisition 100% Ascendas Pte Ltd; Singbridge Pte Ltd SG; SG CapitaLand Ltd SG 14/01/2019
3. 5,971 Capital Increase Bank of Beijing Co., Ltd CN Investors 22/03/2019
4. 5,793 Acquisition 100% Henan Luohe Shuanghui Industrial Group Co., Ltd CN Henan Shuanghui Investment and Development Co. Ltd CN 26/01/2019
5. 5,249 Acquisition 100% Beijing EasyHome New Retail Chain Group Co., Ltd CN Zhongnan Commercial (Group) Co., Ltd CN 24/01/2019
6. 4,237 Capital increase 23%, to hold 32% Yahoo Japan Corporation JP Softbank Corporation JP 08/05/2019
7. 4,192 Minority stake 11% China State Construction Engineering Corporation Ltd CN Anbang Life Insurance Co., Ltd CN 11/02/2019
8. 3,615 Capital Increase 70% Vodafone Idea Ltd IN 23/01/2019
9. 3,579 Capital Increase 22% Bharti Airtel Ltd IN Shareholders; GIC Pte Ltd N/A; SG 28/02/2019
10. 3,421 Capital Increase Tata Steel BSL Ltd IN Tata Steel Ltd IN 09/01/2019
11. 3,370 Acquisition 87% Jiangyin Xingcheng Special Steel Works Co., Ltd CN Daye Special Steel Co., Ltd CN 02/01/2019
12. 3,165 Acquisition 100% GRUH Finance Ltd IN Bandhan Bank Ltd IN 07/01/2019
13. 3,050 IBO 100% Healthscope Ltd AU BCP VIG Holdings LP; ANZ Hospitals Pty Ltd KY; AU 01/02/2019
14. 3,007 Acquisition 100% DuluxGroup Ltd AU Nippon Paint Holdings Co., Ltd JP 17/04/2019
15. 2,900 Minority stake 23% Japan Post Insurance Co., Ltd JP Investors 04/04/2019
16. 2,764 Capital Increase Toshiba Memory Holdings Corporation JP Development Bank of Japan Inc. JP 31/05/2019
17. 2,709 Acquisition 37% to 100% Hopewell Holdings Ltd HK Petrus HK Co Ltd HK 24/02/2019
18. 2,607 Capital increase 34%, to hold 46% Shengjing Bank Co., Ltd CN Future Capital Group Ltd; Evergrande Group (Nanchang) Co., Ltd; Zhengbo Holdings Ltd
VG; CN; VG 20/06/2019
19. 2,607 Acquisition 100% Beijing Ziguang Liansheng Technology Co., Ltd CN Unigroup Guoxin Microelectronics Co., Ltd CN 03/06/2019
20. 2,536 Acquisition 100% Xinjiang Production Construction Corps Eighth Division Tianshan Aluminum Industry Co., Ltd
CN Shimge Pump Industry Group Co., Ltd CN 27/03/2019

You are free to use any data or commentary from this report in your articles as long as the source is cited as “Zephyr published by Bureau van Dijk”
bvdinfo.com +44 161 838 9554 [email protected]
Global M&A Review H1 2019Asia-Pacific
Page 44 © Bureau van Dijk You are free to use any data or commentary from this report in your articles as long as the source is cited as “Zephyr published by BvD”
Target country by volume - Asia and Asia Pacific deals
Target country H1 2018 H2 2018 H1 2019
China 8,688 8,995 6,906
Japan 2,076 2,092 2,124
Australia 2,055 2,394 1,812
India 1,212 1,223 1,330
South Korea 1,388 1,423 1,221
Vietnam 673 922 868
Singapore 519 596 527
Taiwan 393 509 512
Malaysia 414 467 418
Indonesia 323 420 389
Hong Kong 361 394 269
Thailand 248 293 259
New Zealand 250 324 176
Kazakhstan 197 163 100
Sri Lanka 66 30 56
Philippines 44 59 50
Pakistan 79 65 42
Myanmar/Burma 9 20 31
Bangladesh 34 45 29
Samoa 28 28 16
Target country by value - Asia and Asia Pacific deals
Target country H1 2018 (mil USD)
H2 2018 (mil USD)
H1 2019 (mil USD)
China 410,415 397,877 288,095
India 66,003 54,041 75,855
South Korea 48,154 51,201 41,962
Japan 43,119 58,336 41,530
Australia 52,523 78,889 38,389
Singapore 32,708 16,980 23,820
Taiwan 17,811 15,135 16,628
Hong Kong 21,812 25,210 14,236
Indonesia 8,362 14,981 11,767
Vietnam 8,217 9,729 9,491
Thailand 11,498 4,856 9,450
Malaysia 8,721 8,790 6,585
New Zealand 6,503 10,338 5,781
Kazakhstan 1,175 3,520 4,466
Philippines 3,729 2,569 1,057
Pakistan 1,008 3,180 320
Sri Lanka 821 225 269
Bangladesh 300 6,269 230
Myanmar/Burma 44 309 197
Samoa 486 305 186

You are free to use any data or commentary from this report in your articles as long as the source is cited as “Zephyr published by Bureau van Dijk”
bvdinfo.com +44 161 838 9554 [email protected]
Global M&A Review H1 2019Asia-Pacific
Page 45 © Bureau van Dijk
Target sector by volume - Asia and Asia Pacific deals
Target sector H1 2018 H2 2018 H1 2019
Other services 6,920 7,349 6,303
Machinery, equipment, furniture, recycling 2,801 2,950 2,505
Chemicals, rubber, plastics 1,396 1,606 1,310
Wholesale & retail trade 1,288 1,432 1,113
Publishing, printing 1,149 1,076 884
Construction 1,079 1,149 846
Metals & metal products 955 1,006 819
Primary sector 520 561 455
Food, beverages, tobacco 436 454 377
Gas, water, electricity 372 431 349
Transport 292 390 344
Education, health 412 395 331
Hotels & restaurants 225 273 272
Textiles, wearing apparel, leather 183 272 197
Banks 192 226 171
Insurance companies 146 187 112
Wood, cork, paper 132 153 99
Post and telecommunications 82 111 90
Public administration and defence 9 6 9
Target sector by value - Asia and Asia Pacific deals
Target sector H1 2018 (mil USD)
H2 2018 (mil USD)
H1 2019 (mil USD)
Other services 235,737 208,665 177,167
Machinery, equipment, furniture, recycling 107,811 97,944 82,118
Construction 57,162 65,262 50,588
Chemicals, rubber, plastics 65,461 74,916 48,915
Banks 60,056 78,333 41,455
Metals & metal products 26,169 37,173 27,180
Wholesale & retail trade 29,649 24,800 26,638
Food, beverages, tobacco 11,566 19,049 17,148
Transport 20,353 19,587 16,897
Post and telecommunications 4,725 12,022 15,417
Publishing, printing 22,946 27,774 13,074
Gas, water, electricity 21,925 21,399 12,762
Insurance companies 24,993 16,187 10,444
Education, health 11,997 9,507 7,986
Primary sector 15,592 19,392 7,619
Hotels & restaurants 4,449 5,380 3,939
Textiles, wearing apparel, leather 2,454 3,991 3,530
Wood, cork, paper 3,010 2,982 3,122
Public administration and defence 89 74 17

You are free to use any data or commentary from this report in your articles as long as the source is cited as “Zephyr published by Bureau van Dijk”
bvdinfo.com +44 161 838 9554 [email protected]
Global M&A Review H1 2019Asia-Pacific
Page 46 © Bureau van Dijk
Asia and Asia Pacific private equity deals by volume and value
Announced date No of deals Total deal value (mil USD)
H1 2019 2,382 85,401
H2 2018 2,824 106,567
H1 2018 2,840 100,074
H2 2017 2,661 124,751
H1 2017 2,431 81,977
H2 2016 2,674 56,264
H1 2016 2,449 60,316
H2 2015 2,788 57,920
H1 2015 2,296 52,839

You are free to use any data or commentary from this report in your articles as long as the source is cited as “Zephyr published by Bureau van Dijk”
bvdinfo.com +44 161 838 9554 [email protected]
Global M&A Review H1 2019Asia-Pacific
Page 47 © Bureau van Dijk
Asia and Asia Pacific private equity deals by volume and value
0
500
1,000
1,500
2,000
2,500
3,000
0
20,000
40,000
60,000
80,000
100,000
120,000
140,000
H1 2015 H2 2015 H1 2016 H2 2016 H1 2017 H2 2017 H1 2018 H2 2018 H1 2019
Dea
l val
ue (m
il U
SD
)
Total deal value (mil USD) Number of deals

You are free to use any data or commentary from this report in your articles as long as the source is cited as “Zephyr published by Bureau van Dijk”
bvdinfo.com +44 161 838 9554 [email protected]
Global M&A Review H1 2019Asia-Pacific
Page 48 © Bureau van Dijk
Top 20 Asia and Asia Pacific private equity deals by value
Deal value (mil USD) Deal type Target Target
country Fund Manager/General Partner Announced date
1. 15,000 Minority stake 37% Tzar Aerospace Research Labs Pvt Ltd IN Dreamvision Overseas Pte Ltd 14/05/2019
2. 3,050 IBO 100% Healthscope Ltd AU Brookfield Capital Partners Ltd 01/02/2019
3. 2,384 Capital Increase Shanxi Gas Group Co., Ltd CN China Development Bank Capital Corporation Ltd 20/02/2019
4. 2,299 Acquisition 100% Vodafone New Zealand Ltd NZ Brookfield Asset Management Inc. 14/04/2019
5. 1,806 Minority stake 45% GMR Airports Ltd IN SSG Capital Management Ltd 27/03/2019
6. 1,645 Acquisition 100% Navitas Ltd AU BGH Capital Pty Ltd 21/03/2019
7. 1,500 Minority stake and 17% Guazi.com Inc.; Gold Maodou Technology Development (Beijing) Co., Ltd CN; CN 28/02/2019
8. 1,476 Capital increase 78%, to hold 100% Hefei Zhongwen Jintai Semiconductor Investment Co., Ltd CN Shanghai Pengxin Asset Management Co., Ltd; Wuxi Guolian Industrial Investment Co., Ltd
14/02/2019
9. 1,340 IBO majority stake Dinghao Plaza CN Partners Group Holding AG 28/03/2019
10. 1,200 IBO 100% Linde Korea Co., Ltd KR IMM Private Equity Inc. 07/03/2019
11. 1,161 IBO 80% Lotte Card Co., Ltd KR MBK Partners HK Ltd 24/05/2019
12. 1,062 IBO 100% Sydney CBD Office Towers AU The Blackstone Group LP 27/06/2019
13. 1,000 IBO 100% AYUMI Pharmaceutical Corporation JP The Blackstone Group LP 15/03/2019
14. 1,000 IBO 100% Godiva Chocolatier Inc.'s retail and distribution business in Japan, New Zealand, South Korea and Australia; among other international assets
JP; NZ; KR; AU
MBK Partners HK Ltd 20/02/2019
15. 949 MBO 24% to 93% Geo-Young Corporation KR The Blackstone Group LP 29/04/2019
16. 868 IBO 100% Seoul Square KR ARA Korea Ltd 28/02/2019
17. 754 IBO 100% Aoyama Building JP Gaw Capital Advisors Ltd 04/04/2019
18. 750 Minority stake Megvii Technology Ltd CN Bank of China Group Investment Ltd; Macquarie Group Ltd; ICBC Asset Management (Global) Co., Ltd
08/05/2019
19. 744 Acquisition 25% to 100% DP World Australia (Holding) Pty Ltd AU Corsair Infrastructure Partners LP 22/01/2019
20. 678 Minority stake 9% SBI Life Insurance Co., Ltd IN Carlyle Group LP 01/03/2019

You are free to use any data or commentary from this report in your articles as long as the source is cited as “Zephyr published by Bureau van Dijk”
bvdinfo.com +44 161 838 9554 [email protected]
Global M&A Review H1 2019Asia-Pacific
Page 49 © Bureau van Dijk
Target country by volume - Asia and Asia Pacific private equity deals
Target country H1 2018 H2 2018 H1 2019
China 1,762 1,460 1,084
Japan 357 394 413
India 292 301 267
South Korea 127 246 252
Singapore 93 108 106
Australia 88 125 102
Indonesia 14 29 38
Malaysia 23 21 28
Hong Kong 28 44 21
Vietnam 19 25 20
New Zealand 11 24 17
Taiwan 12 14 9
Thailand 4 12 9
Philippines 4 1 6
Myanmar/Burma 2 8 5
Cambodia 0 2 3
Kazakhstan 2 2 2
Pakistan 0 1 2
Azerbaijan 0 0 1
Sri Lanka 0 1 1
Bangladesh 1 0 1
Brunei Darussalam 0 0 1
Target country by value - Asia and Asia Pacific private equity deals
Target country H1 2018 (mil USD)
H2 2018 (mil USD)
H1 2019 (mil USD)
China 70,973 47,986 32,731
India 4,816 12,638 24,263
South Korea 7,481 9,463 10,371
Australia 8,191 14,924 8,838
Japan 1,613 1,421 6,190
New Zealand 43 2,446 3,352
Singapore 1,557 8,604 2,032
Hong Kong 1,836 4,952 766
Indonesia 1,545 172 423
Malaysia 609 228 386
Taiwan 432 3,043 302
Vietnam 1,047 575 125
Philippines 67 215 37
Thailand 241 26 18
Myanmar/Burma 5 6 8
Pakistan 0 1 6
Cambodia 0 2 5
Sri Lanka 0 12 4
Bangladesh 30 0 4

You are free to use any data or commentary from this report in your articles as long as the source is cited as “Zephyr published by Bureau van Dijk”
bvdinfo.com +44 161 838 9554 [email protected]
Global M&A Review H1 2019Asia-Pacific
Page 50 © Bureau van Dijk
Target sectors by volume - Asia and Asia Pacific private equity deals
Target sector H1 2018 H2 2018 H1 2019
Other services 1,691 1,591 1,322
Publishing, printing 379 374 303
Machinery, equipment, furniture, recycling 284 299 295
Chemicals, rubber, plastics 65 98 92
Education, health 105 98 74
Wholesale & retail trade 79 98 69
Food, beverages, tobacco 34 38 46
Hotels & restaurants 39 36 31
Construction 23 26 18
Primary sector 19 12 15
Metals & metal products 17 22 14
Textiles, wearing apparel, leather 10 17 12
Insurance companies 12 8 8
Transport 9 18 8
Gas, water, electricity 11 21 7
Post and telecommunications 5 11 5
Wood, cork, paper 2 5 2
Public administration and defence 0 1 1
Banks 4 0 0
Target sectors by value - Asia and Asia Pacific private equity deals
Target sector H1 2018 (mil USD)
H2 2018 (mil USD)
H1 2019 (mil USD)
Other services 51,724 58,711 48,549
Machinery, equipment, furniture, recycling 20,193 7,512 8,443
Education, health 2,848 2,605 5,203
Chemicals, rubber, plastics 3,381 4,683 4,684
Wholesale & retail trade 1,522 2,571 4,084
Publishing, printing 7,233 16,451 2,904
Post and telecommunications 135 31 2,636
Food, beverages, tobacco 1,440 1,428 1,933
Transport 304 3,780 1,322
Insurance companies 129 1,083 1,217
Construction 3,921 1,517 1,009
Metals & metal products 437 1,366 754
Hotels & restaurants 630 401 577
Primary sector 2,977 577 238
Textiles, wearing apparel, leather 782 199 157
Gas, water, electricity 270 4,105 98
Public administration and defence 0 44 4
Wood, cork, paper 0 8 2
Banks 744 0 0

You are free to use any data or commentary from this report in your articles as long as the source is cited as “Zephyr published by Bureau van Dijk”
bvdinfo.com +44 161 838 9554 [email protected]
Global M&A Review H1 2019MENA
Page 51 © Bureau van Dijk
Value hits record high for MENA in H1 2019
The value of M&A targeting companies based in the Middle East and North Africa (MENA) surged in H1 2019 to the highest on record due to the announcement of the region’s largest-ever deal, which, at USD 69,100 million, was also the second-biggest globally in H1 2019.
In all, 220 MENA deals worth USD 97,627 million were announced over the six months, compared to 294 deals totalling USD 19,959 million in H2 2018. This underscores the fact that value was driven by individual deals with high values, rather than by prolific dealmaking, especially considering volume was at the lowest level recorded since H2 2004 (95 deals) and represents the sixth consecutive half-yearly decline.
MENA deals by volume and value
Announced date No of deals Total deal value (mil USD)
H1 2019 220 97,627
H2 2018 294 19,959
H1 2018 307 19,388
H2 2017 315 19,567
H1 2017 324 18,638
H2 2016 352 34,006
H1 2016 375 25,000
H2 2015 364 13,016
H1 2015 339 11,262

You are free to use any data or commentary from this report in your articles as long as the source is cited as “Zephyr published by Bureau van Dijk”
bvdinfo.com +44 161 838 9554 [email protected]
Global M&A Review H1 2019MENA
Page 52 © Bureau van Dijk
MENA deals by volume and value
0
50
100
150
200
250
300
350
400
0
20,000
40,000
60,000
80,000
100,000
120,000
H1 2015 H2 2015 H1 2016 H2 2016 H1 2017 H2 2017 H1 2018 H2 2018 H1 2019
Dea
l val
ue (m
il U
SD
)
Total deal value (mil USD) Number of deals

You are free to use any data or commentary from this report in your articles as long as the source is cited as “Zephyr published by Bureau van Dijk”
bvdinfo.com +44 161 838 9554 [email protected]
Global M&A Review H1 2019MENA
Page 53 © Bureau van Dijk
Saudi Arabian deal drives value for MENA
Out of the top 20 recorded deals in H1 2019, only one deal surpassed USD 50,000 million. This deal involved Saudi Arabia’s Saudi Arabian Oil agreeing to buy a 70 per cent stake in fertilisers and organic basic chemicals manufacturer Saudi Basic Industries for USD 69,100 million. The deal accounted for 71 per cent of total MENA value in H1 2019 and was also the second-largest deal signed off gloablly in the opening six months of 2019.
Although no other M&A deal came close to matching the largest of H1, the remaining five of the top six deals exceeded USD 1,000 million. The second-largest saw Kuwait Finance House agree to purchase Bahrain-based Ahli United Bank for USD 6,724 million.
International investors featured in the top deals for MENA in H1 2019, as Italy’s Eni and Austria-based OMV agreed to acquire a 35 per cent stake in Abu Dhabi Oil Refining for USD 5,800 million, in the third-largest deal to have been announced during the six months under review.
Oil and gas companies featured prominently in H1 2019, as other targets included Brooge Petroleum and Gas Investment and Saudi Aramco Shell Refinery Company.
Egypt and Saudi Arabia top volume and value in H1 2019
Egypt led the way by volume for MENA target countries in H1 2019 with 55 deals, a decline from 80 deals in H2 2018 and 72 in H1 2018. Similarly, the volume of deals targeting the UAE was also down over the half-yearly period, as 66 deals were recorded in H2 2018, compared to 51 in H1 2019. Other countries included Saudi Arabia (34), Kuwait (28) and Jordan (17).
Predictably, given the Saudi Basic Industries deal, Saudi Arabia topped the list for MENA target countries in terms of value with USD 70,875 million, which represented the third consecutive half-yearly increase (H1 2018: USD 2,719 million; H2 2018: USD 8,312 million). The next target country was the UAE with USD 16,441 million-worth of deals, up from USD 5,470 million in H2 2018 and USD 9,985 million in H1 2018.
MENA PE value and volume increases in H1 2019
The volume of PE and VC investment in MENA increased in H1 2019 to 41 deals, from 36 deals in H2 2018. However, volume was slightly down year-on-year (H1 2018: 48 deals).
PE and VC value also increased in H1 2019 to USD 1,156 million, from USD 1,277 million in H2 2018 and reresents the highest value recorded since H2 2017 (USD 2,885 million).
Value was largely driven by two deals worth over USD 300 million in H1 2019. The largest of these involved Ripplewood Holdings, via Olayan Saudi Investment and RAM Holdings, agreeing to buy a 5 per cent stake in Saudi Arabia’s Banque Saudi Fransi for USD 496 million.
The second-largest deal of H1 saw Shuaa Capital agreeing to take over Abu Dhabi Financial in a reverse merger aimed at creating a regional financial services powerhouse with some USD 12,800 million in assets under management.
The top 20 deals featured investments in a variety of different industries, including digital technology, which saw companies such as Sary and Alifca targeted, to name but a few.
Construction leads sector rankings by volume
Construction topped the sector rankings in terms of volume for H1 2019, with 18 deals, a slight decline from the 19 deals recorded in H2 2018. Chemicals, rubber and plastics headed the list in terms of value with USD 75,869 million, a significant increase on H2 2018 (USD 2,197 million).
The banking sector placed second by value as the USD 13,423 million recorded over the six months was supported by deals for Union National Bank, Banque Saudi Fransi, Gulf Bank, Boubyan Bank, Ithmaar Holding and Al Hilal Bank.

You are free to use any data or commentary from this report in your articles as long as the source is cited as “Zephyr published by Bureau van Dijk”
bvdinfo.com +44 161 838 9554 [email protected]
Global M&A Review H1 2019MENA
Page 54 © Bureau van Dijk
Top 20 MENA deals by value
Deal value (mil USD) Deal type Target Target
country Acquiror Acquiror country
Announced date
1. 69,100 Acquisition 70% Saudi Basic Industries Corporation SJSC SA Saudi Arabian Oil Company SA 27/03/2019
2. 6,724 Acquisition 100% Ahli United Bank BSC BH Kuwait Finance House KSC KW 24/01/2019
3. 5,800 Minority stake 35% Abu Dhabi Oil Refining Company AE Eni SpA; OMV AG IT; AT 27/01/2019
4. 3,987 Acquisition 100% Union National Bank AE Abu Dhabi Commercial Bank AE 29/01/2019
5. 3,100 Acquisition 100% Careem Networks FZ LLC AE Uber Technologies Inc. US 26/03/2019
6. 1,006 Acquisition 100% Brooge Petroleum and Gas Investment Company FZC AE Twelve Seas Investment Company GB 15/04/2019
7. 635 Minority stake 10% Emirates Integrated Telecommunications Company PJSC AE Emirates Investment Authority AE 13/06/2019
8. 631 Acquisition 50% to 100% Saudi Aramco Shell Refinery Company SA Saudi Arabian Oil Company SA 21/04/2019
9. 496 Minority stake 5% Banque Saudi Fransi SA Olayan Saudi Investment Company; RAM Holdings I Ltd SA; AE 15/03/2019
10. 467 Minority stake 17% to 33% Gulf Bank KSC KW Alghanim Trading Co SPC KW 31/01/2019
11. 433 Capital Increase 13% Boubyan Bank KSC KW 20/02/2019
12. 400 Capital Increase Utico FZC AE Majis Industrial Services SAOC OM 15/01/2019
13. 380 Acquisition 100% Abu Dhabi Financial Group LLC AE Shuaa Capital PSC AE 26/06/2019
14. 313 Capital Increase 23% Kuwait Projects Company Holding KSCP KW 31/01/2019
15. 300 Capital Increase 35% Ithmaar Holding BSC BH Undisclosed shareholder 17/03/2019
16. 300 Minority stake 3% ADNOC Oil Pipelines – Sole Proprietorship LLC AE Abu Dhabi Retirement Pensions and Benefits Fund AE 14/04/2019
17. 286 Acquisition 100% Al Hilal Bank PJSC AE Abu Dhabi Commercial Bank AE 29/01/2019
18. 262 Minority stake 7% to 17% Gulf Bank KSC KW Alghanim Trading Co SPC KW 31/01/2019
19. 188 Minority stake 6% Gulf Bank KSC KW Mr Omar Qutaiba Yusuf Ahmed El Ghanim 10/03/2019
20. 177 Minority stake 30% to 36% Qatar Gas Transport Company Ltd QA Qatar Shipping Company QSC QA 04/02/2019

You are free to use any data or commentary from this report in your articles as long as the source is cited as “Zephyr published by Bureau van Dijk”
bvdinfo.com +44 161 838 9554 [email protected]
Global M&A Review H1 2019MENA
Page 55 © Bureau van Dijk You are free to use any data or commentary from this report in your articles as long as the source is cited as “Zephyr published by BvD”
Target country by volume - MENA deals
Target country H1 2018 H2 2018 H1 2019
Egypt 72 80 55
UAE 87 66 51
Saudi Arabia 27 25 34
Kuwait 12 35 28
Jordan 33 33 17
Oman 23 22 16
Bahrain 4 5 7
Morocco 20 8 6
Iran 7 5 3
Qatar 3 3 2
Tunisia 10 5 1
Lebanon 6 3 1
Palestine 0 0 0
Syria 1 0 0
Yemen 0 0 0
Algeria 2 3 0
Iraq 0 1 0
Libya 1 0 0
Target country by value - MENA deals
Target country H1 2018 (mil USD)
H2 2018 (mil USD)
H1 2019 (mil USD)
Saudi Arabia 2,719 8,312 70,875
UAE 9,985 5,470 16,441
Bahrain 164 123 7,064
Kuwait 814 1,562 2,067
Egypt 1,889 2,210 507
Qatar 424 59 298
Morocco 1,450 190 161
Jordan 259 651 129
Oman 714 616 60
Iran 592 564 15
Tunisia 35 198 10
Palestine 0 0 0
Libya 450 0 0
Syria 0 0 0
Yemen 0 0 0
Algeria 0 0 0
Iraq 0 0 0
Lebanon 215 4 0

You are free to use any data or commentary from this report in your articles as long as the source is cited as “Zephyr published by Bureau van Dijk”
bvdinfo.com +44 161 838 9554 [email protected]
Global M&A Review H1 2019MENA
Page 56 © Bureau van Dijk
Target sector by volume - MENA deals
Target sector H1 2018 H2 2018 H1 2019
Other services 92 99 75
Construction 27 19 18
Banks 12 22 17
Chemicals, rubber, plastics 22 21 16
Wholesale & retail trade 18 15 13
Education, health 27 12 12
Machinery, equipment, furniture, recycling 12 13 11
Primary sector 10 19 10
Transport 13 6 10
Metals & metal products 9 7 8
Insurance companies 11 16 5
Post and telecommunications 7 5 5
Gas, water, electricity 8 6 3
Food, beverages, tobacco 16 10 3
Hotels & restaurants 9 4 3
Publishing, printing 6 6 2
Wood, cork, paper 2 1 2
Textiles, wearing apparel, leather 3 2 1
Public administration and defence 1 0 1
Target sector by value - MENA deals
Target sector H1 2018 (mil USD)
H2 2018 (mil USD)
H1 2019 (mil USD)
Chemicals, rubber, plastics 577 2,197 75,869
Banks 7,074 8,285 13,423
Other services 1,647 2,863 4,316
Wholesale & retail trade 131 573 1,231
Post and telecommunications 500 635 759
Construction 975 644 465
Gas, water, electricity 204 518 414
Primary sector 2,673 1,410 247
Education, health 715 175 233
Insurance companies 1,245 197 129
Food, beverages, tobacco 1,121 487 129
Machinery, equipment, furniture, recycling 167 166 107
Transport 630 47 82
Metals & metal products 441 220 51
Wood, cork, paper 5 83 10
Hotels & restaurants 264 756 1
Publishing, printing 2 179 1
Textiles, wearing apparel, leather 11 16 0
Public administration and defence 1,000 0 0

You are free to use any data or commentary from this report in your articles as long as the source is cited as “Zephyr published by Bureau van Dijk”
bvdinfo.com +44 161 838 9554 [email protected]
Global M&A Review H1 2019MENA
Page 57 © Bureau van Dijk
MENA private equity deals by volume and value
Announced date No of deals Total deal value (mil USD)
H1 2019 41 1,156
H2 2018 36 1,277
H1 2018 48 612
H2 2017 44 2,885
H1 2017 32 209
H2 2016 44 914
H1 2016 55 779
H2 2015 53 2,101
H1 2015 32 1,241

You are free to use any data or commentary from this report in your articles as long as the source is cited as “Zephyr published by Bureau van Dijk”
bvdinfo.com +44 161 838 9554 [email protected]
Global M&A Review H1 2019MENA
Page 58 © Bureau van Dijk
MENA private equity deals by volume and value
0
10
20
30
40
50
60
0
500
1,000
1,500
2,000
2,500
3,000
3,500
H1 2015 H2 2015 H1 2016 H2 2016 H1 2017 H2 2017 H1 2018 H2 2018 H1 2019
Dea
l val
ue (m
il U
SD
)
Total deal value (mil USD) Number of deals

You are free to use any data or commentary from this report in your articles as long as the source is cited as “Zephyr published by Bureau van Dijk”
bvdinfo.com +44 161 838 9554 [email protected]
Global M&A Review H1 2019MENA
Page 59 © Bureau van Dijk
Top 20 MENA private equity deals by value
Deal value (mil USD) Deal type Target Target
country Fund Manager/General Partner Announced date
1. 496 Minority stake 5% Banque Saudi Fransi SA Ripplewood Holdings LLC 15/03/2019
2. 380 Acquisition 100% Abu Dhabi Financial Group LLC AE 26/06/2019
3. 136 Minority stake Al-Muhaidib Dental Group SA 20/03/2019
4. 65 Minority stake Yellow Door Energy AE The International Finance Corporation; Arab Petroleum Investments Corporation; Adenium Energy Capital Ltd 28/01/2019
5. 30 Minority stake Alifca DMCC AE Endeavor Global Inc.; StonePine ACE Partners Ltd 08/04/2019
6. 10 Minority stake Jamalon Co Ltd JO 500 Startups Management Company LLC; Wamda Capital Partners Ltd; Endeavor Global Inc.; Anova Investments Co Ltd
19/03/2019
7. 8 Minority stake yallacompare FZ LLC AE Iris Capital Management SAS; Wamda Capital Partners Ltd 06/01/2019
8. 6 Minority stake Tenderd AE Dynamo VC Administradora de Recursos Ltda; Y Combinator Management LLC; BECO Capital Investments LLC; Global Founders Capital Management GmbH; Soma Capital LLC; Venture Souq
11/06/2019
9. 5 Minority stake Tarjama FZ LLC AE Anova Investments 18/03/2019
10. 3 Minority stake Cofe District KW The Arab Investment Company SAA; KISP Ventures; Cedar Mundi Ventures; Towell International Holding; Dividend Gate Capital BSC
13/02/2019
11. 3 Minority stake Sary SA 28/04/2019
12. 2 Minority stake Searchie and Searchie DMCC AE 29/04/2019
13. 2 Minority stake Nalbes Ltd KW 22/02/2019
14. 2 Minority stake InternsME DMCC AE Aloshban and Alnamlah Family Groups 07/04/2019
15. 2 Minority stake Red Sea Farms SA King Abdullah University of Science and Technology; RPD Innovations 15/05/2019
16. 2 Minority stake Interactive Gyms Company for Information Technology SA Saudi Aramco Entrepreneurship Center Company Ltd 12/02/2019
17. 1 Minority stake Zbooni DMCC AE Michel Chalhoub Trading Co. LLC; B&Y Venture Partners 19/06/2019
18. 1 Minority stake PointCheckout Holding Company Ltd AE 500 Startups Management Company LLC; Dubai Angel Investors Ltd; Hala Ventures 10/04/2019
19. 1 Minority stake Trella Ltd EG Global Venture Capital Inc.; Algebra Ventures 24/02/2019
20. 1 Minority stake Wimo FZCO AE Dubai Angel Investors Ltd 20/01/2019
21. 1 Minority stake Orcas Solutions Ltd EG Algebra Ventures; NFX Guild 20/01/2019

You are free to use any data or commentary from this report in your articles as long as the source is cited as “Zephyr published by Bureau van Dijk”
bvdinfo.com +44 161 838 9554 [email protected]
Global M&A Review H1 2019MENA
Page 60 © Bureau van Dijk
Target country by volume - MENA private equity deals
Target country H1 2018 H2 2018 H1 2019
UAE 22 20 18
Saudi Arabia 5 2 10
Egypt 9 6 7
Bahrain 0 0 3
Kuwait 0 2 2
Morocco 4 3 1
Jordan 4 2 1
Oman 0 0 0
Qatar 0 0 0
Palestine 0 0 0
Libya 0 0 0
Tunisia 2 0 0
Yemen 0 0 0
Algeria 0 0 0
Iran 0 0 0
Iraq 0 0 0
Lebanon 2 1 0
Syria 0 0 0
Target country by value - MENA private equity deals
Target country H1 2018 (mil USD)
H2 2018 (mil USD)
H1 2019 (mil USD)
Saudi Arabia 296 167 638
UAE 62 916 501
Jordan 3 25 10
Kuwait 0 2 5
Egypt 98 33 2
Palestine 0 0 0
Oman 0 0 0
Qatar 0 0 0
Libya 0 0 0
Morocco 93 130 0
Tunisia 0 0 0
Yemen 0 0 0
Algeria 0 0 0
Bahrain 0 0 0
Iraq 0 0 0
Lebanon 61 4 0
Iran 0 0 0
Syria 0 0 0

You are free to use any data or commentary from this report in your articles as long as the source is cited as “Zephyr published by Bureau van Dijk”
bvdinfo.com +44 161 838 9554 [email protected]
Global M&A Review H1 2019MENA
Page 61 © Bureau van Dijk
Target sectors by volume - MENA private equity deals
Target sector H1 2018 H2 2018 H1 2019
Other services 23 21 24
Wholesale & retail trade 7 3 5
Machinery, equipment, furniture, recycling 1 2 4
Education, health 3 2 3
Primary sector 0 1 2
Publishing, printing 3 4 2
Textiles, wearing apparel, leather 1 0 1
Banks 1 0 1
Metals & metal products 0 0 1
Hotels & restaurants 1 1 1
Insurance companies 1 0 0
Public administration and defence 0 0 0
Construction 3 1 0
Food, beverages, tobacco 0 0 0
Wood, cork, paper 0 0 0
Gas, water, electricity 3 0 0
Chemicals, rubber, plastics 0 0 0
Post and telecommunications 0 0 0
Transport 0 0 0
Target sectors by value - MENA private equity deals
Target sector H1 2018 (mil USD)
H2 2018 (mil USD)
H1 2019 (mil USD)
Banks 60 0 496
Other services 337 879 413
Education, health 56 2 136
Machinery, equipment, furniture, recycling 2 130 65
Wholesale & retail trade 41 31 43
Publishing, printing 0 29 1
Transport 0 0 0
Insurance companies 18 0 0
Post and telecommunications 0 0 0
Public administration and defence 0 0 0
Primary sector 0 88 0
Hotels & restaurants 2 17 0
Wood, cork, paper 0 0 0
Textiles, wearing apparel, leather 0 0 0
Food, beverages, tobacco 0 0 0
Chemicals, rubber, plastics 0 0 0
Construction 76 101 0
Gas, water, electricity 19 0 0
Metals & metal products 0 0 0

You are free to use any data or commentary from this report in your articles as long as the source is cited as “Zephyr published by Bureau van Dijk”
bvdinfo.com +44 161 838 9554 [email protected]
Global M&A Review H1 2019CEE/Russia
Page 62 © Bureau van Dijk
CEE volume and value decline in H1 2019
The volume and value of M&A deals targeting companies based in Central and Eastern Europe (CEE) declined in the first half of 2019 as 2,273 deals worth a combined USD 57,730 million were announced during the six months. The result represents a drop from the 3,177 deals worth USD 78,483 million signed off during H2 2018, while it is also down from H1 2018’s 4,655 deals worth USD 68,505 million.
In terms of value, the result represents the lowest showing since H1 2017’s USD 45,140 million, while the last time volume plumbed such depths was in H1 2005 (2,210).
The disappointing result can be partially attributed to a dearth of high value deals in the region as no single deal exceeded USD 10,000 million during the six months under review. The largest of all was worth USD 9,085 million and it was one of only two worth in excess of USD 5,000 million.
Russia/CEE deals by volume and value
Announced date No of deals Total deal value (mil USD)
H1 2019 2,273 57,730
H2 2018 3,177 78,483
H1 2018 4,655 68,505
H2 2017 4,649 62,831
H1 2017 4,793 45,140
H2 2016 4,326 91,285
H1 2016 5,249 44,708
H2 2015 4,512 87,120
H1 2015 4,853 56,926

You are free to use any data or commentary from this report in your articles as long as the source is cited as “Zephyr published by Bureau van Dijk”
bvdinfo.com +44 161 838 9554 [email protected]
Global M&A Review H1 2019CEE/Russia
Page 63 © Bureau van Dijk
Russia/CEE deals by volume and value
0
1,000
2,000
3,000
4,000
5,000
6,000
0
10,000
20,000
30,000
40,000
50,000
60,000
70,000
80,000
90,000
100,000
H1 2015 H2 2015 H1 2016 H2 2016 H1 2017 H2 2017 H1 2018 H2 2018 H1 2019
Dea
l val
ue (m
il U
SD
)
Total deal value (mil USD) Number of deals

You are free to use any data or commentary from this report in your articles as long as the source is cited as “Zephyr published by Bureau van Dijk”
bvdinfo.com +44 161 838 9554 [email protected]
Global M&A Review H1 2019CEE/Russia
Page 64 © Bureau van Dijk
Russian company targeted in top deal
The largest deal to have been announced in the CEE region in the first half of 2019 was worth USD 9,085 million and involved Aktivium Holding picking up a 28 per cent stake in Gorno-Metallurgicheskaya Kompaniya Norilskii Nikel.
This was followed by a USD 7,604 million private placing of stock by Russia-based Atomnyi Energopromyshlennyi Kompleks to Gosudarstvennaya Korporatsiya po Atomnoi Energii Rosatom. No other deal surpassed USD 5,000 million during the six months, although 11 were worth in excess of USD 1,000 million.
The largest deal with a non-Russian target placed fifth overall as Allianz Capital Partners and Macquarie Infrastructure and Real Assets Europe agreed to increase their combined stake in Czech Republic-based Innogy Grid Holding from 50 per cent to 100 per cent for USD 2,007 million.
Russia tops country rankings by volume and value
Given that Russian companies were targeted in 15 of the top 20 deals announced in H1 2019, including all of the top four, it is unsurprising to see the country lead the way by both volume and value in the first half of the year. In all, Russian companies were targeted in 796 deals worth an aggregate USD 43,732 million.
In terms of volume, this placed it ahead of second-placed Poland (775 deals), while Romania was some way behind in third with 283.
The distance between first and second was much greater by value as second-placed Poland was targeted in deals worth a combined USD 3,567 million. Czech Republic and Bulgaria came next, with USD 2,902 million and USD 2,704 million, respectively. Only one other country broke the USD 1,000 million-barrier as Hungary attracted value of USD 1,082 million.
CEE PE and VC value climbs in H1, despite volume declining
There were 122 PE and VC deals worth a combined USD 4,558 million targeting CEE companies announced in H1 2019. In terms of volume, this represents a decline on the 197 deals announced in H2 2018. Despite this, value actually increased over the same timeframe, climbing 58 per cent from USD 2,878 million.
The result was boosted considerably by a single deal – the aforementioned USD 2,007 million buyout in which Allianz and Macquarie upped their combined holding in Innogy Grid Holding from 50 per cent to 100 per cent. This deal alone accounted for 44 per cent of total PE and VC value during the period under review.
One other PE and VC deal announced in H1 was worth over USD 1,000 million as multiple investors, including IFM Investors and Polski Fundusz Rozwoju, paid USD 1,700 million to acquire Polish container terminal operator DCT Gdansk.

You are free to use any data or commentary from this report in your articles as long as the source is cited as “Zephyr published by Bureau van Dijk”
bvdinfo.com +44 161 838 9554 [email protected]
Global M&A Review H1 2019CEE/Russia
Page 65 © Bureau van Dijk
Top 20 Russia/CEE deals by value
Deal value (mil USD) Deal type Target Target
country Acquiror Acquiror country
Announced date
1. 9,085 Minority stake 28% Gorno-Metallurgicheskaya Kompaniya Norilskii Nikel PAO RU Aktivium Holding BV NL 31/01/2019
2. 7,604 Capital Increase Atomnyi Energopromyshlennyi Kompleks AO RU Gosudarstvennaya Korporatsiya po Atomnoi Energii Rosatom RU 12/02/2019
3. 4,187 Minority stake 3% Novolipetskii Metallurgicheskii Kombinat PAO RU Goldman Sachs International GB 27/06/2019
4. 2,550 Minority stake 10% Arktik SPG 2 OOO RU Total SA FR 05/03/2019
5. 2,007 IBO 50% to 100% Innogy Grid Holding AS CZ Allianz Capital Partners GmbH; Macquarie Infrastructure and Real Assets (Europe) Ltd DE; GB 29/04/2019
6. 1,882 Minority stake Petroleo Brasileiro SA BG 10/06/2019
7. 1,700 Acquisition 100% DCT Gdansk SA PL PSA International Pte Ltd; IFM Global Infrastructure Fund; Polski Fundusz Rozwoju SA SG; GB; PL 19/03/2019
8. 1,288 Acquisition 84% Raspadskaya PAO RU Evraz plc GB 22/04/2019
9. 1,168 Minority stake 19% MegaFon PAO RU 05/03/2019
10. 1,160 Acquisition 71% to 99% KEKh eKommerts OOO RU OLX BV NL 25/01/2019
11. 1,005 Acquisition 50% Novorossiiskii Morskoi Torgovyi Port PAO RU 21/01/2019
12. 706 Acquisition 86% to 97% Tomskaya Energosbytovaya Kompaniya PAO RU Inter RAO EES PAO RU 20/02/2019
13. 704 Acquisition 75% to 100% Sazka Group AS CZ KKCG AS CZ 14/03/2019
14. 612 Acquisition to 100% Bank Dom.Rf AO RU Dom.RF AO RU 04/06/2019
15. 574 Acquisition 100% Abanka dd SI Nova Kreditna Banka Maribor dd SI 20/06/2019
16. 556 Acquisition to 100% Renova OOO RU Mr Viktor Vekselberg RU 20/03/2019
17. 551 Minority stake 2% Gorno-Metallurgicheskaya Kompaniya Norilskii Nikel PAO RU Investors US 13/03/2019
18. 530 Acquisition 87% to 100% Uralkalii PAO RU Rinsoco Trading Co Ltd CY 02/04/2019
19. 528 Capital Increase 2% Rossiiskie Zheleznye Dorogi OAO RU 31/01/2019
20. 512 Acquisition 100% Nitrokhimprom OOO RU Sibirskaya Ugolnaya Energeticheskaya Kompaniya AO RU 05/04/2019

You are free to use any data or commentary from this report in your articles as long as the source is cited as “Zephyr published by Bureau van Dijk”
bvdinfo.com +44 161 838 9554 [email protected]
Global M&A Review H1 2019CEE/Russia
Page 66 © Bureau van Dijk
Target country by volume - Russia/CEE deals
Target country H1 2018 H2 2018 H1 2019
Russia 953 905 796
Poland 1,578 1,020 775
Romania 268 303 283
Estonia 138 102 83
Czech Republic 569 191 58
Ukraine 485 202 57
Hungary 118 85 53
Bosnia 49 48 45
Serbia 60 49 45
Bulgaria 64 80 27
Latvia 129 30 9
Croatia 56 33 8
Belarus 79 25 8
Macedonia 11 6 7
Slovenia 30 34 6
Slovakia 23 13 5
Moldova 30 29 5
Lithuania 21 19 3
Montenegro 7 4 2
Albania 5 8 2
Kosovo 2 1 0
Target country by value - Russia/CEE deals
Target country H1 2018 (mil USD)
H2 2018 (mil USD)
H1 2019 (mil USD)
Russia 27,821 58,424 43,732
Poland 5,939 8,818 3,567
Czech Republic 24,750 295 2,902
Bulgaria 3,767 3,867 2,704
Hungary 24,602 1,048 1,082
Romania 22,297 1,938 901
Slovenia 624 554 835
Latvia 273 382 541
Estonia 1,101 48 487
Serbia 3,491 846 338
Ukraine 3,191 450 209
Moldova 19 29 107
Bosnia 85 24 103
Belarus 44 137 82
Macedonia 47 3 67
Montenegro 3,323 242 50
Croatia 659 177 17
Slovakia 870 178 5
Lithuania 342 1,221 0
Kosovo 18 0 0
Albania 34 185 0

You are free to use any data or commentary from this report in your articles as long as the source is cited as “Zephyr published by Bureau van Dijk”
bvdinfo.com +44 161 838 9554 [email protected]
Global M&A Review H1 2019CEE/Russia
Page 67 © Bureau van Dijk
Target sector by volume - Russia/CEE deals
Target sector H1 2018 H2 2018 H1 2019
Other services 1,394 1,019 629
Banks 190 193 241
Wholesale & retail trade 422 272 217
Machinery, equipment, furniture, recycling 281 234 147
Primary sector 181 171 131
Chemicals, rubber, plastics 144 118 86
Gas, water, electricity 108 99 85
Construction 189 110 82
Publishing, printing 117 108 82
Post and telecommunications 34 33 73
Metals & metal products 114 99 71
Food, beverages, tobacco 143 107 64
Transport 109 72 57
Education, health 82 41 37
Hotels & restaurants 98 69 37
Textiles, wearing apparel, leather 34 24 19
Insurance companies 53 30 17
Wood, cork, paper 38 37 14
Public administration and defence 1 0 0
Target sector by value - Russia/CEE deals
Target sector H1 2018 (mil USD)
H2 2018 (mil USD)
H1 2019 (mil USD)
Metals & metal products 3,112 2,026 15,482
Gas, water, electricity 4,804 4,824 11,288
Primary sector 1,162 43,112 7,068
Other services 27,707 9,436 6,069
Banks 5,797 6,151 4,139
Transport 1,064 941 3,617
Wholesale & retail trade 5,548 2,595 2,936
Machinery, equipment, furniture, recycling 4,609 2,336 2,125
Chemicals, rubber, plastics 4,169 715 1,771
Post and telecommunications 24,110 1,867 1,447
Hotels & restaurants 656 381 761
Food, beverages, tobacco 4,493 1,354 751
Construction 1,274 805 249
Education, health 46 89 115
Textiles, wearing apparel, leather 8 61 51
Publishing, printing 239 102 37
Wood, cork, paper 119 187 10
Insurance companies 319 324 4
Public administration and defence 0 0 0

You are free to use any data or commentary from this report in your articles as long as the source is cited as “Zephyr published by Bureau van Dijk”
bvdinfo.com +44 161 838 9554 [email protected]
Global M&A Review H1 2019CEE/Russia
Page 68 © Bureau van Dijk
Russia/CEE private equity deals by volume and value
Announced date No of deals Total deal value (mil USD)
H1 2019 122 4,558
H2 2018 197 2,878
H1 2018 242 6,952
H2 2017 256 2,945
H1 2017 229 7,039
H2 2016 262 4,293
H1 2016 233 2,286
H2 2015 240 8,552
H1 2015 288 1,618

You are free to use any data or commentary from this report in your articles as long as the source is cited as “Zephyr published by Bureau van Dijk”
bvdinfo.com +44 161 838 9554 [email protected]
Global M&A Review H1 2019CEE/Russia
Page 69 © Bureau van Dijk
Russia/CEE private equity deals by volume and value
0
50
100
150
200
250
300
350
0
1,000
2,000
3,000
4,000
5,000
6,000
7,000
8,000
9,000
H1 2015 H2 2015 H1 2016 H2 2016 H1 2017 H2 2017 H1 2018 H2 2018 H1 2019
Dea
l val
ue (m
il U
SD
)
Total deal value (mil USD) Number of deals

You are free to use any data or commentary from this report in your articles as long as the source is cited as “Zephyr published by Bureau van Dijk”
bvdinfo.com +44 161 838 9554 [email protected]
Global M&A Review H1 2019CEE/Russia
Page 70 © Bureau van Dijk You are free to use any data or commentary from this report in your articles as long as the source is cited as “Zephyr published by BvD”
Top 20 Russia/CEE private equity deals by value
Deal value (mil USD) Deal type Target Target
country Fund Manager/General Partner Announced date
1. 2,007 IBO 50% to 100% Innogy Grid Holding AS CZ Allianz Capital Partners GmbH; Macquarie Infrastructure and Real Assets (Europe) Ltd 29/04/2019
2. 1,700 Acquisition 100% DCT Gdansk SA PL IFM Investors Pty Ltd; Polski Fundusz Rozwoju SA 19/03/2019
3. 490 IBO 100% Protokon Manufacturing Developing and Trading LLC, among other international assets
HU KPS Capital Partners LP 06/05/2019
4. 126 IBO 51% Kiwi.com SRO CZ General Atlantic Service Company LP 03/06/2019
5. 50 Minority stake 10% Upravlyayushchaya Kompaniya Intergeo OOO RU RCIF Asset Management Ltd 14/03/2019
6. 40 IBO 63% to 91% ABC Data SA PL MCI Capital Towarzystwo Funduszy Inwestycyjnych SA 05/03/2019
7. 20 Minority stake Bitrise Inc. HU 12/06/2019
8. 16 Minority stake Twisto Payments AS CZ Velocity Capital BV; Finch Capital Partners BV 09/05/2019
9. 15 Minority stake Vili OOO RU Concentric Team LLP; ADRU 26/04/2019
10. 10 Minority stake Karrensi Kom Bel OOO BY VP Capital; Larnabel Ventures OOO 15/01/2019
11. 10 Minority stake Packhelp Sp zoo PL White Star Capital LP; PROfounders Capital Partners LLP; Market One Capital; SpeedInvest GmbH 18/03/2019
12. 8 Minority stake Instamart OOO RU 01/04/2019
13. 6 Minority stake Codecool Kft HU PortfoLion Kockazati Tokealap-kezelo Zrt; Lead Ventures Alapkezelo Zrt 21/02/2019
14. 6 Minority stake SDA Sp zoo PL ARIA Fund SA 06/03/2019
15. 5 Minority stake 13% Nauchno-Proizvodstvennyi Innovatsionnyi Vnedrencheskii Tsentr OOO
RU Rossiiskaya Venchurnaya Kompaniya AO 11/02/2019
16. 4 Minority stake Roistat RU iTech Capital; Skolkovo-Venchurnye Investitsii OOO 04/02/2019
17. 4 Minority stake Custom Sp zoo PL TDJ-Pitango Ventures Advisory Sp zoo 23/01/2019
18. 4 Minority stake Infermedica Sp zoo PL DreamIt Ventures LLC; Inovo Sp zoo; Karma Ventures OU 05/06/2019
19. 3 Minority stake 30% Sidorin Lab OOO RU 07/03/2019
20. 3 Minority stake Brend Kvad OOO RU Avtonomnaya Nekommercheskaya Organizatsiya Agentstvo Strategicheskhikh Initsiativ po Prodvizheniyu Novykh Proektov
01/03/2019

You are free to use any data or commentary from this report in your articles as long as the source is cited as “Zephyr published by Bureau van Dijk”
bvdinfo.com +44 161 838 9554 [email protected]
Global M&A Review H1 2019CEE/Russia
Page 71 © Bureau van Dijk
Target country by volume - Russia/CEE private equity deals
Target country H1 2018 H2 2018 H1 2019
Hungary 69 52 47
Russian Federation 108 69 34
Poland 27 32 24
Czech Republic 8 9 5
Romania 5 4 3
Belarus 1 3 2
Estonia 6 9 2
Croatia 2 1 2
Serbia 4 0 1
Slovakia 1 0 1
Ukraine 3 3 1
Macedonia 0 0 0
Lithuania 5 3 0
Montenegro 2 0 0
Moldova 0 1 0
Slovenia 0 1 0
Albania 1 0 0
Bosnia and Herzegovina 0 0 0
Bulgaria 2 9 0
Latvia 2 1 0
Kosovo 0 0 0
Target country by value - Russia/CEE private equity deals
Target country H1 2018 (mil USD)
H2 2018 (mil USD)
H1 2019 (mil USD)
Czech Republic 2,200 3 2,149
Poland 520 1,017 1,769
Hungary 3,345 23 524
Russia 142 123 101
Belarus 2 12 10
Romania 37 494 3
Slovakia 0 0 2
Estonia 484 38 0
Ukraine 0 0 0
Serbia 3,286 0 0
Lithuania 3 1,137 0
Macedonia 0 0 0
Montenegro 3,286 0 0
Moldova 0 27 0
Slovenia 0 0 0
Croatia 0 0 0
Albania 0 0 0
Bosnia 0 0 0
Bulgaria 3,502 4 0
Latvia 2 0 0
Kosovo 0 0 0

You are free to use any data or commentary from this report in your articles as long as the source is cited as “Zephyr published by Bureau van Dijk”
bvdinfo.com +44 161 838 9554 [email protected]
Global M&A Review H1 2019CEE/Russia
Page 72 © Bureau van Dijk
Target sectors by volume - Russia/CEE private equity deals
Target sector H1 2018 H2 2018 H1 2019
Other services 145 112 64
Publishing, printing 27 23 21
Machinery, equipment, furniture, recycling 22 14 9
Wholesale & retail trade 10 11 5
Chemicals, rubber, plastics 3 1 4
Food, beverages, tobacco 4 4 4
Education, health 3 6 3
Metals & metal products 3 1 3
Wood, cork, paper 4 2 1
Hotels & restaurants 0 0 1
Transport 1 1 1
Textiles, wearing apparel, leather 1 1 1
Gas, water, electricity 4 2 1
Primary sector 2 3 0
Insurance companies 0 3 0
Construction 1 1 0
Post and telecommunications 3 2 0
Banks 1 4 0
Public administration and defence 0 0 0
Target sectors by value - Russia/CEE private equity deals
Target sector H1 2018 (mil USD)
H2 2018 (mil USD)
H1 2019 (mil USD)
Gas, water, electricity 270 0 2,007
Transport 35 1 1,700
Machinery, equipment, furniture, recycling 10 7 493
Other services 671 1,254 262
Wholesale & retail trade 88 19 42
Publishing, printing 186 19 12
Education, health 0 6 11
Wood, cork, paper 2 0 10
Metals & metal products 60 0 1
Chemicals, rubber, plastics 2,200 20 0
Food, beverages, tobacco 0 12 0
Textiles, wearing apparel, leather 0 0 0
Insurance companies 0 0 0
Primary sector 0 0 0
Hotels & restaurants 0 0 0
Construction 0 346 0
Banks 0 1,164 0
Post and telecommunications 3,429 28 0
Public administration and defence 0 0 0

Zephyr Half Year M&A Report
Notes to editors
Activity is based on the activity of the target company.
Deal status is announced within the time period.
The sector breakdown uses targets’ activities as defined to be ‘Major Sectors’ by Zephyr.
The date range for H1 2019 is deals announced between 01/01/2019 - 30/06/2019 inclusive.
The Western Europe region covers target companies in Andorra, Austria, Belgium, Cyprus, Denmark, Finland, France, Germany, Gibraltar, Greece, Iceland, Ireland, Italy, Liechtenstein, Luxembourg, Malta, Monaco, Netherlands, Norway, Portugal, San Marino, Spain, Sweden, Switzerland, Turkey and the UK.
The Asia and Asia Pacific region covers target companies based in the Far East, Southeast Asia, Central Asia and Oceania.
The MENA region covers target companies in Algeria, Bahrain, Egypt, Iran, Iraq, Kuwait, Jordan, Lebanon, Libyan Arab Jamahiriya, Morocco, Oman, Palestinian Territory, Qatar, Saudi Arabia, Syrian Arab Republic, Tunisia, UAE and Yemen. It excludes Israel.
The Russia/CEE region covers target companies in Albania, Belarus, Bosnia and Herzegovina, Bulgaria, Croatia, Czech Republic, Estonia, Hungary, Kosovo, Latvia, Lithuania, Macedonia, Moldova, Montenegro, Poland, Romania, Russia, Serbia, Slovakia, Slovenia and Ukraine.
Advisor league tables are based on advisors advising any party in the deal i.e. acquiror, target or vendor.
Where deals have multiple targets the sector and region of each target is represented in the data.
All deal types are included except joint ventures, IPOs, planned IPOs and share buybacks.

Bureau van Dijk – A Moody’s Analytics Company
Bureau van Dijk is a leading provider of company information and delivers the richest, most reliable private company, corporate ownership and deal
information in the market via its Orbis database. Orbis currently covers approaching 300 million companies across the globe. Bureau van Dijk also
researches M&A deals and publishes the M&A research solutions Zephyr and M&A Research Catalyst.
Bureau van Dijk’s product range combines data from regulatory and other sources, including 160 information partners, with flexible software to allow
users to manipulate data for a range of research needs and applications.
Bureau van Dijk became a Moody’s Analytics company in August 2017.
Zephyr – the most comprehensive deal database
Zephyr is an information solution containing M&A, IPO and venture capital deals and rumours with links to detailed financial company information. Zephyr
is the recipient of numerous recent M&A industry awards, including Best Global M&A Database 2016 at the Acquisition International M&A Awards. The
deals on Zephyr are linked to the company financials and peer reports on Bureau van Dijk’s company databases. Zephyr contains information on more
than 1.9 million deals.
Orbis – powering the business of certainty
The world’s most powerful comparable data resource on private companies, Bureau van Dijk’s Orbis database provides information on more than 310
million companies across the globe, over 99% of them private. Orbis combines information from regulatory and other sources, and delivers company
information with added value. Its users can: research individual companies or groups of companies; search for companies by profile; analyse and
evaluate companies; and make better-informed decisions.
M&A Research Catalyst – combining deal and company data
Drawing data from Bureau van Dijk’s extensive company database, Orbis, and its M&A database, Zephyr, M&A Research Catalyst delivers clear and
easy-to-interpret reports specifically created for M&A research. These combine information on companies, comparable deals and valuations alongside
an interface to help you identify targets, or acquirers, and value companies. M&A Research Catalyst provides M&A-tailored information in an easy-to-
interpret report, including: financials; earnings estimates; news and deals; comparable companies and deals; DCF valuation; and valuation multiples.
Register for a free trial of our products

Zephyr Half Year M&A Report
© 2019 Moody’s Corporation, Moody’s Investors Service, Inc., Moody’s Analytics, Inc. and/or their licensors and affiliates including the Bureau van Dijk entities (collectively, “MOODY’S”). All rights reserved.
All information contained herein is obtained by MOODY’S from sources believed by it to be accurate and reliable. Because of the possibility of human or mechanical error as well as other factors, however, all information contained herein is provided “AS IS” without warranty of any kind. MOODY’S adopts all necessary measures so that the information it uses in assigning a credit rating is of sufficient quality and from sources MOODY’S considers to be reliable including, when appropriate, independent third-party sources. However, MOODY’S is not an auditor and cannot in every instance independently verify or validate information received in the rating process or in preparing the Moody’s publications.
To the extent permitted by law, MOODY’S and its directors, officers, employees, agents, representatives, licensors and suppliers disclaim liability to any person or entity for any indirect, special, consequential, or incidental losses or damages whatsoever arising from or in connection with the information contained herein or the use of or inability to use any such information, even if MOODY’S or any of its directors, officers, employees, agents, representatives, licensors or suppliers is advised in advance of the possibility of such losses or damages, including but not limited to: (a) any loss of present or prospective profits or (b) any loss or damage arising where the relevant financial instrument is not the subject of a particular credit rating assigned by MOODY’S.
To the extent permitted by law, MOODY’S and its directors, officers, employees, agents, representatives, licensors and suppliers disclaim liability for any direct or compensatory losses or damages caused to any person or entity, including but not limited to by any negligence (but excluding fraud, willful misconduct or any other type of liability that, for the avoidance of doubt, by law cannot be excluded) on the part of, or any contingency within or beyond the control of, MOODY’S or any of its directors, officers, employees, agents, representatives, licensors or suppliers, arising from or in connection with the information contained herein or the use of or inability to use any such information.
NO WARRANTY, EXPRESS OR IMPLIED, AS TO THE ACCURACY, TIMELINESS, COMPLETENESS, MERCHANTABILITY OR FITNESS FOR ANY PARTICULAR PURPOSE OF ANY SUCH RATING OR OTHER OPINION OR INFORMATION IS GIVEN OR MADE BY MOODY’S IN ANY FORM OR MANNER WHATSOEVER.